

Abstract
The effect of mutations in individual proteins on protein homeostasis, or “proteostasis,” can in principle depend on the mutations' effects on the thermodynamics or kinetics of folding, or both. Here, we explore this issue using a computational model of in vivo protein folding that we call FoldEcoSlim. Our model predicts that kinetic versus thermodynamic control of mutational effects on proteostasis hinges on the relationship between how fast a protein's folding reaction reaches equilibrium and a critical time scale that characterizes the lifetime of a protein in its environment: for rapidly dividing bacteria, this time scale is that of cell division; for proteins that are produced in heterologous expression systems, this time scale is the amount of time before the protein is harvested; for proteins that are synthesized in and then exported from the eukaryotic endoplasmic reticulum, this time scale is that of protein secretion, and so forth. This prediction was validated experimentally by examining the expression yields of the wild type and several destabilized mutants of a model protein, the mouse ortholog of cellular retinoic acid‐binding protein 1.
Keywords: protein folding, kinetics, thermodynamics, aggregation, degradation, mutation, protein homeostasis, proteostasis, loss‐of‐function disease
Introduction
Protein homeostasis, or proteostasis, is the condition of an organism maintaining sufficient natively folded protein to carry out its essential functions while minimizing protein misfolding/aggregation and the toxic species generated by these processes.1, 2, 3 Proteostasis can be challenged by environmental conditions that destabilize the native state, like heat or oxidative stress. The effects of such conditions can be mitigated by the activation of stress‐responsive signaling pathways that upregulate the expression of the components of the proteostasis network (the chaperones, proteases, and other factors that manage in vivo protein folding).4, 5 Proteostasis can also be challenged by mutations, although such a challenge is fundamentally different. Mutations affect specific proteins, whereas environmental stresses affect the entire proteome. As a result, the burden on the proteostasis network from a mutation that destabilizes an individual protein is likely to be small and may not provoke a corrective stress response. Nevertheless, such failures of proteostasis for individual mutated proteins are the root causes of many human diseases because they can lead to catastrophic losses of function and/or toxicity from protein aggregates.2, 6, 7
The effect of a mutation on proteostasis can be difficult to gauge. Biological systems must tolerate mutations, even when they negatively impact protein folding, to evolve proteins with improved or new functions. However, mutations that are too costly in terms of protein folding energetics can be lethal, especially when the mutation is in a protein with an essential function. Herein we explore what factors determine the effect of a mutation on proteostasis for a given protein in a given proteostasis environment. In other words, we address the questions: “how do the mutation‐induced changes in folding energy landscapes read through to proteostasis?” and “what are the differential contributions of folding kinetics and thermodynamics?.” In any question about whether a process is controlled by kinetics or thermodynamics, the time scale is a crucial issue.8, 9, 10 We thus began our work with the hypothesis that the relative contributions of folding kinetics and thermodynamics to proteostasis for a given protein are governed by the relationship between some aspect of the folding kinetics and a critical time scale that is characteristic of the protein's lifetime in its folding environment and therefore varies from case to case. For example, for populations of growing and dividing cells, the critical time scale is most likely to be that of cell division. For overexpression systems, the critical time scale is the length of time allowed before cells are harvested. For proteins that are secreted from a cell or organelle, the critical time scale is the time required for secretion.
We explored the hypothesis stated above using a version of our mathematical model for proteostasis in Escherichia coli called FoldEco11, 12 that has been modified to simplify chaperone and folding mechanisms while adding features—like population growth, a dynamic protein folding stress response, and a description of the background proteome (including rate constants for aggregation derived from measurements of protein solubility13 which, to our knowledge, are not available elsewhere in the literature)—that are essential for understanding the interplay between protein folding energetics and organismal fitness. Analysis of our model enables us to refine our hypothesis, and specifically identifies the unfolding rate as the aspect of protein folding kinetics whose relationship with the critical time scale determines kinetic versus thermodynamic control of proteostasis. We test this computational prediction experimentally by examining the dependence on folding energetics of expression yields of several variants of the mouse ortholog of the protein cellular retinoic acid‐binding protein 1 (MmCRABP1) when they are expressed in E. coli. Finally, we discuss the implications of our findings in the broader context of proteostasis.
Results
FoldEcoSlim: A simplified yet expanded model for proteostasis in E. coli
FoldEco contains detailed representations of protein folding/aggregation and chaperone mechanisms.12 This approach has the advantage that model parameters generated by fits to experimental data can accurately reflect true microscopic rate constants. However, such detailed models require parameters that may be difficult to measure. This problem is especially severe for the protein folding/aggregation component of the model, since it requires separate measurements of monomer misfolding and aggregation energetics for each protein of interest. Such measurements are cumbersome enough when performed for a single protein, much less the entire background proteome. Thus, we have chosen here to use a version of FoldEco, which we term “FoldEcoSlim,” in which we have simplified both the chaperoning and folding/aggregation mechanisms [Fig. 1(a)]. In FoldEcoSlim, protein is synthesized in a one‐step process that yields unfolded protein (Ui; the state labels are subscripted to indicate that the model tracks multiple proteins). The folding mechanism consists of reversible folding to the native state (Ni) and a one‐step process that combines misfolding and aggregation to yield protein in a state (Ai) that cannot spontaneously revert to the unfolded state. The latter process reflects cases in which protein aggregation is strongly favored but rate‐limited by a unimolecular misfolding step. This approximation provides the enormous benefit that a protein's overall tendency to “misbehave” can be summarized by a single parameter. Furthermore, we will show below how this parameter can be estimated on a proteomic scale using extant experimental datasets.
Figure 1.
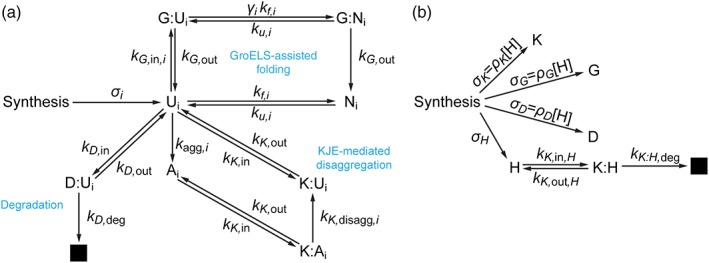
The reaction network for FoldEcoSlim. (a) Proteostasis for the general proteome. Capital letters represent species as follows: Ui, Ni, and Ai are the unfolded, natively folded, and misfolded/aggregated state of protein i; G, K, and D represent the machinery of the GroEL/GroES, DnaK/DnaJ/GrpE and degradation systems; species with two letters separated by a colon indicate a complex between the two species in question. For example, K:Ui is the unfolded state of protein i bound to the DnaK/DnaJ/GrpE machinery. The black box represents degraded protein. This scheme is repeated in the model for each protein (or cluster of proteins) that is being individually tracked. Thus, for our coarse‐grained proteome that is separated into 16 clusters, this scheme would be repeated 16 times. Lowercase “k's” represent rate constants as follows: k f,i, k u,i, and k agg,i are the unimolecular rate constants for the folding, unfolding, and misfolding/aggregation of protein i; k K,in, k G,in,i, and k D,in are the bimolecular rate constants for protein entering the DnaK/DnaJ/GrpE, GroEL/GroES, or degradation systems; k K,out, k G,out, and k D,out are the unimolecular rate constants for protein exiting the DnaK/DnaJ/GrpE, GroEL/GroES, or degradation systems. k D,deg is the rate constant for degradation of protein in the degradation system. k K,disagg,i is the rate constant for disaggregation of misfolded/aggregated protein bound within the DnaK/DnaJ/GrpE system. The parameter γ i accounts for any acceleration of folding in the GroEL cavity relative to its rate in bulk solution. The parameter σ i represents the synthesis rate of protein i. Parameters with an “i” in the subscript vary from protein to protein. Those without are protein‐independent. (b) Synthesis of proteostasis network components, which is required to account for dilution by cell population growth. H represents the heat shock transcription factor, which controls the synthesis rates of K, G, and D. The parameters σ K, σ G, σ D, and σ H represent the synthesis rates of K, G, D, and H. The synthesis rates of K, G, and D are proportional to the concentration of H with proportionality constants ρ K, ρ G, and ρ D. This interdependence of synthesis rates provides feedback control of the proteostasis network component concentrations.
We have found that the full representations of the chaperone mechanisms used in FoldEco, while illuminating,11, 12, 14, 15, 16 are not always necessary to understand how these systems affect the in vivo fate of proteins. The crucial aspects of the chaperone systems are the “input state” (i.e., the state to which they bind; usually the unfolded, misfolded, or aggregated state), the “output state” (i.e., the state that they release; usually the unfolded or the native state), and the rate of turnover of the chaperone cycle. With this in mind, two chaperoning processes were included in FoldEcoSlim [Fig. 1(a)]. The first is based on the GroEL/GroES system,17 in which an unfolded monomeric substrate is recognized by the tetradecameric, cavity‐containing chaperone GroEL, and then encapsulated when the GroES lid binds to the complex. While in the cavity the protein can fold (perhaps with an enhanced rate,18 although not necessarily19), but whether it folds or not, it is released with a timing that corresponds to the ATP binding and hydrolysis cycle of GroEL. In FoldEcoSlim, the GroEL/GroES system is simplified to one component (G) which binds to an unfolded protein to form a complex (G:Ui). The bound protein can then fold to yield a complex with the native state (G:Ni). The unfolded or native forms of the protein are then released with the same rate constants.
The second chaperone system is based on the DnaK/DnaJ/GrpE system,20, 21, 22 in which unfolded, misfolded, or aggregated protein is bound by DnaJ (or the ATP‐bound form of DnaK). This binary complex then recruits the ATP‐bound form of DnaK (or DnaJ) to form a ternary complex. DnaJ catalyzes ATP hydrolysis by DnaK, causing it to clamp down on its substrate in a way that promotes reversion of the substrate to the unfolded state.23, 24, 25, 26, 27 GrpE then binds to DnaK, causing it to release ADP. This event is followed by ATP binding to DnaK, which causes substrate release. In FoldEcoSlim, the DnaK/DnaJ/GrpE system is simplified to a single component (K), which can bind to unfolded or aggregated protein (to yield K:Ui or K:Ai, respectively). While bound, aggregated substrates can be converted to the unfolded state (i.e., K:Ai can be converted to K:Ui), in a process that competes with substrate release.
Finally, we treat the degradation of unfolded proteins by proteases like Lon (denoted D in the model) as a Michaelis–Menten enzymatic process, in which unfolded protein is bound by protease to yield an enzyme‐substrate complex (D:Ui). Degradation then yields free protease and irreversibly eliminates the substrate from the system. We do not account for the degradation of native substrates or aggregates, although we note that the latter is an important means for the disposal of aggregates via autophagy in eukaryotes.28
FoldEcoSlim is simpler than FoldEco in the ways described above; however, it also contains some features that FoldEco does not have that are important for understanding proteostasis. Following Santra and co‐workers,14 FoldEcoSlim accounts for cell population growth by adding a term −λ[X] to the rate equation for each species X, where λ is the rate constant for population growth and [X] is the concentration of X. This term represents the dilution of all species by the increase in total cell volume (i.e., the sum of the volumes of all cells; the average volume of individual cells does not change as the population grows) due to population growth. It is important to note that the proteostasis network components, like the proteome in general, are diluted by cell growth, and must therefore be synthesized actively to maintain their concentrations [Fig. 1(b)].
FoldEcoSlim also includes a dynamic response to the accumulation of non‐native protein [Fig. 1(b)]. We follow El‐Samad et al.29 by modeling the synthesis rate of chaperones as being proportional to the concentration of the unbound form of a transcription factor (H; representing rpoH/σ32 in E. coli). The concentration of H is low under normal circumstances because it is bound by DnaK (forming the complex K:H) and delivered to the protease FtsH for degradation.30 Thus, in this model, increases in non‐native protein concentrations drive down the concentration of DnaK that is available to bind to H, which increases the concentration of H and therefore the synthesis rate of DnaK, GroEL, and proteases. This results in an increased concentration of DnaK, which then binds to excess H, creating a negative feedback loop. The system eventually reaches a new steady state with an upregulated proteostasis network that is better suited to handling the protein‐folding burden.
Finally, FoldEcoSlim incorporates the background proteome, which to a great extent determines the proteostasis environment in which a protein of interest must fold. Our treatment of the background proteome is described in detail in the Supporting Information. Briefly, we used proteome‐wide measurements of protein abundances,31 stabilities,32, 33 aggregation propensities,13 responsiveness toward chaperoning by DnaK/DnaJ/GrpE and GroEL/GroES34 along with calculated values of protein folding rates based on protein structures35, 36, 37, 38, 39 to obtain parameter estimates for 640 proteins, which constitute 37% of the proteome by mass, easily enough to be representative of the proteome as a whole.
Individually tracking each of the 640 proteins for which full parameter sets were available would be excessively computationally expensive, even in a relatively simple model like FoldEcoSlim. We therefore coarse‐grained the proteome by clustering the proteins into 16 groups based on the similarities between their parameters. The clusters were assigned the abundance‐weighted mean parameters of their members. One cluster (cluster 16) was set aside to contain the obligate GroEL substrates, as defined by Fujiwara and co‐workers.40 The resulting proteome produced an unrealistically high amount of protein aggregation (~12% of the proteome). However, there are chaperone systems in E. coli that suppress aggregation in vivo that are not included in FoldEcoSlim (e.g., ClpB41 and IbpA/IbpB42). In addition, it is possible that the cytosolic environment is more solubilizing for proteins than the environment of the in vitro translation system in which the solubilities were originally measured. To account for these factors, we found that a decrease in the aggregation rate constants (by a factor of about 7) and an increase in the efficiencies of the DnaK/DnaJ/GrpE cycle (by a factor of about 3) across the proteome mitigated the excessive aggregation that we observed (see below). The final protein‐dependent parameters for the protein clusters are displayed in Figure 2 and are listed in Table S1. The un‐adjusted parameters for individual proteins are listed in Table S2.
Figure 2.
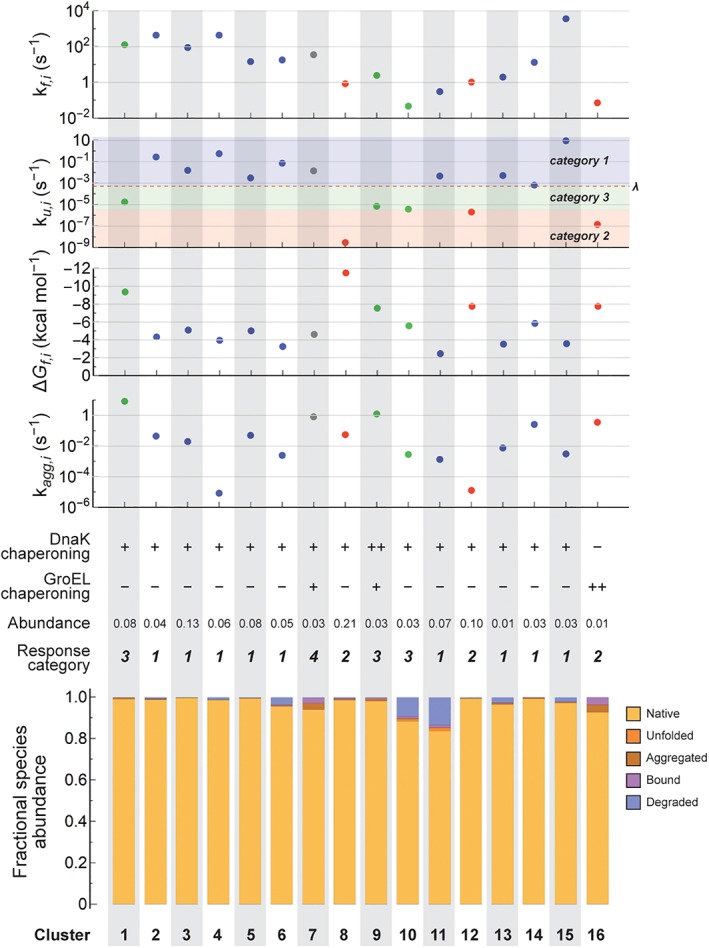
Parameters and in vivo protein folding fates of the clusters that make up our coarse‐grained proteome. The top four plots show the values of k f,i, k u,i, ΔG f,i, and k agg,i. Note the logarithmic scales for k f,i, k u,i, and k agg,I and the inverted scale for ΔG f,i. The cell division rate (λ) and mutation response categories are indicated in the plot for k u,i (see text). Data points are also colored by mutation response category: blue for Category 1, red for Category 2, green for Category 3, and gray for Category 4. Below the plots are qualitative indications of the responsiveness toward chaperoning by DnaK/DnaJ/GrpE and GroEL/GroES systems (++: excellent substrate; +: good substrate; −: poor substrate), the mutation response category, and the fractional proteomic abundances of each cluster. The bottom bar chart shows the fractional occupancy for each cluster of the natively folded (Ni), unfolded (Ui), aggregated (Ai + K:Ai), chaperone bound (K:Ui + G:Ui + G:Ni + D:Ui), and degraded states for E. coli under fast growth conditions (λ = 0.00053 s−1, corresponding to a doubling time of about 20 min).
Behavior of the background proteome in FoldEcoSlim
We ran FoldEcoSlim with the coarse‐grained background proteome described above and a growth rate constant of λ = 0.00053 s−1, corresponding to a doubling time of about 20 min for E. coli in Luria‐Bertani (LB) media as reported by Schmidt and co‐workers.31 Assuming a total protein concentration of 7.5 mM (based on a protein mass concentration of 200 g L−1 in the cytoplasm43 and an abundance‐weighted average molar mass calculated to be 26,500 g mol−1 using the data of Schmidt and co‐workers31), the overall protein synthesis rate has to be about 4 μM s−1, which is divided among the protein clusters according to their fractional abundances. The binding of H by DnaK (k K,in,H and k K,out,H), the turnover rate of H from the K:H complex (k K:H,deg), and the proportionality constant between the concentration of H and the synthesis rates of K, G and D (ρ K, ρ G, and ρ D) were then adjusted to ensure that the concentrations of K, G, and D were roughly equal to the measured values for DnaK and GroEL (using their reported copy numbers31 and a cell volume of 4.4 fL for E. coli growing in LB media44; see the Supporting Information). For DnaK the steady‐state concentration in FoldEcoSlim was ~30 μM; for GroEL it was ~34 μM, but GroEL is a tetradecamer with two cavities that operate sequentially, so the effective concentration of functional GroEL particles was 2.4 μM. For proteases, the target concentration was taken to be twice the concentration of hexameric Lon protease, since Lon has been shown to be responsible for degrading about 50% of misfolded protein in E. coli.45, 46 The concentration of D was therefore adjusted to ~0.5 μM. The values of k D,in, k D,out, and k D,deg (which were taken to be substrate independent) were then adjusted to match the observation that between 3% and 5% of the proteome is turned over per hour by degradation in E. coli.47, 48
At steady state in this simulation, the vast majority of protein in most of the clusters achieved the native state (gold bars in Fig. 2, bottom). In two of the clusters—those with the slowest folding (cluster 10) or least stable (cluster 11) proteins—there were notably higher levels of degradation (~9% and ~13%, respectively; blue bars in Fig. 2, bottom). The amount of aggregation was minimal: 0.6% overall, 1/3 of which was chaperone bound (reddish‐brown bars in Fig. 2, bottom). Most of the chaperones were bound to substrates. For example, the concentrations of free K and G were 64 and 95 nM, respectively, corresponding to 0.2% and 4% of the total concentrations of these chaperones. Binding to K was dominated by unfolded proteins from clusters 10 and 11 (which is consistent with their having relatively high concentrations of the unfolded state) and aggregated protein from clusters 7 and 8 (cluster 7 because of its high propensity to aggregate; cluster 8 simply because of its high abundance). Binding to G was dominated by the proteins in clusters 7, 9, and 16, because these clusters contain the proteins that were found experimentally to be efficiently chaperoned by the GroEL/GroES system and therefore have the highest values of k G,in.34
The effects of mutations on protein fate
To probe our hypothesis that the relationship between protein folding kinetics and a critical time scale would dictate how protein folding energetics impact proteostasis, we explored how mutations affected proteostasis for proteins from the various clusters of our coarse‐grained proteome. We added virtual test proteins one at a time to the FoldEcoSlim simulations. These test proteins had expression levels of 7.5 μM, or 0.1% of the proteome, and initial folding and chaperoning parameters that matched those of each cluster in turn (this is a fairly high expression level, given that the median concentration of an individual protein is ~0.2 μM [see Table S2]; nevertheless, it is still a small fraction of the proteome). We considered mutations that affect only the folding energetics, which we will term “simple mutations.” We ignore, for now, “complex mutations,” which we define as mutations that also affect other parameters, like the misfolding/aggregation propensity or chaperone interactions. We then computationally “mutated” the test proteins by diminishing their folding equilibrium constants (K f) by up to ~1000‐fold. The effect of these mutations on the folding rate constant (k f,i)—which is often quantified by the φ‐value,49 where φ = Δln k f,i/Δln K f,i—was then assigned to account for between 0% and 100% of the effect of the mutation. (Mutations with φ‐values >1 or <0 are possible, but rare.50) Since K f,i = k f,i/k u,i, the former case, in which φ = 0, corresponds to situations where the effect of the mutation on K f,i is entirely due to an increase in k u,i, the unfolding rate. The latter case, in which φ = 1, corresponds to situations where the effect of the mutation on K f,i is entirely due to a decrease in k f,i. It is important to note here that the expression level of our test proteins is low enough that deleterious mutations do not provoke a substantial stress response, and therefore the composition of the proteostasis network will be roughly the same for all mutants.
We use the fraction of test protein that is natively folded at steady state (f N,i) to quantify the impact of a mutation on the test protein. This quantity is plotted as a function of Δln K f,i (x‐axis) and φ (y‐axis) in the contour plots in Figure 3. These plots can be separated into four “mutation response categories,” each representing a different way in which mutations can affect in vivo protein folding fate. The first, and largest, category contains clusters 2, 3, 4, 5, 6, 11, 13, 14, and 15, which together account for ~50% of the proteome. In each of these plots, the contours are vertical or nearly vertical, indicating that the effect of a mutation on f N,i for proteins from these clusters is essentially independent of φ. The value of f N,i for a mutation is almost entirely determined by its effect on protein folding thermodynamics (Δln K f,i).
Figure 3.
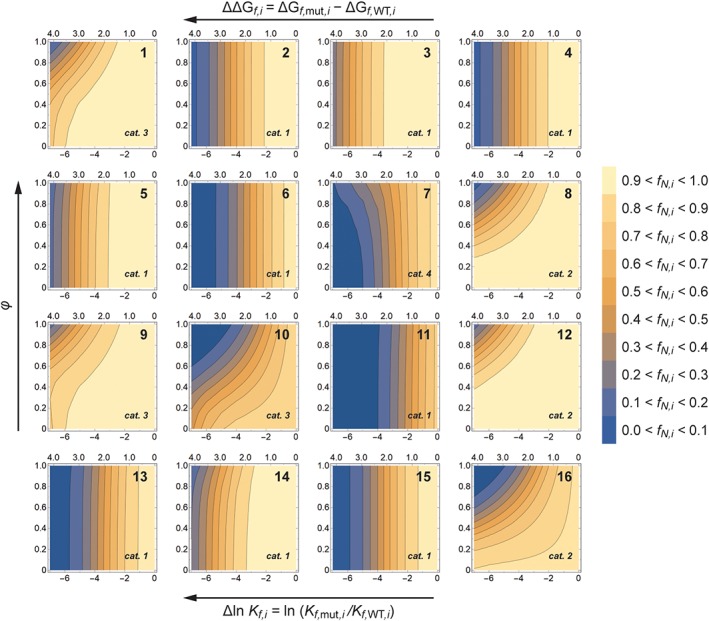
Contour plots showing the effects of mutations on proteostasis (as measured by f N,i, the fraction of protein in the native state at steady state) of test proteins derived from each cluster (cluster numbers are shown in the upper right of the contour plots). The thermodynamic effects of the mutations are measured on the x‐axis by the change in the folding equilibrium constant (Δ ln K f,I; note that the corresponding change in free energy is shown along the top of each plot). The kinetic effects of the mutations are measured by the ϕ‐value of the mutations (where ϕ = Δln k f,i/Δln K f,i). Recall that low ϕ‐values indicate mutations where destabilization is caused by an increased unfolding rate, while high ϕ‐values indicate mutations where destabilization is caused by a decreased folding rate. The mutation response categories for each cluster are noted in the lower right‐hand corners of the plots.
The second category contains clusters 8, 12, and 16, amounting to ~32% of the proteome. In the plots for these clusters, the contours are curved upward from left to right. At first glance, it appears that both thermodynamics (Δln K f,i) and kinetics (φ) independently contribute to the effect of mutations on proteins from these clusters. However, the contour lines in these plots closely follow the contour lines for constant Δln k f,i (=Δln K f,i × φ; see Fig. S1, which compares the f N,i and Δln k f,i contours for cluster 12 as an example). In other words, any given change in the protein folding rate constant will yield the same f N,i no matter how the protein folding equilibrium constant changes.
The third category contains clusters 1, 9, and 10 (~14% of the proteome), which exhibit a mixture of the behaviors of the first two categories. The contours for these clusters follow the contours for constant Δln k f,i in the upper left‐hand portion of the plots, which corresponds to highly destabilizing mutations (large negative Δln K f,i values) that are primarily due to slowing of the folding rate (φ‐values close to 1). For milder mutations, the contours are still curved but begin to approach verticality as Δln K f,i decreases in magnitude.
The final category contains cluster 7 (~3% of the proteome). The contour plot for this cluster is quite different from all the other clusters in that the contour lines are nearly vertical for mildly destabilizing mutations (Δln K f,i ≥ −2), but for more destabilizing mutations the contour lines curve to the left, such that f N,i actually increases as φ increases for a given value of Δln K f,i. In other words, it is advantageous—or at least less unfavorable—for moderate to strongly destabilizing mutations to be more driven by diminished folding rates than increased unfolding rates for proteins in cluster 7. This result is surprising, since slower folding is generally not associated with enhanced proteostasis.
It is worth noting at this point that the categories of responses to mutation seem to segregate according to the unfolding rate constant more than any other cluster parameter. This can be seen by examining Figure 2, where the ranges of values of k f,i, ΔG f,i, and k agg,i for the clusters in the various categories overlap with each other but the ranges of values of k u,i are distinct for Categories 1, 2, and 3. Moreover, it is interesting that the borderline between Categories 1 and 2 seems to be close to λ, the rate constant for cell division. This observation is consistent with our hypothesis that the relative contributions of folding kinetics and thermodynamics to proteostasis would be controlled by the relationship between folding kinetics (specifically, in this case, the rate of unfolding) and a critical time scale (in this case, the rate of cell division). We explore the root causes of the partitioning of the mutation responses into separate categories in the next section.
Analytical solutions for the steady state of FoldEcoSlim reveal how proteome clusters partition into mutation response categories
The rate equations for FoldEcoSlim (see Supporting Information) can be solved analytically for the steady‐state concentrations of all species as functions of the steady‐state concentrations of K, G, and D. These solutions enable us to write an expression akin to a “state sum” for the system. In a system at equilibrium, the state sum is a sum of the equilibrium constants between each state and a reference state. Growing organisms are never at equilibrium, so the pseudo‐state sum for a protein of interest “i” in FoldEcoSlim (Z ss,i) consists of the sum of the ratios of the steady‐state concentrations of each state to a reference state. We will call these ratios “steady state constants” and denote them with an appropriately subscripted letter Q. We choose the unfolded state as the reference state. The pseudo‐state sum for a protein of interest in FoldEcoSlim is:
| (1) |
where the steady state constant Q N,i represents the native state; Q A,i represents misfolded/aggregated states (including A and K:A); Q B,i represents states in which the protein of interest is bound to proteostasis network components (including K:Ui, G:Ui, G:Ni, and D:Ui); and Q D,i represents degraded protein. The values of these steady state constants in terms of the model parameters are as follows. For Q N,i:
| (2) |
Q N,i has two terms. The first depends only on the folding energy landscape (as represented by the folding and unfolding rate constants, k f,i and k u,i) and the rate constant for population growth (λ). The second term, which we will represent with “Γi,” accounts for the flux into the native state from the GroEL/GroES system. The parameter γ i accounts for the possibility that GroEL substrates can fold faster inside the GroEL cavity than in bulk solution; for such substrates γ i > 1, while for all others γ i = 1. For Q A,i:
| (3) |
Q A,i is the ratio of the aggregation rate constant to the sum of the rate constant for population growth (λ) and a term, which we will represent with “κ i,” that represents DnaK/DnaJ/GrpE‐mediated disaggregation. For Q B,i:
| (4) |
where the first term (including the rather lengthy factor in parenthesis) represents K:U, the second represents the sum G:U + G:N, and the third D:U. Finally, For Q D:
| (5) |
The fractional abundance of any state in FoldEcoSlim can be calculated as the ratio of that state's steady state constant to the pseudo‐state sum. The fraction native that is plotted in the contour plots in Figure 3, for example, is given by
| (6) |
Using the expressions for Q N,i and the other steady state constants, we can use Equation (6) to analyze the expected effects of mutations on proteostasis. Recall that Figure 3 shows the effects of simple mutations, that is, mutations that affect only the folding kinetics and thermodynamics, not the misfolding/aggregation propensity or chaperone interactions. The only steady state constant that contains folding parameters—and therefore the only one that changes in response to such mutations—is Q N,i, and so we focus on Q N,i in the following discussion.
For most proteins, excluding only those in the last of the above‐defined categories (those in cluster 7), the response of f N,i to mutations seen in Figure 3 can be explained by the behavior of the first term in Q N,i: k f,i/(k u,i + λ). In other words, it can be explained without appealing to effects from the proteostasis network. Importantly, this does not mean that the proteostasis network does not affect these proteins. It means instead that, since simple mutations do not affect aggregation or chaperone interactions, the proteostasis network does not determine the mutation response category. The mutation response category is determined by the shapes of the contours in Figure 3. The proteostasis network affects the positioning of the contours, but not their shapes.
The presence of k u,i and λ together in the denominator echoes the observation made in the preceding section that it is the relative magnitudes of these two quantities that seems to determine how proteome clusters segregate into different mutation response categories. In fact, there are two limiting cases for the quantity k f,i/(k u,i + λ) depending on the relative magnitudes of k u,i and λ; that is, depending on the relative rates of protein unfolding and cell division. In the first case, unfolding is much faster than cell division so that k u,i ≫ λ and k f,i/(k u,i + λ) ≈ k f,i/k u,i = K f,i (where K f,i is the equilibrium constant for protein folding). For proteins that meet this criterion, folding is fast enough to reach equilibrium on the time scale of cell division, so mutation response is effectively under thermodynamic control. The effect of a mutation on f N,i is determined by its effect on K f,i alone. Whether a mutation destabilizes a protein by decreasing k f,i (high φ‐value) or increasing k u,i (low φ‐value), the effect on proteostasis is the same. The proteins in Category 1 (those in clusters 2, 3, 4, 5, 6, 11, 13, 14, and 15) meet the criterion of k u,i being greater than λ (their k u,i values range from 0.00067 to 8.9 s−1, compared to 0.00053 s−1 for λ), which explains why the plots in Figure 3 for these clusters show that f N,i is largely independent of the φ‐value for a mutation.
In contrast, in the second limiting case protein unfolding is much slower than cell division (k u,i ≪ λ) and a negligible amount of protein unfolding occurs on the time scale of cell division. Once such a protein has folded, it will stay folded until long after the cell divides. As a result, Q N,i ≈ k f,i/λ, which has two consequences. First, it shows that proteins in fast‐growing organisms must fold faster than cell division to significantly populate the native state, as observed by Zou et al.39 If they do not, then Q N,i will be less than one and the fraction of natively folded protein (f N,i) will be extremely small. Second, mutations can only influence Q N,i if they alter the folding rate constant k f,i (i.e., if they have a nonzero φ‐value). Mutations that destabilize a protein purely by increasing k u,i, which is not an uncommon circumstance,50 leave Q N,i and therefore f N,i essentially unchanged. The proteins in Category 2 (those in clusters 8, 12, and 16) have k u,i values that are much smaller than λ (k u,i = 3.0 × 10⁻⁹, 2.1 × 10⁻⁶, and 1.5 × 10⁻⁷ s−1, respectively, vs. λ = 0.00053 s−1), as required for this behavior. The values of Q N,i for these clusters thus depend only on how a mutation changes k f,i, explaining why the contours in the plots in Figure 3 for these clusters follow the contours for constant Δln k f,i.
When k u,i is less than λ but not much so, the response of f N,i to mutation can depend on both folding kinetics and thermodynamics. This describes the proteins in clusters 1, 9, and 10, which are in Category 3. The k u,i values of these proteins (k u,i = 1.7 × 10⁻⁵, 7.0 × 10⁻⁶, and 3.7 × 10⁻⁶ s−1, respectively) are just large enough that they behave like Category 1 proteins in response to destabilizing mutations that primarily increase k u,i (low φ‐value) but they behave like Category 2 proteins for mutations that primarily decrease k f,i (high φ‐value).
Based on the preceding discussion, it is clear that our model predicts that the relationship between protein folding kinetics and a critical time scale determines whether the effects of mutations are under kinetic or thermodynamic control, as we hypothesized in the Introduction. In the case of growing cultures of E. coli, the relationship that determines mutation response categories is that between the unfolding rate constant (k u,i) and the population growth rate constant (λ). The relative magnitudes of these quantities determine whether a protein's folding is at equilibrium or not. If so, folding thermodynamics control the effects of mutations; if not, folding kinetics are in control.
It is important to note here that λ is the critical comparator for k u,i in fast‐growing E. coli because there are two processes that subtract from the concentration of natively folded protein. The first is simply the reverse of the folding process: the unfolding of native protein, which takes place with a rate constant of k u,i. The second is dilution of the native state by population growth. This process is a bit abstract, but it can be imagined as a Maxwell's Demon removing natively folded protein from the system and using it to populate the proteome of a newly formed cell. The Demon removes native protein with a rate constant of λ. Thus, the two negative terms in the rate equation for the native state are −k u,i[Ni] and −λ[Ni] (see Supporting Information). If there were another process by which natively folded proteins were removed from the system that was faster than cell growth, then the time scale of that process would become the critical comparator for the time scale of protein unfolding. This circumstance could arise in an environment like the endoplasmic reticulum of eukaryotes for proteins that are secreted from this organelle, for which the time scale of secretion would be the critical comparator. In addition, for proteins that are harvested at a given time point after being produced in an expression system like E. coli, BHK, or CHO cells, the critical comparator for the time scale of protein unfolding becomes the amount of time allowed for expression.
The effect of mutations on the clusters in Category 4 can only be understood in the context of the contributions of the GroEL/GroES system to proteostasis. Briefly, the effect of a mutation that diminishes the thermodynamic stability to a given extent is better mitigated by GroEL/GroES when protein folding is slow than when it is fast because the GroEL/GroES system cannot be effective if substrates fold faster than they bind to GroEL. We show in detail how this comes about in the Supporting Information. The DnaK/DnaJ/GrpE system and protein degradation systems do not affect which mutation response category the clusters fall into, although they of course are essential to proteostasis. We therefore discuss how each proteostasis network system contributes to in vivo folding outcomes in the Supporting Information rather than the main text.
An experimental test of the kinetic versus thermodynamic dichotomy in how mutations affect proteostasis
To experimentally test the prediction that for a given protein the effect of a mutation on proteostasis depends on the relationship between the time scale of protein unfolding and the time scale of a critical competing process, we determined the effects of mutations on the expression yields of the mouse ortholog of CRABP1 (MmCRABP1) expressed in E. coli. The folding of MmCRABP1 has been studied in detail.51, 52, 53, 54, 55, 56, 57, 58 It has been shown to fold via a three‐step pathway: a very rapid hydrophobic collapse, followed by a rearrangement to an aggregation‐resistant state with native‐like topology, and then a final annealing to the native state (here we ignore a low‐amplitude fourth phase due to proline isomerization53). To simplify this mechanism so that it fits into the folding scheme in FoldEcoSlim, we will collect the (aggregation‐prone) unfolded and hydrophobic collapse states together as the U “super‐state” and the (aggregation‐resistant) native‐like intermediate and native states together as the N super‐state. Thus, the effective folding rate constant will correspond closely to the rate of folding from the collapsed to the native‐like intermediate (k f,eff) while the effective unfolding rate constant will correspond to the rate of unfolding from the N super‐state to the collapsed intermediate (k u,eff; this effective rate is equal to the absolute rate of unfolding from the native‐like intermediate to the collapsed intermediate multiplied by the fraction of the protein in the N super‐state that is in the native‐like intermediate state; see the Supporting Information for more discussion).
To know which mutation response category MmCRABP1 falls into, we need to know what the critical comparator is and what its magnitude is relative to the unfolding rate constant. In our expression experiments, E. coli were induced to express a variant of MmCRABP1 that is His‐tagged and has a stabilizing R131Q mutation.53, 59 We will refer to this variant as “WT*.” Cells were harvested after 1, 2, and 3 h to measure the amount of soluble versus aggregated MmCRABP1 by quantitative western blotting. (The molar amounts of MmCRABP1 in the supernatant and pellet after cell lysis and centrifugation divided by the cell volume are the soluble and aggregated protein concentrations, respectively, while the total protein concentration is the sum of the soluble and aggregated protein concentrations.) Based on the slow approach to steady‐state concentrations, we surmised that cell division was very slow (doubling times ~5 h; data not shown). Thus, the critical comparator for the protein unfolding rates was the time scale of cell harvesting, or 3 h. WT* MmCRABP1 is a very stable protein (at 25°C, ΔG f,eff,WT* = −10 kcal mol−1; K f,eff,WT* = 2.2 × 10⁷), with moderately fast folding (k f,eff,WT* = 6.7 s−1) and very slow unfolding (k u,eff,WT* = 3.1 × 10⁻⁷ s−1).51 We performed the same experiment with several mutants of WT* MmCRABP1 that had varying degrees of destabilization (Table 1). In three of the four mutants studied, destabilization was almost entirely due to increased unfolding rates (M9A, V67A, and L118V). Only in the last case (Y133S) was there a substantial (20‐fold) decrease in the folding rate.51
Table 1.
Effective Folding Parameters for MmCRABP1 Variants
| MmCRABP1 variant | k f,eff (s−1) | k u,eff (s−1) | K f,eff (s−1) | ΔG f,eff (kcal mol−1) |
|---|---|---|---|---|
| WT* | 6.7 | 3.1 × 10⁻⁷ | 2.2 × 10⁷ | −10.0 |
| M9A | 1.5 | 1.4 × 10⁻⁶ | 1.0 × 10⁶ | −8.2 |
| V67A | 5.2 | 6.2 × 10⁻⁵ | 8.3 × 10⁴ | −6.7 |
| L118V | 1.8 | 4.1 × 10⁻⁶ | 4.5 × 10⁵ | −7.7 |
| Y133S | 0.40 | 6.1 × 10⁻⁵ | 6.5 × 10³ | −5.2 |
See Supporting Information for their sources.
Given the value of k u,eff,WT*, the half‐time for WT* MmCRABP1 unfolding is about 620 h. This is much greater than the time scale of this experiment (3 h). Even in the most destabilized mutants we studied, the half‐time for unfolding was still ~3 h. Thus, our a priori expectation based on the analysis above was that the effects of mutations in MmCRABP1 would be driven by folding kinetics. In other words, MmCRABP1 would be in mutation response Category 2.
The experimentally measured concentrations of total versus soluble WT* or mutant MmCRABP1 over the 3 h expression time courses are shown in Figure 4 (the concentration of aggregated protein is the difference between the total and soluble concentrations). We find that WT*, M9A, V67A, and L118V MmCRABP1, which all have folding rate constants >1 s−1 despite widely varying stabilities, behaved similarly in terms of the amount of total protein and the partitioning of this protein between the soluble and aggregated states at each time point. For example, after 3 h, the total MmCRABP1 concentration for these variants was between 260 and 290 μM and the fraction that was soluble (f sol) was only slightly lower for the mutants (between 0.82 and 0.85) than for WT* (0.91). In contrast, the Y133S mutant behaved much differently. The total protein concentration was lower (125 μM at 3 h) and a lower fraction was soluble (f sol,Y133S = 0.28), demonstrating that this mutant is vulnerable to both aggregation and degradation. To confirm that the lower total protein concentration of Y133S MmCRABP1 was due to degradation, we expressed WT* and Y133S MmCRABP1 in an E. coli strain lacking the gene for Lon. In these Δlon bacteria, the concentrations of WT* and Y133S MmCRABP1 were comparable over the expression time course, although Y133S still aggregated to a much greater extent; see Figure S2.
Figure 4.
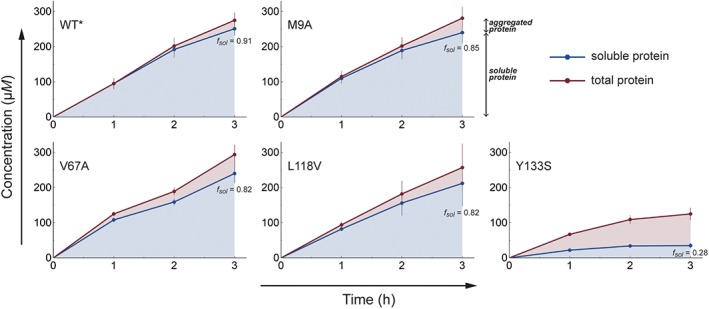
Time courses of expression of MmCRABP1 variants in E. coli. Red lines and data points: total MmCRABP1 concentrations per cell. Blue lines and data points: soluble MmCRABP1 concentrations per cell. The difference between the total and soluble protein concentrations is the aggregated protein concentration (red shaded area). The fractions of soluble protein at the 3 h time point for all variants are indicated on the plots. Error bars indicate the standard errors of the mean.
Y133S MmCRABP1 is both the slowest folding and the least stable of the MmCRABP1 variants studied herein, which leaves open the possibilities that its drastically compromised proteostasis is a consequence of its folding kinetics, its folding thermodynamics, or both. Some aggregation is observed even for WT* MmCRABP1, indicating that its in vivo folding must already be on the cusp of breaking down. Thus, if it were sensitive to thermodynamic destabilization, then any strongly thermodynamically destabilizing mutation would lead to less effective proteostasis. V67A is such a strongly destabilizing mutation (3.3 kcal mol−1) but the expression time course of V67A MmCRABP1 is similar to that of WT* in terms of both total protein concentration and the fraction that is soluble (Fig. 4). Importantly, the V67A mutation does not affect the folding rate constant. This result therefore strongly suggests that MmCRABP1 is not sensitive to thermodynamic destabilization per se, and furthermore that Y133S MmCRABP1 is so poorly behaved specifically because of its slow folding rate.
These results corroborate the hypothesis stated in the Introduction and refined using FoldEcoSlim: given that unfolding of MmCRABP1 variants is generally slower than the time scale on which the expression experiment is performed, proteostasis—here gauged by the partitioning of protein between soluble states (presumably dominated by natively folded protein) and aggregation/degradation—is primarily determined by how mutations affect the folding rate. These experiments therefore validate the FoldEcoSlim‐based analysis performed in the preceding sections.
Discussion
Using FoldEcoSlim, we have found that proteins can be categorized by whether the effects of mutations on their in vivo folding fates are driven by changes in the thermodynamics or the kinetics of folding. Because FoldEcoSlim is simple enough to analytically solve for the steady state, we were able to determine that this categorization depends on the relationship between the unfolding rate, defined by k u,i, and the time scale of a critical competing process, which we have termed the “critical comparator.” For growing bacteria, this critical comparator is the rate of cell division, defined by λ. Proteins for which k u,I ≫ λ can reach their folding equilibrium on the time scale of cell division, so the effect of a mutation on proteostasis depends entirely on how the mutation changes folding thermodynamics. It does not matter whether the mutation is destabilizing because the unfolding rate increases or the folding rate decreases; the outcome is the same either way. Proteins for which k u,i ≪ λ cannot reach their folding equilibrium on the time scale of cell division, instead reaching a steady state in which the fraction of natively folded protein is largely determined by the ratio k f,i/λ. Thus, mutations that destabilize a protein but do not affect k f,i have no effect on proteostasis. Again, we emphasize that whether the effects of mutations on f N,i are under thermodynamic or kinetic control is independent of the proteostasis network with few exceptions (the proteins in cluster 7 being a case in point). The proteostasis network tends to increase f N,i, but it does not usually change whether a protein's folding is under thermodynamic or kinetic control. The specific contributions of the various proteostasis network components—the DnaK/DnaJ/GrpE system, the GroEL/GroES system, and the degradation machinery—to proteostasis are discussed in detail in the Supporting Information.
These results provide a framework in which to understand the molecular evolution of proteins. For example, it has been observed that proteins' folding nuclei—that is, the set of residues with high φ‐values that form stabilizing interactions in both the transition and the native states—are not more highly conserved than other residues in a protein.60, 61 This finding is surprising, since one would expect a priori that any mutation that diminished the protein folding rate would face strong negative selection pressure. However, our analysis with FoldEcoSlim provides a potential explanation for this observation. Most of the proteins on which this assertion was based are relatively small, fast folding proteins.60 As noted above, such proteins should be able to reach their folding equilibrium on the time scale of cell division or any other likely critical comparator. Thus, the effects of mutations on proteostasis for such proteins should be driven by their thermodynamic consequences and essentially indifferent to whether the mutated residue is a part of the folding nucleus. Only slow folding proteins, which tend to be large and inconvenient for in vitro studies of folding mechanisms, should be expected to face selection pressure against mutations that slow down folding.
Our results, although obtained in the context of a model organism, also have implications for understanding the role of protein folding energetics in human protein misfolding diseases. We have shown that it is essential to identify the process against which the protein unfolding rate must be compared to understand a given protein's homeostasis. For example, the secretion rate (determined by the rate constant k sec,i) is the critical comparator for the unfolding rate for loss‐of‐function diseases like cystic fibrosis62 and Fabry's disease,63 which are caused by mutations in proteins that are secreted from the endoplasmic reticulum. Diseases caused by mutations in proteins for which k u,i ≫ k sec,i are diseases of protein folding thermodynamics and they can in principle be treated with therapies that stabilize the native state, like pharmacologic chaperoning with small molecule ligands.63, 64, 65 In contrast, diseases caused by mutations in proteins for which k u,i ≪ k sec,i are diseases of protein folding kinetics and are likely to be responsive only to therapies that somehow increase k f,i or that suppress competing pathways like degradation or aggregation. This outcome could be achieved by, for example, selectively activating certain elements of stress‐responsive signaling pathways.66, 67, 68
Finally, diseases caused by mutations in proteins for which k u,i is similar in magnitude to the critical comparator are expected to be edge cases. An example is transthyretin amyloidosis.69, 70, 71 Transthyretin, or TTR, is a tetrameric plasma protein that generally folds efficiently in, and is secreted from, the endoplasmic reticulum of hepatocytes.72 However, TTR can aggregate and form deposits in distal tissues like the peripheral nerves or the heart in an unfolding/misfolding process that is rate‐limited by tetramer dissociation.71 Thus, the processes whose time scales must be compared are tetramer dissociation (k diss,TTR) and TTR turnover in the blood (k turn,TTR). These rates are quite similar. Wild type TTR tetramer dissociation in blood plasma has a half‐life of 3.2 days (k diss,TTR = 2.5 × 10⁻⁶ s−1)73 while TTR turnover has a half‐life of 2.7 days (k turn,TTR = 3.0 × 10⁻⁶ s−1).74 TTR dissociation is prevented when one or both of its binding sites is occupied by a ligand, thereby diminishing the dissociation rate (quantified by the effective dissociation rate constant k diss,TTR,eff); such ligands are referred to as “kinetic stabilizers.”71, 75 Kinetic stabilizers can therefore be expected to improve TTR proteostasis up to the point that the effective dissociation rate constant, k diss,TTR,eff, becomes much less than k turn,TTR. Beyond this point, further increases in ligand concentration would not be expected to affect TTR proteostasis. This prediction is consistent with the results of a recent placebo‐controlled clinical trial of the TTR kinetic stabilizer tafamidis76, 77 for TTR amyloid cardiomyopathy.78 In this trial, patients received either placebo, 20 mg/day of tafamidis, or 80 mg/day of tafamidis. It was found that patients benefited significantly from treatment with tafamidis. However, the benefit was essentially the same at both doses, consistent with the expectation articulated above that the plasma concentration of tafamidis achieved at the 20 mg daily dose decreases k diss,TTR,eff to well below k turn,TTR, and that any further decrease in k diss,TTR,eff achieved with higher doses of tafamidis yield only marginal benefits. Higher tafamidis doses could, however, be beneficial for TTR mutants that have faster dissociation rates.
In conclusion, the preceding analysis of the role of protein folding energetics in determining proteostasis has yielded a framework for understanding the interplay of kinetic and thermodynamic effects on the outcome of protein folding reactions in vivo. This framework is extensible, at least qualitatively, beyond the simple model organism in which it was conceived. We hope that it can serve as a foundation on which larger‐scale models—for example, models for human protein misfolding diseases—can be built and understood.
Materials and Methods
Setting up and solving FoldEcoSlim
The rate equations that make up FoldEcoSlim can be derived from Figure 1. They are shown in the Supporting Information. Numerical solutions of FoldEcoSlim were obtained by using Mathematica 11.2 or 11.3 (Wolfram Research) on a Dell Precision T7500 Workstation running Windows 7 Professional (64 bit) with a 3.33 GHz Intel Xeon W5590 Quadcore CPU and 24 GB of RAM or a Maingear Quantum SHIFT Workstation running Windows 10 Professional (64 bit) with a 2.30 GHz Intel Xeon E5‐2697 v4 18‐core CPU and 128 GB of RAM.
Escherichia coli strains and plasmids
The E. coli strain K12 HMS174(DE3) (Novagen) was used as the background strain in all the experiments. These cells were the same as used in a previous work11 and therefore had a plasmid containing the DnaK/DnaJ/GrpE system (chloramphenicol resistant) under a pBAD promoter. The KJE system was not induced in these experiments; its expression was suppressed by adding 0.2% w/v d‐glucose, which represses the expression from the pBAD promoter. The E. coli Δlon K12 HMS174(DE3) strain used for control experiments, in which lon was deleted/replaced by a kanamycin‐resistant (KanR) cassette, was kindly provided by Jeffery W. Kelly (Scripps Research).
Our “wild type” model protein, MmCRABP1, is actually a variant of MmCRABP1 with an N‐terminal His10‐tag and an R131Q mutation to stabilize the protein.53, 59 Here, it is referred to as WT*. WT* was used as the template for the other MmCRABP1 variants (M9A, V67A, L118V, and Y133S).51 MmCRABP1 was inserted into the pET16b vector (ampicillin‐resistant) under a lac promoter. The sequence of WT* MmCRABP1 is:
HHHHHHHHHH MPNFAGTWKM RSSENFDELL KALGVNAMLR KVAVAAASKP HVEIRQDGDQ FYIKTSTTVR TTEINFKVGE GFEEETVDGR KCRSLPTWEN ENKIHCTQTL LEGDGPKTYW TRELANDELI LTFGADDVVC TQIYVRE
Protein expression in E. coli
Bacterial transformations with the pET16b plasmid (with MmCRABP1) were done on LB plates. Bacterial cultures were grown in LB with ampicillin (100 μg/mL) and chloramphenicol (34 μg mL−1) at 30°C until the OD600 was ~0.4. Glucose (0.2% w/v) was added to suppress DnaK/DnaJ/GrpE system expression. After 1 h, when the OD was ~0.7, MmCRABP1 expression was induced with 0.5 mM isopropyl β‐d‐1‐thiogalactopyranoside (IPTG) and allowed to continue for 1, 2, or 3 h. Cells were harvested by centrifugation for 15 min. Cells were lysed by resuspending with Bacterial Protein Extraction Reagent (BPER‐II) (ThermoFisher Scientific), lysozyme (0.05 mg/mL), and DNase I (1 μg/mL). Cell lysates were incubated at room temperature for ~15–30 min. A fraction of the lysate was transferred to one tube (this was to measure total protein concentration). An equal volume of the lysate was transferred to another tube, which was then centrifuged at 13,500g for 10 min at 4°C to partition the supernatant from the pellet. The supernatant was collected and used to measure the concentration of soluble MmCRABP1, while the pellet was used to measure the concentration of aggregated MmCRABP1. The pellet was resuspended with the same volume of buffer. Gel loading buffer was added to each sample. Samples were boiled for 10 min. Samples were loaded on a 15% glycine gel and were separated by electrophoresis on sodium dodecyl sulfate‐polyacrylamide gels (SDS‐PAGEs). Proteins were detected by Coomassie blue staining and imaged with the Odyssey Infrared Imaging System (Li‐COR Biosciences).
The WT* MmCRABP1 and Y133S MmCRABP1 were also expressed in Δlon cells to determine the typical protein expression in E. coli without degradation by Lon. Cells were grown in LB with ampicillin (100 μg/mL) at 30°C until the OD600 was ~0.7 (same OD600 as above). MmCRABP1 (WT* or Y133S) expression was induced with 0.5 mM IPTG for 0.5, 1, and 2 h. Another set of experiments with +Lon cells [K12 HMS174(DE3)] was run in parallel to compare folding fates in –Lon and +Lon cells.
Quantitative Coomassie blue staining and Western blotting
For the quantitation, known amounts of purified recombinant WT* MmCRABP1 were used as standards. These were loaded on the same gel where the samples of unknown amounts of MmCRABP1 from the expression experiments were loaded. Each volume of sample loaded corresponded to 108 cells, which is equivalent to 1 mL of bacteria with OD600 ~0.1.44 After running samples by SDS‐PAGE and staining with Coomassie Blue, they were imaged using Li‐COR. A standard curve was generated based on the known amounts of proteins, and the unknown amounts of MmCRABP1 from the expression experiments were determined by interpolation or extrapolation. The concentration of samples was calculated by dividing the amount of protein by the volume of cell cytoplasm. It is assumed that for E. coli grown in LB, the total cell volume is 2.9 μL per mL of cells per OD600 unit.44 Subtracting the periplasm, which is ~10% of the cell volume, the volume of cell cytoplasm is 2.6 μL per mL per OD600. The presence of MmCRABP1 in the samples and the location of its corresponding band in SDS‐PAGE gels were confirmed by western blotting. The primary antibody used was anti‐CRABP1 (Abcam, monoclonal, mouse, 1:5000). The secondary antibody was a Li‐COR anti‐mouse antibody (emission at 800 nm, from Li‐COR Biosciences).
The concentrations of total (Ti), soluble (Si), and aggregated (Ai) protein and the fractions of soluble (f s,i) and aggregated (f a,i) protein that existed after 1, 2, and 3 h were calculated as follows: [Ti] = [Si] + [Ai], f s,i = [Si]/[Ti], f a,i = [Ai]/[Ti]. Note that the calculated concentration for total protein was the sum of the concentrations of soluble and aggregated protein, and not the concentration of the total lysate lane run on the Coomassie stained gels or Western blots. The total lysate lane was a control to check for mass balance; the sum of soluble and aggregated relative to the total lysate should be close to the same. The mass balance was good in all samples; the difference between the total protein concentrations determined from the total lysate lane and determined from the sum of the soluble and aggregated concentrations was less than 20% in all cases.
Supporting information
Appendix S1: Supporting Information
Table S2 Protein‐dependent folding and chaperoning parameters for the proteome. This table is contained in the associated Excel file.
Acknowledgments
E.T.P. and L.M.G. thank the National Institutes of Health for supporting this work (R01 GM101644 to E.T.P. and L.M.G. and R35 GM118161 to L.M.G.). K.G. thanks the National Science Foundation for support (1149992) and the Knoebel Institute for Healthy Aging at the University of Denver.
Abbreviations: Ui, Ni, and Ai, unfolded, natively folded and misfolded/aggregated state of protein i; G, K, and D, machinery of the GroEL/GroES, DnaK/DnaJ/GrpE, and degradation systems; H, heat shock transcription factor; species with two letters separated by a colon indicate a complex between the two species in question (e.g., K:Ui is the unfolded state of protein i bound to the DnaK/DnaJ/GrpE machinery); k f,i, k u,i, and k agg,i, unimolecular rate constants for the folding, unfolding, and misfolding/aggregation of protein i; K f,i = k f,i/k u,i, protein folding equilibrium constant for protein i; k K,in, k G,in,i and k D,in, bimolecular rate constants for protein entering the DnaK/DnaJ/GrpE, GroEL/GroES, or degradation systems; k K,out, k G,out and k D,out, bimolecular rate constants for protein exiting the DnaK/DnaJ/GrpE, GroEL/GroES, or degradation systems; k D,deg, rate constant for degradation of protein in the degradation system; k K,disagg,i, rate constant for disaggregation of misfolded/aggregated protein bound within the DnaK/DnaJ/GrpE system; γ i, accounts for any acceleration of folding in the GroEL cavity relative to its rate in bulk solution; σ i, synthesis rate of protein i; σ K, σ G, σ D, and σ H, synthesis rates of K, G, D, and H; ρ K, ρ G, and ρ D, proportionality constants between the concentration of H and the synthesis rates of K, G, and D; Γi, contribution of the GroEL/GroES system to the folding of protein i; κ i, contribution of the DnaK/DnaJ/GrpE system to mitigating the aggregation of protein i.
Contributor Information
Lila M. Gierasch, Email: gierasch@biochem.umass.edu.
Evan T. Powers, Email: epowers@scripps.edu.
References
- 1. Balch WE, Morimoto RI, Dillin A, Kelly JW (2008) Adapting proteostasis for disease intervention. Science 319:916–919. [DOI] [PubMed] [Google Scholar]
- 2. Hipp MS, Park SH, Hartl FU (2014) Proteostasis impairment in protein‐misfolding and ‐aggregation diseases. Trends Cell Biol 24:506–514. [DOI] [PubMed] [Google Scholar]
- 3. Powers ET, Morimoto RI, Dillin A, Kelly JW, Balch WE (2009) Biological and chemical approaches to diseases of proteostasis deficiency. Annu Rev Biochem 78:959–991. [DOI] [PubMed] [Google Scholar]
- 4. Lindquist S (1986) The heat‐shock response. Annu Rev Biochem 55:1151–1191. [DOI] [PubMed] [Google Scholar]
- 5. Hetz C, Chevet E, Oakes SA (2015) Proteostasis control by the unfolded protein response. Nat Cell Biol 17:829–838. [DOI] [PMC free article] [PubMed] [Google Scholar]
- 6. Knowles TP, Vendruscolo M, Dobson CM (2014) The amyloid state and its association with protein misfolding diseases. Nat Rev Mol Cell Biol 15:384–396. [DOI] [PubMed] [Google Scholar]
- 7. Winklhofer KF, Tatzelt J, Haass C (2008) The two faces of protein misfolding: gain‐ and loss‐of‐function in neurodegenerative diseases. EMBO J 27:336–349. [DOI] [PMC free article] [PubMed] [Google Scholar]
- 8. Caravaca M, Sanchez‐Andrada P, Soto A, Alajarin M (2014) The network simulation method: a useful tool for locating the kinetic‐thermodynamic switching point in complex kinetic schemes. Phys Chem Chem Phys 16:25409–25420. [DOI] [PubMed] [Google Scholar]
- 9. Rohwer JM, Hofmeyr JH (2010) Kinetic and thermodynamic aspects of enzyme control and regulation. J Phys Chem B 114:16280–16289. [DOI] [PubMed] [Google Scholar]
- 10. Rolleston FS (1972) A theoretical background to the use of measured concentrations of intermediates in study of the control of intermediary metabolism. Curr Top Cell Reg 5:47–75. [Google Scholar]
- 11. Cho Y, Zhang X, Pobre KF, Liu Y, Powers DL, Kelly JW, Gierasch LM, Powers ET (2015) Individual and collective contributions of chaperoning and degradation to protein homeostasis in E. coli . Cell Rep 11:321–333. [DOI] [PMC free article] [PubMed] [Google Scholar]
- 12. Powers ET, Powers DL, Gierasch LM (2012) FoldEco: a model for proteostasis in E. coli . Cell Rep 1:265–276. [DOI] [PMC free article] [PubMed] [Google Scholar]
- 13. Niwa T, Ying BW, Saito K, Jin W, Takada S, Ueda T, Taguchi H (2009) Bimodal protein solubility distribution revealed by an aggregation analysis of the entire ensemble of Escherichia coli proteins. Proc Natl Acad Sci U S A 106:4201–4206. [DOI] [PMC free article] [PubMed] [Google Scholar]
- 14. Santra M, Farrell DW, Dill KA (2017) Bacterial proteostasis balances energy and chaperone utilization efficiently. Proc Natl Acad Sci U S A 114:E2654–E2661. [DOI] [PMC free article] [PubMed] [Google Scholar]
- 15. Dickson A, Brooks CL 3rd (2013) Quantifying chaperone‐mediated transitions in the proteostasis network of E. coli . PLoS Comput Biol 9:e1003324. [DOI] [PMC free article] [PubMed] [Google Scholar]
- 16. Santra M, Dill KA, de Graff AMR (2018) How do chaperones protect a cell's proteins from oxidative damage? Cell Syst 6:743–751. [DOI] [PubMed] [Google Scholar]
- 17. Horwich AL, Fenton WA (2009) Chaperonin‐mediated protein folding: using a central cavity to kinetically assist polypeptide chain folding. Q Rev Biophys 42:83–116. [DOI] [PubMed] [Google Scholar]
- 18. Georgescauld F, Popova K, Gupta AJ, Bracher A, Engen JR, Hayer‐Hartl M, Hartl FU (2014) GroEL/ES chaperonin modulates the mechanism and accelerates the rate of TIM‐barrel domain folding. Cell 157:922–934. [DOI] [PMC free article] [PubMed] [Google Scholar]
- 19. Apetri AC, Horwich AL (2008) Chaperonin chamber accelerates protein folding through passive action of preventing aggregation. Proc Natl Acad Sci U S A 105:17351–17355. [DOI] [PMC free article] [PubMed] [Google Scholar]
- 20. Mayer MP (2013) Hsp70 chaperone dynamics and molecular mechanism. Trends Biochem Sci 38:507–514. [DOI] [PubMed] [Google Scholar]
- 21. Clerico EM, Tilitsky JM, Meng W, Gierasch LM (2015) How hsp70 molecular machines interact with their substrates to mediate diverse physiological functions. J Mol Biol 427:1575–1588. [DOI] [PMC free article] [PubMed] [Google Scholar]
- 22. Mayer MP, Gierasch LM (2019) Recent advances in the structural and mechanistic aspects of Hsp70 molecular chaperones. J Biol Chem 294:2085–2097. [DOI] [PMC free article] [PubMed] [Google Scholar]
- 23. Sharma SK, De los Rios P, Christen P, Lustig A, Goloubinoff P (2010) The kinetic parameters and energy cost of the Hsp70 chaperone as a polypeptide unfoldase. Nat Chem Biol 6:914–920. [DOI] [PubMed] [Google Scholar]
- 24. Sekhar A, Rosenzweig R, Bouvignies G, Kay LE (2015) Mapping the conformation of a client protein through the Hsp70 functional cycle. Proc Natl Acad Sci U S A 112:10395–10400. [DOI] [PMC free article] [PubMed] [Google Scholar]
- 25. Sekhar A, Rosenzweig R, Bouvignies G, Kay LE (2016) Hsp70 biases the folding pathways of client proteins. Proc Natl Acad Sci U S A 113:E2794–E2801. [DOI] [PMC free article] [PubMed] [Google Scholar]
- 26. Mattoo RU, Goloubinoff P (2014) Molecular chaperones are nanomachines that catalytically unfold misfolded and alternatively folded proteins. Cell Mol Life Sci 71:3311–3325. [DOI] [PMC free article] [PubMed] [Google Scholar]
- 27. Kellner R, Hofmann H, Barducci A, Wunderlich B, Nettels D, Schuler B (2014) Single‐molecule spectroscopy reveals chaperone‐mediated expansion of substrate protein. Proc Natl Acad Sci U S A 111:13355–13360. [DOI] [PMC free article] [PubMed] [Google Scholar]
- 28. Mizushima N, Komatsu M (2011) Autophagy: renovation of cells and tissues. Cell 147:728–741. [DOI] [PubMed] [Google Scholar]
- 29. El‐Samad H, Kurata H, Doyle JC, Gross CA, Khammash M (2005) Surviving heat shock: control strategies for robustness and performance. Proc Natl Acad Sci U S A 102:2736–2741. [DOI] [PMC free article] [PubMed] [Google Scholar]
- 30. Guisbert E, Yura T, Rhodius VA, Gross CA (2008) Convergence of molecular, modeling, and systems approaches for an understanding of the Escherichia coli heat shock response. Microbiol Mol Biol Rev 72:545–554. [DOI] [PMC free article] [PubMed] [Google Scholar]
- 31. Schmidt A, Kochanowski K, Vedelaar S, Ahrne E, Volkmer B, Callipo L, Knoops K, Bauer M, Aebersold R, Heinemann M (2016) The quantitative and condition‐dependent Escherichia coli proteome. Nat Biotechnol 34:104–110. [DOI] [PMC free article] [PubMed] [Google Scholar]
- 32. Leuenberger P, Ganscha S, Kahraman A, Cappelletti V, Boersema PJ, von Mering C, Claassen M, Picotti P (2017) Cell‐wide analysis of protein thermal unfolding reveals determinants of thermostability. Science 355:eaac7825. [DOI] [PubMed] [Google Scholar]
- 33. Mateus A, Bobonis J, Kurzawa N, Stein F, Helm D, Hevler J, Typas A, Savitski MM (2018) Thermal proteome profiling in bacteria: probing protein state in vivo. Mol Syst Biol 14:e8242. [DOI] [PMC free article] [PubMed] [Google Scholar]
- 34. Niwa T, Kanamori T, Ueda T, Taguchi H (2012) Global analysis of chaperone effects using a reconstituted cell‐free translation system. Proc Natl Acad Sci U S A 109:8937–8942. [DOI] [PMC free article] [PubMed] [Google Scholar]
- 35. Ivankov DN, Garbuzynskiy SO, Alm E, Plaxco KW, Baker D, Finkelstein AV (2003) Contact order revisited: influence of protein size on the folding rate. Protein Sci 12:2057–2062. [DOI] [PMC free article] [PubMed] [Google Scholar]
- 36. Ouyang Z, Liang J (2008) Predicting protein folding rates from geometric contact and amino acid sequence. Protein Sci 17:1256–1263. [DOI] [PMC free article] [PubMed] [Google Scholar]
- 37. Plaxco KW, Simons KT, Baker D (1998) Contact order, transition state placement and the refolding rates of single domain proteins. J Mol Biol 277:985–994. [DOI] [PubMed] [Google Scholar]
- 38. Rustad M, Ghosh K (2012) Why and how does native topology dictate the folding speed of a protein? J Chem Phys 137:205104. [DOI] [PubMed] [Google Scholar]
- 39. Zou T, Williams N, Ozkan SB, Ghosh K (2014) Proteome folding kinetics is limited by protein halflife. PLoS One 9:e112701. [DOI] [PMC free article] [PubMed] [Google Scholar]
- 40. Fujiwara K, Ishihama Y, Nakahigashi K, Soga T, Taguchi H (2010) A systematic survey of in vivo obligate chaperonin‐dependent substrates. EMBO J 29:1552–1564. [DOI] [PMC free article] [PubMed] [Google Scholar]
- 41. Doyle SM, Genest O, Wickner S (2013) Protein rescue from aggregates by powerful molecular chaperone machines. Nat Rev Mol Cell Biol 14:617–629. [DOI] [PubMed] [Google Scholar]
- 42. Matuszewska M, Kuczynska‐Wisnik D, Laskowska E, Liberek K (2005) The small heat shock protein IbpA of Escherichia coli cooperates with IbpB in stabilization of thermally aggregated proteins in a disaggregation competent state. J Biol Chem 280:12292–12298. [DOI] [PubMed] [Google Scholar]
- 43. Cayley S, Lewis BA, Guttman HJ, Record MT Jr (1991) Characterization of the cytoplasm of Escherichia coli K‐12 as a function of external osmolarity. Implications for protein‐DNA interactions in vivo. J Mol Biol 222:281–300. [DOI] [PubMed] [Google Scholar]
- 44. Volkmer B, Heinemann M (2011) Condition‐dependent cell volume and concentration of Escherichia coli to facilitate data conversion for systems biology modeling. PLoS One 6:e23126. [DOI] [PMC free article] [PubMed] [Google Scholar]
- 45. Chung CH, Goldberg AL (1981) The product of the lon (capR) gene in Escherichia coli is the ATP‐dependent protease, protease La. Proc Natl Acad Sci U S A 78:4931–4935. [DOI] [PMC free article] [PubMed] [Google Scholar]
- 46. Mahmoud SA, Chien P (2018) Regulated proteolysis in bacteria. Annu Rev Biochem 87:677–696. [DOI] [PMC free article] [PubMed] [Google Scholar]
- 47. Mandelstam J (1958) Turnover of protein in growing and non‐growing populations of Escherichia coli . Biochem J 69:110–119. [DOI] [PMC free article] [PubMed] [Google Scholar]
- 48. Pine MJ (1970) Steady‐state measurement of the turnover of amino acid in the cellular proteins of growing Escherichia coli: existence of two kinetically distinct reactions. J Bacteriol 103:207–215. [DOI] [PMC free article] [PubMed] [Google Scholar]
- 49. Serrano L, Matouschek A, Fersht AR (1992) The folding of an enzyme. III. Structure of the transition state for unfolding of barnase analysed by a protein engineering procedure. J Mol Biol 224:805–818. [DOI] [PubMed] [Google Scholar]
- 50. Oliveberg M, Wolynes PG (2005) The experimental survey of protein‐folding energy landscapes. Q Rev Biophys 38:245–288. [DOI] [PubMed] [Google Scholar]
- 51. Budyak IL, Krishnan B, Marcelino‐Cruz AM, Ferrolino MC, Zhuravleva A, Gierasch LM (2013) Early folding events protect aggregation‐prone regions of a beta‐rich protein. Structure 21:476–485. [DOI] [PMC free article] [PubMed] [Google Scholar]
- 52. Clark PL, Liu ZP, Zhang J, Gierasch LM (1996) Intrinsic tryptophans of CRABPI as probes of structure and folding. Protein Sci 5:1108–1117. [DOI] [PMC free article] [PubMed] [Google Scholar]
- 53. Clark PL, Weston BF, Gierasch LM (1998) Probing the folding pathway of a beta‐clam protein with single‐tryptophan constructs. Fold Des 3:401–412. [DOI] [PubMed] [Google Scholar]
- 54. Ignatova Z, Gierasch LM (2004) Monitoring protein stability and aggregation in vivo by real‐time fluorescent labeling. Proc Natl Acad Sci U S A 101:523–528. [DOI] [PMC free article] [PubMed] [Google Scholar]
- 55. Ignatova Z, Gierasch LM (2005) Aggregation of a slow‐folding mutant of a beta‐clam protein proceeds through a monomeric nucleus. Biochemistry 44:7266–7274. [DOI] [PubMed] [Google Scholar]
- 56. Kleywegt GJ, Bergfors T, Senn H, Le Motte P, Gsell B, Shudo K, Jones TA (1994) Crystal structures of cellular retinoic acid binding proteins I and II in complex with all‐trans‐retinoic acid and a synthetic retinoid. Structure 2:1241–1258. [DOI] [PubMed] [Google Scholar]
- 57. Liu ZP, Rizo J, Gierasch LM (1994) Equilibrium folding studies of cellular retinoic acid binding protein, a predominantly beta‐sheet protein. Biochemistry 33:134–142. [DOI] [PubMed] [Google Scholar]
- 58. Clark PL, Liu ZP, Rizo J, Gierasch LM (1997) Cavity formation before stable hydrogen bonding in the folding of a beta‐clam protein. Nat Struct Biol 4:883–886. [DOI] [PubMed] [Google Scholar]
- 59. Zhang J, Liu ZP, Jones TA, Gierasch LM, Sambrook JF (1992) Mutating the charged residues in the binding pocket of cellular retinoic acid‐binding protein simultaneously reduces its binding affinity to retinoic acid and increases its thermostability. Proteins 13:87–99. [DOI] [PubMed] [Google Scholar]
- 60. Larson SM, Ruczinski I, Davidson AR, Baker D, Plaxco KW (2002) Residues participating in the protein folding nucleus do not exhibit preferential evolutionary conservation. J Mol Biol 316:225–233. [DOI] [PubMed] [Google Scholar]
- 61. Liu X, Li J, Guo W, Wang W (2006) A new method for quantifying residue conservation and its applications to the protein folding nucleus. Biochem Biophys Res Commun 351:1031–1036. [DOI] [PubMed] [Google Scholar]
- 62. Lukacs GL, Mohamed A, Kartner N, Chang XB, Riordan JR, Grinstein S (1994) Conformational maturation of CFTR but not its mutant counterpart (ΔF508) occurs in the endoplasmic reticulum and requires ATP. EMBO J 13:6076–6086. [DOI] [PMC free article] [PubMed] [Google Scholar]
- 63. Ishii S, Chang HH, Kawasaki K, Yasuda K, Wu HL, Garman SC, Fan JQ (2007) Mutant alpha‐galactosidase A enzymes identified in Fabry disease patients with residual enzyme activity: biochemical characterization and restoration of normal intracellular processing by 1‐deoxygalactonojirimycin. Biochem J 406:285–295. [DOI] [PMC free article] [PubMed] [Google Scholar]
- 64. Hingorani KS, Metcalf MC, Deming DT, Garman SC, Powers ET, Gierasch LM (2017) Ligand‐promoted protein folding by biased kinetic partitioning. Nat Chem Biol 13:369–371. [DOI] [PMC free article] [PubMed] [Google Scholar]
- 65. Germain DP, Hughes DA, Nicholls K, Bichet DG, Giugliani R, Wilcox WR, Feliciani C, Shankar SP, Ezgu F, Amartino H, Bratkovic D, Feldt‐Rasmussen U, Nedd K, Sharaf El Din U, Lourenco CM, Banikazemi M, Charrow J, Dasouki M, Finegold D, Giraldo P, Goker‐Alpan O, Longo N, Scott CR, Torra R, Tuffaha A, Jovanovic A, Waldek S, Packman S, Ludington E, Viereck C, Kirk J, Yu J, Benjamin ER, Johnson F, Lockhart DJ, Skuban N, Castelli J, Barth J, Barlow C, Schiffmann R (2016) Treatment of Fabry's disease with the pharmacologic chaperone migalastat. N Engl J Med 375:545–555. [DOI] [PubMed] [Google Scholar]
- 66. Shoulders MD, Ryno LM, Genereux JC, Moresco JJ, Tu PG, Wu C, Yates JR 3rd, Su AI, Kelly JW, Wiseman RL (2013) Stress‐independent activation of XBP1s and/or ATF6 reveals three functionally diverse ER proteostasis environments. Cell Rep 3:1279–1292. [DOI] [PMC free article] [PubMed] [Google Scholar]
- 67. Plate L, Cooley CB, Chen JJ, Paxman RJ, Gallagher CM, Madoux F, Genereux JC, Dobbs W, Garza D, Spicer TP, Scampavia L, Brown SJ, Rosen H, Powers ET, Walter P, Hodder P, Wiseman RL, Kelly JW (2016) Small molecule proteostasis regulators that reprogram the ER to reduce extracellular protein aggregation. Elife 5:e15550. [DOI] [PMC free article] [PubMed] [Google Scholar]
- 68. Plate L, Wiseman RL (2017) Regulating secretory proteostasis through the unfolded protein response: from function to therapy. Trends Cell Biol 27:722–737. [DOI] [PMC free article] [PubMed] [Google Scholar]
- 69. Sekijima Y (2015) Transthyretin (ATTR) amyloidosis: clinical spectrum, molecular pathogenesis and disease‐modifying treatments. J Neurol Neurosurg Psychiatry 86:1036–1043. [DOI] [PubMed] [Google Scholar]
- 70. Eisele YS, Monteiro C, Fearns C, Encalada SE, Wiseman RL, Powers ET, Kelly JW (2015) Targeting protein aggregation for the treatment of degenerative diseases. Nat Rev Drug Discov 14:759–780. [DOI] [PMC free article] [PubMed] [Google Scholar]
- 71. Johnson SM, Connelly S, Fearns C, Powers ET, Kelly JW (2012) The transthyretin amyloidoses: from delineating the molecular mechanism of aggregation linked to pathology to a regulatory‐agency‐approved drug. J Mol Biol 421:185–203. [DOI] [PMC free article] [PubMed] [Google Scholar]
- 72. Sekijima Y, Wiseman RL, Matteson J, Hammarstrom P, Miller SR, Sawkar AR, Balch WE, Kelly JW (2005) The biological and chemical basis for tissue‐selective amyloid disease. Cell 121:73–85. [DOI] [PubMed] [Google Scholar]
- 73. Rappley I, Monteiro C, Novais M, Baranczak A, Solis G, Wiseman RL, Helmke S, Maurer MS, Coelho T, Powers ET, Kelly JW (2014) Quantification of transthyretin kinetic stability in human plasma using subunit exchange. Biochemistry 53:1993–2006. [DOI] [PMC free article] [PubMed] [Google Scholar]
- 74. Socolow EL, Woeber KA, Purdy RH, Holloway MT, Ingbar SH (1965) Preparation of I131‐labeled human serum prealbumin and its metabolism in normal and sick patients. J Clin Invest 44:1600–1609. [DOI] [PMC free article] [PubMed] [Google Scholar]
- 75. Hammarstrom P, Wiseman RL, Powers ET, Kelly JW (2003) Prevention of transthyretin amyloid disease by changing protein misfolding energetics. Science 299:713–716. [DOI] [PubMed] [Google Scholar]
- 76. Bulawa CE, Connelly S, Devit M, Wang L, Weigel C, Fleming JA, Packman J, Powers ET, Wiseman RL, Foss TR, Wilson IA, Kelly JW, Labaudiniere R (2012) Tafamidis, a potent and selective transthyretin kinetic stabilizer that inhibits the amyloid cascade. Proc Natl Acad Sci U S A 109:9629–9634. [DOI] [PMC free article] [PubMed] [Google Scholar]
- 77. Razavi H, Palaninathan SK, Powers ET, Wiseman RL, Purkey HE, Mohamedmohaideen NN, Deechongkit S, Chiang KP, Dendle MT, Sacchettini JC, Kelly JW (2003) Benzoxazoles as transthyretin amyloid fibril inhibitors: synthesis, evaluation, and mechanism of action. Angew Chem Int Ed Engl 42:2758–2761. [DOI] [PubMed] [Google Scholar]
- 78. Maurer MS, Schwartz JH, Gundapaneni B, Elliott PM, Merlini G, Waddington‐Cruz M, Kristen AV, Grogan M, Witteles R, Damy T, Drachman BM, Shah SJ, Hanna M, Judge DP, Barsdorf AI, Huber P, Patterson TA, Riley S, Schumacher J, Stewart M, Sultan MB, Rapezzi C, Investigators A‐AS (2018) Tafamidis treatment for patients with transthyretin amyloid cardiomyopathy. N Engl J Med 379:1007–1016. [DOI] [PubMed] [Google Scholar]
Associated Data
This section collects any data citations, data availability statements, or supplementary materials included in this article.
Supplementary Materials
Appendix S1: Supporting Information
Table S2 Protein‐dependent folding and chaperoning parameters for the proteome. This table is contained in the associated Excel file.