

Abstract
Rheumatoid arthritis (RA) is an autoimmune disease that causes chronic inflammation in synovial tissues. Hyperplasia of synovial tissue leads to the formation of pannus, which invades joint cartilage and bone resulting in joint destruction. Tumor necrosis factor-like ligand 1A (TL1A), a member of the tumor necrosis factor superfamily (TNFSF15), contributes to the pathogenesis of autoimmune diseases, including RA. In the present study, a cDNA microarray was used to search for genes whose expression in rheumatoid fibroblast-like synoviocytes (RA-FLS) were regulated by TL1A. Four individual lines of primary cultured RA-FLS were incubated either with recombinant human TL1A protein or phosphate-buffered saline, as an unstimulated control, for 12 h. Gene expression was then detected through the microarray assay. The results revealed the expression profiles of genes in RA-FLS regulated by TL1A. The present study also demonstrated the functions of those genes whose expression in RA-FLS was regulated by TL1A. Among the genes in this profile, the present study focused on the following genes: Spectrin repeat-containing nuclear envelope 1, Fc receptor-like 2, PYD (pyrin domain)-containing 1, cell division cycle 45 homolog, signal transducer and activator of transcription 5B, and interferon regulatory factor 4. These genes may affect the pathogenesis of RA, including proliferation, regulation of B cells and T cells, inflammation, and cytokine processing. The present study revealed for the first time, to the best of our knowledge, the expression profile of genes in RA-FLS regulated by TL1A. The data indicate that TL1A may regulate the gene expression of various key molecules in RA-FLS, thus affecting the pathogenesis of RA. Further investigations of the genes detected in the current profiles may provide a deeper understanding of the pathogenesis and a novel target for the treatment of RA.
Keywords: rheumatoid arthritis, fibroblast-like synoviocytes, tumor necrosis factor like-ligand 1A, decoy receptor 3, microarray assay, gene expression profile
Introduction
Rheumatoid arthritis (RA) is an autoimmune disease that causes chronic inflammation in synovial tissues. Hyperplasia of synovial tissue leads to the formation of pannus, which invades joint cartilage and bone, resulting in joint destruction. Previous reports have indicated that a number of features of transformed long-lived cells are observed in the hyperplastic synovial tissues of patients with RA, including oncogene expression, resistance to apoptosis and the presence of somatic mutations (1-3). Several explanations for the resistance of RA-FLS to apoptosis have been suggested, including deregulation of the Bcl-2 family of proteins critical to intrinsic pathway regulation, deregulation of the nuclear factor (NF)-κB signaling pathway, p53 mutations and a low expression of PUMA, found in the RA synovium and FLS, which provides an explanation for the lack of p53-induced FLS apoptosis (4).
Tumor necrosis factor (TNF)-like ligand 1A (TL1A)/TNFSF15, a member of the TNF superfamily, is expressed by endothelial cells (5), macrophages (6,7), T cells (8,9), monocytes (10,11), dendritic cells (11), chondrocytes (12) and synovial fibroblasts (12), and contributes to the pathogenesis of cancer and autoimmune diseases via the apoptotic, stress, mitogenic and inflammation pathways by binding to death receptor 3 (DR3) and decoy receptor 3 (DcR3) (5,13). Previous studies have reported that the expression of TL1A is increased in the synovial fluid and serum from patients with RA (12,14), and that TL1A increases the production of interleukin (IL)-6 on rheumatoid fibroblast-like synoviocytes (RA-FLS) (15). In a previous in vivo study, it was demonstrated that TL1A treatment increased the severity of arthritis and destruction of bone in a collagen-induced arthritis mouse model of RA (12).
DcR3/TR6/M68/TNFRSF6b, a member of the TNF receptor superfamily, binds to three ligands, Fas ligand (FasL), LIGHT and TL1A, which are members of the TNF superfamily (16). The overexpression of DcR3 may benefit tumors by enabling them to avoid the cytotoxic and regulatory effects of FasL (17,18), LIGHT (19) and TL1A (5). In our previous studies, it was demonstrated that DcR3 is expressed in RA-FLS (20), and that DcR3 binds to TL1A expressed on RA-FLS, resulting in the negative regulation of cell proliferation induced by inflammatory cytokines (21). The expression profiles of genes regulated by DcR3 in RA-FLS were further revealed, which were obtained through the use of a cDNA microarray (22). Based on these profiles, it was suggested that DcR3-TL1A signaling is involved in the pathogenesis of RA (23-25).
Although the gene expression profiles regulated by DcR3 were revealed in our previous study, how TL1A, one of the ligands of DcR3, contributes to the pathogenesis of RA remains to be fully elucidated. As the functions of TL1A are diverse, it was hypothesized that TL1A controls the expression of genes potentially involved in the pathogenesis of RA.
In the present study, a search was performed to identify those genes whose expression in RA-FLS is regulated by TL1A through use of a cDNA microarray. The gene expression profiles revealed a series of genes that may serve a significant role in the pathogenesis of RA in the TL1A-DcR3/DR3 signaling pathway.
Materials and methods
Isolation and culture of synovial fibroblasts
RA-FLS were obtained from four patients (samples 1-4) with RA who fulfilled the 1987 criteria of the American College of Rheumatology (formerly, the American Rheumatism Association) (26) during total knee replacement surgery. The patients were four women aged 73.0±11.2 years old. Their C-reactive protein levels and erythrocyte sedimentation rates were 2.04±2.16 mg/dl and 60.0±22.1 mm/h, respectively. In terms of drug therapy for RA, two patients were administered oral methotrexate (MTX; average dose, 3.00±1.41 mg/week), one was administered salazosulfapyridine (1 g/day), and one was administered mizoribine (150 mg/day). Prednisolone (PSL) was used in the treatment of all four patients (average dose, 3.63±2.14 mg/day). The patients had never been treated with biological disease-modifying anti-rheumatic drugs or Janus kinase inhibitors.
Synovial samples were collected from the patients, who provided informed written consent to their involvement in the study in accordance with the World Medical Association Declaration of Helsinki Ethical Principles for Medical Research Involving Human Subjects. The protocol, including consent procedures, was approved by the Ethics Committee of Kobe University Graduate School of Health Sciences (Kobe, Japan; approval no. 308). The tissue specimens were minced and digested in Dulbecco's modified Eagle's medium (DMEM; Merck KGaA, Darmstadt, Germany) containing 0.2% collagenase (Merck KGaA) for 2 h at 37˚C with 5% CO2. The dissociated cells were cultured in DMEM supplemented with 10% fetal bovine serum (Merck KGaA) and 100 U/ml of penicillin/streptomycin (Meiji Seika Pharma Co., Ltd., Tokyo, Japan). Following incubation overnight and the removal of non-adherent cells, the adherent cells were further incubated in fresh medium. All experiments were performed using cells from passages 3-4(20).
RNA extraction
Four individual cell lines (samples 1-4) of primary cultured RA-FLS (2x10⁶ cells/well) were incubated with 1.0 µg/ml of recombinant human TL1A protein (R&D Systems, Inc., Minneapolis, MN, USA) or were left untreated with OPTI-MEM medium (Thermo Fisher Scientific, Inc., Waltham, MA, USA) for 12 h at 37˚C with 5% CO2. Following incubation, RNA was extracted with QIAshredder (Qiagen GmbH, Hilden, Germany) and RNeasy Mini kit (Qiagen GmbH) according to the manufacturer's protocol. The extraction of total RNA was performed for each sample separately.
Gene expression profiling and data analysis
Gene expression was detected by microarray assay (Human Genome U133 Plus 2.0, GeneChip® 3' Expression Array; Thermo Fisher Scientific, Inc.). The labeling of RNA probes, hybridization and washing were performed according to the manufacturer's protocol.
Avadis 3.3 Prophetic software (Strand Life Sciences, Bangalore, India) was used for statistical analysis (27). Differentially expressed genes were extracted using a paired t-test with P<0.05 considered to indicate a statistically significant difference and fold-change >1.4, and ordered into hierarchical clusters using the Euclidean algorithm as the distance measure and the complete algorithm as the linkage method. Values are expressed as the mean ± standard deviation unless otherwise indicated.
Results
Microarray analysis for gene expression profiling of RA-FLS stimulated by TL1A
The microarray analysis performed in the present study (Human Genome U133 Plus 2.0, GeneChip® 3' Expression Array) detected the expression of 54,613 genes. The entire microarray data obtained were deposited in the NCBI Gene Expression Omnibus (GEO) and are accessible through GEO series accession no. GSE118958 (https://www.ncbi.nlm.nih.gov/geo/query/acc.cgi?acc=gse118958).
The microarray analysis revealed that TL1A upregulated or downregulated the expression of various genes in RA-FLS. The NCBI UniGene database (https://www.ncbi.nlm.nih.gov/UniGene/clust.cgi?ORG=Hs&CID=55682) was used to identify the gene names, with gene symbols representing abbreviations of the gene names. The fold change is the ratio of each gene expression in the TL1A-stimulated group compared with that in the control group. Among the 100 most differentially upregulated genes by TL1A, 67 genes were annotated in the database, and 21 of these 67 genes upregulated by TL1A are shown in Table I. Gene annotations of 58 of the 100 most differentially downregulated genes by TL1A were also annotated in the database, and 21 of the 58 genes downregulated by TL1A are shown in Table II. The results of hierarchical clustering analysis for the 100 most upregulated genes and the 100 most downregulated genes are illustrated in Figs. 1 and 2, respectively.
Table I.
List of the 21 genes upregulated by tumor necrosis factor-like ligand 1A.
| Gene symbol | Fold-change | P-value | Gene name |
|---|---|---|---|
| SYNE1 | 15.3 | 0.013391 | Spectrin repeat-containing, nuclear envelope 1 |
| PDE11A | 14.40000186 | 0.013724 | Phosphodiesterase 11A |
| MGC15705 | 12.6299996 | 0.006738 | Hypothetical protein MGC15705 |
| COG2 | 12.61445783 | 0.016001 | Component of oligomeric golgi complex 2 |
| FCRL2 | 11.97633136 | 0.000003 | Fc receptor-like 2 |
| RAD21L1 | 11.82758621 | 0.007302 | RAD21-like 1 (S. pombe) |
| PPP4R1L | 10.1975316 | 0.005913 | Protein phosphatase 4, regulatory subunit 1-like |
| MIER3 | 9.72072035 | 0.048129 | Mesoderm induction early response 1, family member 3 |
| LOC100505801 | 9.711538484 | 0.029304 | Hypothetical LOC100505801 |
| C12orf74 | 9.576924282 | 0.008377 | Chromosome 12 open reading frame 74 |
| CCNE2 | 9.118012422 | 0.039656 | Cyclin E2 |
| LOC100288507 | 9.064056744 | 0.009929 | Hypothetical protein LOC100288507 |
| USH2A | 8.986842105 | 0.048673 | Usher syndrome 2A (autosomal recessive, mild) |
| SEZ6L | 8.7578125 | 0.002512 | Seizure related 6 homolog (mouse)-like |
| LOC100133308 | 8.376812174 | 0.026850 | Ras suppressor protein 1 pseudogene |
| MLL | 8.357512953 | 0.007109 | Myeloid/lymphoid or mixed-lineage leukemia (trithorax homolog, Drosophila) |
| SYTL3 | 8.348148148 | 0.038552 | Synaptotagmin-like 3 |
| GAGE12F///GAGE12G/// | 8.124137931 | 0.018128 | G antigen 12F///G antigen 12G///G antigen 12I///G antigen 5/// |
| GAGE12I///GAGE5///GAGE7 | G antigen 7 | ||
| FRMD4A | 7.891089109 | 0.044768 | FERM domain-containing 4A |
| LOC404266 | 7.725807116 | 0.003327 | Hypothetical LOC404266 |
| PYDC1 | 5.42662116 | 0.006955 | PYD (pyrin domain)-containing 1 |
Table II.
List of the 21 genes downregulated by tumor necrosis factor-like ligand 1A.
| Gene symbol | Fold-change | P-value | Gene name |
|---|---|---|---|
| CDC45 | 0.08 | 0.006927 | Cell division cycle 45 homolog (S. cerevisiae) |
| STAT5B | 0.10 | 0.019873 | Signal transducer and activator of transcription 5B |
| BEND4 | 0.11 | 0.026734 | BEN domain-containing 4 |
| ALAS2 | 0.11 | 0.004251 | Aminolevulinate, δ-, synthase 2 |
| LOC728743 | 0.11 | 0.031562 | Similar to GLI-Kruppel family member HKR1 |
| LOC100130815 | 0.12 | 0.037456 | Hypothetical LOC100130815 |
| LOC255130 | 0.12 | 0.020509 | Hypothetical LOC255130 |
| RBM25 | 0.12 | 0.032102 | RNA-binding motif protein 25 |
| PARP15 | 0.12 | 0.028820 | Poly (ADP-ribose) polymerase family, member 15 |
| SUFU | 0.12 | 0.025031 | Suppressor of fused homolog (Drosophila) |
| MUC7 | 0.12 | 0.045462 | Mucin 7, secreted |
| VPS35 | 0.12 | 0.013976 | Vacuolar protein sorting 35 homolog (S. cerevisiae) |
| GKN1 | 0.13 | 0.013159 | Gastrokine 1 |
| KRT77 | 0.13 | 0.030364 | Keratin 77 |
| GOT1L1 | 0.14 | 0.047977 | Glutamic-oxaloacetic transaminase 1-like 1 |
| DEFA5 | 0.14 | 0.005483 | Defensin, α5, Paneth cell-specific |
| SLC13A3 | 0.14 | 0.041769 | Solute carrier family 13 (sodium-dependent dicarboxylate transporter), member 3 |
| C10orf137 | 0.15 | 0.030915 | Chromosome 10 open reading frame 137 |
| PRTN3 | 0.15 | 0.001312 | Proteinase 3 |
| RASGRP1 | 0.15 | 0.038526 | RAS guanyl-releasing protein 1 (calcium and DAG-regulated) |
| IRF4 | 0.22 | 0.027305 | Interferon regulatory factor 4 |
Figure 1.
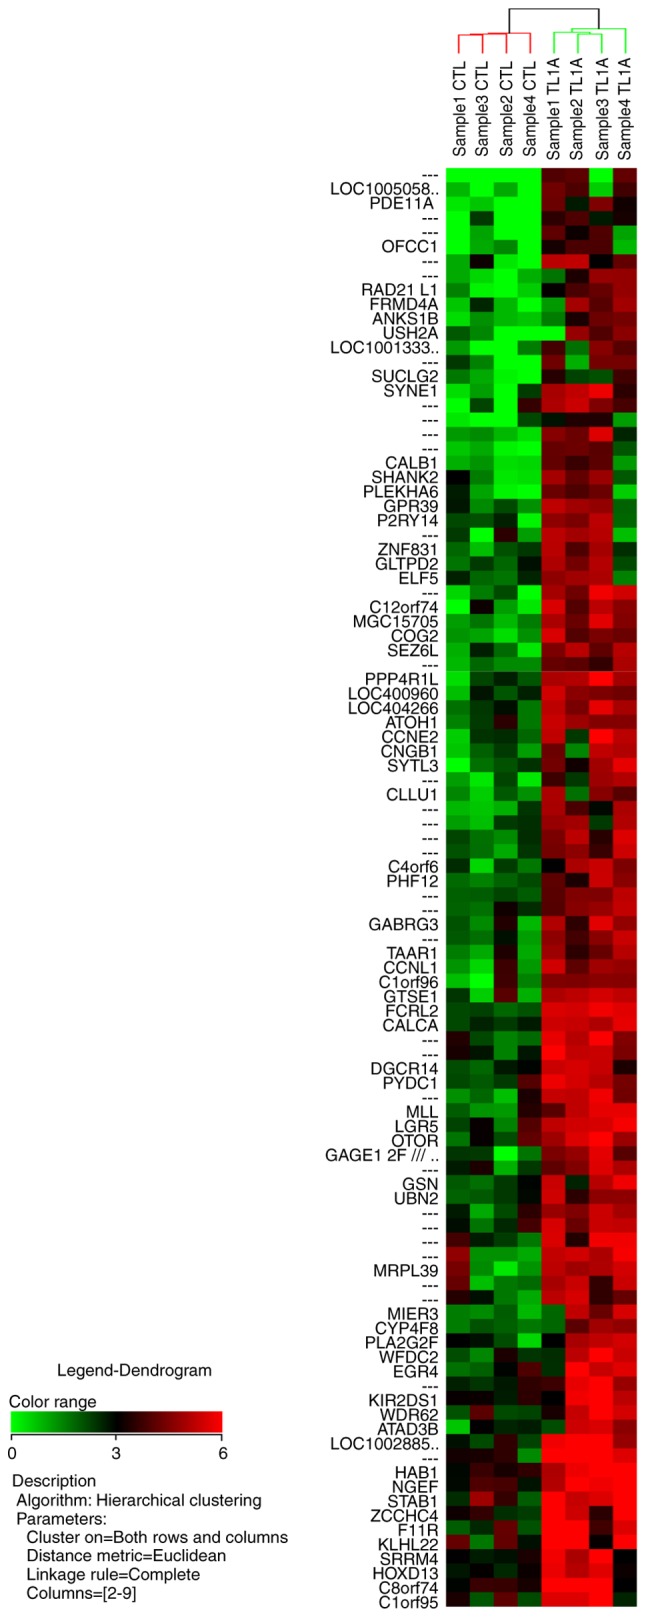
Cluster analysis and heat map of 100 probe sets significantly upregulated by TL1A. The heat map shows expression values mapped to a color gradient from low (green) to high expression (red). Experiments are arranged according to a hierarchical clustering dendrogram. The horizontal dendrogram shows the similarity of functions between neighboring genes. The vertical dendrogram shows the similarity of gene expression between neighboring samples. TL1A, tumor necrosis factor-like ligand 1A; CTL, control.
Figure 2.
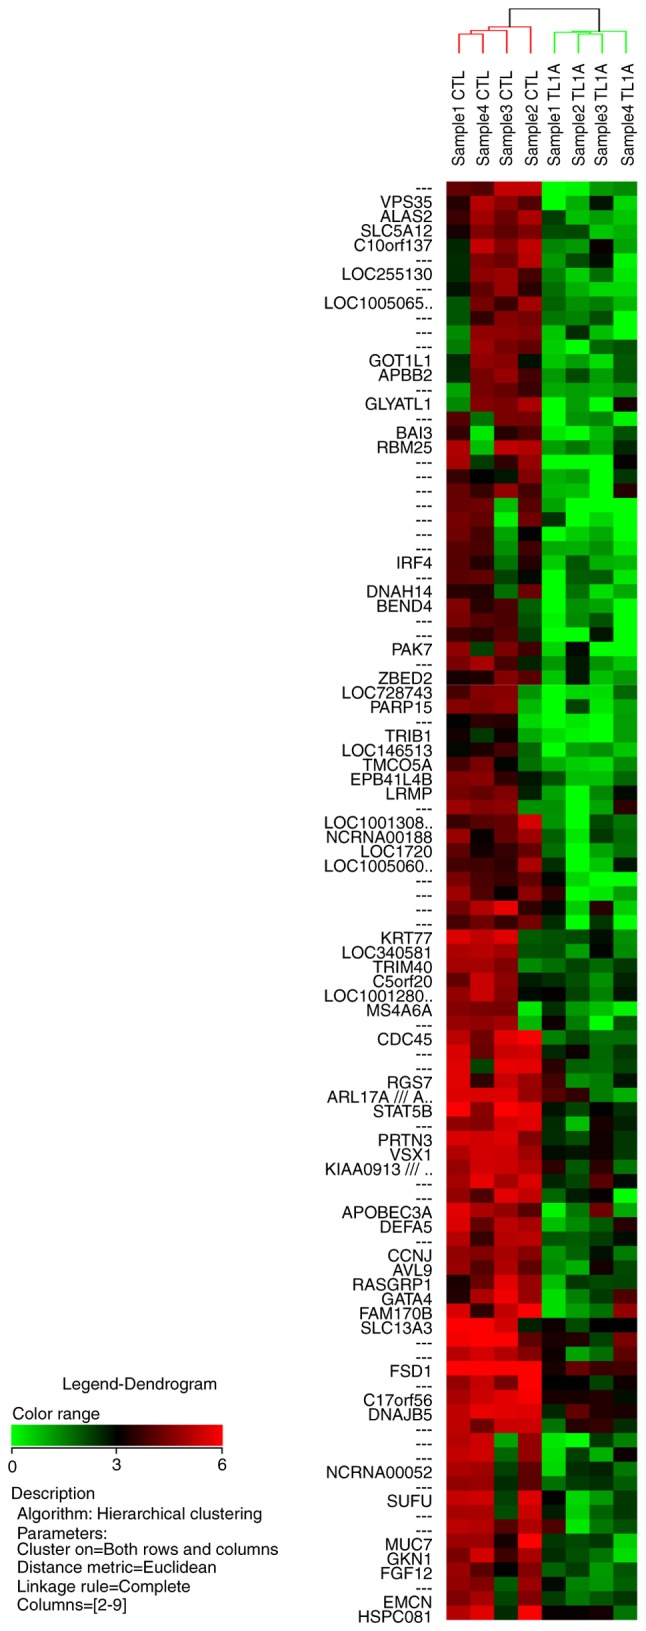
Cluster analysis and heat map of 100 probe sets significantly downregulated by TL1A. The heat map shows expression values mapped to a color gradient from low (green) to high expression (red). Experiments are arranged according to a hierarchical clustering dendrogram. The horizontal dendrogram shows the similarity of functions between neighboring genes. The vertical dendrogram shows the similarity of gene expression between neighboring samples. TL1A, tumor necrosis factor-like ligand 1A; CTL, control.
Functional annotation
The 100 genes most regulated by TL1A were significantly classified into 14 categories registered in the Database for Annotation, Visualization and Integrated Discovery bioinformatics database (https://david.ncifcrf.gov/) according to their biological functions; alternative splicing, splice variant, coenzyme A, regulation of cytokine production, Cyclin; N-terminal, Cyclin, Pleckstrin homology-type, CYCLIN, transcription from RNA polymerase II promoter, cyclin, compositionally biased region:Ser-rich, postsynaptic membrane, positive regulation of transcription from RNA polymerase II promoter, and synapse. The regulated genes belonging to each cluster are listed in Table III.
Table III.
Functions of the 100 most regulated genes classified into 14 categories with statistical significance.
| Term | P-value | Genes |
|---|---|---|
| Alternative splicing | 0.004007 | KIAA0913, ELF5, C17ORF56, FCRL2, PDE11A, FGF12, CNGB1, LGR5, |
| GLYATL1, C10ORF137, CCNE2, PPP4R1L, ATAD3B, GSN, MIER3, | ||
| KLHL22, MRPL39, USH2A, ANKS1B, BEND4, CCNJ, AVL9, CCNL1, | ||
| TRIM40, SEZ6L, UBN2, PARP15, LRMP, WFDC2, PLA2G2F, EMCN, | ||
| RAD21L1, DNAH14, OFCC1, EPB41L4B, SUFU, CALCA, RASGRP1, | ||
| MS4A6A, C1ORF96, RBM25, NGEF, MLL, TMCO5A, PHF12, SHANK2, | ||
| VSX1, SYNE1, ARL17B, ARL17A, WDR62, STAB1, RGS7, SLC13A3, | ||
| SYTL3, IRF4, APBB2, DNAJB5, SLC5A12 | ||
| Splice variant | 0.00425 | KIAA0913, ELF5, C17ORF56, FCRL2, PDE11A, FGF12, CNGB1, LGR5, |
| GLYATL1, C10ORF137, CCNE2, PPP4R1L, ATAD3B, GSN, MIER3, | ||
| KLHL22, MRPL39, USH2A, ANKS1B, BEND4, CCNJ, AVL9, CCNL1, | ||
| TRIM40, SEZ6L, UBN2, PARP15, LRMP, WFDC2, PLA2G2F, EMCN, | ||
| RAD21L1, DNAH14, OFCC1, EPB41L4B, SUFU, CALCA, RASGRP1, | ||
| MS4A6A, C1ORF96, RBM25, NGEF, MLL, TMCO5A, PHF12, SHANK2, | ||
| VSX1, SYNE1, ARL17B, ARL17A, WDR62, STAB1, RGS7, SLC13A3, | ||
| SYTL3, IRF4, APBB2, DNAJB5, SLC5A12 | ||
| Coenzyme A | 0.011118 | SAT1, ALAS2, SUCLG2 |
| Regulation of cytokine production | 0.013645 | CALCA, STAT5B, GATA4, IRF4, PYDC1 |
| Cyclin, N-terminal | 0.01396 | CCNE2, CCNJ, CCNL1 |
| Cyclin | 0.020121 | CCNE2, CCNJ, CCNL1 |
| Pleckstrin homology-type | 0.025198 | ANKS1B, NGEF, PLEKHA6, FRMD4A, EPB41L4B, APBB2 |
| Cyclin | 0.025934 | CCNE2, CCNJ, CCNL1 |
| Transcription from RNA polymerase II promoter | 0.031469 | ATOH1, MLL, ELF5, GATA4, HOXD13 |
| Cyclin | 0.033221 | CCNE2, CCNJ, CCNL1 |
| Compositionally biased region: Ser-rich | 0.036248 | SYNE1, SRRM4, KIAA0913, FRMD4A, C17ORF56, C5ORF20, UBN2 |
| Postsynaptic membrane | 0.036429 | ANKS1B, GABRG3, SYNE1, SHANK2 |
| Positive regulation of transcription from RNA polymerase II promoter | 0.04068 | ATOH1, MLL, STAT5B, GATA4, HOXD13, IRF4 |
| Synapse | 0.042545 | ANKS1B, GABRG3, RAD21L1, SYNE1, APBB2, SHANK2 |
Discussion
Genome-wide gene expression cDNA microarrays provide a useful way of investigating the pathophysiology of a variety of diseases, including tumors (28-30), immune-mediated diseases (31,32), and inflammatory diseases (33-35). Using microarrays, our previous study revealed the expression profiles of genes in RA-FLS regulated by DcR3(22). Subsequently, based on that profile, the significance of the regulation of IL-12B p40(23), tryptophan hydroxylase 1(24), and centrosomal protein 70 kDa (25) by DcR3 in RA-FLS was investigated in detail.
The present study is the first, to the best of our knowledge, to demonstrate the expression profiles of genes in RA-FLS regulated by TL1A. Among the genes in this profile, the following genes were of note: Spectrin repeat-containing nuclear envelope 1 (SYNE1), Fc receptor-like 2 (FCRL2), PYD (pyrin domain)-containing 1 (PYDC1), cell division cycle 45 homolog (CDC45), signal transducer and activator of transcription 5B (STAT5B), and interferon regulatory factor 4 (IRF4), as these genes were highly regulated by TL1A and belong to major functional clustering categories.
SYNE1 in RA-FLS was upregulated by TL1A in this gene expression profile. SYNE1 is a member of the spectrin family that is expressed in various tissues (36,37). It is reported to be associated with cytokinesis in HeLa cells (38), and the proliferation and apoptosis of mesenchymal stem cells (39).
FCRL2 was upregulated in this profile and is a member of the Fc receptor-like molecules superfamily. It is predominantly expressed by memory B cells and can influence B-cell signaling due to having both immunoreceptor tyrosine-based activation and inhibitory motifs (40-42). Jackson et al suggested that FCRL2 may serve as a negative regulator of the memory B cell response (43). FCRL2 has been reported to be expressed at high levels in B-cell chronic lymphocytic leukemia cells, affecting disease progression and survival rates (42,44,45), and is associated with the inflammatory marker and disease activity of RA (46).
PYDC1 was upregulated in this profile. PYD-containing proteins have been reported to be involved in the activation of NF-κB and caspase-1, which regulates the processing of IL-1β and IL-18, and is associated with inflammation and apoptosis (47-49).
CDC45 was downregulated in this profile. CDC45 serves a critical role in DNA replication (50), and has been reported to be overexpressed in cancer cells (51) and cancer-derived cell lines (52). The expression of CDC45 is significantly suppressed by the knockdown of IL-1 receptor-associated kinase 1 in endometrial carcinoma (53). The expression of CDC45 is closely associated with proliferating cell populations in cancer (52).
STAT5B was downregulated in this profile. STATs regulate gene transcription to influence cellular functions, including proliferation, apoptosis, differentiation, reproduction and lipid metabolism, and have biological roles in several diseases, including autoimmune disease (54-60). The expression and activity of STATs can contribute to the onset, progression and severity of RA (61).
IRF4 was downregulated in this profile. IRF4 has been reported to be an RA risk locus, as identified by GWAS data analysis (62). IRF4 is an IRF family member of transcription factors and is associated with the development and function of immune cells (63). Previous studies have found that IRF4 regulates autoimmunity (63,64). In addition, IRF4 regulates Th17 cell differentiation and the production of IL-17, which are important for modulation of autoimmunity, including RA (63,65).
Although neither SYNE1 nor CDC45 are reported to be associated with RA directly, SYNE1 is associated with cytokinesis, proliferation and apoptosis, and CDC45 serves a critical role in the cell cycle of proliferating cells, which are important factors in the pathogenesis of RA.
The limitations of the present study included its small sample size and that it examined microarray data only, without detecting mRNA or protein expression. The results of the present study revealed a series of genes whose expression is regulated by TL1A in RA-FLS using microarray analysis, however, each gene revealed through microarray analysis requires confirmation one by one with mRNA or protein analysis in a future study. In addition to the expression analysis of each genes, how these genes regulated by TL1A in RA-FLS are involved in combination in the pathogenesis of RA also requires investigation in a future study.
In conclusion, the present study is the first, to the best of our knowledge, to report the expression profile of genes in RA-FLS regulated by TL1A. The data demonstrate that TL1A may regulate the gene expression of various key molecules in RA-FLS, thus affecting the pathogenesis of RA, including proliferation, regulation of B cells and T cells, inflammation, and cytokine processing. Further investigations of the genes detected in this profile may provide a deeper understanding of the pathogenesis and novel targets for the treatment of RA.
Acknowledgements
The authors would like to thank Mrs. Kyoko Tanaka, Ms. Minako Nagata and Ms. Maya Yasuda (Department of Orthopaedic Surgery, Kobe University Graduate School of Medicine, Kobe, Japan) for their technical assistance.
Funding
This study was supported by a Grant-in-Aid for Scientific Research (KAKENHI; grant nos. 15K10473 and 18K09106).
Availability of data and materials
The datasets generated and analyzed during the current study are available in the NCBI GEO repository and are accessible through GEO series accession no. GSE118958, (https://www.ncbi.nlm.nih.gov/geo/query/acc.cgi?acc=gse118958).
Authors' contributions
KF was involved in conception and design, data collection and analysis, manuscript writing and final approval of the manuscript; YM was involved in conception and design, data collection and analysis, manuscript writing and final approval of the manuscript. TM was involved in conception and design, data collection, and final approval of the manuscript. SH was involved in conception and design, data collection and final approval of the manuscript. RK was involved in conception and design, data collection, and final approval of the manuscript.
Ethics approval and consent to participate
The study protocol, including consent procedures, was approved by the Ethics Committee of Kobe University Graduate School of Health Sciences (approval no. 308).
Patient consent for publication
Not applicable.
Competing interests
The authors declare that they have no competing interests.
References
- 1.Chou CT, Yang JS, Lee MR. Apoptosis in rheumatoid arthritis-expression of Fas, Fas-L, p53, and Bcl-2 in rheumatoid synovial tissues. J Pathol. 2001;193:110–116. doi: 10.1002/1096-9896(2000)9999:9999<::AID-PATH746>3.0.CO;2-K. [DOI] [PubMed] [Google Scholar]
- 2.Tak PP, Zvaifler NJ, Green DR, Firestein GS. Rheumatoid arthritis and p53: How oxidative stress might alter the course of inflammatory diseases. Immunol Today. 2000;21:78–82. doi: 10.1016/S0167-5699(99)01552-2. [DOI] [PubMed] [Google Scholar]
- 3.Yamanishi Y, Boyle DL, Rosengren S, Green DR, Zvaifler NJ, Firestein GS. Regional analysis of p53 mutations in rheumatoid arthritis synovium. Proc Natl Acad Sci USA. 2002;99:10025–10030. doi: 10.1073/pnas.152333199. [DOI] [PMC free article] [PubMed] [Google Scholar]
- 4.Bustamante MF, Garcia-Carbonell R, Whisenant KD, Guma M. Fibroblast-like synoviocyte metabolism in the pathogenesis of rheumatoid arthritis. Arthritis Res Ther. 2017;19(110) doi: 10.1186/s13075-017-1303-3. [DOI] [PMC free article] [PubMed] [Google Scholar]
- 5.Migone TS, Zhang J, Luo X, Zhuang L, Chen C, Hu B, Hong JS, Perry JW, Chen SF, Zhou JX, et al. TL1A is a TNF-like ligand for DR3 and TR6/DcR3 and functions as a T cell costimulator. Immunity. 2002;16:479–492. doi: 10.1016/S1074-7613(02)00283-2. [DOI] [PubMed] [Google Scholar]
- 6.Kamada N, Hisamatsu T, Honda H, Kobayashi T, Chinen H, Takayama T, Kitazume MT, Okamoto S, Koganei K, Sugita A, et al. TL1A produced by lamina propria macrophages induces Th1 and Th17 immune responses in cooperation with IL-23 in patients with Crohn's disease. Inflamm Bowel Dis. 2010;16:568–575. doi: 10.1002/ibd.21124. [DOI] [PubMed] [Google Scholar]
- 7.Bamias G, Martin C III, Marini M, Hoang S, Mishina M, Ross WG, Sachedina MA, Friel CM, Mize J, Bickston SJ, et al. Expression, localization, and functional activity of TL1A, a novel Th1-polarizing cytokine in inflammatory bowel disease. J Immunol. 2003;171:4868–4874. doi: 10.4049/jimmunol.171.9.4868. [DOI] [PubMed] [Google Scholar]
- 8.Prehn JL, Mehdizadeh S, Landers CJ, Luo X, Cha SC, Wei P, Targan SR. Potential role for TL1A, the new TNF-family member and potent costimulator of IFN-gamma, in mucosal inflammation. Clin Immunol. 2004;112:66–77. doi: 10.1016/j.clim.2004.02.007. [DOI] [PubMed] [Google Scholar]
- 9.Papadakis KA, Zhu D, Prehn JL, Landers C, Avanesyan A, Lafkas G, Targan SR. Dominant role for TL1A/DR3 pathway in IL-12 plus IL-18-induced IFN-gamma production by peripheral blood and mucosal CCR9+ T lymphocytes. J Immunol. 2005;174:4985–4990. doi: 10.4049/jimmunol.174.8.4985. [DOI] [PubMed] [Google Scholar]
- 10.Cassatella MA, Pereira-da-Silva G, Tinazzi I, Facchetti F, Scapini P, Calzetti F, Tamassia N, Wei P, Nardelli B, Roschke V, et al. Soluble TNF-like cytokine (TL1A) production by immune complexes stimulated monocytes in rheumatoid arthritis. J Immunol. 2007;178:7325–7333. doi: 10.4049/jimmunol.178.11.7325. [DOI] [PubMed] [Google Scholar]
- 11.Prehn JL, Thomas LS, Landers CJ, Yu QT, Michelsen KS, Targan SR. The T cell costimulator TL1A is induced by FcgammaR signaling in human monocytes and dendritic cells. J Immunol. 2007;178:4033–4038. doi: 10.4049/jimmunol.178.7.4033. [DOI] [PubMed] [Google Scholar]
- 12.Zhang J, Wang X, Fahmi H, Wojcik S, Fikes J, Yu Y, Wu J, Luo H. Role of TL1A in the pathogenesis of rheumatoid arthritis. J Immunol. 2009;183:5350–5357. doi: 10.4049/jimmunol.0802645. [DOI] [PubMed] [Google Scholar]
- 13.Sethi G, Sung B, Aggarwal BB. Therapeutic potential of VEGI/TL1A in autoimmunity and cancer. Adv Exp Med Biol. 2009;647:207–215. doi: 10.1007/978-0-387-89520-8_15. [DOI] [PubMed] [Google Scholar]
- 14.Bamias G, Siakavellas SI, Stamatelopoulos KS, Chryssochoou E, Papamichael C, Sfikakis PP. Circulating levels of TNF-like cytokine 1A (TL1A) and its decoy receptor 3 (DcR3) in rheumatoid arthritis. Clin Immunol. 2008;129:249–255. doi: 10.1016/j.clim.2008.07.014. [DOI] [PubMed] [Google Scholar]
- 15.Ma Z, Wang B, Wang M, Sun X, Tang Y, Li M, Li F, Li X. TL1A increased IL-6 production on fibroblast-like synoviocytes by preferentially activating TNF receptor 2 in rheumatoid arthritis. Cytokine. 2016;83:92–98. doi: 10.1016/j.cyto.2016.04.005. [DOI] [PubMed] [Google Scholar]
- 16.Shi G, Wu Y, Zhang J, Wu J. Death decoy receptor TR6/DcR3 inhibits T cell chemotaxis in vitro and in vivo. J Immunol. 2003;171:3407–3414. doi: 10.4049/jimmunol.171.7.3407. [DOI] [PubMed] [Google Scholar]
- 17.Pitti RM, Marsters SA, Lawrence DA, Roy M, Kischkel FC, Dowd P, Huang A, Donahue CJ, Sherwood SW, Baldwin DT, et al. Genomic amplification of a decoy receptor for Fas ligand in lung and colon cancer. Nature. 1998;396:699–703. doi: 10.1038/25387. [DOI] [PubMed] [Google Scholar]
- 18.Tsuji S, Hosotani R, Yonehara S, Masui T, Tulachan SS, Nakajima S, Kobayashi H, Koizumi M, Toyoda E, Ito D, et al. Endogenous decoy receptor 3 blocks the growth inhibition signals mediated by Fas ligand in human pancreatic adenocarcinoma. Int J Cancer. 2003;106:17–25. doi: 10.1002/ijc.11170. [DOI] [PubMed] [Google Scholar]
- 19.Yu KY, Kwon B, Ni J, Zhai Y, Ebner R, Kwon BS. A newly identified member of tumor necrosis factor receptor superfamily (TR6) suppresses LIGHT-mediated apoptosis. J Biol Chem. 1999;274:13733–13736. doi: 10.1074/jbc.274.20.13733. [DOI] [PubMed] [Google Scholar]
- 20.Hayashi S, Miura Y, Nishiyama T, Mitani M, Tateishi K, Sakai Y, Hashiramoto A, Kurosaka M, Shiozawa S, Doita M. Decoy receptor 3 expressed in rheumatoid synovial fibroblasts protects the cells against Fas-induced apoptosis. Arthritis Rheum. 2007;56:1067–1075. doi: 10.1002/art.22494. [DOI] [PubMed] [Google Scholar]
- 21.Takahashi M, Miura Y, Hayashi S, Tateishi K, Fukuda K, Kurosaka M. DcR3-TL1A signalling inhibits cytokine-induced proliferation of rheumatoid synovial fibroblasts. Int J Mol Med. 2011;28:423–427. doi: 10.3892/ijmm.2011.687. [DOI] [PubMed] [Google Scholar]
- 22.Fukuda K, Miura Y, Maeda T, Takahashi M, Hayashi S, Kurosaka M. Decoy receptor 3 regulates the expression of various genes in rheumatoid arthritis synovial fibroblasts. Int J Mol Med. 2013;32:910–916. doi: 10.3892/ijmm.2013.1461. [DOI] [PubMed] [Google Scholar]
- 23.Fukuda K, Miura Y, Maeda T, Hayashi S, Kurosaka M. Interleukin12B is upregulated by decoy receptor 3 in rheumatoid synovial fibroblasts. Mol Med Rep. 2016;13:3647–3652. doi: 10.3892/mmr.2016.4985. [DOI] [PubMed] [Google Scholar]
- 24.Maeda T, Miura Y, Fukuda K, Hayashi S, Kurosaka M. Decoy receptor 3 regulates the expression of tryptophan hydroxylase 1 in rheumatoid synovial fibroblasts. Mol Med Rep. 2015;12:5191–5196. doi: 10.3892/mmr.2015.4097. [DOI] [PubMed] [Google Scholar]
- 25.Fukuda K, Miura Y, Maeda T, Hayashi S, Kuroda R. Decoy receptor 3 down-regulates centrosomal protein 70 kDa specifically in rheumatoid synovial fibroblasts. Mod Rheumatol. 2018;28:287–292. doi: 10.1080/14397595.2017.1341593. [DOI] [PubMed] [Google Scholar]
- 26.Arnett FC, Edworthy SM, Bloch DA, McShane DJ, Fries JF, Cooper NS, Healey LA, Kaplan SR, Liang MH, Luthra HS. The American Rheumatism Association 1987 revised criteria for the classification of rheumatoid arthritis. Arthritis Rheum. 1988;31:315–324. doi: 10.1002/art.1780310302. [DOI] [PubMed] [Google Scholar]
- 27.Choi YJ, Yun HK. Transcriptional profiles of Rhizobium vitis-inoculated and salicylic acid-treated ‘Tamnara’ grapevines based on microarray analysis. J Plant Biotechnol. 2016;43:37–48. doi: 10.5010/JPB.2016.43.1.37. [DOI] [Google Scholar]
- 28.Chang YC, Chen TC, Lee CT, Yang CY, Wang HW, Wang CC, Hsieh SL. Epigenetic control of MHC class II expression in tumor-associated macrophages by decoy receptor 3. Blood. 2008;111:5054–5063. doi: 10.1182/blood-2007-12-130609. [DOI] [PubMed] [Google Scholar]
- 29.Espinosa I, Catasus L, Canet B, D'Angelo E, Muñoz J, Prat J. Gene expression analysis identifies two groups of ovarian high-grade serous carcinomas with different prognosis. Mod Pathol. 2011;24:846–854. doi: 10.1038/modpathol.2011.12. [DOI] [PubMed] [Google Scholar]
- 30.Khan J, Simon R, Bittner M, Chen Y, Leighton SB, Pohida T, Smith PD, Jiang Y, Gooden GC, Trent JM, Meltzer PS. Gene expression profiling of alveolar rhabdomyosarcoma with cDNA microarrays. Cancer Res. 1998;58:5009–5013. [PubMed] [Google Scholar]
- 31.Whitney LW, Becker KG, Tresser NJ, Caballero-Ramos CI, Munson PJ, Prabhu VV, Trent JM, McFarland HF, Biddison WE. Analysis of gene expression in mutiple sclerosis lesions using cDNA microarrays. Ann Neurol. 1999;46:425–428. doi: 10.1002/1531-8249(199909)46:3<425::AID-ANA22>3.0.CO;2-O. [DOI] [PubMed] [Google Scholar]
- 32.Li J, Yang S, Lu S, Zhao H, Feng J, Li W, Ma F, Ren Q, Liu B, Zhang L, et al. Differential gene expression profile associated with the abnormality of bone marrow mesenchymal stem cells in aplastic anemia. PLoS One. 2012;7(e47764) doi: 10.1371/journal.pone.0047764. [DOI] [PMC free article] [PubMed] [Google Scholar]
- 33.van der Pouw Kraan TC, van Gaalen FA, Kasperkovitz PV, Verbeet NL, Smeets TJ, Kraan MC, Fero M, Tak PP, Huizinga TW, Pieterman E, et al. Rheumatoid arthritis is a heterogeneous disease: Evidence for differences in the activation of the STAT-1 pathway between rheumatoid tissues. Arthritis Rheum. 2003;48:2132–2145. doi: 10.1002/art.11096. [DOI] [PubMed] [Google Scholar]
- 34.Lee SK, Jeon EK, Kim YJ, Seo SH, Kim CD, Lim JS, Lee JH. A global gene expression analysis of the peripheral blood mononuclear cells reveals the gene expression signature in psoriasis. Ann Dermatol. 2009;21:237–242. doi: 10.5021/ad.2009.21.3.237. [DOI] [PMC free article] [PubMed] [Google Scholar]
- 35.Heller RA, Schena M, Chai A, Shalon D, Bedilion T, Gilmore J, Woolley DE, Davis RW. Discovery and analysis of inflammatory disease-related genes using cDNA microarrays. Proc Natl Acad Sci USA. 1997;94:2150–2155. doi: 10.1073/pnas.94.6.2150. [DOI] [PMC free article] [PubMed] [Google Scholar]
- 36.Gough LL, Fan J, Chu S, Winnick S, Beck KA. Golgi localization of Syne-1. Mol Biol Cell. 2003;14:2410–2424. doi: 10.1091/mbc.e02-07-0446. [DOI] [PMC free article] [PubMed] [Google Scholar]
- 37.Apel ED, Lewis RM, Grady RM, Sanes JR. Syne-1, a dystrophin- and Klarsicht-related protein associated with synaptic nuclei at the neuromuscular junction. J Biol Chem. 2000;275:31986–31995. doi: 10.1074/jbc.M004775200. [DOI] [PubMed] [Google Scholar]
- 38.Fan J, Beck KA. A role for the spectrin superfamily member Syne-1 and kinesin II in cytokinesis. J Cell Sci. 2004;117:619–629. doi: 10.1242/jcs.00892. [DOI] [PubMed] [Google Scholar]
- 39.Yang W, Zheng H, Wang Y, Lian F, Hu Z, Xue S. Nesprin-1 plays an important role in the proliferation and apoptosis of mesenchymal stem cells. Int J Mol Med. 2013;32:805–812. doi: 10.3892/ijmm.2013.1445. [DOI] [PubMed] [Google Scholar]
- 40.Davis RS. Fc receptor-like molecules. Annu Rev Immunol. 2007;25:525–560. doi: 10.1146/annurev.immunol.25.022106.141541. [DOI] [PubMed] [Google Scholar]
- 41.Shabani M, Bayat AA, Jeddi-Tehrani M, Rabbani H, Hojjat-Farsangi M, Ulivieri C, Amirghofran Z, Baldari CT, Shokri F. Ligation of human Fc receptor like-2 by monoclonal antibodies down-regulates B-cell receptor-mediated signalling. Immunology. 2014;143:341–353. doi: 10.1111/imm.12311. [DOI] [PMC free article] [PubMed] [Google Scholar]
- 42.Nückel H, Collins CH, Frey UH, Sellmann L, Dürig J, Siffert W, Dührsen U. FCRL2 mRNA expression is inversely associated with clinical progression in chronic lymphocytic leukemia. Eur J Haematol. 2009;83:541–549. doi: 10.1111/j.1600-0609.2009.01328.x. [DOI] [PubMed] [Google Scholar]
- 43.Jackson TA, Haga CL, Ehrhardt GR, Davis RS, Cooper MD. FcR-like 2 Inhibition of B cell receptor-mediated activation of B cells. J Immunol. 2010;185:7405–7412. doi: 10.4049/jimmunol.1002305. [DOI] [PMC free article] [PubMed] [Google Scholar]
- 44.Li FJ, Ding S, Pan J, Shakhmatov MA, Kashentseva E, Wu J, Li Y, Soong SJ, Chiorazzi N, Davis RS. FCRL2 expression predicts IGHV mutation status and clinical progression in chronic lymphocytic leukemia. Blood. 2008;112:179–187. doi: 10.1182/blood-2008-01-131359. [DOI] [PMC free article] [PubMed] [Google Scholar]
- 45.Stamatopoulos B, Haibe-Kains B, Equeter C, Meuleman N, Sorée A, De Bruyn C, Hanosset D, Bron D, Martiat P, Lagneaux L. Gene expression profiling reveals differences in microenvironment interaction between patients with chronic lymphocytic leukemia expressing high versus low ZAP70 mRNA. Haematologica. 2009;94:790–799. doi: 10.3324/haematol.2008.002626. [DOI] [PMC free article] [PubMed] [Google Scholar]
- 46.Khanzadeh A, Habibagahi Z, Hosseini A, Amirghofran Z. Investigation of the human FCRL1, 2, and 4 gene expressions in patients with rheumatoid arthritis. Rheumatol Int. 2016;36:1149–1156. doi: 10.1007/s00296-016-3495-2. [DOI] [PubMed] [Google Scholar]
- 47.Stehlik C, Krajewska M, Welsh K, Krajewski S, Godzik A, Reed JC. The PAAD/PYRIN-only protein POP1/ASC2 is a modulator of ASC-mediated nuclear-factor-kappa B and pro-caspase-1 regulation. Biochem J. 2003;373:101–113. doi: 10.1042/BJ20030304. [DOI] [PMC free article] [PubMed] [Google Scholar]
- 48.Stehlik C. The PYRIN domain in signal transduction. Curr Protein Pept Sci. 2007;8:293–310. doi: 10.2174/138920307780831857. [DOI] [PMC free article] [PubMed] [Google Scholar]
- 49.Martinon F, Tschopp J. Inflammatory caspases: Linking an intracellular innate immune system to autoinflammatory diseases. Cell. 2004;117:561–574. doi: 10.1016/j.cell.2004.05.004. [DOI] [PubMed] [Google Scholar]
- 50.Hopwood B, Dalton S. Cdc45p assembles into a complex with Cdc46p/Mcm5p, is required for minichromosome maintenance, and is essential for chromosomal DNA replication. Proc Natl Acad Sci USA. 1996;93:12309–12314. doi: 10.1073/pnas.93.22.12309. [DOI] [PMC free article] [PubMed] [Google Scholar]
- 51.Sun J, Shi R, Zhao S, Li X, Lu S, Bu H, Ma X. Cell division cycle 45 promotes papillary thyroid cancer progression via regulating cell cycle. Tumour Biol. 2017;39(1010428317705342) doi: 10.1177/1010428317705342. [DOI] [PubMed] [Google Scholar]
- 52.Pollok S, Bauerschmidt C, Sänger J, Nasheuer HP, Grosse F. Human Cdc45 is a proliferation-associated antigen. FEBS J. 2007;274:3669–3684. doi: 10.1111/j.1742-4658.2007.05900.x. [DOI] [PubMed] [Google Scholar]
- 53.Wang Y, Duan X, Zhang Z. Interleukin-1 receptor-associated kinase 1 correlates with metastasis and invasion in endometrial carcinoma. J Cell Biochem. 2018;119:2545–2555. doi: 10.1002/jcb.26416. [DOI] [PubMed] [Google Scholar]
- 54.Majri SS, Fritz JM, Villarino AV, Zheng L, Kanellopoulou C, Chaigne-Delalande B, Grönholm J, Niemela JE, Afzali B, Biancalana M, et al. STAT5B: A differential regulator of the life and death of CD4+ effector memory T cells. J Immunol. 2018;200:110–118. doi: 10.4049/jimmunol.1701133. [DOI] [PMC free article] [PubMed] [Google Scholar]
- 55.Darnell JE Jr. STATs gene regulation. Science. 1997;277:1630–1635. doi: 10.1126/science.277.5332.1630. [DOI] [PubMed] [Google Scholar]
- 56.O'Shea JJ, Lahesmaa R, Vahedi G, Laurence A, Kanno Y. Genomic views of STAT function in CD4+ T helper cell differentiation. Nat Rev Immunol. 2011;11:239–250. doi: 10.1038/nri2958. [DOI] [PMC free article] [PubMed] [Google Scholar]
- 57.Villarino AV, Kanno Y, Ferdinand JR, O'Shea JJ. Mechanisms of Jak/STAT signaling in immunity and disease. J Immunol. 2015;194:21–27. doi: 10.4049/jimmunol.1401867. [DOI] [PMC free article] [PubMed] [Google Scholar]
- 58.Grimley PM, Dong F, Rui H. Stat5a and Stat5b: Fraternal twins of signal transduction and transcriptional activation. Cytokine Growth Factor Rev. 1999;10:131–157. doi: 10.1016/S1359-6101(99)00011-8. [DOI] [PubMed] [Google Scholar]
- 59.Kanai T, Jenks J, Nadeau KC. The STAT5b pathway defect and autoimmunity. Front Immunol. 2012;3(234) doi: 10.3389/fimmu.2012.00234. [DOI] [PMC free article] [PubMed] [Google Scholar]
- 60.Nadeau K, Hwa V, Rosenfeld RG. STAT5b deficiency: An unsuspected cause of growth failure, immunodeficiency, and severe pulmonary disease. J Pediatr. 2011;158:701–708. doi: 10.1016/j.jpeds.2010.12.042. [DOI] [PubMed] [Google Scholar]
- 61.Zare F, Dehghan-Manshadi M, Mirshafiey A. The signal transducer and activator of transcription factors lodge in immunopathogenesis of rheumatoid arthritis. Reumatismo. 2015;67:127–137. doi: 10.4081/reumatismo.2015.851. [DOI] [PubMed] [Google Scholar]
- 62.Okada Y, Wu D, Trynka G, Raj T, Terao C, Ikari K, Kochi Y, Ohmura K, Suzuki A, Yoshida S, et al. Genetics of rheumatoid arthritis contributes to biology and drug discovery. Nature. 2014;506:376–381. doi: 10.1038/nature12873. [DOI] [PMC free article] [PubMed] [Google Scholar]
- 63.Xu WD, Pan HF, Ye DQ, Xu Y. Targeting IRF4 in autoimmune diseases. Autoimmun Rev. 2012;11:918–924. doi: 10.1016/j.autrev.2012.08.011. [DOI] [PubMed] [Google Scholar]
- 64.Biswas PS, Gupta S, Stirzaker RA, Kumar V, Jessberger R, Lu TT, Bhagat G, Pernis AB. Dual regulation of IRF4 function in T and B cells is required for the coordination of T-B cell interactions and the prevention of autoimmunity. J Exp Med. 2012;209:581–596. doi: 10.1084/jem.20111195. [DOI] [PMC free article] [PubMed] [Google Scholar]
- 65.Hwang ES. Transcriptional regulation of T helper 17 cell differentiation. Yonsei Med J. 2010;51:484–491. doi: 10.3349/ymj.2010.51.4.484. [DOI] [PMC free article] [PubMed] [Google Scholar]
Associated Data
This section collects any data citations, data availability statements, or supplementary materials included in this article.
Data Availability Statement
The datasets generated and analyzed during the current study are available in the NCBI GEO repository and are accessible through GEO series accession no. GSE118958, (https://www.ncbi.nlm.nih.gov/geo/query/acc.cgi?acc=gse118958).