Abstract
Medical records are text documents recording diagnoses, symptoms, examinations, etc. They are accompanied by ICD codes (International Classification of Diseases). ICD is the bedrock for health statistics, which maps human condition, injury, disease etc. to codes. It has enormous financial importance from public health investment to health insurance billing. However, assigning codes to medical records normally needs a lot of human labour and is error-prone due to its complexity. We present a 3-layer attentional convolutional network based on the hierarchy structure of ICD code that predicts ICD codes from medical records automatically. The method shows high performance, with Hit@1 of 0.6969, and Hit@5 of 0.8903, which is better than state-of-the-art method.
Introduction
With the rapid increase of electronic medical records (EMRs) in China recently, precise analysis based on these data has become urgent. ICD code assignment is one of the most valuable and challenging tasks. ICD code has various usages, including medical reimbursement, administration and health service research1. With the vigorously promotion of Diagnosis Related Groups (DRGs) in China2, higher attention has been paid to ICD coding since ICD code is a key factor for DRGs. A little mistake in the code assignment can lead to huge difference in insurance payment. In addition, it is also required to include ICD codes in the first page of hospital medical record. Therefore, ICD coding is of great importance.
In China, the code assignment task still heavily relies on trained staff with good knowledge of medical terminologies and coding rules3. However, Chinese DRG system has a short history comparing with developed countries like US. Some hospitals just begin to pay attention to ICD coding in recent years. There is a big lack in professional coders. Some of them even have no specialized coders. People who do the ICD coding job also hold other post simultaneously. Even with enough professional coders in hospital, there are also other problems. No third-party has enough resource to perfectly supervise the correctness of ICD codes. So some hospitals tend to mis-code slight illness on purpose with ICD codes representing more serious diseases to get higher payment from insurance. Another problem is that different provinces use different ICD standards in China. These standards are similar, all based on ICD-10, but still have minor difference with each other, which make it difficult to communicate among the whole country.
Therefore, it would be of great benefit to have a standard automatic method to assign ICD codes precisely, efficiently and simple to use. There have been lots of research and attempts in this field. However, few of them take use of the hierarchy structure of ICD code and these methods mainly focus on English dataset. In this paper, we present a hierarchical method based on neural network which takes the hierarchy structure of ICD code into account. The performance of our method is better than the state-of-the-art model on our Chinese dataset.
Related Work
ICD code assignment is a long-standing task in the field of medical information. There have been lots of methods including rule-based, similarity-based4 and traditional machine-learning-based methods such as logistic regression and support vector machine5. Chen et al. (2017)4 use an improved Longest Common Subsequence (LCS) to calculate the similarity between each diagnose and ICD code description, then chose the most similar code. Ning et al. (2016)3 also use similarity-based method, but they do it in a hierarchical way. There are 3-digit, 4-digit and 6-digit ICD codes. They begin the similarity calculation from 3-digit codes. Only if the similarity of a 3-digit code is greater than a certain threshold, its child nodes (4-digit codes) will be calculated. The process is in a similar fashion for 6-digit codes.
With the rapid development of deep learning, several recent approaches employed deep neural networks have also been put forward. Baumel et al. (2017)6 put forward HA-GRU (Hierarchical Attention- bidirectional Gated Recurrent Unit), which uses both word-level and sentence-level GRU with attention mechanism. Shi et al. (2017)7 use character-level and word-level recurrent neural network to obtain the representation of diagnosis and use standard ICD descriptions to calculate attention weights for each diagnose. Prakash et al. (2016)8 use the memory network architecture.
Among these methods, Mullenbach’s method9, which is based on convolutional neural network and attention mechanism, achieves state-of-the-art performance on the MIMIC (Medical Information Mart for Intensive Care) dataset10. They also claim that convolution-based models are more effective and more computationally efficient than recurrent neural networks. In our method, we employ this model as a baseline model.
Methods
Dataset and Preprocessing
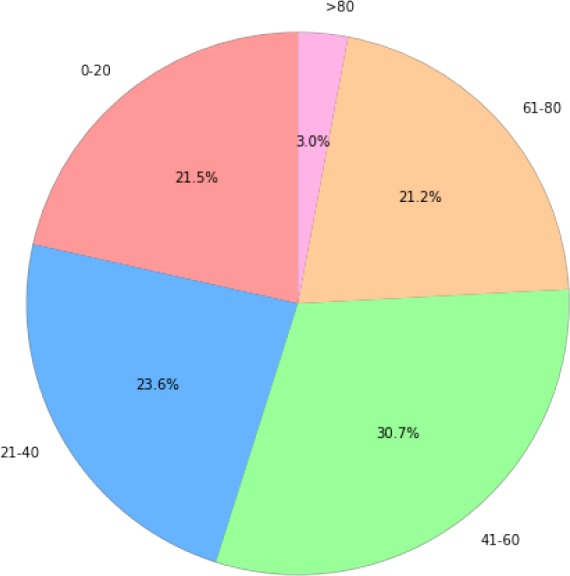
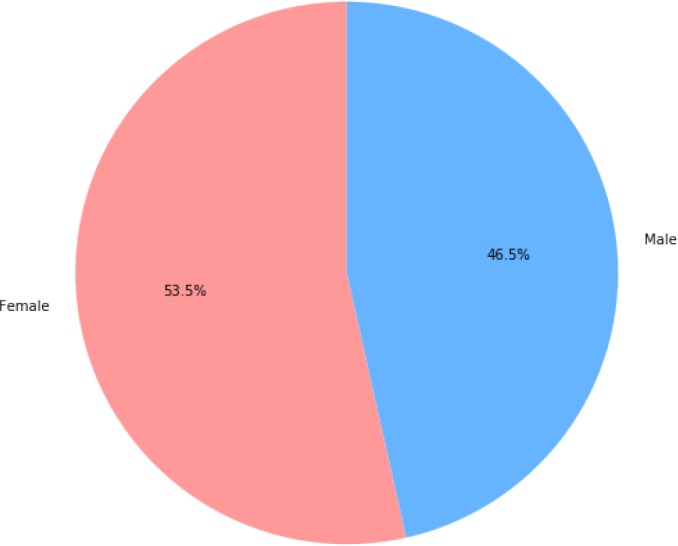
There are barely any public EMR datasets in Chinese, hence we use an internal dataset for our experiment. In this section, the dateset will be introduced in detail. The dataset contains 242,877 semi-structured records and 182,264 unique patients. Distributions of age and gender are illustrated in Figure 1 and Figure 2. For each record, the main diagnose, which we mainly focus on, has already been extracted. One main diagnose has exact exact one corresponding ICD code at all levels (one 3-digit, one 4-digit and one 6-digit). This is due to the format of our data. All the corresponding ICD codes belong to ICD-1011. Among all the records, there are 6,328 different codes covered in total. For example, one diagnose is “ 急性右侧脑桥梗塞”, which means “Acute right bridge cerebral infarction”. Its assigned code is I63.900, and the corresponding description is “ 脑梗死”, which means “cerebral infarction”. This is a relatively explicit and simple example. There are lots of diagnosis containing wrongly written words, ambiguity and special characters, which makes the code assigning process difficult.
Figure 1:

Distribution of age in the dataset
Figure 2:

Distribution of gender in the dataset
During data preprocessing, we follow standard NLP (natural language processing) steps for Chinese language. Chinese is different from English in that there is no delimiters between words in Chinese text, hence word segmentation is required. We use a python library called jieba12, which means “stammer” in Chinese. It is one of the maturest Chinese word segmentation tools. We also use a dictionary containing about 100,000 medical terms to enhance the segmentation performance for EMR. In addition, we remove some characters and stop words that could affect the performance. For example, in “1、子宫内膜癌术后化疗后 b 期 G2”, “1、” is removed. In total, there are 1,958,463 tokens (words) and 14,824 types (unique words). After preprocessing, we get a dataset with various-length diagnoses. The longest diagnosis has 95 words and the shortest has only 1 word. We then split the dataset into train, test and validation set by the ratio of 0.8/0.1/0.1.
Besides the main diagnose, there are some other information in the original data that may be useful. We choose age, gender and admission department as additional features. We concatenate the text of these features with the text of main diagnose. For example, If the gender is “male” and the diagnose is “diabetes”, we concatenate them together as “male, diabetes”. We did experiment on both data with and without features. The result turns out that these features can improve the performance, which will be discussed in detail later.
Model Design
The neural network model we present in this paper is named Hierarchical Convolutional Attention for Multi-Label classification (HCAML). It takes the hierarchy nature of ICD code into consideration by using three modules. The three modules have similar architectures and they share parts of the parameters. The architecture of each module is based on CAML (Convolutional Attention for Multi-Label classification) introduced by Mullenbach et al. (2018)9, which mainly uses a convolution layer and attention layer.
CAML
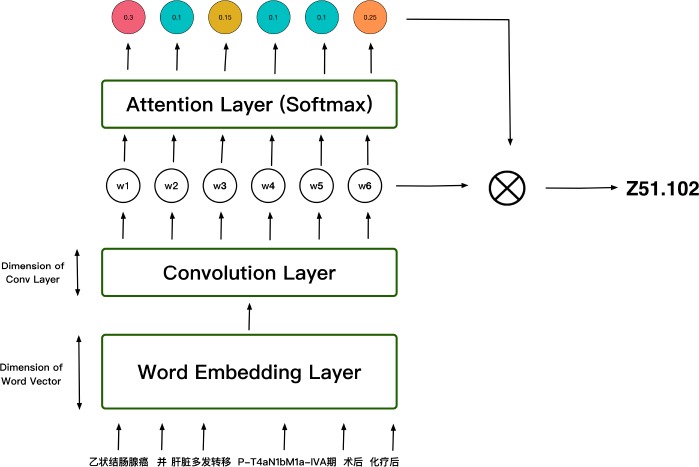
We will first introduce the sub-model of our system - CAML. As can be seen in Figure 3, each word (in the format of one-hot) is sent into the word embedding layer to obtain the corresponding word vector, which is a low-dimensional, dense representation of the word. Then these word vectors are horizontally concatenated into a matrix X = [x1, x2, …, xN], where N is the total amount of words in a diagnose. After word embedding, we use a 1d-convolution layer to combine adjacent word embeddings. We define k as the filter width, de as the size of the input embedding and dc as the size of the output. It should be noted that the input matrix X should be padded to ensure the output has the same length as N. The resulting matrix H = [w1, w2, …, wN] has dimension .
Figure 3:
Architecture of CAML
Next step is calculating attention weights for each ICD label l. For each ICD label, for example Z51.102, we assign a vector ul, where ul ∈ , to calculate the attention weights for this ICD label. ul is randomly initialized at the beginning, and will be learned during training process. To get the attention weights, we do the computation HT ul. The resulting vector, which has dimension R1×N is then passed through a softmax operator in order to obtain a distribution over each word in the diagnose:
αl is the attention weights vector for each ICD label l, where αl ∈ ℝN. αl shows the importance of each word in the diagnose(one diagnose has N words). For example, αl,j means the importance of the jth word in the diagnose. αl is then used to compute vector representations for each label:
After we obtain the vector representation vl, we can then compute the probability for label l using a linear layer and a sigmoid activation function:
where βl ∈ ℝdc is the weights parameter and bl is the bias.
HCAML
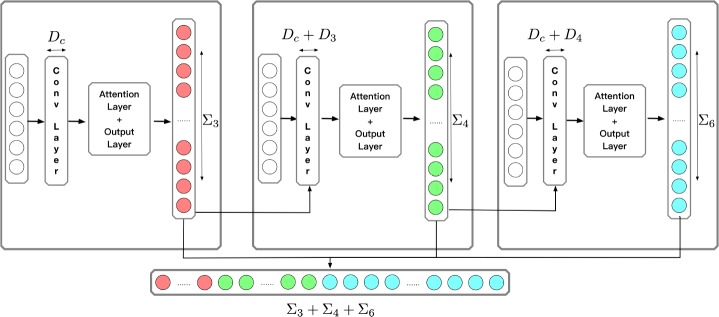
HCAML consists of three basic CAML networks. The general structure is illustrated in Figure 4. There are three modules, which are responsible for predicting 3-digit, 4-digit and 6-digit codes respectively.
Figure 4:
Architecture of HCAML
The first module is same as CAML except that it predicts 3-digit code, which means smaller search space. In our dateset, there are 1,222 different 3-digit codes in total. For the second module, we concatenate the output of first module P1 ∈ ℝ1×L3 to the output of the convolution layer. Suppose the output of the convolution layer is H = [w1, w2, …, wN]. We concatenate P1 to each wn. For whole H, we get H* = [concat(w1, P1), concat(w2, P1), …, concat(wN, P1)]. Then H* is passed through the attention layer and the output layer to obtain the prediction of 4-digit code P2 ∈ ℝ1×L4. For the third module, we do similar thing as the second module. P2 is concatenated to the output of the convolution layer.
These 3 modules share the same convolution layer, but each module has an independent attention layer and output layer. The final output ŷ is the concatenation of each module’s output.
Training
The true label y is an one-hot representation. We concatenate 3-digit, 4-digit and 6-digit code together, which means y contain all ICD labels including 3-digit ICD label, 4-digit ICD label and 6-digit ICD label. y ∈ ℝL, where L = L3 + L4 + L6, where L3 means the number of 3-digit codes, L4 and L6 are similar. We use ŷ and y for loss calculation,
During training, gradients are back-propagated in the order of module 3, module 2 and module 1. Parameters of the convolution layer are updated three times, since the three modules share the same convolution layer.
Evaluation
We evaluate performance of the model on 6-digit codes. The metrics we use are Hit@1 (the prediction with the highest probability is exactly the true label), Hit@5 (true label in the predictions with top 5 highest probabilities) and AUC (area under the ROC curve). There are mainly two different application scenarios for an automatic ICD Assignment tool. One is assigning codes automatically and the other is assisting professional staff by narrowing the searching range. Since there are over 20,000 6-digit different codes in ICD-1011. We evaluate HIT@1 for the first purpose and HIT@5 for the second purpose. AUC is a useful metric for both purposes.
We also do experiments on various hyper-parameter settings. Detailed results will be discussed in the following section.
Results and Discussion
We set CAML as our baseline model, and we also compared results between employing pretrained word embeddings and random initialization. The pretrained word embeddings are trained using Word2Vec13 on our data.
We fine-tune various hyper-parameters, including learning rate (LR), filter size (k, the size of convolution kernel) and number of feature maps (dc, the number of convolution kernels, which is also the output size of the convolution layer). Other experiment configurations are listed in Table 2.
Table 2:
Experiment configurations
| Device | NVIDIA Tesla P100 * 1 |
|---|---|
| Programming Language | Python 3.6 |
| Framework | PyTorch 0.3.1 |
| Embedding Size | 200 |
| Dropout Ratio | 0.5 |
| Batch Size | 64 |
| Optimizer | Adam |
We feel that Hit@1 and Hit@5 are the most two important metrics, since Hit@1 means the ability of the system to code automatically and Hit@5 means the ability to recommend a high confident small subset to doctors for their further manual coding.
For plain CAML, it gets its best performance Hit@1 = 0.6870 and Hit@5 = 0.8818, when k = 5 and dc = 50. HCAML gets its best performance Hit@1 = 0.6969 and Hit@5 = 0.8903, when k = 7 and dc = 50
For both CAML and HCAML, the performance grows worse as dc grows. This means dc = 50 is enough to catch the key feature of out data, and bigger dc will lead our model to over-fitted. As for parameter k, the result is pretty interesting. k is the kernel size of the convolution layer, which means how many words in the origin text will be involved in one element of the output matrix of the convolution layer. At the beginning we thought the best k will be same for both CAML and HCAML, since the input text is same for them. However they get the best performance at k = 5 and k = 7. The reason may be that since HCAML is more complex than CAML, HCAML may need longer dependence of the origin text.
Comparing CAML and HCAML, we find that HCAML works better than CAML in all situations. The best performance of HCAML is 1% and 0.9% higher than CAML in Hit@1 and Hit@5 respectively. Even in condition of k = 5 and dc = 50, where CAML performs best, HCAML is still better than CAML. This means that the hierarchy structure is very important to ICD coding. Encoding ICD in a hierarchy way, which is also the human’s way to do ICD coding, can help improve the performance.
For the experiments listed in Table 1, we use data with extra features (age, sex and admission department). We also do experiments on data without features (only diagnosis) and the results are listed in Table 3. We report results under both models’ best hyper-parameter settings. It turns out that adding additional features significantly improve the performance of CAML with Hit@1 increased from 0.6611 to 0.687 and Hit@5 increased from 0.8432 to 0.8818. However, adding features does not improve HCAML’s performance.
Table 1:
Experiment results using features (L_R means learning rate)
| MODEL | FILTER_SIZE(k) | FEATURE_MAPS(dc) | L_R | HIT@1 | HIT@5 | AUC |
|---|---|---|---|---|---|---|
| CAML | 10 | 50 | 0.0001 | 0.6758 | 0.8739 | 0.9538 |
| CAML | 10 | 50 | 0.001 | 0.6739 | 0.8647 | 0.9186 |
| CAML | 5 | 50 | 0.0001 | 0.6870 | 0.8818 | 0.9376 |
| CAML | 7 | 50 | 0.0001 | 0.6704 | 0.8604 | 0.9354 |
| CAML | 10 | 250 | 0.0001 | 0.6449 | 0.8445 | 0.9549 |
| CAML | 10 | 500 | 0.0001 | 0.5548 | 0.7961 | 0.9489 |
| HCAML | 11 | 50 | 0.0001 | 0.6905 | 0.8893 | 0.9539 |
| HCAML | 11 | 50 | 0.001 | 0.6579 | 0.8585 | 0.9225 |
| HCAML | 5 | 50 | 0.0001 | 0.6893 | 0.8895 | 0.9487 |
| HCAML | 7 | 50 | 0.0001 | 0.6969 | 0.8903 | 0.9496 |
| HCAML | 11 | 250 | 0.0001 | 0.6729 | 0.8691 | 0.9588 |
| HCAML | 11 | 500 | 0.0001 | 0.6101 | 0.8256 | 0.9446 |
Table 3:
Experiments results of using features and not using features for both CAML and HCAML under their best hyper-parameters
| MODEL | HIT@1 | HIT@5 | AUC |
|---|---|---|---|
| CAML | 0.6611 | 0.8432 | 0.9444 |
| CAML+Features | 0.687 | 0.8818 | 0.9376 |
| HCAML | 0.6974 | 0.8918 | 0.9514 |
| HCAML+Features | 0.6969 | 0.8903 | 0.9496 |
It also should be mentioned that although this task is a single-label classification task, our model can be easily extended for multi-label task by setting a threshold to the output of final layer and choose those codes with probabilities larger than it.
Conclusions and Future Work
To sum up, in this paper we present a hierarchical neural network (HCAML) for automatic ICD code assignment, which uses the hierarchy character of ICD codes to enhance the performance of the baseline model (CAML). By using this architecture, we can choose freely what to output among 3-digit, 4-digit and 6-digit codes. In addition, The result of shorter code can be used to increase the accuracy of longer code. Our hierarchical model outperforms the baseline model, which is the state-of-the-art model, on our Chinese dataset.
For future work, directions would be exploiting full text of EMRs and consider more useful information for ICD code assignment task. When human experts assign ICD codes for EMRs, they normally consider not only diagnosis, but also other information such as medical history and lab tests. In addition, it could also be helpful to analyze grammar and syntax of the text of EMR and using it as additional features. In terms of model structure, we could assign different punishment to code with different length. For example, if the 3-digit code is wrong, we can punish this result heavier, since the model classify the diagnose totally wrong. If only the 6-digit code is wrong, we can punish this result lighter, since the model classify the code in a correct direction, only the detail is wrong. Punishment could be fixed or dynamic which are updated through training.
References
- 1.O'Malley Kimberly J., Cook Karon F., Price Matt D., Wildes Kimberly Raiford, Hurdle John F., Ashton Carol M. Measuring diagnoses: ICD code accuracy. 2005 doi: 10.1111/j.1475-6773.2005.00444.x. [DOI] [PMC free article] [PubMed] [Google Scholar]
- 2.Liu Rui, Shi Jianwei, Yang Beilei, Jin Chunlin, Sun Pengfei, Wu Lingfang, Yu Dehua, Xiong Linping, Wang Zhaoxin. Charting a path forward: Policy analysis of China’s evolved DRG-based hospital payment system. International Health. 2017 doi: 10.1093/inthealth/ihx030. [DOI] [PMC free article] [PubMed] [Google Scholar]
- 3.Wenxin Ning, Yu Ming, Runtong Zhang. A hierarchical method to automatically encode Chinese diagnoses through semantic similarity estimation. BMC Medical Informatics and Decision Making. 2016;16(1):1–12. doi: 10.1186/s12911-016-0269-4. [DOI] [PMC free article] [PubMed] [Google Scholar]
- 4.Chen YunZhi, Lu HuiJuan, Li LanJuan. Automatic ICD-10 coding algorithm using an improved longest common subsequence based on semantic similarity. Plos One. 2017;12(3):e0173410. doi: 10.1371/journal.pone.0173410. [DOI] [PMC free article] [PubMed] [Google Scholar]
- 5.Perotte Adler, Pivovarov Rimma, Natarajan Karthik, Weiskopf Nicole, Wood Frank, Elhadad Noémie. Diagnosis code assignment: Models and evaluation metrics. Journal of the American Medical Informatics Association. 2014 doi: 10.1136/amiajnl-2013-002159. [DOI] [PMC free article] [PubMed] [Google Scholar]
- 6.Baumel Tal, Nassour-Kassis Jumana, Cohen Raphael, Elhadad Michael, Elhadad No’emie. Multi-Label Classification of Patient Notes a Case Study on ICD Code Assignment. 2017 [Google Scholar]
- 7.Shi Haoran, Xie Pengtao, Hu Zhiting, Zhang Ming, Xing Eric P. Towards Automated ICD Coding Using Deep Learning. 2017:1–11. [Google Scholar]
- 8.Prakash Aaditya, Zhao Siyuan, Hasan Sadid A., Datla Vivek, Lee Kathy, Qadir Ashequl, Liu Joey, Farri Oladimeji. Condensed Memory Networks for Clinical Diagnostic Inferencing. 2016:3274–3280. [Google Scholar]
- 9.Mullenbach James, Wiegreffe Sarah, Duke Jon, Sun Jimeng, Eisenstein Jacob. Explainable Prediction of Medical Codes from Clinical Text. 2018 [Google Scholar]
- 10.Johnson Alistair E.W., Pollard Tom J., Shen Lu, Lehman Li Wei H., Feng Mengling, Ghassemi Mohammad, Moody Benjamin, Szolovits Peter, Celi Leo Anthony, Mark Roger G. MIMIC-III, a freely accessible critical care database. Scientific Data. 2016 doi: 10.1038/sdata.2016.35. [DOI] [PMC free article] [PubMed] [Google Scholar]
- 11.WHO. Icd-10. http://apps.who.int/classifications/icd10/browse/2016/en. Accessed: 2018-08-01.
- 12.GitHub. jieba. https://github.com/fxsjy/jieba. Accessed: 2018-08-01.
- 13.Mikolov Tomas, Corrado Greg, Chen Kai, Dean Jeffrey. Efficient Estimation of Word Representations in Vector Space; Proceedings of the International Conference on Learning Representations (ICLR 2013); 2013. [Google Scholar]


