

Abstract
Age-related Macular Degeneration (AMD) is a leading cause of blindness. Although the Age-Related Eye Disease Study group previously developed a 9-step AMD severity scale for manual classification of AMD severity from color fundus images, manual grading of images is time-consuming and expensive. Built on our previous work DeepSeeNet, we developed a novel deep learning model for automated classification of images into the 9-step scale. Instead of predicting the 9-step score directly, our approach simulates the reading center grading process. It first detects four AMD characteristics (drusen area, geographic atrophy, increased pigment, and depigmentation), then combines these to derive the overall 9-step score. Importantly, we applied multi-task learning techniques, which allowed us to train classification of the four characteristics in parallel, share representation, and prevent overfitting. Evaluation on two image datasets showed that the accuracy of the model exceeded the current state-of-the-art model by > 10%. Availability: https://github.com/ncbi-nlp/DeepSeeNet.
Introduction
Age-related Macular Degeneration (AMD) is responsible for 9% of blindness worldwide but is the leading cause in developed countries. The number of patients diagnosed with AMD worldwide is projected to increase to 288 million by 20401. Based on clinical features, the disease is classified into early, intermediate, and advanced stages2. Advanced AMD, which is often associated with severe visual loss, can occur in two forms: geographic atrophy (or ‘dry’) and neovascular (or ‘wet’) AMD.
To determine the severity of non-advanced AMD, color fundus photographs are graded on a scale of 1–9. Additional steps on the scale (10–12) are sometimes used to grade advanced AMD3. However, human grading using this severity scale requires trained expert graders and is highly time-consuming4, and usually only performed at dedicated reading centers. This has limited the use of this severity scale to a research tool, rather than as part of the clinical care of patients5; even so, researchers need access to reading centers, which can be very expensive in the case of large studies. Therefore there is currently an unmet need for algorithms that can perform automated grading of AMD severity from color fundus photographs, which will be helpful both for research decision-making in both research and clinical practice.
Early retinal image classification systems of color fundus photographs had adopted traditional machine learning with human-engineered features6. Subsequently, later systems used deep learning methods as feature extractors7. Deep learning has revolutionized the computer vision domain8, and has become the state-of-the-art approach for medical image classification9–13. To date, several groups have applied deep learning methods to AMD severity classification using color fundus photographs7. The state-of-the-art method, recently reported by Grassmann et al.14, treated this task as an image classification problem. The approach of these authors was to use six individual models (AlexNet8, GoogLeNet15, VGG16, Inception-V317, ResNet18 and Inception-ResNet-V219), each trained from scratch. Each model directly predicted the step on the Age-Related Eye Disease Study (AREDS) severity scale 1-12 from the color fundus photograph (i.e., six separate predictions), then a random forest approach was employed to combine the predictions into one overall prediction.
However, direct classification of images into the AREDS severity scale does not reflect normal human grading practice. In reading centers, rather than grade color fundus photographs directly, certified graders first calculate individual scores for four separate AMD characteristics (drusen area, geographic atrophy, increased pigment, and depigmentation), then combine the scores for these four characteristics into the 9-step non-advanced AREDS severity scale3. The method for combining these scores into the AREDS severity scale is shown in Table 1. For example, for one color fundus photograph, if the drusen area is 1 and geographic atrophy, increased pigment, and depigmentation are all absent (assigned 0), then the AREDS severity scale is defined as 2 for that image. Graders also check separately for additional characteristics of advanced AMD (scale 10-12), and revise the severity scores if necessary. Hence, a deep learning approach that predicts the overall AREDS severity score directly (as in Grassmann et al.14), without these intermediate steps, may have lower transparency and decreased information content for research and clinical purposes20, 21.
Table 1:
AREDS Severity Scale scores 1 to 9, defined by graders from four categories: geographic atrophy (0/1, i.e., absent/present), increased pigment (0/1, i.e., absent/present), depigmentation (graded 0-3), and drusen area (graded 0-5). The final AREDS Severity Scale score (steps 1-9, shown shaded in different colors) is defined by the combination of findings from these four categories.
 |
To address these potential criticisms, we designed a novel deep learning approach, which mirrors more closely the way that human graders in reading centers perform grading according to the AREDS severity scale. We have focused on the classification of non-advanced AMD (scale 1-9), because this was the original intention of the AMD severity scale (i.e., to predict risk of progression to advanced AMD).
Intuitively, we can design four deep learning models (each of which is responsible for the classification of an individual characteristic) and train them separately, which is called single-task learning. Indeed, we previously designed DeepSeeNet, a deep learning model for the classification of AMD (at the patient level) that uses single-task learning22. However, these four variables are related; training separately may cause the model not to benefit from shared features (from the other variables) and may overfit to specific variables. Instead, we created a multi-task deep learning model that trains the classification of the four characteristics simultaneously. Multi-task learning allowed us to exploit the similarities and differences between the four characteristics, via the shared deep learning model layers, and also allowed us to reduce losses from specific tasks23. While multi-task learning has been successfully used in computer vision24, 25 and natural language processing applications26, 27, to the best of our knowledge, this is the first report that has employed a multi-task learning model in AMD classification.
For the evaluation of our model’s robustness and generalizability, two datasets were used. One was from the AREDS, which includes a large dataset of color fundus photographs (publicly available, on request). The other was a newly created dataset, from the AREDS2. The results of our experiments, using these two datasets via 5-fold cross-validations, demonstrated that our model performed consistently better than the state-of-art model (from Grassmann et al.14). In particular, the F1-score and accuracy were ∼ 5% and ∼ 4% higher in our model, respectively, in terms of absolute differences. Furthermore, the model explains the final classification outcome by providing the intermediate results regarding the four separate characteristics, which may be useful for research or clinical purposes.
Our deep learning model and data partition are publicly available†. To the best of our knowledge, this is the first study in the field of AMD severity scale classification to make these elements publicly available. The goal is to allow for transparency and reproducibility of this approach, so that this model may serve as a benchmark method to allow for further advancement of state-of-the-art techniques.
Methods
Architecture of AMD characteristics
The proposed method first grades the four characteristics (i.e., drusen area, geographic atrophy, increased pigment, and depigmentation), then calculates the overall AREDS Severity Scale score, based on the definitions described in Table 1. The deep learning model for each AMD characteristic contains three components (Figure 1). Component 1 consists of 10 Inception-V3 blocks, to capture image features19. On top of it, Component 2 consists of three layers: a global average pooling layer, a dense layer of dimension 1024, and a dropout layer. The global average pooling layer was applied to capture more informative features by enforcing the correspondence between features and classes28. The dropout layer was used to reduce overfitting29. Component 3 consists of four layers: a dense layer of dimension 256, a dropout layer, another dense layer of dimension 128, and a softmax layer; Component 3 is similar to the structure of our previous work. Components 1 and 2 form the basis of the transfer learning; in medical image classification, most methods use well-established architectures and add customized layers on top9. Component 3 is used for multi-task learning, such that each individual task shares the common layers (Components 1 and 2) and has its own task-specific layers (Component 3).
Figure 1:

The multi-task deep learning model for classification of age-related macular degeneration using the Age-Related Eye Disease Study Severity Scale.
Image pre-processing
We manually examined the color fundus photographs and found that the images tended to have a relatively large area of black background, as well as large variations in brightness, which might adversely affect classification. For these reasons, image pre-processing was performed using three steps: (1) applying a Gaussian filter, with (0, 0) as Gaussian kernel size and (1000/30, 0) as Gaussian kernel standard deviation, to normalize the color balance (i.e., using similar methods to Grassmann et al.14), (2) cropping the images to a square shape, and (3) scaling the square images to 512×512 pixels. Figure 2 shows an example of an image before and after pre-processing.
Figure 2:

An example of (a) the original image, and (b) the pre-processed color fundus photograph.
Training process
We used data augmentation on the training set to enhance the robustness and generalizability of our model8. Specifically, each image in the training set was rotated randomly up to 180 degrees and flipped vertically or horizontally.
We trained our model using the Adam optimizer30 with binary cross-entropy or categorical cross-entropy loss functions, and a mini-batch size of 16. For the Adam optimizer, we set the learning rate to 0.0001, beta1 to 0.9 and beta2 to 0.999. In addition, we applied dropout of 0.5 in the shared and task-specific layers. For weight initialization, pre-trained weights from the Inception-V3 network trained on the ImageNet dataset were used31.
Since multi-task learning aims to reduce the losses of various tasks simultaneously, it requires a different training strategy compared to common single-task training. In this study, we used a two-phase approach for multi-task training32–34. In the first phase, all the tasks were trained in parallel to obtain robust shared layers. In the second phase, each task was fine-tuned. In other words, the shared layers (Components 1 and 2 in Figure 1) were blocked (i.e., set as non-trainable) and the task-specific layers (Component 3) were fine-tuned to achieve minimal loss. For each task, the model was saved based on the lowest loss on the validation set. Early stops were also applied to reduce overfitting. The training was stopped when the validation loss did not decrease in 10 steps during the first phase, and in 5 steps during the second phase.
All experiments were conducted on a server with 32 Intel Xeon CPUs, a NVIDIA GeForce GTX 1080 GPU, and a 512Gb of RAM.
Datasets and Measurements
The classification performance was evaluated using two different datasets of color fundus photographs (Table 2), namely AREDS and AREDS2. The AREDS and AREDS2 were two large clinical trials sponsored by the National Eye Institute, National Institutes of Health35, 36. These two studies were designed to investigate the natural history and risk factors of AMD, as well as to evaluate the effects of nutritional supplementation on disease progression. The studies led to the development of the AREDS 9-step severity scale, based on color fundus photographs3. The scale was created and validated to classify AMD severity, primarily for research purposes, according to risk of progression to advanced AMD. Both datasets are held by a reading center located at the University of Wisconsin, Madison. The first image dataset (AREDS) contains approximately 60,000 color fundus photographs of eyes with non-advanced AMD and is publicly available on request35. We used the AREDS dataset to train the model (i.e., the same dataset used by the state-of-art model14). The training, validation, and test sets comprised 64%, 16%, and 20% of the AREDS patients, respectively. We used 5-fold cross-validation to measure the average performance of the models. The training, validation, and test sets were split at the level of individual patients (rather than individual eyes), such that all images from the same individual patient were kept in the same set.
Table 2:
Distributions of age-related macular degeneration severity, according to the AREDS severity scale (steps 1-9) in the AREDS and the AREDS2 image datasets.
| AMD | AREDS | AREDS2 | ||
|---|---|---|---|---|
| Severity Scale | n | % | n | % |
| 1 | 24,360 | 41.8 | 11 | 0.7 |
| 2 | 7,737 | 13.3 | 11 | 0.7 |
| 3 | 3,324 | 5.7 | 23 | 1.5 |
| 4 | 5,978 | 10.3 | 66 | 4.2 |
| 5 | 3,766 | 6.5 | 103 | 6.6 |
| 6 | 4,641 | 8.0 | 353 | 22.6 |
| 7 | 3,953 | 6.8 | 650 | 41.6 |
| 8 | 3,396 | 5.8 | 225 | 14.4 |
| 9 | 1,130 | 1.8 | 120 | 7.7 |
| Total | 58,285 | 1,562 | ||
For the second image dataset (AREDS2), we randomly selected 1,500 color fundus photographs from the large database of AREDS2 images (which also contains other images, e.g. fundus autofluorescence images)36. The sample distribution of the randomly selected images was similar to the population distribution in the whole dataset, and each randomly selected image was manually confirmed as a color fundus photograph (by a qualified ophthalmologist (TK)). We used the AREDS2 dataset as an independent test set for the evaluation of robustness and generalizability.
Table 2 shows the distributions of the true AREDS 9-step scale from human grading at the Reading Center, separately for the two datasets.The distributions of AMD severity are quite different between the AREDS and AREDS2, since the inclusion criteria were distinct for the two clinical trials: the AREDS included participants with a wide spectrum of disease severity (including no AMD and early AMD), whereas the AREDS2 recruited participants with more severe disease only. Hence, the differences between the AREDS and AREDS2 datasets may be helpful in testing the generalizability of the model beyond the dataset on which it was trained.
For the measurements, standard machine learning classification metrics were reported: weighted precision, recall, F1-score, overall Kappa statistics, and accuracy.
Results
In addition to the multi-task learning model described above (‘Multi-task model’, as shown in Figure 1), two additional models were evaluated, for comparison: the Convolutional Neural Network (CNN) model developed by Grassmann et al.14(‘Grassmann model’), and our CNN model (‘CNN model’). The reason we implemented our own CNN model is because the authors of the original Grassmann model made available only the weights (trained using the AREDS dataset), but not the source code and data partition. Since our test set may have overlapped with the training set used in the study of Grassmann et al.14, it is difficult to perform a direct comparison between our CNN model and Grassmann model on the AREDS dataset.
The Multi-task model and the CNN model were tested on the AREDS dataset. Their performances are shown in Table 3. In all metrics except precision, the performance of the Multi-task model was superior to that of the CNN model. All three models (the Multi-task model, the CNN model, and the Grassmann model) were tested using the AREDS2 dataset. Their performances are also shown in Table 3. Again, the performance of the Multi-task model was superior to that of the CNN model, with a higher degree of superiority observed in the AREDS2 dataset than in the AREDS dataset. In particular, the performance was approximately 5%, 3%, and 4% higher, in terms of weighted F1-score, overall Kappa statistics, and overall accuracy, respectively. Since the AREDS2 dataset was an independent dataset not used for training the models, these results suggest that the Multi-task model may be more robust and generalizable than the traditional CNN model. In addition, the Grassmann model had more than 10% lower accuracy than either the Multi-task model or the CNN model (discussed further below).
Table 3:
5-fold cross validation performance of the proposed Multi-task model, the CNN model, and the Grassmann model, on the AREDS and AREDS2 datasets.
| AREDS | AREDS2 | ||||
|---|---|---|---|---|---|
| Multi-task | CNN | Multi-task | CNN | Grassmann | |
| Precision | 0.591 | 0.592 | 0.545 | 0.533 | 0.514 |
| Recall | 0.614 | 0.612 | 0.472 | 0.437 | 0.345 |
| F1-score | 0.597 | 0.593 | 0.492 | 0.449 | 0.398 |
| Kappa | 0.487 | 0.484 | 0.330 | 0.297 | 0.216 |
| Accuracy | 0.614 | 0.612 | 0.472 | 0.437 | 0.346 |
Table 4 compares the classification results for multi-task learning and single-task learning on models trained from one of the 5-fold cross-validations. Single-task learning means that there are effectively four CNN models, each of which is trained independently. The results show that multi-task learning achieved better performance on all the metrics (weighted F1-score, overall Kappa statistics and overall accuracy) in both datasets. In particular, it had ∼ 4% higher weighted F1-score and ∼ 2% higher for other metrics.
Table 4:
1-fold performance of multi-task and single-task learning on the AREDS and AREDS2 datasets.
| AREDS | AREDS2 | |||
|---|---|---|---|---|
| Multi-task | Single-task | Multi-task | Single-task | |
| F1-score | 0.621 | 0.583 | 0.502 | 0.483 |
| Kappa | 0.485 | 0.466 | 0.340 | 0.312 |
| Accuracy | 0.621 | 0.607 | 0.480 | 0.461 |
Discussion
The above results demonstrate that our Multi-task model achieved superior performance to the state-of-the-art model in the two evaluation datasets. In this section, we consider potential areas for improvement; in particular, we performed error analysis on four individual risk factors and comparatively analyzed the difference between evaluation datasets. Additionally, we also quantitatively illustrate that transfer learning improves the generalization capability of models.
Comparisons between four characteristics
Since four characteristics contribute to the final AREDS severity scale, we analyzed the performance of the Multi-task model separately for each characteristic. Figure 3 shows the confusion matrices and Figure 4 shows the overall performance of these characteristics.
Figure 3:
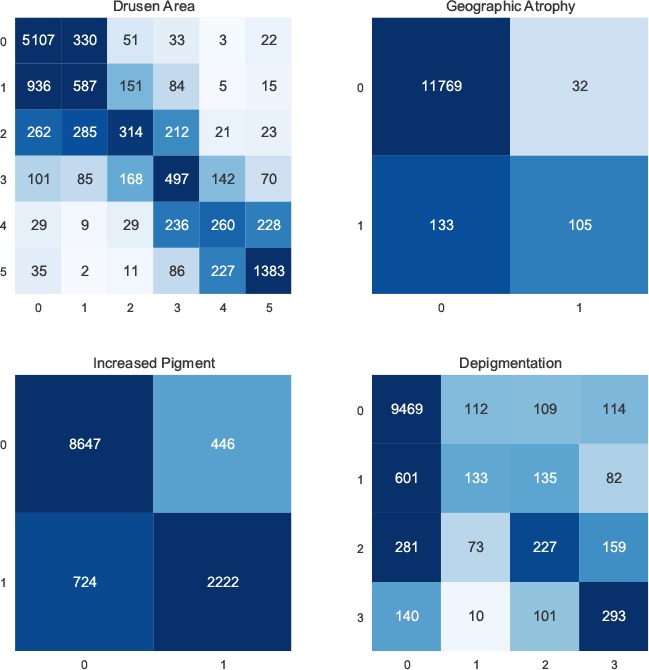
Confusion matrices for individual AMD characteristics.
Figure 4:
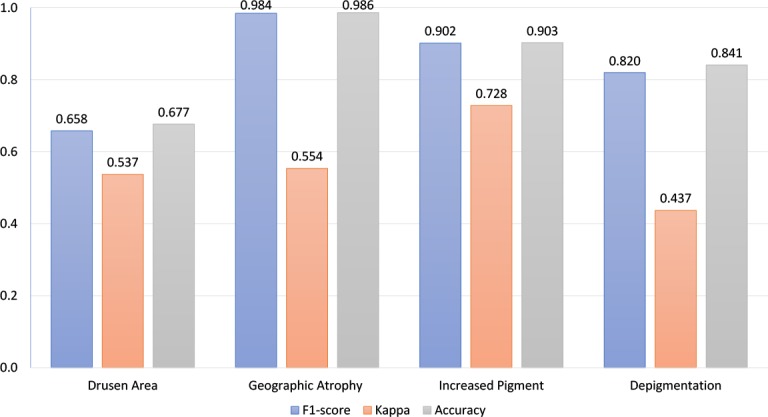
Performance of individual AMD characteristics.
We made three observations. First, as regards the performance of the model for each of the four characteristics, its performance in correctly grading drusen area had substantially lower F1-score and accuracy than those for the other three characteristics (e.g., accuracy of 0.68 for drusen area versus 0.99, 0.90, and 0.84 for geographic atrophy, increased pigment, and depigmentation, respectively). Indeed, its accuracy in grading drusen area was similar to its overall accuracy in predicting the AREDS severity scale (0.68 and 0.62, respectively). This suggests that grading of drusen area may be the limiting factor in the overall performance of the model, such that future improvements in this particular task may contribute most to increasing the model’s performance.
Second, at the class level, some classes have substantially higher levels of misclassification than others (as observed in the confusion matrices). For example, the accuracies of drusen area classification for classes 1, 2, 3, and 4 were 0.33, 0.28, 0.47, and 0.33, respectively. These are much lower than the accuracies for classes 0 and 5, which were 0.92 and 0.79, respectively. This is likely because the differences between classes 2, 3, and 4 (small drusen) were not large enough for effective classification, whereas class 0 (no drusen) and class 5 (large drusen) represent more distinct categories that may be easier for classification. Similarly, classes 1 and 2 for depigmentation also have low performance: the macro accuracies were 0.14 and 0.31, respectively.
Third, at the data level, the number of instances is still limited. As observed in the confusion matrices, for all four individual characteristics, all classes except 0 have a limited number of instances. It is likely that these relatively small numbers of instances may be insufficient for models to learn. While both data augmentation (which implicitly increased the number of instances) and transfer learning were applied in our model to address this problem, it would still be valuable to increase the number of instances further (i.e., new images from additional patients), in order to improve performance by distinguishing more accurately between classes. Indeed, data imbalance is a common problem for medical image classification9. However, traditional sub-sampling and over-sampling strategies may not be applicable in this case. Sub-sampling would limit the number of instances of majority classes, while over-sampling would require more distinct instances.
Taken together, we consider that (i) instead of reusing models developed for general computer vision purposes, domain-specific models are needed, and (ii) it is pressing to have annotation of more instances.
Comparisons between the AREDS and AREDS2
While the Multi-task model was more robust and generalizable than the other models tested, the performance of all the models decreased substantially from testing on the AREDS dataset to the AREDS2 dataset. The main reason for this is likely to be the substantial differences between their class distributions. For instance, as shown in Table 2, the AREDS dataset contains a large proportion of images with score 1, whereas the AREDS2 dataset contains an extremely small proportion of these. Indeed, skewed distributions make many deep learning algorithms less effective, especially in predicting minority class examples.
For the Multi-task model and the CNN model, we analyzed the differences in F1-score, Kappa, and accuracy (separately for each class) between the AREDS and AREDS2 datasets (Figure 5). Here, we selected steps 4–9 for statistical analysis, because these scores had more than 50 instances in each dataset. In terms of altered performance between testing on the AREDS and AREDS2 datasets, the Multi-task model was superior to the CNN model for 5 out of the 6 steps. For steps 4–6, the Multi-task model suffered from less loss in performance than the CNN model; for example, for step 4, the F1-score of the CNN model decreased by 18%, while that of the Multi-task model decreased by 15%. In addition, for steps 7-8, the Multi-task model demonstrated higher performance gains between testing on the AREDS and AREDS2 dataset; for example, for scale 7, the F1-score of the CNN model increased by 3%, whereas that of the Multi-task model increased by 6%. This analysis shows that the Multi-task model not only had superior performance overall, but also achieved superior performance for most of the classes.
Figure 5:

F1-score class difference (AREDS vs AREDS2). For example, the CNN model had 17.96% lower F1-score on class 4 compared AREDS to AREDS2.
Overall, the substantial decrease in performance between the AREDS and AREDS2 datasets suggests several points: (i) in principle, for medical image classification, models should favor high robustness and generalizability, (ii) for transfer learning, fine-tuning may achieve superior results than feature extraction, because of distribution differences in various medical image datasets, and (iii) it is of value to accumulate different medical datasets. In this study, the AREDS and AREDS2 datasets complement one another, such that combining them would provide a larger and more balanced overall dataset.
The accuracy of the CNN model released by Grassmann et al. was more than 10% lower than our CNN implementation14. One important factor might be that the Grassmann model did not use pre-trained model weights, i.e., weights trained from millions of images taken from general domains. Instead, the Grassmann model was trained from scratch using a random weight initializer. While the AREDS dataset contains a relatively large number of images, the distribution is unbalanced. Thus, the model may not have learnt the minority classes effectively and may suffer from overfitting. To investigate this hypothesis, we compared the performance of the CNN+random model (the model without using pre-trained weights) and the CNN+pre-trained model (the model using pre-trained weights). Table 5 shows that the performance of the two models is relatively similar on testing using the AREDS dataset; however, on testing using the AREDS2 dataset, the performance of the CNN+random model was substantially lower than that of the CNN+pretrained model, with a difference of 8% in F1-scores. This finding is consistent with a previous study that examined the performance of full-training and fine-tuning using pre-trained weights in three medical image applications37. This study demonstrated that using pre-trained weights was associated not only with superior performance but also with increased generalizability.
Table 5:
The performance between the CNN model using pretrained weights and randomly initialized weights on AREDS and AREDS2.
| AREDS | AREDS2 | |||
|---|---|---|---|---|
| Pretrained | Random | Pretrained | Random | |
| F1-score | 0.588 | 0.582 | 0.487 | 0.406 |
| Kappa | 0.476 | 0.470 | 0.338 | 0.258 |
| Accuracy | 0.615 | 0.610 | 0.472 | 0.391 |
Conclusion
In conclusion, we have developed a new deep learning model for AMD classification of the AREDS severity scale. Evaluation on two datasets showed that our model was consistently superior to the current state-of-the-art model. In addition, our model was able to classify four separate components of the AREDS Severity Scale, thus providing improved transparency. Error analysis revealed that the limiting factor of our model’s performance was in the classification of the drusen area component. In the future, we plan to improve our model by concentrating on drusen area classification by obtaining datasets with a higher proportion of non-advanced AMD cases.
Acknowledgements
This work was supported by the Intramural Research Programs of the National Institutes of Health, National Library of Medicine and the National Eye Institute. We also thank Daniel Li for his help.
Footnotes
References
- 1.Wong WL, Su X, Li X, Cheung CMG, Klein R, Cheng CY, et al. Global prevalence of age-related macular degeneration and disease burden projection for 2020 and 2040: a systematic review and meta-analysis. Lancet Glob Health. 2014;2(2):e106–16. doi: 10.1016/S2214-109X(13)70145-1. [DOI] [PubMed] [Google Scholar]
- 2.Ferris FL, Wilkinson CP, Bird A, Chakravarthy U, Chew E, Csaky K, et al. Clinical classification of age-related macular degeneration. Ophthalmology. 2013;120:844–851. doi: 10.1016/j.ophtha.2012.10.036. [DOI] [PMC free article] [PubMed] [Google Scholar]
- 3.Group AREDSR. The Age-Related Eye Disease Study severity scale for age-related macular degeneration: AREDS Report No. 17. Arch Ophthalmol. 2005;123(11):1484–98. doi: 10.1001/archopht.123.11.1484. [DOI] [PMC free article] [PubMed] [Google Scholar]
- 4.Burlina PM, Joshi N, Pekala M, Pacheco KD, Freund DE, Bressler NM. Automated Grading of Age-Related Macular Degeneration From Color Fundus Images Using Deep Convolutional Neural Networks. JAMA ophthalmology. 2017;135(11):1170–1176. doi: 10.1001/jamaophthalmol.2017.3782. [DOI] [PMC free article] [PubMed] [Google Scholar]
- 5.Group AREDSR. A simplified severity scale for age-related macular degeneration: AREDS Report No. 18. Arch Ophthalmol. 2005;123(11):1570–1574. doi: 10.1001/archopht.123.11.1570. [DOI] [PMC free article] [PubMed] [Google Scholar]
- 6.Dalal N, Triggs B. Histograms of oriented gradients for human detection; Proceedings of the IEEE Conference on Computer Vision and Pattern Recognition (CVPR); 2005. pp. 886–893. [Google Scholar]
- 7.Burlina P, Pacheco KD, Joshi N, Freund DE, Bressler NM. Comparing humans and deep learning performance for grading AMD: A study in using universal deep features and transfer learning for automated AMD analysis. Computers in biology and medicine. 2017;82:80–86. doi: 10.1016/j.compbiomed.2017.01.018. [DOI] [PMC free article] [PubMed] [Google Scholar]
- 8.Krizhevsky A, Sutskever I, Hinton GE. Imagenet classification with deep convolutional neural networks. Advances in Neural Information Processing Systems. 2012:1097–1105. [Google Scholar]
- 9.Litjens G, Kooi T, Bejnordi BE, Setio AAA, Ciompi F, Ghafoorian M, et al. A survey on deep learning in medical image analysis. Medical image analysis. 2017;42:60–88. doi: 10.1016/j.media.2017.07.005. [DOI] [PubMed] [Google Scholar]
- 10.Kim J, Calhoun VD, Shim E, Lee JH. Deep neural network with weight sparsity control and pre-training extracts hierarchical features and enhances classification performance: Evidence from whole-brain resting-state functional connectivity patterns of schizophrenia. Neuroimage. 2016;124:127–146. doi: 10.1016/j.neuroimage.2015.05.018. [DOI] [PMC free article] [PubMed] [Google Scholar]
- 11.Margeta J, Criminisi A, Cabrera Lozoya R, Lee DC, Ayache N. Fine-tuned convolutional neural nets for cardiac MRI acquisition plane recognition. Computer Methods in Biomechanics and Biomedical Engineering: Imaging & Visualization. 2017;5(5):339–349. [Google Scholar]
- 12.Wang X, Peng Y, Lu L, Lu Z, Bagheri M, Summers RM. Chestx-ray8: Hospital-scale chest x-ray database and benchmarks on weakly-supervised classification and localization of common thorax diseases; 2017 IEEE Conference on Computer Vision and Pattern Recognition (CVPR); 2017. pp. 3462–3471. [Google Scholar]
- 13.Wang X, Peng Y, Lu L, Lu Z, Summers RM. TieNet: Text-Image Embedding Network for Common Thorax Disease Classification and Reporting in Chest X-rays. CVPR. 2018:9049–9058. [Google Scholar]
- 14.Grassmann F, Mengelkamp J, Brandl C, Harsch S, Zimmermann ME, Linkohr B, et al. A Deep Learning Algorithm for Prediction of Age-Related Eye Disease Study Severity Scale for Age-Related Macular Degeneration from Color Fundus Photography. Ophthalmology. 2018;125(9):1410–1420. doi: 10.1016/j.ophtha.2018.02.037. [DOI] [PubMed] [Google Scholar]
- 15.Szegedy C, Liu W, Jia Y, Sermanet P, Reed S, Anguelov D, et al. Going deeper with convolutions; Proceedings of the IEEE Conference on Computer Vision and Pattern Recognition (CVPR); 2015. pp. 1–9. [Google Scholar]
- 16.Simonyan K, Zisserman A. Very deep convolutional networks for large-scale image recognition; 2014. ArXiv preprint arXiv:1409.1556 [Google Scholar]
- 17.Szegedy C, Vanhoucke V, Ioffe S, Shlens J, Wojna Z. Rethinking the inception architecture for computer vision. CVPR. 2016:2818–2826. [Google Scholar]
- 18.He K, Zhang X, Ren S, Sun J. Deep residual learning for image recognition; Proceedings of the IEEE conference on computer vision and pattern recognition; 2016. pp. 770–778. [Google Scholar]
- 19.Szegedy C, Ioffe S, Vanhoucke V, Alemi AA. Inception-v4, inception-resnet and the impact of residual connections on learning. AAAI. 2017;vol. 4:12. [Google Scholar]
- 20.Madumal P, Miller T, Vetere F, Sonenberg L. Towards a Grounded Dialog Model for Explainable Artificial Intelligence. ArXiv preprint arXiv:1806.08055. 2018 [Google Scholar]
- 21.Doshi-Velez F, Kim B. Towards a rigorous science of interpretable machine learning. ArXiv preprint arXiv:1702.08608. 2017 [Google Scholar]
- 22.Peng Y, Dharssi S, Chen Q, Keenan TD, Agro´n E, Wong WT, et al. DeepSeeNet: A deep learning model for automated classification of patient-based age-related macular degeneration severity from color fundus photographs. Ophthalmology. 2018:1–26. doi: 10.1016/j.ophtha.2018.11.015. [DOI] [PMC free article] [PubMed] [Google Scholar]
- 23.Zhang Y, Yang Q. A survey on multi-task learning. ArXiv preprint arXiv:1707.08114. 2017 [Google Scholar]
- 24.Zhang Z, Luo P, Loy CC, Tang X. Facial landmark detection by deep multi-task learning; European Conference on Computer Vision; 2014. pp. 94–108. [Google Scholar]
- 25.Ranjan R, Patel VM, Chellappa R. Hyperface: A deep multi-task learning framework for face detection, landmark localization, pose estimation, and gender recognition. PAMI. 2017:1–16. doi: 10.1109/TPAMI.2017.2781233. [DOI] [PubMed] [Google Scholar]
- 26.Subramanian S, Trischler A, Bengio Y, Pal CJ. Learning general purpose distributed sentence representations via large scale multi-task learning. ArXiv preprint arXiv:1804.00079. 2018 [Google Scholar]
- 27.Søgaard A, Goldberg Y. Deep multi-task learning with low level tasks supervised at lower layers. ACL. 2016;vol. 2:231–235. [Google Scholar]
- 28.Lin M, Chen Q, Yan S. Network in network. ArXiv preprint arXiv:1312.4400. 2013 [Google Scholar]
- 29.Srivastava N, Hinton G, Krizhevsky A, Sutskever I, Salakhutdinov R. Dropout: A simple way to prevent neural networks from overfitting. The Journal of Machine Learning Research. 2014;15(1):1929–1958. [Google Scholar]
- 30.Kingma DP, Ba J. Adam: A method for stochastic optimization; International Conference on Learning Representations (ICLR); 2015. pp. 1–15. [Google Scholar]
- 31.Deng J, Dong W, Socher R, Li LJ, Kai L, Li FF. ImageNet: A large-scale hierarchical image database; IEEE Conference on Computer Vision and Pattern Recognition; 2009. pp. 248–255. [Google Scholar]
- 32.Pasunuru R, Bansal M. Multi-task video captioning with video and entailment generation; Proceedings of the 55th Annual Meeting of the Association for Computational Linguistics; 2017. pp. 1273–1283. [Google Scholar]
- 33.Liu P, Qiu X, Huang X. Adversarial multi-task learning for text classification; Proceedings of the 55th Annual Meeting of the Association for Computational Linguistics; 2017. pp. 1–10. [Google Scholar]
- 34.Rao J, Ture F, Lin J. Multi-Task Learning with Neural Networks for Voice Query Understanding on an Entertainment Platform. ACM SIGKDD. 2018:636–645. [Google Scholar]
- 35.Age-Related Eye Disease Study Research G. The Age-Related Eye Disease Study (AREDS): design implications. AREDS report no. 1. Control Clin Trials. 1999;20(6):573–600. doi: 10.1016/s0197-2456(99)00031-8. [DOI] [PMC free article] [PubMed] [Google Scholar]
- 36.Chew EY, Clemons T, SanGiovanni JP, Danis R, Domalpally A, McBee W, et al. The Age-Related Eye Disease Study 2 (AREDS2): study design and baseline characteristics (AREDS2 report number 1) Ophthalmology. 2012;119(11):2282–2291. doi: 10.1016/j.ophtha.2012.05.027. [DOI] [PMC free article] [PubMed] [Google Scholar]
- 37.Tajbakhsh N, Shin JY, Gurudu SR, Hurst RT, Kendall CB, Gotway MB, et al. Convolutional neural networks for medical image analysis: Full training or fine tuning? IEEE transactions on medical imaging. 2016;35(5):1299–1312. doi: 10.1109/TMI.2016.2535302. [DOI] [PubMed] [Google Scholar]