Abstract
Burnout is becoming increasingly prevalent among primary care physicians. Recent studies have attributed electronic health record (EHR) related tasks as a potential source of physician burnout. In this cross-sectional study, EHR use was compared to self-reported burnout for 107 faculty physicians at 10 university-affiliated primary care clinics.
Physicians who self-reported burnout spent more time managing their inbox and in the EHR after hours. Burnout was associated with lower rates of same day chart closure, longer completion time for inbox messages, and more incomplete messages.
Burnout, while related to overall workload, had a complex relationship with EHR use, which was influenced by but could not wholly explained by clinical workload. Our results suggest that burnout is less prevalent with less allocated clinical time, however, more research is necessary to identify the optimal balance between clinical duties and academic pursuits. Segmenting providers based on relative workload to determine variation within similar groups may help optimize EHR use.
Introduction
Physician burnout is becoming increasingly prevalent in the field of medicine and has become the focus of several national initiative1,2. A longitudinal study from the Mayo Clinic found that over 50% of physicians experienced at least 1 symptom of burnout and is more common in frontline specialties such as emergency medicine and family medicine. The study also reported as much as a 10% increase in the frequency of physician burnout in the short span of 3 years, from 2011 to 20143.
Studies have proposed that physician burnout is a complex, multifactorial syndrome4,5. The electronic health record and the ever-increasing clerical tasks associated with it have frequently been cited as a predictor of physician stress and burnout4,5,6,7.
Electronic health records have revolutionized patient-provider communication and has enabled patients to obtain test results, ask questions, and request medication refills electronically and asynchronously. Surveys have demonstrated that electronic communication are associated with increased patient satisfaction and access to providers8,9,10. Providers understand that these communications can improve patient outcomes and reduce office visits, however, have also voiced concern that it can lead to increased time demands, increased workloads, exposure to liability, and loss of productivity if communications are not reimbursable8,11,13.
When asked about their perception of time spent on these tasks, 46.5% felt that time spent on clerical tasks pursuant to direct patient care, including order entry, dictation, reviewing lab results, and communicating with patients through an electronic portal was unreasonable11. Most primary care providers are not allocated protected time for this additional work and therefore the non- “face-to-face” work is in addition to their already full schedules8,12,13.
Recent studies have validated these concerns and have demonstrated that electronic communications are increasingly requiring a substantial time commitment from providers. One institution reported the number of messages received through their patient portal increased by 62% over a 3-year period4. A study using survey data reported that outpatient internists spent 48 minutes outside of office hours responding to patient electronic communications for each scheduled clinic day12. A more recent study used a combination of EHR audit log data and time motion observations to quantify the amount of time spent on EHR related tasks. The researchers found that family medicine physicians spent 5.9 hours during clinic hours, 1.4 hours after hours, of which 84 minutes per day was spent managing their inbox4.
Efforts to quantify physician time have traditionally relied on self-report, time motion studies, or video and audio recordings13. However, survey data can be inaccurate and the other methods are costly, invasive, and may be prone to the Hawthorne effect. There has been a growing body of research that have validated the use of EHR log data with concurrent time motion studies to evaluate how physicians use EHRs4,13,14,15.
Methods
Study Design
In our study, we aimed to explore the relationship between provider burnout and quantifiable measures of time spent on EHR related tasks using log data from the Epic Care Ambulatory Provider Efficiency Profile (PEP). This was an arm in a larger study which examined burnout across all clinic staff (including physicians, nurse practitioners, registered nurses, medical assistants, social workers, pharmacists) at Oregon Health and Science University (OHSU). All faculty and staff members working in 10 primary care clinics at OHSU were sent a survey including the Mini-Z questionnaire. The primary care specialties included family medicine, internal medicine and pediatrics. For this arm of the larger study, we only included physicians, nurse practitioners (NP), and physician assistants (PA) who were on faculty at OHSU. Residents were not included in this study.
Measures
The mini-Z
Provider burnout was assessed using the Mini-Z, which was derived from the Physician Worklife Study23. The Mini-Z is a questionnaire that assesses burnout, job satisfaction and work-related stress using single item measures. It includes 9 questions with 5-point Likert scale responses, a single measure regarding burnout and an open-ended question, “Please tell us about your stressors and potential solutions”. The single item burnout question asks respondents to classify their level of burnout based on their own definition. The possible responses are:
I enjoy my work. I have no symptoms of burnout.
I am under stress, and don’t always have as much energy as I did, but I don’t feel burned out.
I am definitely burning out and have one or more symptoms of burnout, e.g., emotional exhaustion.
The symptoms of burnout that I am experiencing won’t go away. I think about work frustrations a lot.
I feel completely burned out. I am at the point where I may need to seek help.
This single item burnout measure has been validated and has been demonstrated to be strongly correlated with the emotional exhaustion scale of the Maslach Burnout Inventory22. The emotional exhaustion measure has been suggested to be an essential component and is often used as a central measure22. Several studies have used single item measures rather than the full 22 question inventory as a means of improving response rates19,22.
Clinical Full Time Equivalents
Survey participants all had academic responsibilities in addition to their clinical roles. We used clinical full-time equivalents (cFTE) as a means of assessing and comparing a provider’s dedicated clinical time. cFTE was assessed by a multiple-choice question that asked “What is your clinical FTE including clinic, wards and precepting?”. The available responses included 0.1 to 0.2, 0.3 to 0.4, 0.5 to 0.6, 0.7 to 0.8 and Greater than 0.9.
Clinical Role and Experience
Survey respondents answered a multiple-choice question regarding their clinical role. The available options were “MD/DO”, “NP/PA” or “Decline to answer”. Level of experience was assessed with a multiple-choice question that asked “How many years have you practiced in your clinic?”. Available options were “Less than 1 year”, “1 – 5 years”, “6 – 10 years” and “Greater than 10 years”.
Audit Log Data
We collected the raw data from the PEP to assess provider use of the EHR. Several studies have demonstrated EHR audit log data strongly correlated with actual provider EHR use through time motion studies13,14,15. According to Epic documentation, the User Action Log (UAL) calculates active time as clicks and keyboard strokes within the Epic system. If more than 30 seconds elapses between events, the time is considered inactive and not counted towards the active time.
We measured time spent in the EHR after hours as a combination of minutes in the EHR between 7 PM and 7 AM on scheduled days and total minutes on unscheduled days during the reporting period.
The PEP divides total time spent in the system by 7 different activities – clinical review, documentation, inbox, orders, schedule/patient lists, visit navigator, and other. Each one of these activities are further divided into whether or not it was completed in the context of an open clinical encounter.
Number of appointments is a measurement from the PEP and is defined by number of scheduled outpatient face-to-face appointments during the reporting period. Days with appointments includes number of days during the reporting period where the provider was scheduled for at least one appointment.
There are four types of inbox messages – results review, patient calls, patient refill request and patient medical advice requests. We chose to evaluate results review and patient calls, as they were tasks that required physician input and communication with the patient. There were very few providers who had patient medical advice requests during the reporting period and therefore the decision was made to exclude this inbox task.
For each inbox message type, the PEP measures number of messages received, incomplete at the end of the reporting period, and average number of days until the message is marked complete. This only counts messages that were sent directly to the provider and does not count message sent to pools.
To evaluate provider’s documentation management, we use the “Close Office Visits the Same Day” metric from the PEP which calculates the percentage of a clinical encounters that were closed on the same day of the visit.
Analysis
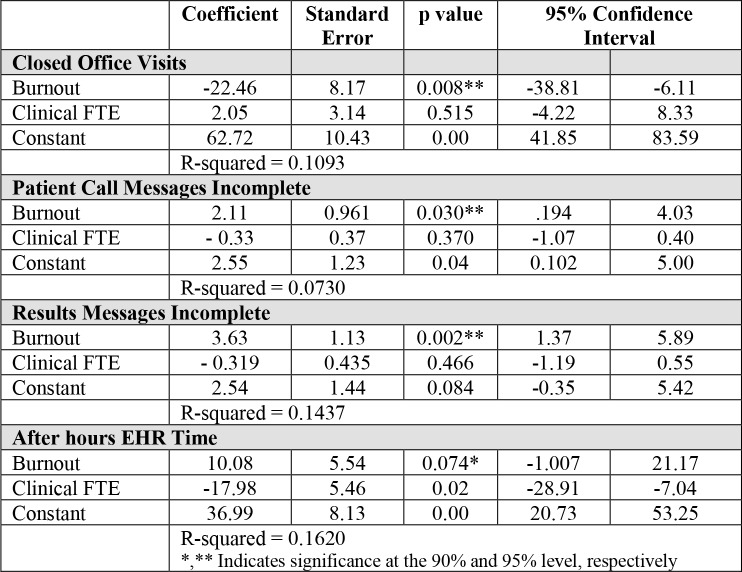
We used a combination of descriptive analytics and simple linear regression. In consideration of the relatively small sample size involved (n=107), the Fisher’s Exact Test was used to determine whether there were statistically significant associations between self-reported burnout and certain categorial characteristics – for example, clinical FTE. Furthermore, simple linear regression was used to estimate the effect of burnout on various performance indicators once controlling for clinical FTE (Table 2).
Table 2.
Regression Results
 |
Results
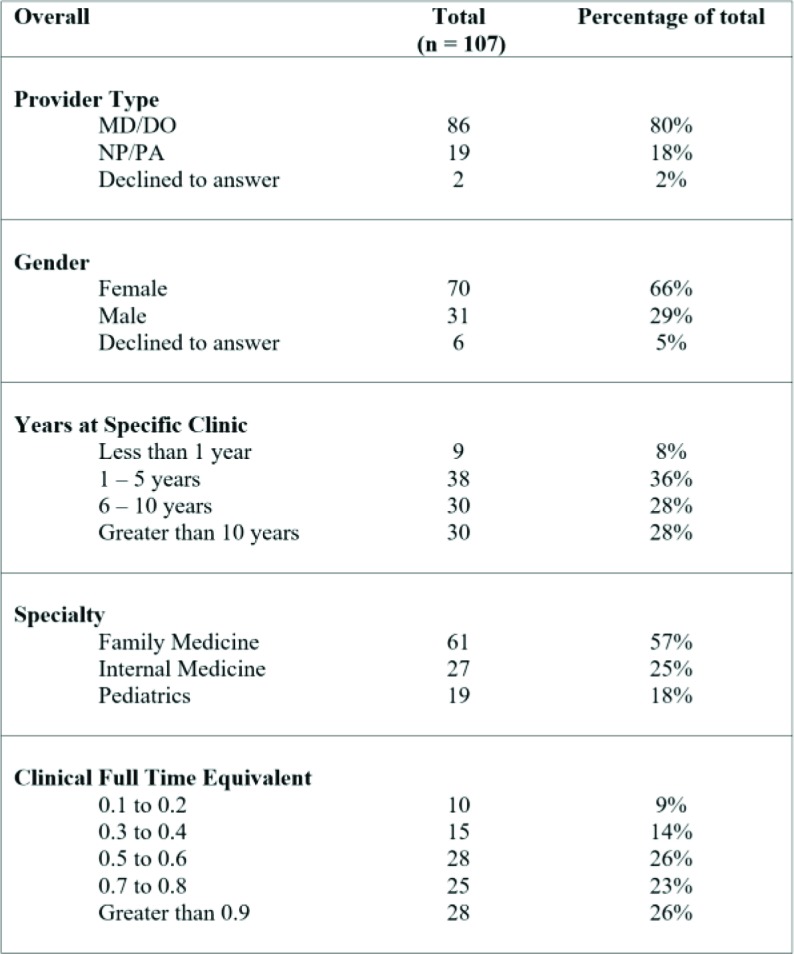
The survey was sent to 190 faculty members and was completed by 107 (56%) providers which included 86 physicians (MD/DO), 19 advanced practice providers (NP/PA), and 2 providers who declined to answer the question. Table 1 shows the respondent demographics. Approximately two-thirds of the survey respondents were female. The majority of the providers were trained in family medicine (57%), followed by internal medicine (27%) and pediatrics (18%). The breakdown of providers in each cFTE category was similar for groups above 0.5 cFTE. In order to keep the number of providers in each group similar, we decided to combined the lower cFTE groups (0.1 to 0.2 and 0.3 to 0.4) into one group.
Table 1.
Respondent Demographics
 |
Burnout
Overall, 39% (n = 41) of providers self-reported burnout on the single item measure. Greater allocated clinical time and patient workloads were closely associated with burnout (Figure 1). More than half of providers with greater than 0.9 clinical FTE reported feeling burned out, whereas only a third of physicians who had less than 0.6 clinical FTE self-reported burnout. Burnout was consistent across levels of experience for providers in the role for over 1 year (Figure 2). There were only 9 providers in the ‘Less than 1 year’ group and therefore difficult to draw conclusions.
Figure 1.
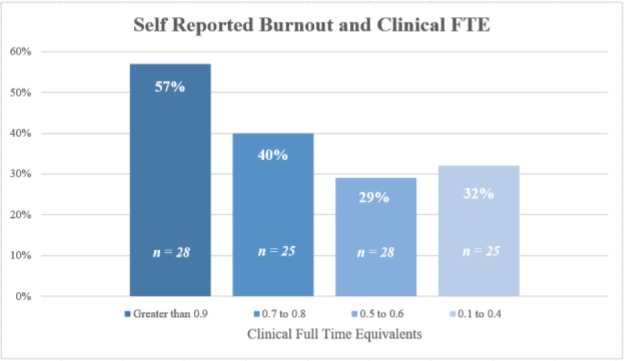
Self-Reported Burnout and Clinical Full Time Equivalents
Figure 2.
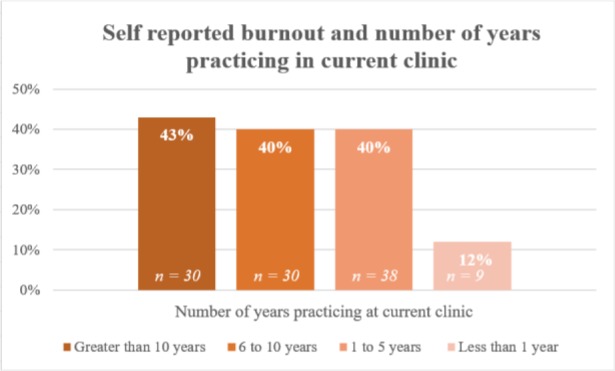
Self-Reported Burnout and Number of Years Practicing at Current Clinic
To enable further analysis, given the relatively small numbers involved, clinical FTE was collapsed into a binary variable (0.7 FTE or greater, 0.6 FTE or less). The association between higher clinical FTE and self-reported burnout was found to be statistically significant (p=0.04; one-sided Fisher’s exact test).
Time spent in Electronic Health Record
To better understand how providers spend their time in the electronic health record, we examined the audit logs from the PEP. We found that completing clinical documentation accounts for 33% of time spent in the EHR, followed by communicating with patients and managing their inbox (18%). Figure 3 shows the complete breakdown of EHR activities.
Figure 3.
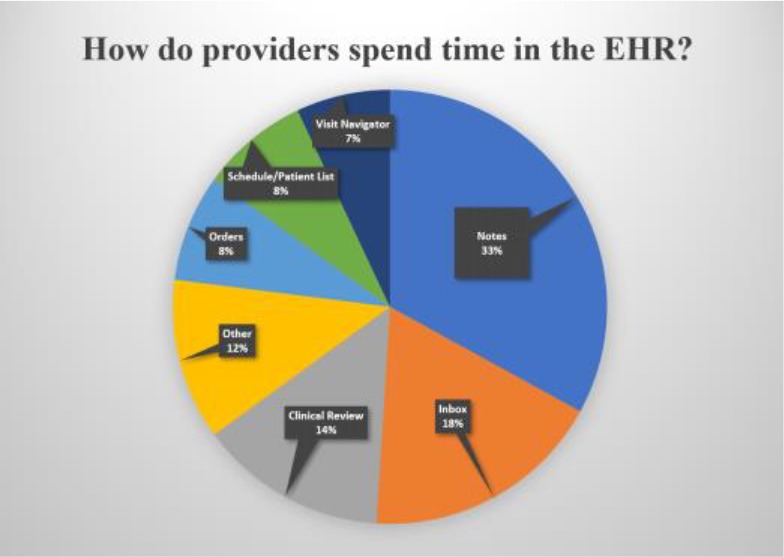
How do providers spend their time in the EHR?
Clinicians who self-reported burnout spent more time in the EHR after hours per appointment than their colleagues with the same clinical FTE allocation. Holding clinical FTE constant, reported burnout was associated with an increase of 10 minutes per appointment afterhours compared with no reported burnout (p-value=0.074). Although this result did not meet the conventional 0.05 threshold for significance, with a p-value=0.07 it did meet the 90% confidence level (Table 2).
Providers with greater than 0.9 cFTE spent less time in the EHR documenting encounters than their counterparts, but had a three-fold increase in their after hours EHR time (Figure 4). Providers with 0.5 to 0.6 cFTE also had a twofold increase in both the times spent during encounters as well as after hours. Interestingly, providers who have less allocated clinical time spent more time in the EHR per appointment (between 22 – 29 minutes for cFTE greater than 0.7) than their colleagues with more allocated clinical FTE (between 29 – 62 minutes for cFTE of 0.6 and below).
Figure 4.
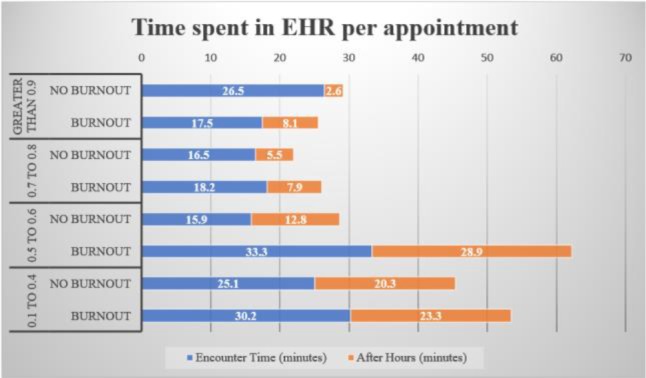
Time spent in EHR per appointment
EHR related task management
In general, providers who self-reported burnout were more likely to have lower rates of same day chart completion, spend more time in the EHR after hours and managing their inbox (Figures 4, 5 and 6). Controlling for clinical FTE, burned out providers had a 22.5% lower same day chart completion rate compared to their non-burned out colleagues. This association was statistically significant, with a p value of 0.008 (Table 2).
Figure 5.
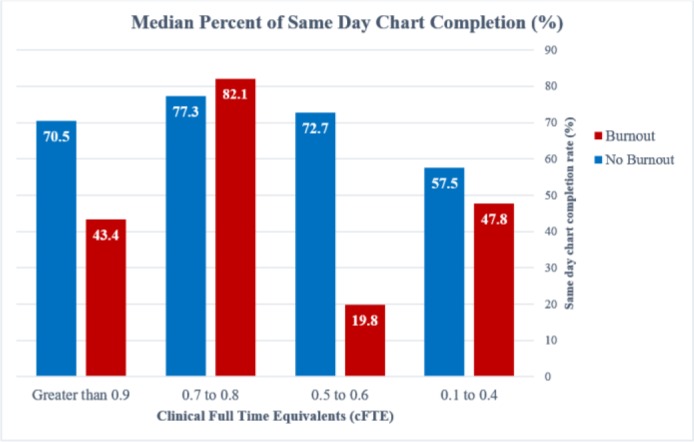
Percent of Same Day Chart completion
Figure 6.
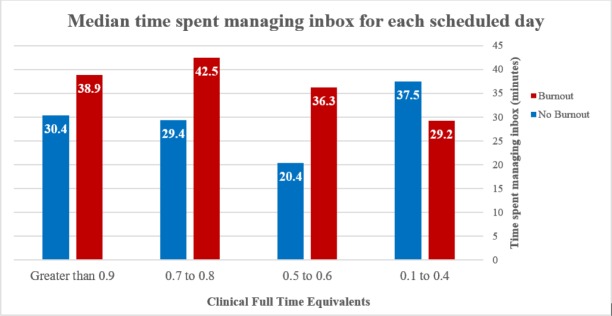
Median time spent managing inbox for each scheduled day.
Burned out providers in the greater than 0.9 cFTE group only had an average of 43.4% of their charts completed on the same day, compared to their non-burned out colleagues who had an average of 70.5% same day chart completion rate. This trend was also seen with clinicians with less than 0.6 clinical FTE. Burned out providers in the 0.5 to 0.6 cFTE group had a disproportionate number of low (less than 20%) same day chart completion during this reporting period. One of the limitations of our study is the small sample size for each group, which can magnify extreme values. For this assessment, we used the median rather than the mean to account for this effect.
Interestingly, there was an inverse relationship with time spent in the EHR and same day chart completion rate. The highest chart completion rate was seen in the 0.7-0.8 cFTE group, with 77.3% and 82.1% completion rates, and 22 minutes and 26.1 minutes spent per appointment for the non-burned out and burned out subgroups respectively (Figures 4 and 5). The lowest same day chart completion rates were associated with providers that spent the most time in the EHR overall and after hours (Figures 4 and 5).
Inbox management accounted for 18% of total EHR time and was only second to documentation activities (Figure 3). For each scheduled appointment day, providers spent, on average, between 20 – 42 minutes managing their inbox messages (Figure 6). Providers who reported burnout received more messages, took longer to respond to the messages, left more messages incomplete, and spent more time overall managing their inbox (Figure 6, 7, and 8).
Figure 7.
Inbox Management – Results Messages
Figure 8.
Inbox Management – Patient Call Messages
Results messages took between 1.3 – 2.6 days to be marked done. Burned out providers left at least twice as many messages incomplete at the end of the reporting period compared to their colleagues. In the 0.7-0.8 cFTE group, burned out providers took 0.8 days longer to respond to messages and had twice as many messages left incomplete, despite having comparable number of results. Responding to patient call messages followed a similar trend, where burned out providers received more messages, took longer to complete them, and left more messages incomplete.
The association between reported burnout and incomplete patient call and results messages were also examined using linear regression. In both cases, this was found to be statistically significant after controlling for clinical FTE at the 95% confidence level. Holding cFTE constant, those reporting burnout were expected to have 2.1 more incomplete patient call messages than those who did not report burnout (p-value=0.03). Similarly, reported burnout was associated with an increase of 3.6 incomplete results messages compared with no reported burnout (p-value=0.002).
Notably, the 0.5 – 0.6 cFTE group does not follow this trend. Burned out providers in this group responded to messages quicker and left fewer messages incomplete despite receiving more messages in the reporting period. However, these providers spent nearly as much time managing their inbox as providers who had 50% more messages than them (see non-burned out providers in the 0.1-0.4 group on Figures 6 and 8).
Within each cFTE group, there appears to be a ‘dose-dependent’ relationship of greater EHR time and self-reported burnout. However, there also appears to be an inflection point in the 0.5-0.6 cFTE group. Overall, providers with less than 0.6 cFTE reported less burnout than the other groups (Figure 1). In addition, non-burned out providers in the 0.5-0.6 cFTE group closely resembled time spent in the EHR (Figure 4) and chart completion rates (Figure 5) of providers in the higher cFTE groups. This is contrasted with clinicians who self-reported burnout in the same 0.5-0.6 cFTE group that spent more time in the EHR per appointment and had the lowest chart completion rate of all groups.
Discussion
This study provides insight on provider burnout and its association with indirect patient care tasks such as clinical documentation and electronic communications in the EHR. Overall, provider burnout was 41% and was more prevalent for providers with higher clinical full-time equivalents. More than half of providers with greater than 0.9 cFTE were burned out, which is consistent with national surveys3.
Prior studies have demonstrated that the number of electronic communications providers receive in the EHR are on the rise and approaching unsustainable levels4,10. Increased clerical demands and insufficient time to attend to them have been cited as a contributor to physician stress and burnout5. We estimated that providers spend between 20 to 42 minutes per clinic day managing their inbox. Much of this work is unreimbursed and completed during a provider’s ‘free time’12,13. Burned out providers also spent 10 more minutes after hours per appointment than their non-burned out colleagues. Our study population had an average of 6 patients during a half-day session, or an average of 12 patients for a full day session. This translates to a difference of 1 – 2 hours per day, for two providers with the same number of appointments. Burnout was associated with measurable and significant differences in managing inbox messages and completing clinical documentation. This may be an unobtrusive way for institutions to measure indirect patient workloads (number of messages) and identify providers who are having difficulty with their inbox management (messages left incomplete, or longer times to respond compared to similar providers).
Limitations
There are a number of limitations to our study. Our sample size was small and only included academic faculty providers in the outpatient setting. After accounting for cFTE group and response to the burnout question, some of the subgroups have less than 10 participants. While it is encouraging that burnout is less prevalent in certain groups, it makes it difficult to generalize our results.
Another limitation is the currently available level of granularity when using PEP metrics. The PEP distinguishes between tasks completed in the setting of a clinical encounter, however it would also be useful to understand how after hours and EHR time on unscheduled days are utilized. A potential confounder we did not account for is after hours EHR time that is related to on-call responsibilities and inbox coverage rather than attending to one’s own patients.
In addition, our measure of clinical FTE was self-reported and it was not assessed independently from payroll records. Our survey results suggest that burnout is less prevalent with less allocated clinical time, however, more research is necessary to identify the optimal balance between clinical duties and academic pursuits. As a future direction, we intend to obtain payroll records in order to more rigorously assess the role clinical FTE and burnout as well as examine different combinations of clinical FTE and full FTE.
References
- 1.American College of Physicians. Physician Well-being and Professional Satisfaction. [Online]. Available from: https://www.acponline.org/practice-resources/physician-well-being-and-professional-satisfaction.
- 2.American Medical Association. Steps Forward: Preventing Physician Burnout. [Online].; 2018. [cited 2018. Available from: https://edhub.ama-assn.org/steps-forward/module/2702509.
- 3.Shanafelt T, Hasan O, Dyrbye L, Sinsky C, Satele D, Sloan J. Changes in Burnout and Satisfaction With Work-Life Balance in Physicians and the General US Working Population Between 2011 and 2014. Mayo Clinic Proceedings. 2015;90(12):1600–1613. doi: 10.1016/j.mayocp.2015.08.023. [DOI] [PubMed] [Google Scholar]
- 4.Arndt B, Beasley J, Watkinson M, Temte J, Tuan W, Sinsky C. Tethered to the EHR: Primary Care Physician Workload Assessment Using EHR Event Log Data and Time-Motion Observations. The Annals of Family Medicine. 2017;15(5):419–426. doi: 10.1370/afm.2121. [DOI] [PMC free article] [PubMed] [Google Scholar]
- 5.Sinsky C, Colligan L, Li L, Prgomet M, Reynolds S, Goeders L. Allocation of Physician Time in Ambulatory Practice: A Time and Motion Study in 4 Specialties. Annals of Internal Medicine. 2016;165(11):753. doi: 10.7326/M16-0961. [DOI] [PubMed] [Google Scholar]
- 6.O’Malley A, Grossman J, Cohen G, Kemper N, Pham H. Are Electronic Medical Records Helpful for Care Coordination? Experiences of Physician Practices. Journal of General Internal Medicine. 2009;25(3):177–185. doi: 10.1007/s11606-009-1195-2. [DOI] [PMC free article] [PubMed] [Google Scholar]
- 7.Reaction Data. Physician Burnout [Internet]. American Fork, UT; 2018.. Available from: https://www.reactiondata.com/report/physician-burnout/
- 8.Hassol A, Walker J, Kidder D, Rokita K, Young D, Pierdon S. Patient Experiences and Attitudes about Access to a Patient Electronic Health Care Record and Linked Web Messaging. Journal of the American Medical Informatics Association. 2004;11(6):505–513. doi: 10.1197/jamia.M1593. [DOI] [PMC free article] [PubMed] [Google Scholar]
- 9.Liederman E. Web Messaging: A New Tool for Patient-Physician Communication. Journal of the American Medical Informatics Association. 2003;10(3):260–270. doi: 10.1197/jamia.M1259. [DOI] [PMC free article] [PubMed] [Google Scholar]
- 10.Dyrbye L, West C, Burriss T, Shanafelt T. Providing Primary Care in the United States: The Work No One Sees. Archives of Internal Medicine. 2012;172(18):1420. doi: 10.1001/archinternmed.2012.3166. [DOI] [PubMed] [Google Scholar]
- 11.Shanafelt T, Dyrbye L, Sinsky C, Hasan O, Satele D, Sloan J. Relationship Between Clerical Burden and Characteristics of the Electronic Environment With Physician Burnout and Professional Satisfaction. Mayo Clinic Proceedings. 2016;91(7):836–848. doi: 10.1016/j.mayocp.2016.05.007. [DOI] [PubMed] [Google Scholar]
- 12.McDonald C, Callaghan F, Weissman A, Goodwin R, Mundkur M, Kuhn T. Use of Internist’s Free Time by Ambulatory Care Electronic Medical Record Systems. JAMA Internal Medicine. 2014;174(11):1860. doi: 10.1001/jamainternmed.2014.4506. [DOI] [PubMed] [Google Scholar]
- 13.Tai-Seale M, Olson C, Li J, Chan A, Morikawa C, Durbin M. Electronic Health Record Logs Indicate That Physicians Split Time Evenly Between Seeing Patients And Desktop Medicine. Health Affairs. 2017;36(4):655–662. doi: 10.1377/hlthaff.2016.0811. [DOI] [PMC free article] [PubMed] [Google Scholar]
- 14.Wu D, Smart N, Ciemins E, Lanham H, Lindberg C, Zheng K. Using EHR audit trail logs to analyze clinical workflow: A case study from community-based ambulatory clinics. AMIA Annual Symposium Proceedings. 2018;2017(2017):1820–1827. [PMC free article] [PubMed] [Google Scholar]
- 15.Read-Brown S, Hribar M, Reznick L, Lombardi L, Parikh M, Chamberlain W. Time Requirements for Electronic Health Record Use in an Academic Ophthalmology Center. JAMA Ophthalmology. 2017;135(11):1250. doi: 10.1001/jamaophthalmol.2017.4187. [DOI] [PMC free article] [PubMed] [Google Scholar]
- 16.Linzer M, Levine R, Meltzer D, Poplau S, Warde C, West C. 10 Bold Steps to Prevent Burnout in General Internal Medicine. Journal of General Internal Medicine. 2013;29(1):18–20. doi: 10.1007/s11606-013-2597-8. [DOI] [PMC free article] [PubMed] [Google Scholar]
- 17.Kleiner K, Akers R, Burke B, Werner E. Parent and Physician Attitudes Regarding Electronic Communication in Pediatric Practices. PEDIATRICS. 2002;109(5):740–744. doi: 10.1542/peds.109.5.740. [DOI] [PubMed] [Google Scholar]
- 18.Babbott S, Manwell L, Brown R, Montague E, Williams E, Schwartz M. Electronic medical records and physician stress in primary care: results from the MEMO Study. Journal of the American Medical Informatics Association. 2014;21(e1):e100–e106. doi: 10.1136/amiajnl-2013-001875. [DOI] [PMC free article] [PubMed] [Google Scholar]
- 19.West C, Dyrbye L, Sloan J, Shanafelt T. Single Item Measures of Emotional Exhaustion and Depersonalization Are Useful for Assessing Burnout in Medical Professionals. Journal of General Internal Medicine. 2009;24(12):1318–1321. doi: 10.1007/s11606-009-1129-z. [DOI] [PMC free article] [PubMed] [Google Scholar]
- 20.Panattoni L, Stone A, Chung S, Tai-Seale M. Patients Report Better Satisfaction with Part-Time Primary Care Physicians, Despite Less Continuity of Care and Access. Journal of General Internal Medicine. 2014;30(3):327–333. doi: 10.1007/s11606-014-3104-6. [DOI] [PMC free article] [PubMed] [Google Scholar]
- 21.Mechaber H, Levine R, Manwell L, Mundt M, Linzer M. Part-Time Physicians…Prevalent, Connected, and Satisfied. Journal of General Internal Medicine. 2008;23(3):300–303. doi: 10.1007/s11606-008-0514-3. [DOI] [PMC free article] [PubMed] [Google Scholar]
- 22.Rohland B, Kruse G, Rohrer J. Validation of a single-item measure of burnout against the Maslach Burnout Inventory among physicians. Stress and Health. 2004;20(2):75–79. [Google Scholar]
- 23.Linzer M, Poplau S, Babbott S, Collins T, Guzman-Corrales L, Menk J. Worklife and Wellness in Academic General Internal Medicine: Results from a National Survey. Journal of General Internal Medicine. 2016;31(9):1004–1010. doi: 10.1007/s11606-016-3720-4. [DOI] [PMC free article] [PubMed] [Google Scholar]


