Abstract
Absent a priori knowledge, unsupervised techniques identify meaningful clusters that can form the basis for subsequent analyses. This study explored the problem of inferring comorbidity-based profiles of complex diseases through unsupervised clustering methodologies. This study first considered the K-Modes algorithm, followed by, the self organizing map (SOM) technique to extract co-morbidity based clusters from a healthcare discharge dataset. After validation of general cluster composition for diabetes mellitus, co-morbidity based clusters were identified for pregnancy. The SOM technique was found to infer distinct clusterings of pregnancy ranging from normal birth to preterm birth, and potentially interesting comorbidities that could be validated by published literature The promising results suggest that the SOM technique is a valuable unsupervised clustering method for discovering co-morbidity based clusters.
Introduction
The World Health Organization reports that approximately 830 women die daily from pregnancy complications20. In the United States, the CDC reports an annual death toll of 700 women16. The WHO and CDC report that many of these complicating conditions are treatable; however, identifying the right time for a clinical intervention requires constant monitoring of the mother’s and the fetus’s condition. The utility of such monitoring systems remains challenged by the limited knowledge about the underlying causes of pregnancy complications. There is also a dearth of data-driven predictive models to support the forecasting of potential complications a mother may have later in her pregnancy.
Traditionally, comorbidity analysis infers the effects of other diseases or conditions co-occurring with a primary condition by comparing patient diagnosis profiles. Recent studies utilized a network technique approach to obtain comorbidities, such as graph theory or social-network analysis12,22; however, these methodologies are often bottlenecked by extremely high dimensions. Unsupervised clustering algorithms can offer a general clustering method for analyzing such high dimensions.
There has been research done in analyzing the effectiveness of K-Modes learning meaningful clusters in oncology19 as well as Bayesian inference methods for psychiatric conditions given some prior domain knowledge21. Other unsupervised clustering methods have not been widely explored in finding meaningful comorbidities. This study explored the self-organizing map as an effective unsupervised clustering method for complex conditions such as pregnancy.
The motivation for doing this analysis on pregnancy is because there has been minimal analysis of patient co-morbidity profiles of pregnant women. This study explored whether unsupervised clustering methods such as the self-organizing map could be used to find distinct comorbidity profiles to distinguish between normal and complicated pregnancies. The hypothesis for this study was therefore that there is a different co-morbidity profile between normal and complicated pregnancies.
This study examined two methodologies for unsupervised clustering: (1) K-Modes, and (2) A categorical variation of the self-organizing map. K-Modes is a categorical variation of the K-Means algorithm that was presented by Z. Huang in 199811, and has been used previously for co-morbidity analysis. By using dissimilarity instead of distance, K-Modes was shown to function similarly to K-Means on continuous data. Since its inception, this method has been used in commercial software (e.g., Daylight Chemical Information Systems, Inc, http://www.daylight.com/).
The self-organizing map was proposed by Kohonen13 as an unsupervised neural network that projects high dimensional data onto a one or two dimensional space. It was shown that this projection maintains the topology of the input data, and thus is very useful for inferring cluster structures. Since its inception, this method has been widely applied in image processing4,7,23,24, speech recognition18, time-series prediction2,8, optimization17, and medical diagnosis5,14. The original algorithm, which was designed for continuous data, has not been shown to be effective with categorical data. Similar to the modification used by K-Modes, a dissimilarity measure can be used instead of a distance to learn from the datasets1,6,15. There has been other efforts to further generalize the self-organizing map9; however, these methods often require prior domain knowledge to produce heuristics about the comparison.
The aim of this paper was to use unsupervised clustering methodologies to evaluate their potential to identify meaningful cluster structures from patient hospital discharge data, focusing on diabetes mellitus co-morbidities. Next, the techniques were used to develop clusters based on co-morbidities associated with pregnancy, with the goal to see if there was a discernable difference between normal and complicated pregnancies.
Methods
The methodologies described here were used to analyze data from the healthcare cost and utilization project (HCUP), national inpatient sample (NIS) datasets from 2008 to 2012. Both algorithms were implemented in Julia v0.6.4. The clusterings were done based on Clinical Classifications Software (CCS) codes that were assigned to every patient mapped from their respective ICD-9-CM codes. Each patient had 1 to 25 unique CCS codes assigned to them. In total, there were 252 unique CCS codes present in the dataset. Given, n CCS codes and m patients, the input, D ∈ {0,1}m×n, was constructed as a binary matrix like the following:
where if Pi has CCSj and 0 otherwise for dij ∈ D, i ∈ {1,2,..., m}, j ∈ {1,2,..., n}. As a data pre-processing step, the diabetes-related CCS codes (49 and 50) were first identified and then any patients that did not contain at least one of these codes were discarded. CCS codes that were not present in any of the patients (i.e., the whole column in D was 0) were also removed. Ultimately, each patient was represented as a binary string where each index of the string represented a specific CCS code. If the value was 1, then that patient was diagnosed with that condition and 0 otherwise. We did a similar process for the 18 pregnancy-related CCS codes (177, 180-196).
For every year, the two types of unsupervised clustering algorithms were used in attempt to identify co-morbidity profiles. The first method was a categorical variation of the K-Means algorithm, K-Modes10,11, and the second method was a categorical variation of a Self-Organizing Map (Kohonen Map)6,13,15. The Hamming distance was implemented in the algorithms as the dissimilarity measure. Now, let 1 {x1 = x2} be an indicator function that equals 1 when x1 = x2 and 0 otherwise. Given n CCS codes and two samples and , the Hamming distance is calculated as:
The K-Modes algorithm is a modification to the K-Means algorithm where instead of defining the K centroids as the means of clusters, the mode is used. Let be the set of centroids where , and . Now let denote the ith patient whose closest centroid is c(k). Then, the centroid is defined as
for 1 ≤ j ≤ n. Finally, in order to increase the efficiency of the learning, the clusters were initialized using the feature density based initialization described in Cao et al.3. The overall algorithmic procedure is as follows
Initialize K centroids using the density based approach mentioned above
For every sample, find the centroid that has the shortest hamming distance. Note that each sample is now associated with a centroid as part of its cluster
Update the centroid using the mode definition defined above
Repeat steps 2 and 3 until error converges and no longer decreases
The “elbow method” was used to determine the optimal number of clusters, K. This method plots the overall error of the result to their respective K. The K that displays the most drastic drop in error is considered to be the best choice. For HCUP NIS, it was determined that six was the optimal number clusters for the five years analyzed, as shown in Figure 1.
Figure 1:
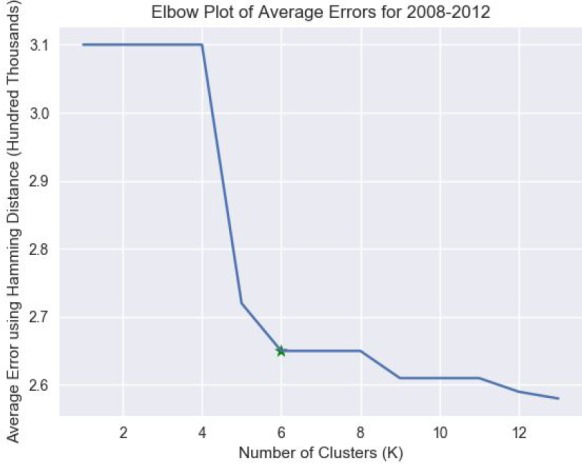
The plot of the average errors across years 2008-2012 for the various number of clusters. The star denotes the elbow. Note that the errors were calculated as the sum of all the Hamming distances between the cluster centroid and the cluster samples.
The Self-Organizing map or the Kohonen Map algorithm employs competitive learning and a neural net to conduct unsupervised learning. For the implementation, the neural architecture was similar to the one shown in Figure 2, but with an 8x8 lattice rather than a 4x4 as shown below.
Figure 2:
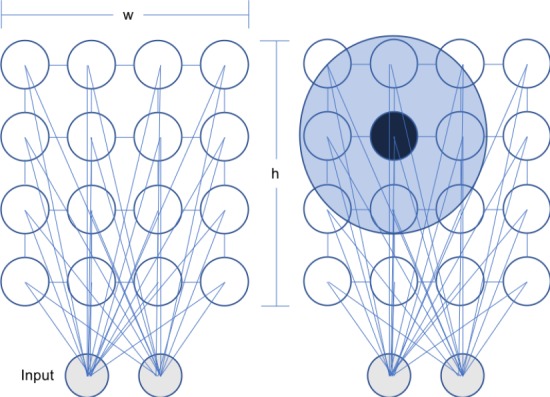
(left) An example of a Self-Organizing Map architecture where the 2 dimensional inputs are mapped to a connected 4x4 lattice of nodes. Note that the study used an 8x8 lattice. (right) An example of the neighborhood function. Let the black node be vb, the area around it is the Gaussian Neighborhood Function, and let the nodes contained within it be v. Note that as v gets closer to the edges of the neighborhood, the value of θ would be smaller as defined by the Gaussian decay.
Now let W(v) be the weight vector, αs be the learning penalty, and θs,v be the neighborhood function at iteration s for node v. Moreover, let D(t) be the sample t and λ be the maximum number of iterations that the algorithm does. Given these variables, for each iteration, the update function is calculated as:
The algorithmic procedure is as follows:
Initialize the grid of lattices with random samples as the initial weights for the nodes,
For every sample, D(t), find the node that has the shortest hamming distance (the best matching unit/node vb) and update the weights by the update function
Repeat above steps for the maximum number of iterations λ
Now, as defined by Kohonen et al.13
where α0 and θ0 are the initial learning rate and initial neighborhood radius respectively and f is the type of neighborhood function to be employed. For the implementation, a Gaussian Decay neighborhood function was used:
where, vb is the best matching node for Dt. The effect of the neighborhood function is that we update the weight of v less the further v is from the best matching node, vb. Figure 2 illustrates the neighborhood function for one iteration.
Similarly to Lebbah et al.15, α0 = 1 and θ0 = 1. As the number of iterations approach the maximum, both the learning rate as well as the neighborhood function decrease in value, requiring updates to be done in smaller increments. The update was modified to use the Hamming distance as described in Chen et al.6 and Lebbah et al.15. A threshold, τ, was defined to accommodate the learning rate and the neighborhood function consisting of a real number output. If a given feature has an update value less than τ, the weights would be changed to 0 and 1 otherwise. For the implementation used in this study, τ = 0.5. More formally, given , threshold τ, and patient D(t) at iteration t
The analyses for each year was done on 50 epochs once the error of the clusters converged.
After the clustering, a PubMed query was constructed in order to verify all possible pairwise co-morbidities that existed within a cluster. The queries were made using the BioServices.EUtils library in Julia. This query was executed on every non-empty node in the self-organizing map lattice and was done for every year of our analysis. For example, given the pair 177 (Spontaneous Abortion) and 180 (Ectopic Pregnancy), the following query was to be made: “Spontaneous Abortion” AND “Ectopic Pregnancy” AND “Pregnancy”[mh]. The resultant count of returned articles was then recorded for each pair.
Results
There were no significant results from the K-Modes algorithm. For both conditions, the algorithm outputted uninteresting centroid modes that were mostly, if not all, zeros, mirroring the sparsity of the input data. When analyzing the data points contained within each centroid, it was often the case that one centroid contained almost the entire dataset with the other five centroids holding one to two samples each. This result repeated across all five years. The latest version of the source code associated from this project is at: https://github.com/bcbi/ncSOM
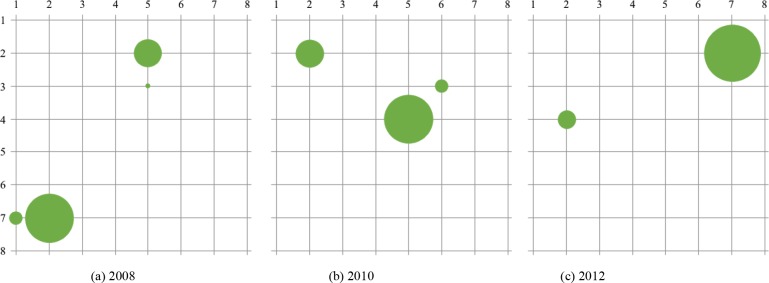
For Diabetes, Figure 3 shows the node activations of the self-organizing map at the end of the iterations. There were one to two major clusters observed.
Figure 3:
Visualization of the final lattice. Note that the size of the nodes corresponds to the proportion of samples clustered in that node. Adjacent node activations can be inferred as one cluster.
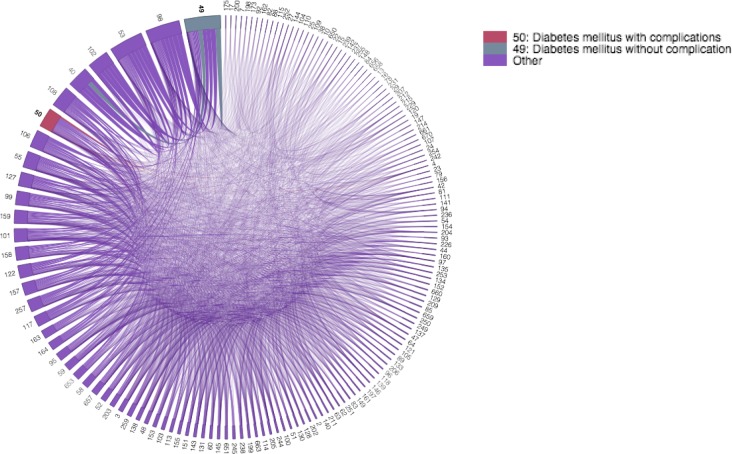
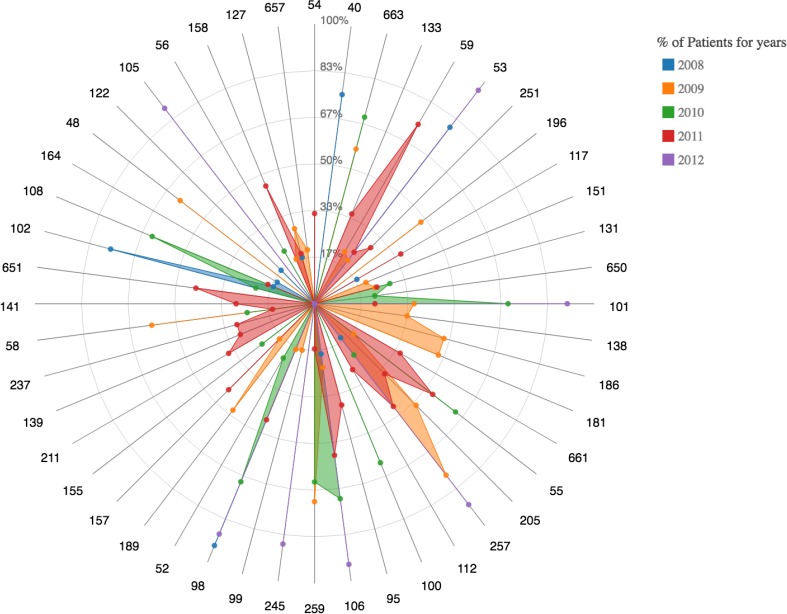
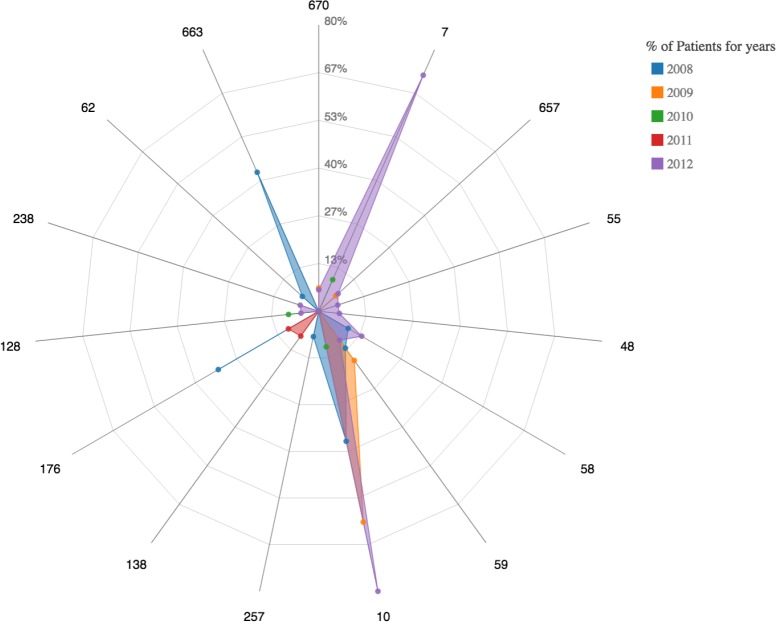
Given these clusters, the pairwise comorbidities suggested by the algorithm were visualized in two different ways as shown in the chord diagram in Figure 4 and the radar plot in Figure 5.
Figure 4:
A chord diagram visualizing all of the pairwise, comorbidity correlations for diabetes in the 2008 dataset. the diabetes codes are colored differently and bold. Tracing the chords of each comorbidity of interest defines the comorbidities that exist in each cluster. Note the separation of clusters between CCS code 50 and 49 as there is no chord connecting them.
Figure 5:
A radar plot demonstrating the comorbidities of condition 49 (Diabetes mellitus without complications) is associated with forming a cluster. Note the absence of overlap between the codes 49 and 50 within the cluster.
PubMed Entrez queries were used to see the number of papers that mentioned both of these CCS codes with Diabetes. From the query, it was found that all discovered comorbidities were reported in at least 3200 papers with 3204 papers mentioning all of the inferred comorbidities.
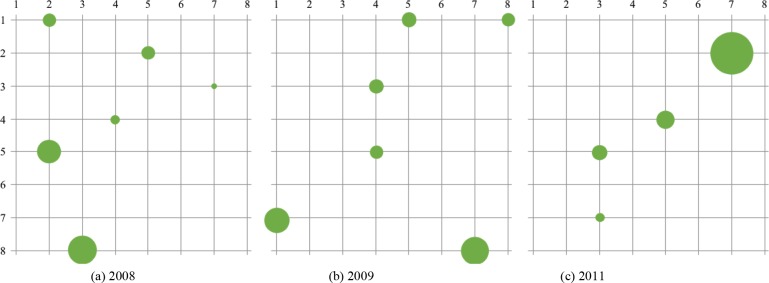
For pregnancy, Figure 6 shows the node activations of the self-organizing map at the end of the iterations. There were four to six major clusters observed.
Figure 6:
Visualization of the final lattice. Note that the size of the nodes corresponds to the proportion of samples clustered in that node.
Given these clusters, Figure 7 and Figure 8 visualizes the pairwise comorbidities. The PubMed Entrez query identified between 900 and 1500 papers for the reported comorbidities.
Figure 7:
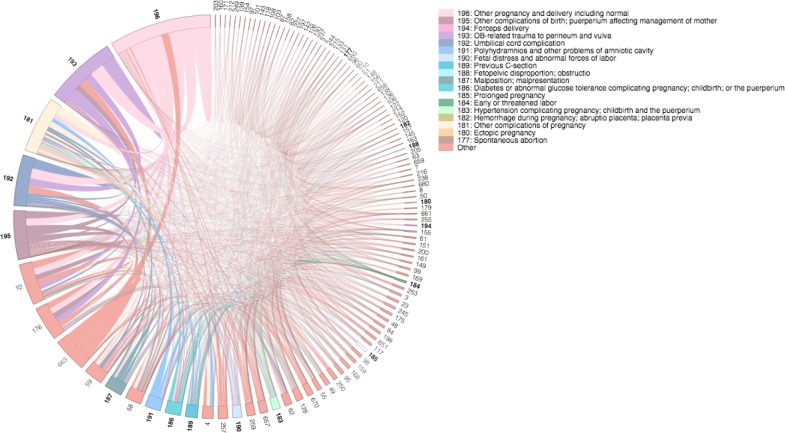
A chord diagram visualizing all of the pairwise, comorbidity correlations for pregnancy in the 2008 dataset. Similar to the diabetes figure, the 18 pregnancy codes are uniquely coded and have bolded CCS labels. Moreover, starting from the top, the proportion of patients having this condition is decreasing counter-clockwise. Note that there are definitely multiple pregnancy codes that cluster together as well as normal pregnancy being the most common. There are no clusters that contain both normal pregnancy and a major complication such as pre-term birth.
Figure 8:
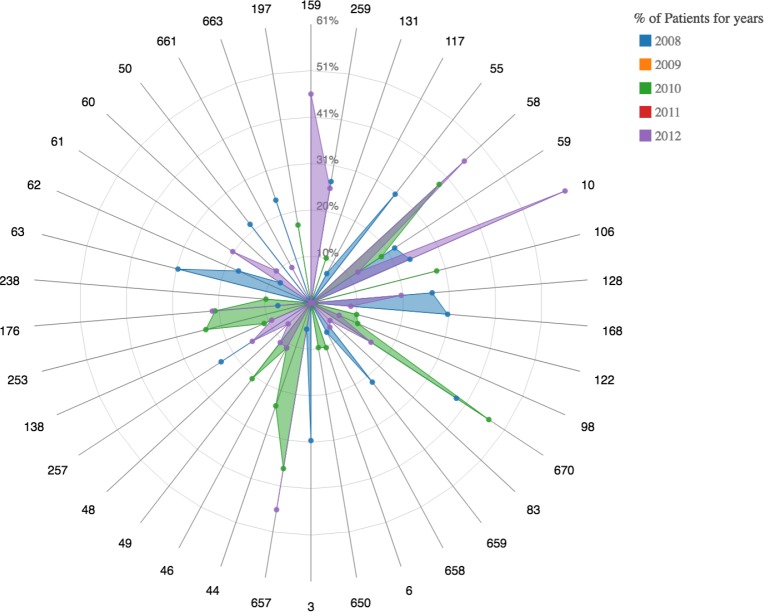
A radar plot demonstrating the comorbidities condition 196 (normal pregnancy without complications) is associated with forming a cluster. Note that this was the condition reported most common by the chord diagram. As shown in the chord diagram, there are no serious complications such as pre-term birth.
Discussion
When Diabetes was used as a benchmark condition for the methodologies, it was found that K-Modes was not a strong enough learner to determine meaningful co-morbidity cluster structures from patient diagnoses profiles. The self-organizing map, however, yielded promising results. The study found that all of the comorbidities inferred by the algorithm were supported by at least 3200 papers in PubMed. Moreover, the comorbidities learned on the pregnancy dataset was supported by at least 900 papers.
When visualizing the activation topology of our lattice like in Figure 3, two prominent cluster structures that each align to either CCS 49 or 50 can be observed. Note that 49 is Diabetes Mellitus without complications and 50 is Diabetes Mellitus with complications; displaying a learned distinction between the two states. Therefore, the benchmark analysis inferred the two prominent cluster structures of Diabetes. Similarly for Pregnancy, Figure 6 shows four to six prominent cluster structures. The largest cluster for all of the years was associated with CCS code 196 or “Other pregnancy and delivery including normal”. This is an expected result. The topology of the lattices suggests that there is a clear cluster with a diagnoses profile that is associated with normal pregnancy. Moreover, for 2008 and 2011, other clusters that are close to the largest activation suggests that the comorbidities of pregnancy with complications share many features with that of a normal pregnancy. Note that for both conditions, there were smaller clusters far from the main activations that were associated with clusters that occurred in a small proportion of the population, suggesting the presence of other potential phenotypes of pregnancy. These inferences are further supported by the chord diagrams in Figures 4 and 7. Notice that for the chord diagrams, distinct comorbidities between normal and abnormal states can be observed. Furthermore, an even closer decomposition of the comorbidities for each condition can be analyzed through the radar plots. This can be portrayed in the radar plot for CCS code 184 or “Early or threatened labor” and its comparison to the plot shown in Figure 8 of “Normal Pregnancy”.
For both of the methods, the Euclidean distance was replaced with the Hamming distance to account for the categorical nature of the data. The Hamming Distance was used as the dissimilarity measure instead of other metrics such as the Jaccard distance or the Sorensen-Dice distance. This decision was based on the metrics chosen by the papers that also implemented these algorithms for categorical datasets. Possible future experiments may include exploring other dissimilarity options.
For K-Modes, a density based initialization method suggested by Huang10,11 was preferred over a random initialization. The reason behind this choice was based off the observation that well initialized centroids often led to the K-Modes algorithm learning better cluster structures3. This was important for us due to the sparsity of medical profiles. Out of the 280 CCS codes, the data limits a patient to have at most 25 of these conditions; thus resulting in a sparse data matrix. Given these profiles, the algorithm had difficulty converging in a reasonable amount of time with a random sampling of K-centroids. In a compute environment of 20 core CPUs (2.2GHz, with 3.4GHz Max Turbo Frequency) and 62 GB of RAM, the algorithm took on average 10 hours of training time per CPU. Further performance gains could be made with GPU-hardware accelerations.
For the self-organizing map, the data was projected onto a two dimensional, 8x8 grid. This decision was motivated by Appiah et al.1 It was observed that the error did not decrease significantly for lattices greater than 8x8 when applied to MNIST datasets. This seemed reasonable since for MNIST, one would expect at most ten clusters, and from the initial look at the data, the elbow method identified around six clusters. Thus, it was decided that this lattice architecture will be maintained. Along with the lattice size, there were three other hyperparameters: the initial learning rate α0, the initial neighborhood parameter θ0, and the update threshold τ. The decision to set the initial learning rate to 1 was both motivated by the exploration done in Appiah et al. as well as an intuition about the learning rate. Given no prior knowledge of the cluster structures, a greater learning rate was chosen so that the weight updates were not initially penalized for a poor initialization. Similar to the learning rate, θ0 was set to be one so that the Gaussian neighborhood would encompass most if not all of the lattice in the earlier iterations. This decision seemed to be the general practice among self-organizing map applications and was suggested by Kohonen13. Finally, τ was set to be 0.5 as done in multiple implementations6,15.
Notice how, in Figure 9, there does not exist a co-occurrence between 184 and 196. It is clear that this diagnoses profile is distinct from that of normal pregnancy. The primary emphasis of this study was to explore the potential of unsupervised clustering techniques to generate potential co-morbidity profiles of interest. It was discovered that K-Modes was not able to render any clusterings, while the self organizing map technique identified potential clusterings of interest. This methodology is scalable to other high dimensional datasets encoded in terminologies other than ICD-9-CM, including ICD-10-CM. These clusters were validated based on a cursory evaluation using co-occurring morbidities in published literature which was used as proxy for validating the clusterings. Before suggesting clinical significance or utility of these groupings, future work must include validation by domain experts.
Figure 9:
A radar plot demonstrating the comorbidities for early or threatened birth.
Conclusion
This study shows how the self-organizing map is a powerful unsupervised clustering method for hospital diagnoses datasets. The experiments confirm that the self-organizing map successfully learns meaningful cluster structures that other widely used methods such as K-Modes cannot. The ultimate purpose of this analysis is for this method to become part of the pipeline for discovering the various patient diagnoses profiles that are associated with the condition. Extensions to this research may include a more robust look at the effects of the hyperparameters on the analysis. Naturally, the results of this algorithm should be further validated by domain experts to determine biological or clinical utility.
Acknowledgements
This study was funded in part by by grant U54GM115467 from the National Institutes of Health. The content is solely the responsibility of the authors and does not necessarily represent the official views of the National Institutes of Health.
References
- 1.Appiah K, Hunter A, Hongying Meng, Shigang Yue, Hobden M, Priestley N. A binary Self-Organizing Map and its FPGA implementation. International Joint Conference on Neural Networks.2009 2009. [Google Scholar]
- 2.Barreto G, Araujo A. Identification and Control of Dynamical Systems Using the Self-Organizing Map. IEEE Transactions on Neural Networks. 2004;15(5):1244–1259. doi: 10.1109/TNN.2004.832825. [DOI] [PubMed] [Google Scholar]
- 3.Cao F, Liang J, Bai L. A new initialization method for categorical data clustering. Expert Systems with Applications. 2009;36(7):10223–10228. [Google Scholar]
- 4.Chang C, Xu P, Xiao R, Srikanthan T. New Adaptive Color Quantization Method Based on Self-Organizing Maps. IEEE Transactions on Neural Networks. 2005;16(1):237–249. doi: 10.1109/TNN.2004.836543. [DOI] [PubMed] [Google Scholar]
- 5.Chen D, Chang R, Huang Y. Breast cancer diagnosis using self-organizing map for sonography. Ultrasound in Medicine & Biology. 2000;26(3):405–411. doi: 10.1016/s0301-5629(99)00156-8. [DOI] [PubMed] [Google Scholar]
- 6.Chen N, Marques N. 2005. An Extension of Self-organizing Maps to Categorical Data. Progress in Artificial Intelligence; pp. 304–313. [Google Scholar]
- 7.Dong G, Xie M. Color Clustering and Learning for Image Segmentation Based on Neural Networks. IEEE Transactions on Neural Networks. 2005;16(4):925–936. doi: 10.1109/TNN.2005.849822. [DOI] [PubMed] [Google Scholar]
- 8.Hirose A, Nagashima T. Predictive self-organizing map for vector quantization of migratory signals and its application to mobile communications. IEEE Transactions on Neural Networks. 2003;14(6):1532–1540. doi: 10.1109/TNN.2003.820834. [DOI] [PubMed] [Google Scholar]
- 9.Hsu C. Generalizing Self-Organizing Map for Categorical Data. IEEE Transactions on Neural Networks. 2006;17(2):294–304. doi: 10.1109/TNN.2005.863415. [DOI] [PubMed] [Google Scholar]
- 10.Huang Z. Clustering large data sets with mixed numeric and categorical values. In Proceedings of the 1st pacific-asia conference on knowledge discovery and data mining,(PAKDD); 1997. Feb 23, pp. 21–34. [Google Scholar]
- 11.Huang Z. Extensions to the k-means algorithm for clustering large data sets with categorical values. Data mining and knowledge discovery. 1998 Sep 1;2(3):283–304. [Google Scholar]
- 12.Khan A, Uddin S, Srinivasan U. Comorbidity network for chronic disease: A novel approach to understand type 2 diabetes progression. International Journal of Medical Informatics. 2018;115:1–9. doi: 10.1016/j.ijmedinf.2018.04.001. [DOI] [PubMed] [Google Scholar]
- 13.Kohonen T. Self-organized formation of topologically correct feature maps. Biological Cybernetics. 1982;43(1):59–69. [Google Scholar]
- 14.Kramer A, Lee D, Axelrod R. 2000. Use of a Kohonen Neural Network to Characterize Respiratory Patients for Medical Intervention. Artificial Neural Networks in Medicine and Biology; pp. 192–196. [Google Scholar]
- 15.Lebbah M, Badran F, Thiria S. 2000. Jan 1, Topological map for binary data. InESANN; pp. 267–272. [Google Scholar]
- 16.Maternal mortality [Internet] World Health Organization. World Health Organization. [cited 2018 Aug 6]. Available from: http://www.who.int/news-room/fact-sheets/detail/maternal-mortality.
- 17.Milano M, Koumoutsakos P, Schmidhuber J. Self-Organizing Nets for Optimization. IEEE Transactions on Neural Networks. 2004;15(3):758–765. doi: 10.1109/TNN.2004.826132. [DOI] [PubMed] [Google Scholar]
- 18.Mäntysalo J, Torkkola K, Kohonen T. Mapping content dependent acoustic information into context independent form by LVQ. Speech Communication. 1994;14(2):119–130. [Google Scholar]
- 19.Papachristou N, Barnaghi P, Cooper BA, Hu X, Maguire R, Apostolidis K, Armes J, Conley YP, Hammer M, Katsaragakis S, Kober KM. Congruence between latent class and K-modes analyses in the identification of oncology patients with distinct symptom experiences. Journal of pain and symptom management. 2018 Feb 1;55(2):318–33. doi: 10.1016/j.jpainsymman.2017.08.020. [DOI] [PMC free article] [PubMed] [Google Scholar]
- 20.Reproductive Health [Internet] Centers for Disease Control and Prevention. Centers for Disease Control and Prevention. 2018. [cited 2018 Aug 6]. Available from: https://www.cdc.gov/reproductivehealth/maternalinfanthealth/pregnancy-relatedmortality.htm.
- 21.Ruiz FJ, Valera I, Blanco C, Perez-Cruz F. Bayesian nonparametric comorbidity analysis of psychiatric disorders. The Journal of Machine Learning Research. 2014 Jan 1;15(1):1215–47. [Google Scholar]
- 22.Sundarrajan S, Arumugam M. Comorbidities of Psoriasis - Exploring the Links by Network Approach. PLOS ONE. 2016;11(3):e0149175. doi: 10.1371/journal.pone.0149175. [DOI] [PMC free article] [PubMed] [Google Scholar]
- 23.Tan X, Chen S, Zhou Z, Zhang F. Recognizing Partially Occluded, Expression Variant Faces From Single Training Image per Person With SOM and Soft k-NN Ensemble. IEEE Transactions on Neural Networks. 2005;16(4):875–886. doi: 10.1109/TNN.2005.849817. [DOI] [PubMed] [Google Scholar]
- 24.Visa A. A texture classifier based on neural network principles. IJCNN International Joint Conference on Neural Networks.1990 1990. [Google Scholar]


