Abstract
The ability to assess data quality is essential for secondary use of EHR data and an automated Healthcare Data Quality Framework (HDQF) can be used as a tool to support a healthcare organization’s data quality initiatives. Use of a general purpose HDQF provides a method to assess and visualize data quality to quickly identify areas for improvement. The value of the approach is illustrated for two analytics use cases: 1) predictive models and 2) clinical quality measures. The results show that data quality issues can be efficiently identified and visualized. The automated HDQF is much less time consuming than a manual approach to data quality and the framework can be rerun repeatedly on additional datasets without much effort.
Introduction
Researchers using big data and innovative data science techniques have made great strides in many industries. Data that is high volume, consisting of a variety of data types or is changing quickly (its velocity), is considered “big data”. Innovative data science techniques such as deep learning have produced impressive results like self-driving cars and accurate search results. The healthcare industry, however, is falling behind other industries as it tries to make use of its data.1 The adoption of electronic health records (EHR) allows healthcare organizations to accumulate, and reuse large amounts of data in healthcare to improve patient outcomes, reduce costs, make workflows more efficient and support research.
There are many challenges with using EHR data for research including lack of data standardization, poor interoperability, privacy issues preventing aggregating complete healthcare records and poor data quality. The Office of the National Coordinator (ONC) is focusing attention on the first three issues, but the last issue, data quality, is not getting enough attention.2 EHR data is primarily collected to document care delivery and for billing. However, healthcare organizations routinely make secondary use of this EHR data for clinical practice improvement, quality reporting, research and other projects. Therefore, it is critical for healthcare organizations to incorporate monitoring data quality in support of existing and future uses of the data to ensure valid results.
Poor quality data can lead to results that cannot be trusted.3 Health care organizations need to direct more effort to ensure that high quality data is entered into the EHR. Doug Fridsma, President of AMIA stated, “The data sets are probably not high-quality enough for the kinds of clinical questions providers want to ask”.4 Organizations need to ensure that data governance initiatives are implemented.5 One way to assess data quality is to implement a healthcare data quality framework (HDQF).6 A framework is a reusable platform for solving a particular problem, in this case assessing healthcare data quality. There are a few healthcare focused frameworks that assess data quality, but most are tailored to specific data models and do not address the EHR as a complex, organization specific repository of health data.7,8
When an organization undertakes research or quality improvement projects, the first step is to understand the quality of the data.9 Without a framework, assessing data quality is typically a manual and ad hoc process. Data is examined, outliers and data issues are identified, and those rows or columns are manually removed from the data and the process is repeated. A better approach is to specify expectations of the data and then measure how well it conforms. For example, we expect all of the patient records to have a birth date filled in. We can specify this as a rule that the data should follow and then see if it does. We can continue to add more rules to the data expectations. The data can be assessed for conformance to these rules using a manual/ad hoc methodology or it can be automated through the use of a HDQF. The advantage of the HDQF is that it is repeatable and reproducible when applied to the original dataset. The specification of data expectations can be defined as an ontology that is directly usable by a computer and can also be reused for a new dataset or for other research projects for the same clinical area.
The purpose of this study is to demonstrate how the application of a comprehensive HDQF to assess data quality is an effective approach to identifying EHR data issues. The generalizability of the approach is illustrated using two analytics use cases: 1) predictive models and 2) clinical quality measures.
Methods
A previously described approach to quantifying data quality10 was developed into the HDQF and implemented as a Python software program. The assessment method requires that an ontology be defined that describes the concepts and semantics for the clinical area of interest (called the Domain Ontology). The semantics are expressed as rules (constraints) that the data are expected to satisfy. An example of a constraint is that an admission date must be earlier than a discharge date. The approach defines an assessment method that computes data quality as the proportion of constraints that are satisfied for each variable in the ontology across the entire dataset divided by the total number of data values for the population.11 The assessment method gives quantities for each aspect of data quality (called Measures). Importantly, the method allows a single quantity to be computed for related groups of variables (for example, all of the patient related variables or all of the medication related variables). And a data quality Measure can be computed for the dataset as a whole. This ability to aggregate data quality Measures along the hierarchy of the data is an important aspect of the method.
The HDQF assesses four data quality Measures (Representation Completeness, Domain Completeness, Domain Constraints, Domain Consistency). Representation Completeness quantifies how much data is missing. For example, if a patient’s birth date is not filled in then it is missing. Domain Completeness also quantifies missing data but takes into account whether the data is optional. For example, the death date of a patient will only be filled in if the patient has died (it is optional) but a patient should always have a birth date (it is required). Domain Constraints is a measure of how well the data conforms to all of the rules that are defined. For example, we expect that the patient’s birth date occurs before the death date (if it exists) and we expect a diagnosis code to be a valid ICD10 code (or similar coding system). Finally, Domain Consistency quantifies how well the data satisfies the semantics of the Domain. A data item has Domain Consistency if it is Domain Complete and satisfies all of its Domain Constraints. A comprehensive overview of the HDQF and its properties can be found elsewhere.10
For this study, the HDQF was applied to two analytic use cases: predictive models and clinical quality measures.
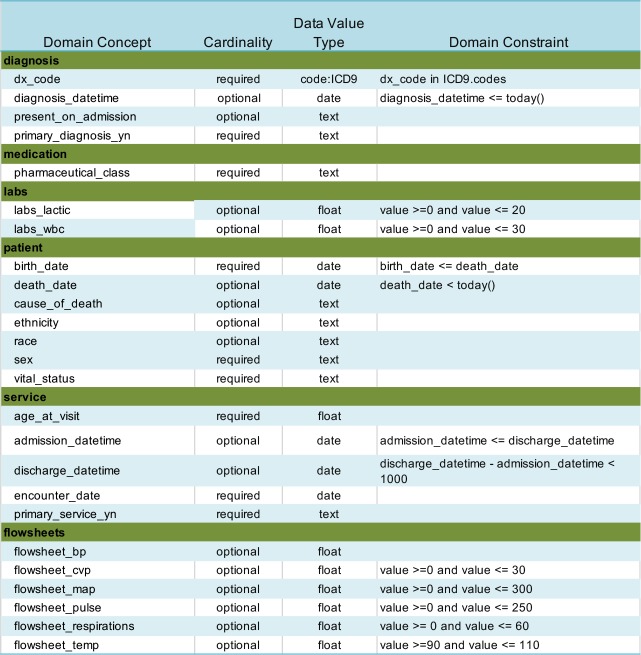
Use Case 1: Predictive Models. Sepsis continues to be a difficult problem for hospitals. The Surviving Sepsis Campaign (SSC) Guidelines12 were developed to help physicians diagnose and treat sepsis earlier to reduce patient mortality. A research project was undertaken to predict the effect on mortality for delays in adherence to the guidelines.13 A sample of 21,000 patients containing de-identified data was obtained from the clinical data warehouse of a Midwest health system which included EHR data for more than 2.4 million patients. Patients 18 years of age or older who were hospitalized between 01/01/2011 and 07/31/2015 with a billing diagnosis of severe sepsis or septic shock (ICD-9 995.92 and 785.8*) were included. A sepsis domain ontology was developed and mapped to data elements from the EHR, then analyzed for completeness and consistency using the HDQF. The domain ontology was intentionally kept simple in order to clearly illustrate the utility of the HDQF. The sepsis domain ontology with associated constraints is shown in Table 1.
Table 1:
Sepsis Domain Ontology
 |
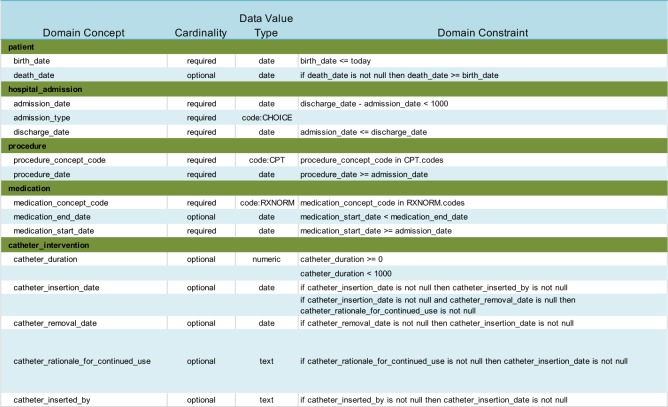
Use Case 2: Clinical Quality Measures. Electronic clinical quality measures (eCQM) are becoming increasingly important for quality improvement efforts and reimbursement. Most health care organizations are still computing clinical quality measures by manually abstracting critical information from the EHR. Both the Centers for Medicare and Medicaid (CMS) and The Joint Commission (TJC) have published research showing that computing the quality measure electronically directly from the EHR data only matches manual abstraction 50% of the time.14,15 This is partly due to poor data quality within the EHR. Previous research examined an eCQM targeted to reducing Catheter-Associated Urinary Tract Infection (CAUTI) rates.11 A 200,000 encounter random sample was extracted from a clinical data warehouse of a Midwest health system. The CMS178 quality measure was calculated across time to assess how well the organization was removing catheters within 48 hours after surgery. A simplified CAUTI domain ontology was developed and mapped to data elements and the HDQF was applied to the data. Table 2 describes the simplified CAUTI Domain Ontology with its constraints.
Table 2:
CAUTI Domain Ontology
 |
Results
The HDQF was applied to EHR data for both the predictive model and the clinical quality measure use cases. Data quality measures were computed for the four data quality measures for each of the variables in the Domain Ontologies for each use case. Measures were also calculated for categories of variables (for example, all the variables related to the patient) and for the dataset as a whole.
The results for the sepsis domain are shown in Table 3. The HDQF software took approximately 10 hours to execute. Prior to using the HDQF, the sepsis data was assessed using a manual approach. That process took almost 3 months of back-and-forth evaluations between a clinician and a data analyst to produce the final dataset and associated data quality measures. Even with the additional work that was required to initially map the HDQF to the data, using the HDQF software was a significantly faster process. The data quality measures for the CAUTI Domain Ontology are shown in Table 4.
Table 3:
Data Quality Measures for Sepsis Domain
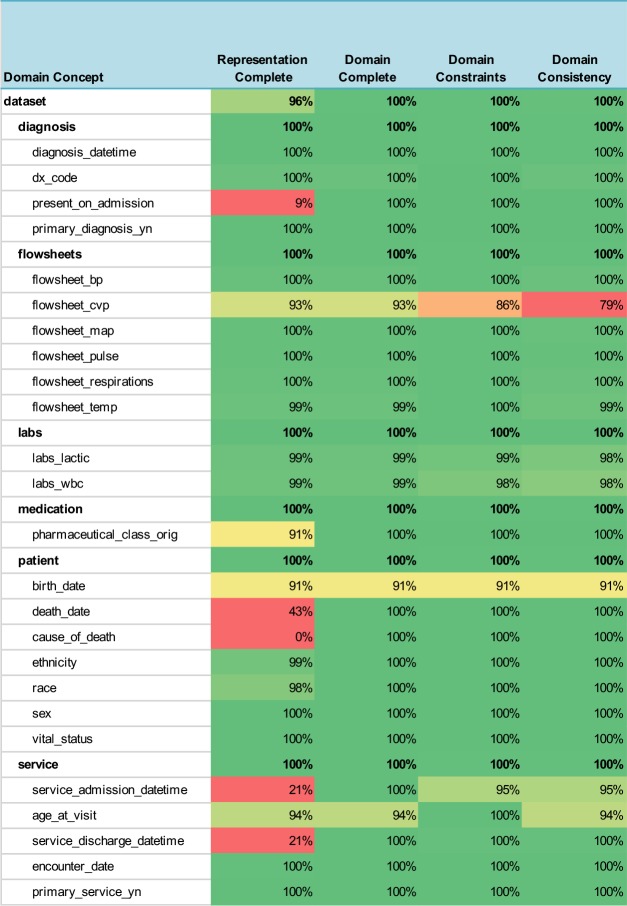 |
Table 4:
Data Quality Measures for CAUTI Domain
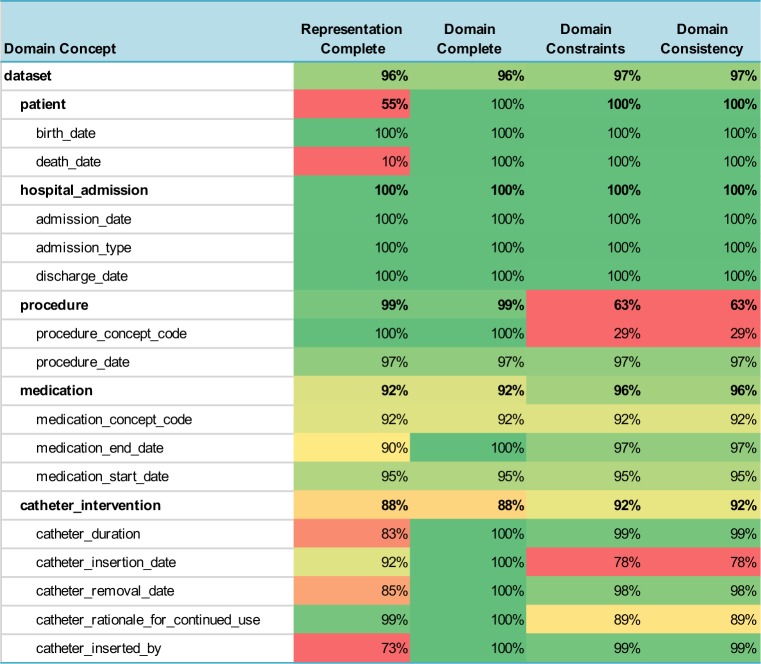 |
Overall, the measures ranged from 0% to 100%, but the table also provides an easy way to visualize these values by using a heatmap to highlight the potential problem areas in red and variables that have good data quality are shown in green. The cells in the table are colored with increasing shades of green to reflect how much the data quality measure exceeded the threshold for “good” data quality (≥= 90%) and are colored in shades of red if they were below the threshold that indicates poor data quality (< 80%). Data quality measures in between were colored in shades of yellow. One can easily see the overall data quality of the entire dataset listed at the top of the table (the domain concept is labeled “dataset”) and the data quality summary for each category of variables (for example, the patient or medication variables) is also shown.
Another powerful way to view the data quality measures is by using a radar graph. A radar graph can show multiple dimensions of the data at the same time. In this case, all four data quality measures (Representation Completeness, Domain Completeness, Domain Constraints, Domain Consistency) are shown for a particular variable. A radar graph can also compare more than one variable on the same graph. For example, Figure 1 compares all of the data quality measures for procedure_concept_code against the procedure_date. This shows that the procedure_date data has high quality (.97) along all four axes, while the the procedure_concept_code has poor quality along the Domain Constraints and Domain Consistency dimensions. This suggests that the procedure data requires deeper investigation. This type of visualization can also be used to compare two datasets or the data quality measures of a single dataset at two points in time.
Figure 1:
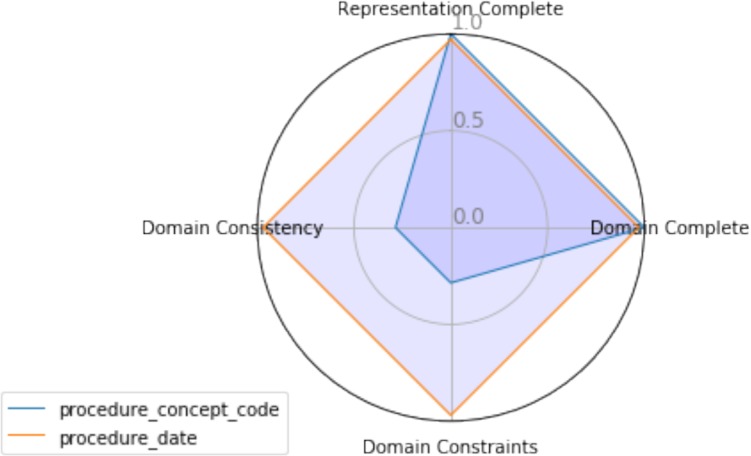
Radar Graph of Data Quality Measures for Two Variables
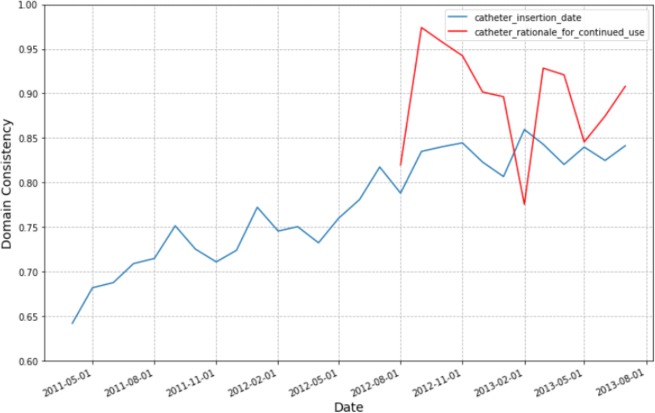
We are also able to compute data quality measures at different points in time. For example, Figure 2 shows the trend in the Domain Consistency measures for two of the CAUTI variables over a 2-year period.
Figure 2:
Domain Consistency Trends for Key CAUTI Variables
Discussion
The purpose of this study is to demonstrate how the application of a comprehensive HDQF to assess data quality is an effective approach to identifying EHR data issues. The results demonstrate that EHR data contains errors and previous research has shown that data quality issues can lead to invalid results which may impact research and clinical decision-making.16 Investigators that reuse data for modeling or quality improvement must take into account data quality issues, which may be a daunting task due to the lack of automated tools designed for this purpose. Missing and inconsistent data can lead to false conclusions about whether clinical quality is improving or whether a model is predictive. The HDQF used in this research provided a standardized, reusable and automated approach to assessing data for different use cases. The approach was demonstrated for two use cases: a clinical quality measure and a predictive model for sepsis. But the approach is generalizable to any other clinical quality measure, predictive model and data assessment needs in clinical research as long as data expectations are modeled in an ontology.
For the sepsis predictive model, using the HDQF significantly reduced the time it took to assess data quality. Before the HDQF was utilized, the sepsis researchers would manually review the data and try to hunt down data quality issues. Identifying missing data was relatively easy but finding inconsistent data outliers was more difficult. The manual approach was a time-consuming back-and-forth process that took months to complete. And what was worse, when the research team received an updated data extract, much of the manual assessment work needed to be redone. The ability to quickly rerun the HDQF on new data (or re-extractions of existing datasets) is a significant advantage of this approach. This reduces the burden on researchers, speeds up clinical data mining and model training; thus, contributing to more efficient and cost-effective outcomes.
In practice, using a HDQF allows an investigator to more easily identify issues with the data she is depending on for research, quality improvement and standard reports. Because the domain ontologies define which data variables allow optional data, it is easy to see when missing data will lead to problems with how the data is being used (Domain Completeness). In the CMS178 example, the death_date was missing most of the time. But since this variable is optional, it can still safely be used in the calculation of the eCQM. On the other hand, the medication_concept_code (i.e. the RxNorm code) was only present 92% of the time. This may prove to be problematic in the eCQM computation. The Domain Constraint Measure highlights other potential issues with the data. The procedure_concept_code has a measure of 29%. This indicates that this variable was only consistent with the domain (i.e. it was a valid CPT code) less than a third of the time so it cannot be used reliably in the eCQM calculation.
Summarizing data quality measures by categories is also very useful. For example, if a researcher is interested in catheter documentation she can see that the data is 88% complete and 92% consistent. She can look at the red fields in Representation Complete to quickly see which fields are missing (catheter_inserted_by and catheter_duration). The key inconsistency is the red field for Domain Consistency of the catheter_insertion_date. Most of the overall catheter data inconsistency appears to be failure to satisfy the Domain Constraints for the catheter_insertation_date so the researcher should examine that variable more closely.
Graphing the Domain Consistency trends for the important variables used in the CMS178 quality measure calculation showed that data quality for the catheter_insertion_date improved over time. This was because in August 2012, the hospital started an initiative to reduce CAUTI within the hospital. The initiative included asking the nurses to document CAUTI related information better. It can easily be seen that it wasn’t until August 2012 that the health system required supplying a reason to continue catheterization (catheter_rationale_for_continued_use variable). The Domain Consistency of the catheter_insertion_date improved significantly over time. Over the 2-year period, the rate for correctly recording the catheter_insertion_date improved from 65% to 85%. Over this same period, the CMS178 eCQM itself also improved. The ability to visualize the improvements in data quality are important feedback to the staff that are undertaking documentation improvements. This allowed nursing leaders to see that their quality improvement initiatives were working.
There are a number of limitations of this research. First, the domain ontologies that were used were kept intentionally simple in order to better illustrate the assessment process. Ontologies that describes the clinical domain must be predefined and given as an input to the HDQF, but the important aspect is that the HDQF itself, the methods for assessment and the data quality metrics mean the same regardless of which clinical domain ontology is being examined. Significant work must be undertaken to define these domain ontologies, but by using the HDQF, that work can be reused across different research projects.
A second limitation is that these assessments were not done on truly big datasets. The largest, 200,000 encounters, does show that using an automated HDQF makes data quality assessment more efficient, but the next step will be to assess much larger datasets. Finally, the authors intend to make the HDQF used in this study freely available to other researchers as an open source project. Work is underway to better organize the code to make it easily usable by any researcher. Further research is also needed to assess whether this same HDQF framework can work across organizational boundaries and be used to assess national clinical datasets which receive data from multiple organizations and for multiple conditions. Finally, the HDQF as implemented does not assess all aspects of data quality There are other important aspects of data quality (such as assessing the correctness and the timeliness of the data) that still need to be developed.
Conclusion
The ability to assess data quality is essential for secondary use of EHR data and an automated HDQF can be used as a tool to support a healthcare organization’s data quality initiatives. Use of a general purpose HDQF provides a method to assess and visualize data quality to quickly identify areas for improvement. The generalizability of the approach was illustrated using two analytics use cases: 1) predictive models and 2) clinical quality measures. The results showed that data quality issues can be efficiently identified and visualized. The automated HDQF is much less time consuming than a manual approach to data quality and the framework can be rerun repeatedly on additional datasets without much effort.
Acknowledgements
This work was supported in part by NIH NCATS grant UL1 TR002494 and NSF grant 1602394. The content is solely the responsibility of the authors and does not necessarily represent the official views of the National Institutes of Health or the National Science Foundation.
References
- 1.Hersh WR, Weiner MG, Embi PJ, Logan JR, Payne PR, Bernstam E V. Caveats for the use of operational electronic health record data in comparative effectiveness research. Med Care. 2013;51(8):S30–7. doi: 10.1097/MLR.0b013e31829b1dbd. [DOI] [PMC free article] [PubMed] [Google Scholar]
- 2.Butler M. Eight Predictions for ‘ 18 : Experts Prognosticate the Top HIM Topics for the Year Ahead and Advise on How to Prepare. J AHIMA. 2018;89(1):14–9. [Google Scholar]
- 3.Zozus MN, Hammond WE, Green BB, Kahn MG, Richesson RL, Rusincovitch SA. Assessing Data Quality for Healthcare Systems Data Used in Clinical Research [Internet]. NIH Collaboratory. 2014. pp. 1–26. [cited 2016 Mar 1] Available from: https://www.nihcollaboratory.org/Products/Assessing-data-quality_V1 0.pdf.
- 4.Hegwer R. Making Good on the Promise of Big Data in Health Care [Internet]. HFMA Leadership. 2015. [cited 2018 Feb 15]. Available from: http://www.hfma.org/Leadership/Archives/2015/Fall/Making_Good_on_the_Promise_of_Big_Data_in_Health_Care/
- 5.Glaser J. A Blueprint for Hospitals to Manage Their Valuable Data [Internet]. Hospitals & Health Networks. 2017. [cited 2018 Feb 2]. Available from: https://www.hhnmag.com/articles/8057-data-is-increasingly-valuable-heres-how-hospitals-can-manage-it.
- 6.Almutiry O, Wills G, Alwabel A, Crowder R, WaIters R. Toward a framework for data quality in cloud-based health information system. In: Information Society (i-Society), 2013 International Conference. IEEE; 2013. pp. 153–7. [Google Scholar]
- 7.Sturtevant J. PCORnet Data Characterization and Visualization PCORnet. 2015.
- 8.Observational Medical Outcomes Partnership. OSCAR—Observational Source Characteristics Analysis Report (OSCAR) Design Specification and Feasibility Assessment. [Internet] 2011. Available from: http://omop.fnih.org/OSCAR.
- 9.Warwick W, Johnson S, Bond J, Fletcher G. A Framework to Assess Healthcare Data Quality. Eur J Soc Behav Sci. 2015. p. XIII.
- 10.Johnson SG, Speedie S, Simon G, Kumar V, Westra BL. A Data Quality Ontology for the Secondary Use of EHR Data. In: AMIA 2015 Annual Symposium Proceedings. American Medical Informatics Association; 2015. pp. 1937–46. [PMC free article] [PubMed] [Google Scholar]
- 11.Johnson SG, Speedie SM, Simon G, Kumar V, Westra BL. Application of an Ontology for Characterizing Data Quality for a Secondary Use of EHR Data. J Appl Clin Informatics. 2016;7:69–88. doi: 10.4338/ACI-2015-08-RA-0107. [DOI] [PMC free article] [PubMed] [Google Scholar]
- 12.Dellinger RP, Levy MM, Rhodes A, Annane D, Gerlach H, Opal SM. Surviving Sepsis Campaign: International Guidelines for Management of Severe Sepsis and Septic Shock, 2012. Intensive Care Med. 2013;39(2):165–228. doi: 10.1007/s00134-012-2769-8. [DOI] [PMC free article] [PubMed] [Google Scholar]
- 13.Pruinelli L, Yadav P, Hangsleben A, Johnson J, Dey S, Mccarty M. 2016. A Data Mining Approach to Determine Sepsis Guideline Impact on Inpatient Mortality and Complications. In: AMIA Proceedings from Summit on Translational Science; pp. 194–202. [PMC free article] [PubMed] [Google Scholar]
- 14.Dardis M, Craig P, Biglari M. The Evolution of Quality Measurement [Internet]. AMIA 2016 Annual Symposium Proceedings. 2016. [cited 2018 Jan 7]. Available from: http://knowledge.amia.org/polopoly_fs/1.3369256.1481641927!/fileserver/file/711562/filename/2490839-Panel.pdf.
- 15.Centers for Medicare & Medicaid Services (CMS) Hospital Inpatient Quality Reporting (IQR) eCQM Validation Pilot Summary. 2016.
- 16.Johnson SG, Speedie S, Simon G, Westra BL. Quantifying the Effect of Data Quality on the Validity of an eMeasure. J Appl Clin Informatics. 2017;8:1012–21. doi: 10.4338/ACI-2017-03-RA-0042. [DOI] [PMC free article] [PubMed] [Google Scholar]


