Abstract
A major restriction on optical imaging techniques is the range of available fluorophores that are compatible with aqueous media without aggregation, absorb light above 750 nm with high extinction coefficients, fluoresce with relatively high quantum yields, and resist photodecomposition. Indocyanine green (ICG or A in this paper) is an important example of a fluorophore that fits this description. Other dyes that are becoming increasingly prevalent are select heptamethine cyanine dyes (Cy7) which feature a cyclohexyl framework to rigidify the conjugated alkenes, and meso-chlorine substitution; MHI-148 (B) is one example.
Methods: Research described here was initiated to uncover the consequences of a simple isoelectronic substitution to MHI-148 that replaces a cyclohexyl methylene with a dialkyl ammonium fragment. Solubility experiments were carried out in aqueous and cell culture media, photophysical properties including fluorescence quantum yields, brightness and stability were measured. Moreover, in vivo pharmacokinetics, distribution and tumor seeking properties were also explored.
Results: Modification to incorporate dialkyl ammonium fragment leads to a brighter, more photostable fluorophore, with a decreased tendency to aggregation, complementary solubility characteristics, and a lower cytotoxicity.
Conclusion: All the above-mentioned parameters are favorable for many anticipated applications of the new dye we now call quaternary cyanine-7 or QuatCy.
Keywords: heptamethine cyanine, fluorescence imaging, tumor seeking, near-infrared
Introduction
There is a growing sentiment that new optical methods for clinical imaging and diagnosis may be transformative in the next decade. This assertion is reasonable because optical images can be accumulated in real-time, during surgery, and on substantially less costly equipment than for complementary techniques like positron emission tomography and magnetic resonance imaging. This is also true because there is vast room for improvement to clinical optical imaging methods currently used today 1-5.
Many of the potential improvements to clinical optical imaging trace back to development of new fluorophores with improved photophysical and solubility characteristics. There is also the intriguing prospect of using different dyes that accumulate in diseased and healthy tissue giving, for instance, images of red-stained abnormalities on a panorama of green. Despite this, indocyanine green (ICG, A) is the only near-IR (absorbance maximum above 750 nm) FDA-approved optical marker for clinical use 6, 7.
ICG is widely used in surgical procedures because it is fluorescent with an absorbance maximum above 750 nm. Excitation of dyes below 750 nm becomes impractical, even with the highest laser powers that can be applied in surgical settings, if they are obscured by more than a few millimeters of tissue; to “calibrate” this statement, depth of penetration of light wavelength 800 nm into tissue is twice that of light 630 nm 8. Another attribute of ICG is that the structure contains two sulfonate groups and only two small planar aromatic components; these characteristics engender increased aqueous-media solubility and suppress aggregation to particles with heterogeneous dimensional, optical, and physiological properties.
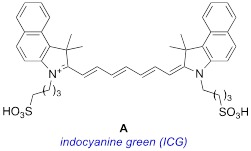
Despite its attributes, there are several photophysical characteristics of ICG that might be improved via structural modifications; one of these is quantum yield. Under a typical set of conditions, the quantum yield of ICG (A) in 10 mM pH 7.4 PBS buffer is only 0.017. That quantum yield may seem discouragingly low when evaluated side-by-side with fluorophores that are excited below 600 nm, for which Φ can be higher than 0.9. However, dyes excited below 600 nm are almost useless for non-superficial real-time clinical imaging in patients, even if they have high quantum yields, due to the tissue penetration issue. Conversely, a two-fold Φ-improvement relative to ICG, ie >0.034, would literally double the brightness of this fluorophore on the operating table (assuming all other factors remain equal). Exactly the same criteria can be applied to extinction coefficient at the excitation wavelength, because brightness is the product of this parameter and quantum yield: doubling extinction coefficient alone corresponds to a two-fold improvement brightness. Finally, another parameter that could clearly be improved relates to photostabilities. Photostabilities of cyanine dyes tend to be low hence their lack of robustness can be problematic under continuous illumination 9-11.
It is certainly also possible to make ICG modifications to change the ways the derivatives interact with living tissue. ICG accumulates in liver and gastrointestinal tract 12; it can be used to image tumors, but it is not disposed to especially accumulate in cancer tissue. There is enormous scope for discovery of new near-IR dyes that stain all tissue equally (to provide background) and others that accumulate in specific organs or in diseased tissue, but ICG does not fit cleanly into either category. Expanding the palette of near-IR dyes used for painting diseased tissue is a particularly interesting field, and that is why near-IR fluorophore B is so intriguing.
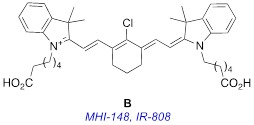
Fluorophore B is almost twice as bright as the clinical benchmark, ICG, A (see Table 1 in Results and Discussion, below). This fluorophore, variously known as MHI-148 13 or IR-808 14, is also exceptional because it accumulates in solid tumors (eg prostate 15, gastric 16, kidney 17) but not in normal cells and tissue 13, 14, 18-20. Consequently, tumors in animal experiments can be stained with B then detected in vivo via optical imaging 13, 14, 16, 17, 21, 22. This “tumor-localizing” dye B has been applied extensively for in vivo experiments but not, to the best of our knowledge, in patients. Lack of application of B in patients could be attributed to the fact that this dye is cytotoxic, and this is undesirable for diagnostic optical imaging.
Table 1.
Comparative photophysical properties of A, B and 1 in 10 mM PBS buffer pH 7.4
| compound | λabs | λem | ∆λa | εmax | Φb | brightness | relative |
|---|---|---|---|---|---|---|---|
| (nm) | (nm) | (cm-1M-1) | (εmax x Φ) | brightness | |||
| A | 779 | 807 | 28 | 111060 | 0.017 | 1941 | 1.00 |
| B | 775 | 799 | 24 | 149940 | 0.025 | 3689 | 1.90 |
| 1 | 745 | 768 | 23 | 192460 | 0.051 | 9901 | 5.10 |
aStokes' shifts of A, B and 1. bFluorescence quantum yield were performed using A (Φ = 0.13 in DMSO; λex730 nm) as a standard.
In summary, even though cyanine-7 dyes are privileged near-IR fluorophores for optical imaging in tissue, there is plenty of scope for improvement. Current understanding does not facilitate prediction of modified Cy7 structures with improved brilliance, or which will localize in different tissues; dyes with these characteristics largely have to be discovered rather than invented. However, rational changes to increase water solubilities and suppress aggregation effects can be made, then tests can be launched to probe for these “known unknowns”. With this strategy in mind, we conceived the novel fluorophore 1, and that molecule is the focus of this paper.
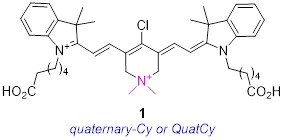
Structure 1 is identical to B except for isoelectronic substitution of a methylene group with a dimethyl quaternary ammonium nitrogen. Focusing on this key substitution then, we began to call this fluorophore quaternary cyanine-7, or QuatCy. That simple modification changes several fundamental properties of the dye in significant ways. Relative to B, 1 has one greater positive charge at all ionization states since the quaternary ammonium is cationic at all physiological pH values. At face value, it would be expected to be more soluble in water and less inclined to aggregate since the dimethyl ammonium functionality repels like molecules via charge-charge interactions, breaks the planarity of the structure, and together these factors help to prevent aryl stacking. In the event, QuatCy (1) is more water soluble than B, but its solubility characteristics are more complex and interesting than anticipated. Data presented below show that QuatCy is, in fact, also less prone to aggregation in aqueous media than B. Intriguingly, testing of some known unknowns for QuatCy also revealed potentially useful photophysical and physiological characteristics that could not have been foreseen prior to experimentation.
Results and Discussion
Design, Syntheses, and Solid State Structure
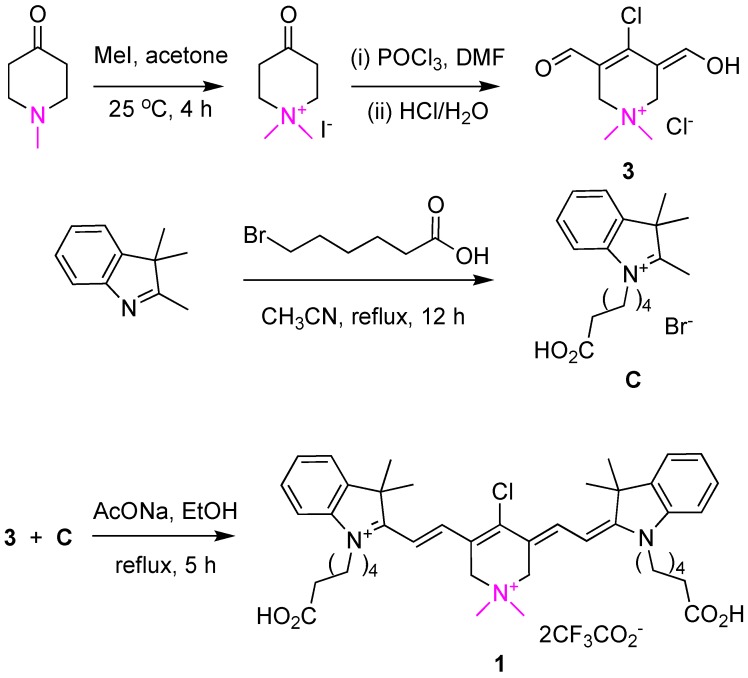
Just as dye B can be made from cyclohexanone, so 1 can be made from the corresponding known 23 ammonium salt shown in Scheme 1. Reaction of that ammonium salt under the Vilsmeier-Haack conditions furnished one component for the convergent final step, ie tautomerized-dialdehyde 3. The known indolozinidinium C 24 is the other component of the QuatCy synthesis. Condensation of 3 and C worked well in refluxing ethanol 14.
Scheme 1.
Synthesis of compound 1 converges from two key fragments, the Vilsmeier-Haack product 3 and the indolozinidinium C.
Isolation of cyanine dyes in most syntheses tends to be difficult because of their extreme polarity and water solubilities. For QuatCy, after considerable experimentation, the following procedure proved effective. First, we found that the purity of dialdehyde 3 is critical; sub-optimal batches of this starting material significantly reduce the yield of the final product 1. Fortunately, 3 could be isolated on a 1.5 g scale by slow addition (over 30 min) of 2 M HCl(aq) to the Vilsmeier-Haack mixture since the product can precipitate out when that solution is maintained at -20 °C overnight. After the final condensation step (3 + C), the ethanol was removed, and the residue purified by preparative rp HPLC (C18 column) using 30 - 80% acetonitrile/water gradient containing 0.1% trifluoroacetic acid (TFA). A batch of 1.6 g of QuatCy could be prepared via this procedure.
X-ray Crystal Structure
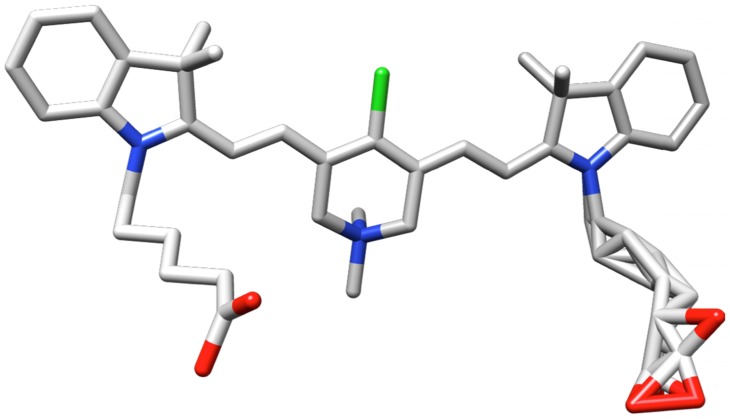
A single crystal of 1 was obtained by diffusing ether into a dichloromethane solution of the fluorophore. Unfortunately, there was a considerable degree of disorder in the structure, due to non-uniform arrangements of the carboxyalkyl side-chains and trifluoroacetate counterions (R value 15%, enough to unambiguously confirm the structure of the fluorophore, Figure 1). A full discussion of the procedures used to refine the crystallographic data are given in the supporting material.
Figure 1.
Representation of 1 from coordinates collected in a single crystal X-ray analysis.
Photophysical and Aggregation Properties
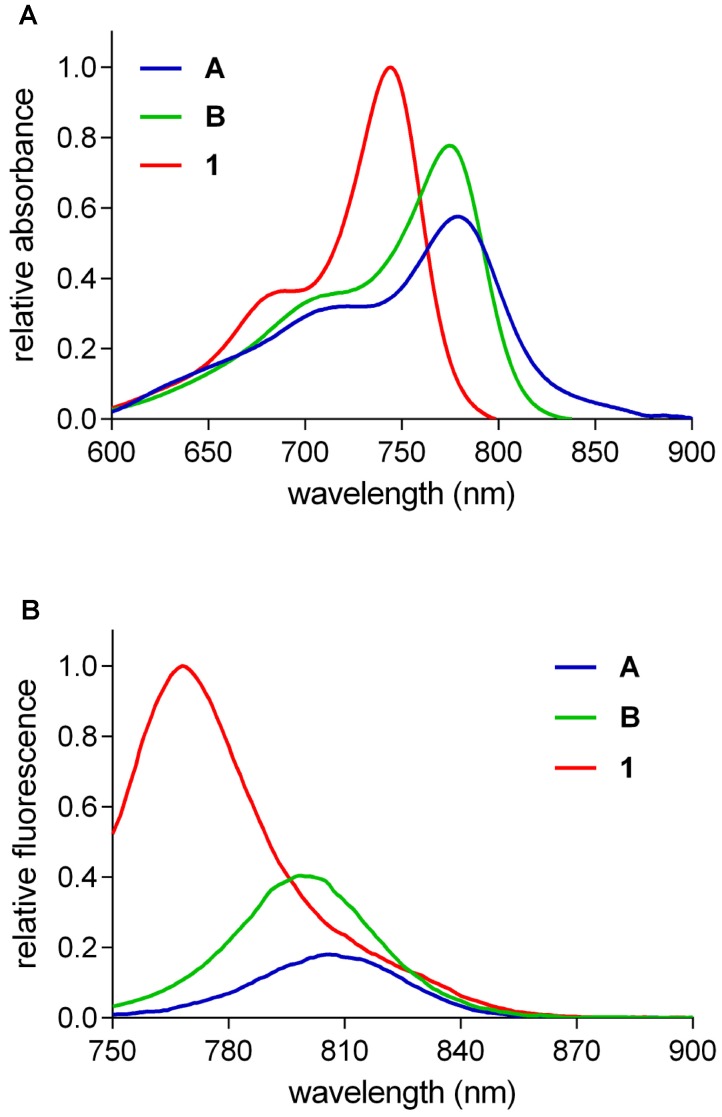
Figure 2 shows the absorbance (A) and fluorescence (B) of equimolar solutions of fluorophores A, B, and 1. Qualitatively, these data show that QuatCy has a greater maximal absorbance than A or B, and its fluorescence brightness was markedly higher than the other two fluorophores. Fluorescence maxima for these three compounds shift to longer wavelengths in the order 1 < B < A, ie ICG has the most red-shifted fluorescence maximum. Absorbance and fluorescence spectra in MeOH and H2O for all three fluorophores can be found in the supporting information (Figure S2 and Table S1).
Figure 2.
Relative absorbance (A) and fluorescence (B) of 5 µM the featured compounds in 10 mM pH 7.4 phosphate buffer saline (PBS).
The qualitative observations made above are supported by quantitative measurements of select photophysical characteristics of these fluorophores (Table 1). They have approximately the same Stokes' shifts (23 - 28 nm), but the extinction coefficients and fluorescence quantum yields are different, and both parameters follow the order 1 > B > A. More specifically, the absorbance of ICG is only about 60% of that of QuatCy, and the fluorescence quantum yield for QuatCy is about three times greater; more specifically, the absorbance of ICG is only about 60 % of that of QuatCy, and the fluorescence quantum yield for QuatCy is about three times greater; data for B are intermediate.
The quantum yields of all three dyes A, B, and 1 are not even close to 10%. A common misconception when evaluating quantum yields is to compare near-IR fluorophores with dyes excited at lower wavelengths. Lower quantum yields are expected in the near-IR region because bond stretches and deformations tend to be favored relative to electronic transitions for long wavelength incident light. Consequently, modifications to near-IR dyes that result in quantum yield increases from, for instance, 1 to 3% should be viewed as a 300% improvement, and not in the context of Φ values for dyes that are excited at much shorter wavelengths. Table 1 indicates the brightness of QuatCy is over five-fold greater than ICG.
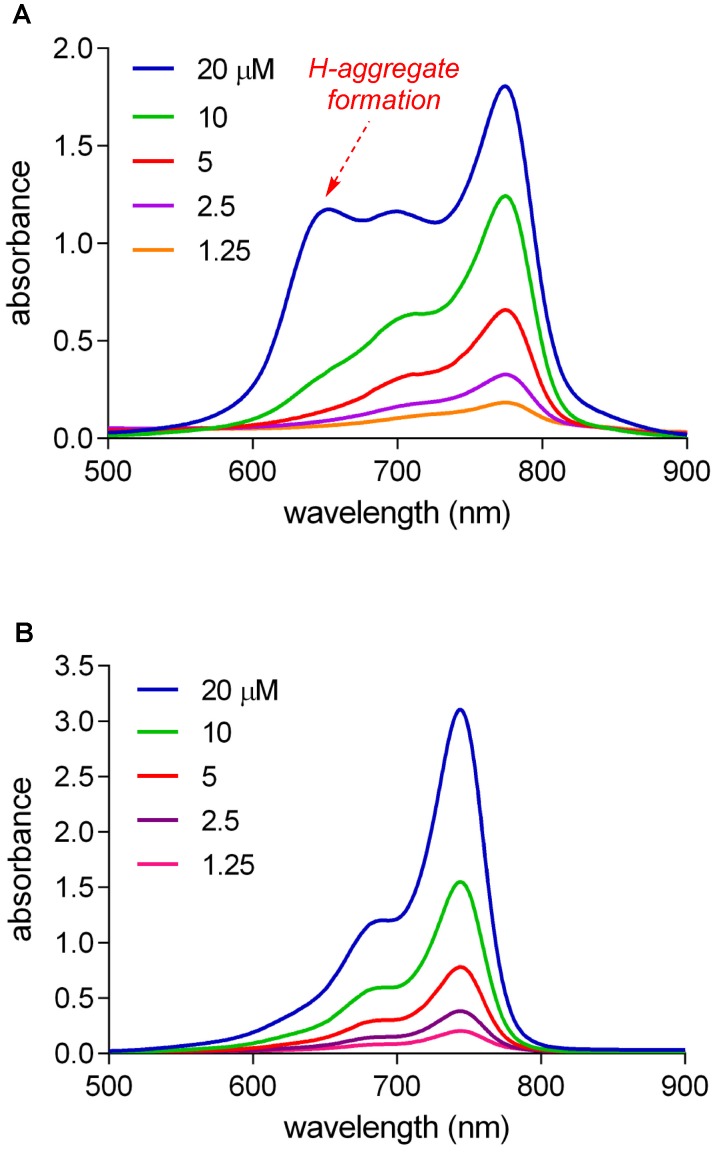
A blue-shifted shoulder is apparent for B in the absorbance spectra shown in Figure 3A. Shoulders of that kind are indicative of H-aggregates, ie associative oligomers in which the transition moments of the monomers are well aligned leading to bathochromic (blue) shifts. Concentration dependences of absorbance spectra of 1 and B (chosen because these are structurally closest) were determined to explore H-aggregation further. It emerged (Figure 3B) that QuatCy is considerably less aggregated than B; there is no shoulder on the absorbance spectra of QuatCy that is attributed to H-aggregates. In unpublished results with human serum albumin it was observed that 1 does not react with albumin unlike other hydrophobic cyanines. Calculated physiochemical properties of compound 1, A and B at pH 7.4 are described in Table S2 (logP, LogD, H-bond donor acceptor properties, polar surface area).
Figure 3.
Concentration dependence of absorbance spectra in the range 1.25 - 20 µM in 10 mM pH 7.4 PBS buffer of compound B (A) and compound 1 (B).
Photostabilities
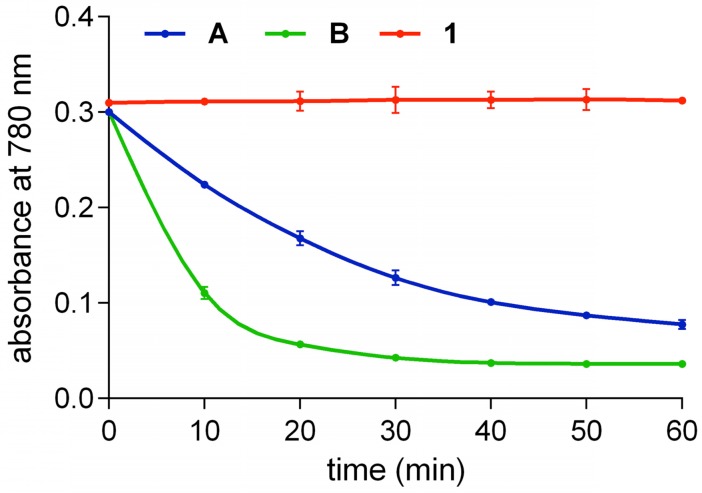
Solutions of fluorophores A, B, and 1 in 10 mM pH 7.4 PBS buffer open to the air were illuminated at 780 nm with an LED. Initially, equimolar concentrations (20 µM) were used. QuatCy was more photostable and more robust than the other two (Figure S3), but the difference was more than we anticipated “so” we suspected our experimental design. Hypothesizing that the difference observed could be because QuatCy simply absorbs less quanta at 780 nm (recall, its absorbance maxima is blue-shifted relative to A and B, Table 1), the experiment was repeated using solutions diluted to have the same absorbance at 780 nm. These experiments (Figure 4) gave essentially the same data, except that A and B decomposed at different rates, but still 1 proved essentially stable, it shows almost no decomposition after 1 h continuous illumination. Photostability tests were also performed on QuatCy (1) using a 750 nm LED and similar results were obtained: QuatCy is stable (Figure S3).
Figure 4.
Photostabilities of A (2.7 µM), B (2 µM) and 1 (1.7 µM) such that each solution had the same absolute absorbance at 780 nm in 10 mM pH 7.4 PBS buffer at 780 nm (Thor Lab, LED780E). Compound 1 was the most photostable whereas B was the least stable and decomposed (t1/2 < 10 min). Throughout, n = 3, mean ± SD.
Solubility Characteristics
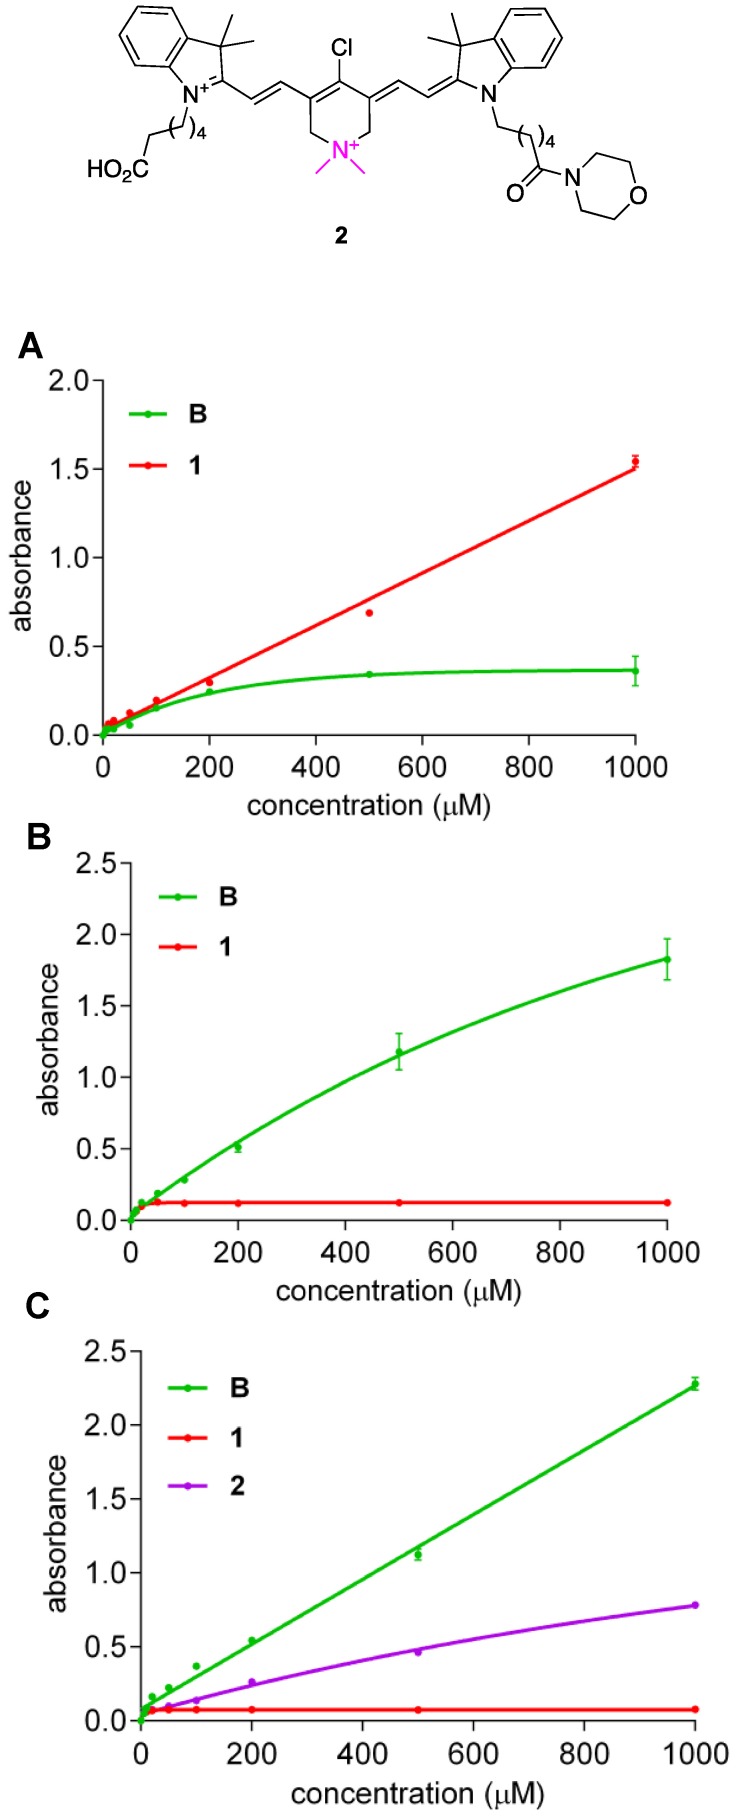
Crystallographic evidence presented above indicates QuatCy isolated via preparative HPLC, using TFA, CH3CN, H2O mixture as eluents, tends to bear one trifluoroacetate counterion, and one molecule of CF3CO2H solvation. Consequently, in water the net charge of 1•CF3CO2H is +1 hence it is unsurprising that it is freely soluble (Figure 5A, red line). Conversely, under the same conditions, B•CF3CO2H has no charge and is therefore much less soluble (Figure 5A, green line). Somewhat surprisingly, QuatCy proved less soluble than B in a typical medium for cell culture (Dulbecco's Modified Eagle's medium or DMEM) or buffered media (Figure 5B and C). In fact, B has good solubility in 10 mM pH 7.4 PBS buffer up to 1 mM but begins to aggregate in H2O at 100 µM “whereas” QuatCy 1 is soluble in H2O up to 1 mM but precipitates out after 50 µM PBS buffer (Figure S4). Generally, reduced solubility in aqueous media is a disadvantage, but that factor is somewhat mitigated in this case because the solubility was improved in when 10% fetal bovine serum (FBS) was added to the DMEM medium (Figure S5).
Figure 5.
Solubility (at 25 °C) of compound B and 1 in H2O (A); Dulbecco's Modified Eagle's medium (DMEM) (B) and B, 1, and 2 in 10 mM pH 7.4 PBS buffer (C). (n = 3, mean ± SD)
A possible explanation for the solubility data outlined above is that CF3CO2H of solvation is neutralized in buffered media, hence the net charges of 1 and B are zero and -1 under these conditions, and only the anion B dissolves well. It follows that if one of the carboxylic acid groups of QuatCy were converted to a neutral functionality, then this derivative in PBS would have a net charge of +1 and it should have greater solubility than 1 in this buffer. To test this hypothesis, the morpholine amide 2 was prepared (Scheme S1) and we found that it was indeed more soluble than 1 in PBS (Figure 5C, purple line) despite the fact that the amide is more hydrophobic than the carboxylic acid it was made from.
Cytotoxicities
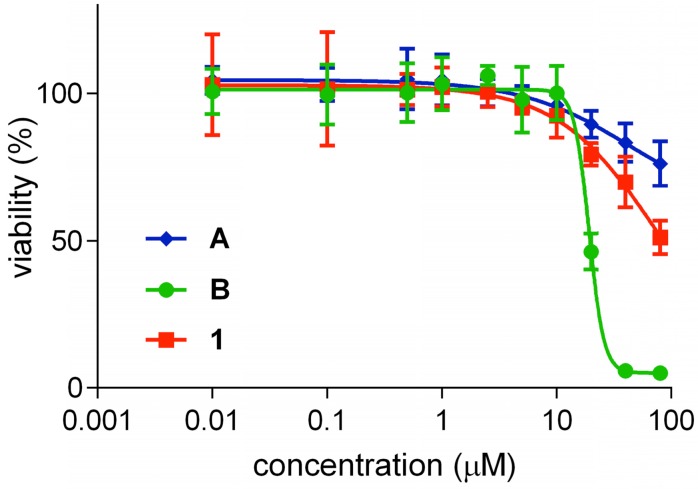
Cytotoxicity of QuatCy 1 was studied using U87-MG cells (a glioblastoma multiforme line). According to Figure 6, both ICG (A) and 1 were not cytotoxic up to 80 μM and were significantly less cytotoxic than B (IC50 value = 19.1 ± 1.01 µM). Unfortunately, IC50 values for 1 could not be measured since fluorophore 1 is insoluble at higher concentrations in buffer solution, but the data shows it is certainly less toxic than B.
Figure 6.
Cytotoxicity of compound A, B and 1 on U87-MG cells after incubating with the test compounds for 72 h in the dark, before an AlamarBlue test for cell viability. Cyanine B was toxic at (IC50 value = 19.1 ± 1.01 µM) but compound A and 1 were not very toxic until 80 µM. (n=5, mean ± SD)
Intracellular Localization Of A, B, and 1
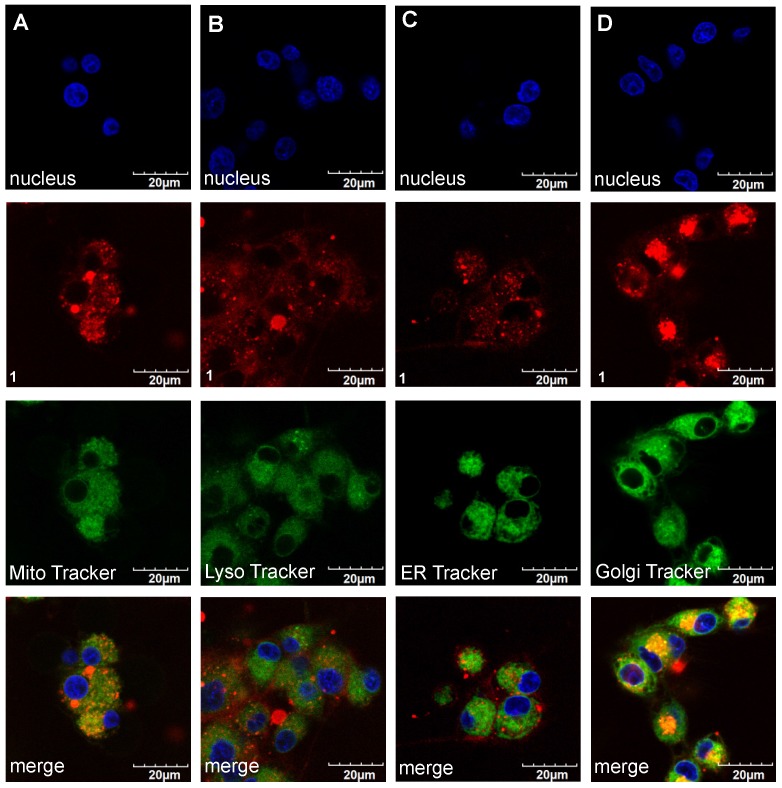
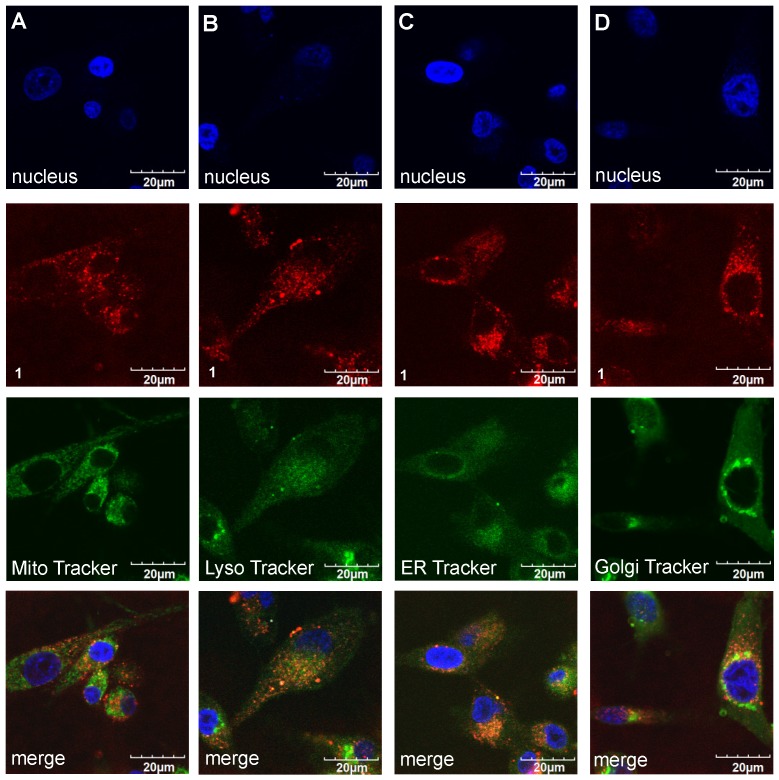
Confocal imaging experiments were performed with the three featured fluorophores to check for colocalization with the four tracking probes found to be most pertinent: ie for localization in mitochondria, lysosomes, the endoplasmic recticulum (ER), and golgi. Figures 7 and 8 respectively, show that compound 1 initially accumulated in the golgi (after 30 min incubation) but after an extended period (24 h) it was found primarily in the lysosome and ER. Similar experiments were performed for A and B; that data is shown in the supporting information (Figures S6-S9) and summarized in Table 2.
Figure 7.
Localization of compound 1 (20 µM) after 30 min incubation at 37 °C with U87-MG cells (A). Mitochondria (Pearson's R Value 0.77) (B). Lysosome (0.29) (C). ER Tracker (0.40) and (D) Golgi (0.78) in DMEM/F12 supplemented by 10% FBS pH 7.4.
Figure 8.
Uptake of compound 1 (20 µM) after 24 h of incubation in U87-MG cells in (A). Mitochondria (Pearson's R Value 0.56) (B). Lysosome (0.45) (C). ER Tracker (0.58) and (D). Golgi (0.54) DMEM/F12 supplemented by 10% FBS pH 7.4.
Table 2.
Organelle localization of the fluorophores in U87-MG glioblastoma cells at relatively short and long time intervals after incubation with the cells at 37 °C in DMEM/F12 supplemented by 10% FBS pH 7.4.
| fluorophore | localization after time (h) | |
|---|---|---|
| 0.5 | 24 | |
| A | golgi and ER | golgi and lysosome |
| B | mitochondria | mitochondria and lysosome |
| 1 | golgi | lysosome and ER |
Pharmacokinetics and Biodistribution
Data presented above indicates QuatCy is less cytotoxic than B, and this might be attributed to accumulation in golgi, lysosomes and the ER whereas B is found in the mitochondria. Toxicity is undesirable for diagnostic optical imaging in patients; ideal near-IR dyes should be non-toxic and should not accumulate in other organs; dyes of this type can be attached to tumor targeting ligands to stain tumor tissue 1-5. Cytotoxicity of fluorophore B (IC50 around 20 μM in most cell lines) 13 might preclude it from clinical applications in near-IR imaging, or at least put restrictions on its use. Consequently, we were intrigued to compare the pharmacokinetics of retention of our less toxic dye, QuatCy 1, with B in mice.
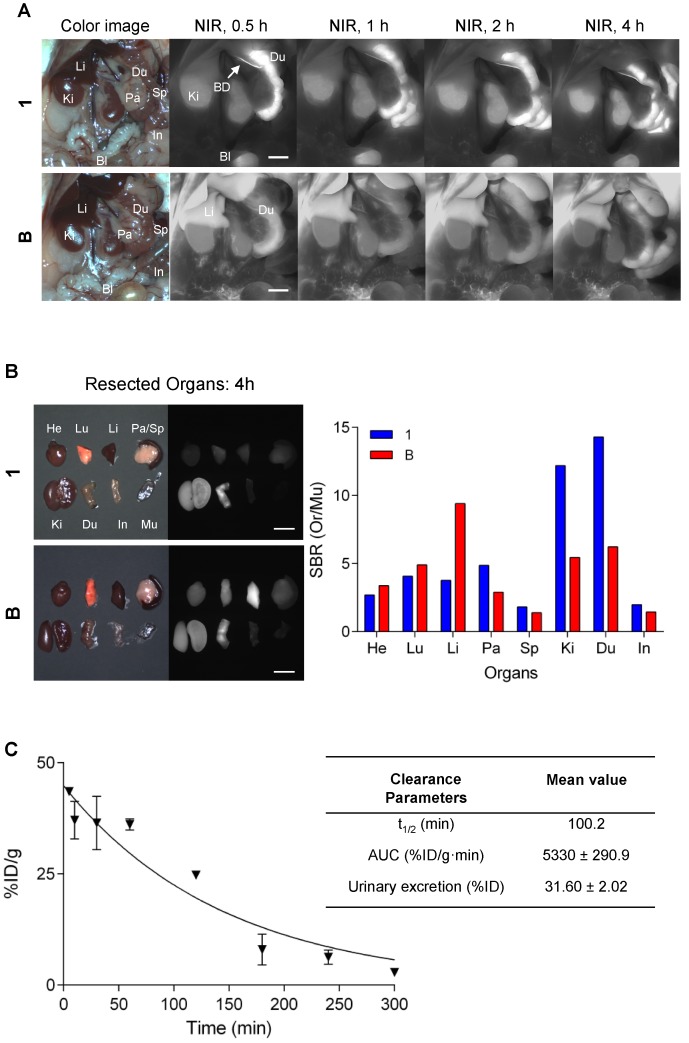
Intraoperative biodistribution and clearance were compared in normal CD-1 mice over a 4 h period after a single intravenous injection of near-IR fluorophores. QuatCy showed both renal and hepatic clearance, while B displayed predominantly hepatic clearance (Figure 9A). QuatCy 1 was detected in the gastrointestinal tract from 1 h post-injection, indicating fast excretion from liver and bile duct, while B still had high signal in the liver and low signal in duodenum even after 4 h post-injection (Figure 9B). Quantification of the compound 1 was performed to characterize the concentration of plasma samples and the urinary excretion after intravenous administration of 25 nmol for up to 5 h. The plasma elimination half-life of compound 1 is 100 min and 32% of injected dose was excreted through the urine (Figure 9C). Fast clearance of a contrast agent from the body is desirable because it can highlight the target tissue with a reduced background, giving a better detection target-to-background contrast.
Figure 9.
Biodistribution and clearance of 1 and B. (A) Compound 1 or B (each 25 nmol) was injected intravenously into normal mice and fluorescence images were measured at 0.5, 1, 2, and 4 h post-injection. (B) Major organs harvested at 4 h post-administration of 1 and B and quantitative analysis to calculate the tumor-to-background ratio against muscle. Bl, bladder; BD, bile duct; Du; duodenum; He, heart; In, intestine; Ki, kidney; Li, liver; Lu, lung; Pa, pancreas; Sp, spleen. Scale bars = 5 mm. (C) Percent of injected dose of compound 1 in plasma at each time point was calculated from fluorescence signal intensities. t1/2 (min), elimination half-life; AUC, area under the curve.
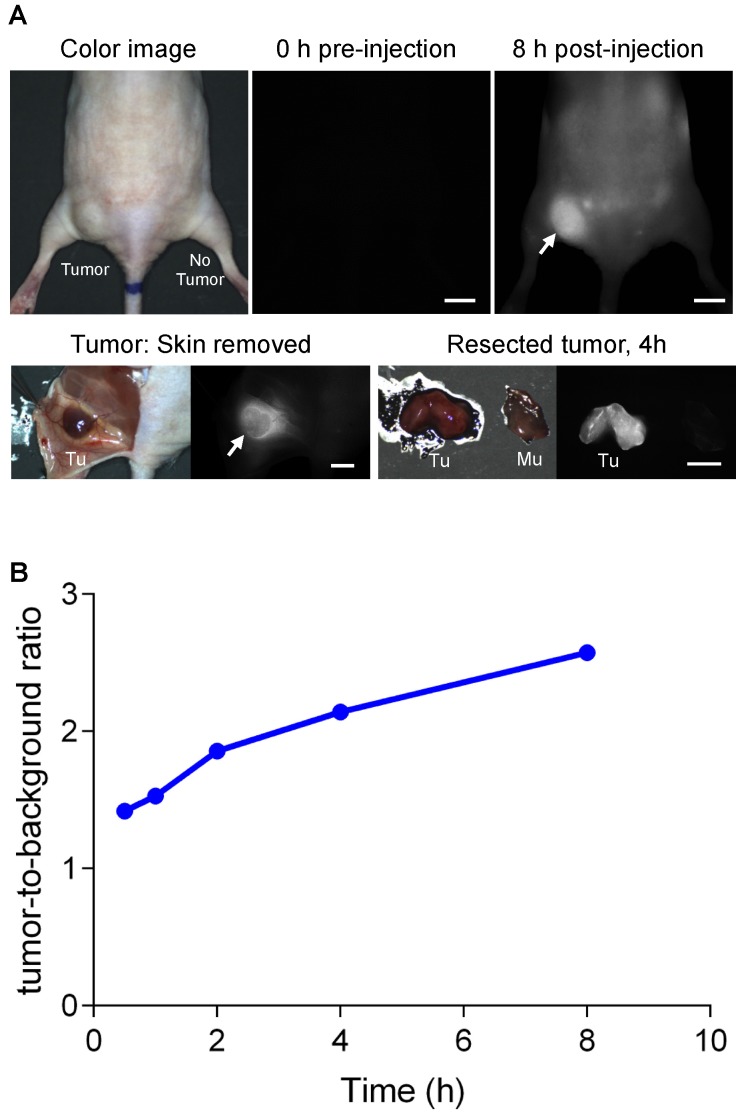
To test tumor targetability, we intravenously administered 25 nmol of 1 to a syngeneic mouse model with NIT-1 pancreatic tumor cell line and observed signal accumulation in the tumor over 8 h, and tumor-to-background ratios were determined against nearby muscle at 0.5, 1, 2, 4, and 8 h. These experiments showed values greater than 2.0 were attained 2 h post-intravenous injection of 1, and increased continuously over 8 h (Figure 10B). The highest tumor-to-background ratio was at 8 h post-injection. At that stage, fluorescence image-guided surgical resection showed the tumor was highly fluorescent, and the cross-section analysis of this indicated deep penetration of 1 in that tissue (Figure 10A).
Figure 10.
Real-time intraoperative tumor targeting. (A) QuatCy (25 nmol) was injected intravenously into nude mice with NIT-1 subcutaneous tumors. Arrows indicate the location of the tumor. (B) Tumor-to-background ratios were quantified as tumor against nearby background up to 8 h post-injection. Tu, tumor; Mu, muscle. Scale bars = 5 mm
For the evaluation of acute in vivo toxicity, the maximum tolerance dose (250 nmol) was administered intravenously into CD-1 mice. We did not observe any significant signs of toxicity after examining the mortality, general behavior, and body weight change for up to 72 h.
Scope For QuatCy Variations
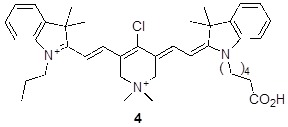
Unsymmetrical Cy7 dyes are important because they allow differential functionalization of two different side-chains, or subtle modulation of physiochemical properties. Previously, we have made unsymmetrical cyanine dyes via a stepwise condensation sequence 25. The SI illustrates (Scheme S2) synthesis of one unsymmetrical QuatCy derivative 4 indicating that a series of other dyes of this kind could be prepared.
Conclusion
QuatCy 1 is less prone to aggregation than fluorophores A and B because it must engender more positive charge repulsion between individual molecules, and it uniquely is not a totally planar structure. We predicted QuatCy would be more soluble in aqueous media, but, in fact, it is more soluble in water, but not in neutral buffers, and the inverse was true for fluorophores B; this is an interesting and useful set of findings for applications of these dyes in aqueous media. Based on the data presented above, we assert that solubility is closely correlated with the overall charge state of the molecule, with neutral, zwitterionic forms being least soluble in aqueous environments.
Some other photophysical properties of the three featured fluorophores can be rationalized in retrospect. Blue-shifted absorbance and fluorescence maxima of 1 relative to A and B may be a consequence of inductive attraction towards the ammonium functionality in QuatCy, that would tend to lower the energy of the conjugated HOMO, and increase the HOMO - LUMO gap. Less aggregation of QuatCy might decrease self-shielding and -quenching effects, thus increasing the relative absorption and the fluorescence efficiency of QuatCy. Currently, our best explanation for the increased photostability of QuatCy relative to A and B is as follows. All the dyes presumably generate small amounts of singlet oxygen while in their excited states. Aggregates, have high local concentrations of fluorophores in microenvironments in which 1O2 is produced, this favors more decomposition of the more aggregating dye B, all other factors being equal. Finally, it may be that the fluorophore cytotoxicities partially correlate with the intracellular organelles that they accumulate in. Cyanines in mitochondria, the “engine room” of the cell, might be more detrimental to cellular function than in other organelles 26-28. If so, this would explain why B, which accumulates in mitochondria more than A and 1, is also more cytotoxic. Even in retrospect, we still find it somewhat surprising that QuatCy, which is more positively charged than B, tends to accumulate in other organelles than the mitochondria since positive organic ions tend towards mitochondria-localization. Currently we cannot suggest an explanation for why that trend does not hold in this series.
In the long-term, one of the most important applications of heptamethine cyanine dyes is likely to be for optical imaging in clinical or surgical settings. Our interpretation of the literature is that dye B has considerable potential for straining tumor tissue, but its cytotoxicity and retention in the liver is a concern. In this respect, it is encouraging that QuatCy is both less cytotoxic, shows less retention in the liver, and localized in a subcutaneous pancreatic tumor model.
In summary, QuatCy has enhanced absorption, quantum yield, photostability, complementary water solubility characteristics, and lesser cytotoxicity than the very similar dye B. The same statement is true for 1 relative to A, except A is marginally less cytotoxic. In vivo, preliminary tests of 1 in mice showed none of the standard indications of acute toxicity. QuatCy has high tumor specificity with fast background clearance, hence it an excellent contrast agent with potential to be used for highlighting tumors in surgery. In our opinion these characteristics indicate QuatCy has a bright future for optical imaging in cells and in vivo, for instance in molecular imaging using integrin based RGD molecules.
Experimental Section
Fluorescence Quantum Yield calculation
Fluorescence quantum yield was determined according to literature procedure 29. The fluorescence emission spectra of A, B and 1 were determined in 10 mM pH 7.4 PBS buffer using Cary-Varian 100 UV-Vis NIR spectrophotometer. Samples were excited in 1 cm path length cuvettes at 730 nm and integrated emission (740-900) was quantified, keeping maximum absorbance below 0.1. ICG (A) in DMSO (Q.Y 0.13) was used as internal standard to do the calculations. Briefly, the integrated fluorescence intensity was plotted against absorbance at different concentrations to generate gradient, which is proportional to the quantum yield of the samples.
| Φx = Φst (Gradx/Gradst)(η2x/η2st) |
Φst represents the quantum yield of the standard, and Φx represents the quantum yield of the unknown, Grad is the slope of the best linear fit, η is the refractive index of the solvent used and subscript x and st denote unknown and the standard respectively.
Photostability
Photostability of compounds A, B and 1 were compared by irradiating samples under 780 nm LEDs (Thor Lab, LED780E) and 750 nm LEDs (Thor Lab, LED750L) for 1. The compounds were dissolved in 10 mM pH 7.4 PBS buffer and H2O with 1% DMSO to give the equal absorbance at 780 nm (Figure 4). Moreover, the equimolar concentrations (20 µM) of A, B and 1 were used to determine the photostability of the compound. The absorbance at 780 nm was measured every 10 min until 60 min by BioTek Synergy 4 Microplate Reader. The absorbance results were plotted against time as shown in Figure 4 for equal absorbance and Figure S3 for equimolar concentration.
Solubility Measurement
Compound solubility was measured by UV absorbance following the literature 30, 31 . Briefly, stock solution (100 mM) of B and 1 was prepared in DMSO. Then various concentrations (0 -1000 μM, Figure. 5) were prepared in 10 mM pH 7.4 PBS buffer with 1% DMSO on 24-well plate (500 µL per concentration). The plate was shaken on a horizontal orbital shaker in dark for 6 h at room temperature, and kept steady overnight for equilibrium. Then the plate was centrifuged at 600 x g for 15 min. Supernatant (3 x 100 μL of compound B and 1 was transferred into 96-well UV transparent plate (Corning® 96 Well Clear Flat Bottom UV-Transparent Microplate) and read the absorbance at 780 nm against blank using microplate reader (BioTek Synergy 4).
Biological Studies
U87-MG cells were grown in Dulbecco's Modified Eagle's medium (DMEM) containing 10% fetal bovine serum (FBS). Cells were grown in an incubator at 37 °C, humidified atmosphere containing 5% CO2. Cells were grown in T-75 culture flask till 70% confluency before splitting into next passage.
Cytotoxicity Assay
U87-MG cells were seeded on 96-well plates as 5000 cells/well (50 μL) containing 10% FBS and incubated in the incubator overnight before adding compound A, B and 1. Stock solutions of A, B and 1 (0.02 M in DMSO) were diluted with protein-free hybridoma medium (PFHM-II) to make desired final concentrations varying from 0.01 to 80 μM. The cells were incubated with the desired concentration for 72 h. The cell viabilities were calculated using AlamarBlue assay (Invitrogen). Briefly, in a well containing 100 μL medium, 10 μL of AlamarBlue reagent was added and incubated for an additional 2 h. Fluorescence intensity (Ex/Em 560/590 nm) was measured by using a BioTek Synergy 4 Microplate Reader. The viability of each cell line in response to the treatment with tested compounds was calculated as: % viability cells = (OD treated - background)/(OD full viability control - background) × 100. Results are processed through GraphPad Prism 6.0 software (Figure 6).
Organelle Co-localization
The images of Intracellular localization in the U87-MG cells were taken using Olympus Fluoview FV1000 Confocal microscope at 60x/1.20 water immersed objective. Lysosome, mitochondria, golgi apparatus, endoplasmic reticulum (ER) and Nucleus were stained using Lysotracker Green DND 26, Mitotracker Green FM, BODIPY® FL C5-Ceramide complexed to BSA, ER Tracker Green, NucBlue respectively (Life Technologies). 488 nm laser was used for lysosomes, mitochondria, golgi and ER stains, 405 nm laser was used for nucleus and 633 nm laser was used for compound A, B and 1. Briefly, 50,000 cells were seeded on 4 well chambers (Nunc Lab-Tek) and allowed to adhere overnight. The cells were incubated with 20 μM of compound A, B and 1 for 30 mins, washed twice with PBS, incubated with organelle stains according to manufacturer's instructions. The cells were washed twice again and stained with Nuc Blue for 10 min. After imaging, the cells were incubated with FluoroBrite DMEM Media (Invitrogen) + 10% FBS for 24 h and were imaged directly under confocal microscope.
Pharmacokinetics and urinary excretion
Animals were injected with 25 nmol of compound 1 in saline containing 10% BSA, and the blood sample was collected at the following time points: 0, 10, 30, 60, 120, 180, 240, and 300 min. The samples were centrifuged at 3,000 rpm for 20 min to separate plasma and blood cells in capillary tubes. Fluorescence intensities of the plasma at each time point was measured by the NIR imaging system. To determine the urinary excretion rate, the penis of male mice was ligated and 25 nmol of compound 1 was intravenously administered. The animals were sacrificed 4 h post-injection, and urine was collected, and fluorescence intensity was measured by the NIR imaging system.
In vivo Biodistribution and Clearance
Mice were anesthetized with ketamine (100 mg/kg) and xylazine (10 mg/kg) before the surgery. A midline incision was performed to open abdominal cavity and 25 nmol of compound 1 or B in 10% BSA were injected intravenously into 25 g CD-1 mice and images were taken at 0.5, 1, 2, and 4 h post-administration. Animals were imaged using the in-house built real-time intraoperative near-IR imaging system. A 760 nm excitation laser source (4 mW/cm2) was used with white light (400-650 nm; 40,000 lux). Color and NIR fluorescence images were acquired simultaneously with custom software at rates up to 15 Hz over a 15 cm diameter field of view.
Quantitative Analysis
At each time point, the fluorescence (FL) and background (BG) intensity of a region of interest (ROI) over each organ/muscle or tumor/background was quantified using the custom FLARETM software. The signal-to-background ratio (SBR) was calculated as SBR = target signal/background signal, where a background is surrounding tissue, using ImageJ version 1.52q. At least 3 animals were analyzed at each time point.
Supplementary Material
Details of the Synthesis, NMR spectra and HRMS for compound 1-3, B and C, photophysical properties (brightness, UV/Vis and fluorescence spectra), Figures for X-ray Crystal Structure of 1, photostability of A, B and 1, solubility of B and 1 and organelle co-localization of A and B.
Acknowledgments
We thank Dr Joseph Reibenspies at TAMU for performing the crystal structure of compound 1. Financial support was provided by a DoD BCRP Breakthrough Award (BC141561), CPRIT (RP170144), The Robert A. Welch Foundation (A-1121), and The National Science Foundation (CHE1608009), and NIH grants #R01EB022230 and #R21CA223270. NMR instrumentation at Texas A&M University was supported by a grant from the National Science Foundation (DBI-9970232) and the Texas A&M University System. The Microscopy and Imaging Center facility (MIC) used is supported by Texas A&M University. The Olympus FV1000 confocal microscope acquisition was supported by the Office of the Vice President for Research at Texas A&M University.
Author Contribution
KB conceived QuatCy. SMU, ST, JPS performed all experiments outside the in vivo work. GKP, SN, and YB performed in vivo experiments. GKP and HSC drafted the in vivo section, and KB wrote the paper with help from SMU.
Abbreviations
- ICG
indocyanine green
- Cy7
heptamethine cyanine
- near-IR
near-infrared
- FDA
Food and Drug Administration
- HPLC
high performance liquid chromatography
- rp
reverse phase
- LED
light emitting diode
- TFA
trifluoroacetic acid
- PBS
phosphate buffer saline
- FBS
fetal bovine serum
- DMEM
Dulbeco's Modified Eagle's medium
- ER
endoplasmic reticulum
References
- 1.Vahrmeijer AL, Hutteman M, van der Vorst JR, van de Velde CJH, Frangioni JV. Image-guided cancer surgery using near-infrared fluorescence. Nat Rev Clin Oncol. 2013;10:507–18. doi: 10.1038/nrclinonc.2013.123. [DOI] [PMC free article] [PubMed] [Google Scholar]
- 2.Pysz MA, Gambhir SS, Willmann JK. Molecular imaging: current status and emerging strategies. Clin Radiol. 2010;65:500–16. doi: 10.1016/j.crad.2010.03.011. [DOI] [PMC free article] [PubMed] [Google Scholar]
- 3.Hilderbrand SA, Weissleder R. Near-infrared fluorescence: application to in vivo molecular imaging. Curr Opin Chem Biol. 2010;14:71–9. doi: 10.1016/j.cbpa.2009.09.029. [DOI] [PubMed] [Google Scholar]
- 4.Gioux S, Choi HS, Frangioni JV. Image-guided surgery using invisible near-infrared light: fundamentals of clinical translation. Mol Imaging. 2010;9:237–55. [PMC free article] [PubMed] [Google Scholar]
- 5.Frangioni JV. In vivo near-infrared fluorescence imaging. Curr Opin Chem Biol. 2003;7:626–34. doi: 10.1016/j.cbpa.2003.08.007. [DOI] [PubMed] [Google Scholar]
- 6.Gibbs SL. Near infrared fluorescence for image-guided surgery. Quant Imaging Med Surg. 2012;2:177–87. doi: 10.3978/j.issn.2223-4292.2012.09.04. [DOI] [PMC free article] [PubMed] [Google Scholar]
- 7.Nagaya T, Nakamura Yu A, Choyke Peter L, Kobayashi H. Fluorescence-Guided Surgery. Front Oncol. 2017;7:314. doi: 10.3389/fonc.2017.00314. [DOI] [PMC free article] [PubMed] [Google Scholar]
- 8.Ethirajan M, Chen Y, Joshi P, Pandey RK. The Role of Porphyrin Chemistry in Tumor Imaging and Photodynamic Therapy. Chem Soc Rev. 2011;40:340–62. doi: 10.1039/b915149b. [DOI] [PubMed] [Google Scholar]
- 9.Samanta A, Vendrell M, Das R, Chang Y-T. Development of photostable near-infrared cyanine dyes. Chem Commun. 2010;46:7406–8. doi: 10.1039/c0cc02366c. [DOI] [PubMed] [Google Scholar]
- 10.Zheng Q, Lavis LD. Development of photostable fluorophores for molecular imaging. Curr Opin Chem Biol. 2017;39:32–8. doi: 10.1016/j.cbpa.2017.04.017. [DOI] [PubMed] [Google Scholar]
- 11.Su D, Teoh CL, Samanta A, Kang N-Y, Park S-J, Chang Y-T. The development of a highly photostable and chemically stable zwitterionic near-infrared dye for imaging applications. Chem Commun. 2015;51:3989–92. doi: 10.1039/c4cc08814j. [DOI] [PubMed] [Google Scholar]
- 12.Choi H-S, Nasr K, Alyabyev S, Feith D, Lee J-H, Kim S-H. et al. Synthesis and In Vivo Fate of Zwitterionic Near-Infrared Fluorophores. Angew Chem, Int Ed. 2011;50:6258–63. doi: 10.1002/anie.201102459. [DOI] [PMC free article] [PubMed] [Google Scholar]
- 13.Yang X, Shi C, Tong R, Qian W, Zhau HE, Wang R. et al. Near IR Heptamethine Cyanine Dye-Mediated Cancer Imaging. Clin Cancer Res. 2010;16:2833–44. doi: 10.1158/1078-0432.CCR-10-0059. [DOI] [PMC free article] [PubMed] [Google Scholar]
- 14.Tan X, Luo S, Wang D, Su Y, Cheng T, Shi C. A NIR Heptamethine Dye With Intrinsic Cancer Targeting, Imaging and Photosensitizing Properties. Biomaterials. 2012;33:2230–9. doi: 10.1016/j.biomaterials.2011.11.081. [DOI] [PubMed] [Google Scholar]
- 15.Yuan J, Yi X, Yan F, Wang F, Qin W, Wu G. et al. Near-Infrared Fluorescence Imaging of Prostate Cancer Using Heptamethine Carbocyanine Dyes. Mol Med Rep. 2015;11:821–8. doi: 10.3892/mmr.2014.2815. [DOI] [PMC free article] [PubMed] [Google Scholar]
- 16.Zhao N, Zhang C, Zhao Y, Bai B, An J, Zhang H. et al. Optical Imaging of Gastric Cancer With Near-Infrared Heptamethine Carbocyanine Fluorescence Dyes. Oncotarget. 2016;7:57277–89. doi: 10.18632/oncotarget.10031. [DOI] [PMC free article] [PubMed] [Google Scholar]
- 17.Yang X, Shao C, Wang R, Chu C-Y, Hu P, Master V. et al. Optical Imaging of Kidney Cancer with Novel Near Infrared Heptamethine Carbocyanine Fluorescent Dyes. J Urol. 2013;189:702–10. doi: 10.1016/j.juro.2012.09.056. [DOI] [PMC free article] [PubMed] [Google Scholar]
- 18.Zhang C, Liu T, Su Y, Luo S, Zhu Y, Tan X. et al. A near-infrared fluorescent heptamethine indocyanine dye with preferential tumor accumulation for in vivo imaging. Biomaterials. 2010;31:6612–7. doi: 10.1016/j.biomaterials.2010.05.007. [DOI] [PubMed] [Google Scholar]
- 19.Luo S, Yang X, Shi C. Newly Emerging Theranostic Agents for Simultaneous Cancer targeted Imaging and Therapy. Curr Med Chem. 2016;23:483–97. doi: 10.2174/0929867323666151223095718. [DOI] [PubMed] [Google Scholar]
- 20.Gao M, Yu F, Lv C, Choo J, Chen L. Fluorescent chemical probes for accurate tumor diagnosis and targeting therapy. Chem Soc Rev. 2017;46:2237–71. doi: 10.1039/c6cs00908e. [DOI] [PubMed] [Google Scholar]
- 21.Lv Q, Yang X, Wang M, Yang J, Qin Z, Kan Q. et al. Mitochondria-targeted prostate cancer therapy using a near-infrared fluorescence dye-monoamine oxidase A inhibitor conjugate. J Controlled Release. 2018;279:234–42. doi: 10.1016/j.jconrel.2018.04.038. [DOI] [PubMed] [Google Scholar]
- 22.Wu JB, Shao C, Li X, Shi C, Li Q, Hu P. et al. Near-infrared fluorescence imaging of cancer mediated by tumor hypoxia and HIF1α/OATPs signaling axis. Biomaterials. 2014;35:8175–85. doi: 10.1016/j.biomaterials.2014.05.073. [DOI] [PMC free article] [PubMed] [Google Scholar]
- 23.Stoll RS, Peters MV, Kuhn A, Heiles S, Goddard R, Buhl M. et al. Photoswitchable Catalysts: Correlating Structure and Conformational Dynamics with Reactivity by a Combined Experimental and Computational Approach. J Am Chem Soc. 2009;131:357–67. doi: 10.1021/ja807694s. [DOI] [PubMed] [Google Scholar]
- 24.Henary M, Pannu V, Owens EA, Aneja R. Near infrared active heptacyanine dyes with unique cancer-imaging and cytotoxic properties. Bioorg Med Chem Lett. 2012;22:1242–6. doi: 10.1016/j.bmcl.2011.11.070. [DOI] [PubMed] [Google Scholar]
- 25.Usama SM, Thavornpradit S, Burgess K. Optimized Heptamethine Cyanines for Photodynamic Therapy. ACS Appl Bio Mater. 2018;1:1195–205. doi: 10.1021/acsabm.8b00414. [DOI] [PubMed] [Google Scholar]
- 26.Luo S, Tan X, Fang S, Wang Y, Liu T, Wang X. et al. Mitochondria-Targeted Small-Molecule Fluorophores for Dual Modal Cancer Phototherapy. Adv Funct Mater. 2016;26:2826–35. [Google Scholar]
- 27.Zhang E, Zhang C, Su Y, Cheng T, Shi C. Newly developed strategies for multifunctional mitochondria-targeted agents in cancer therapy. Drug Discovery Today. 2011;16:140–6. doi: 10.1016/j.drudis.2010.12.006. [DOI] [PubMed] [Google Scholar]
- 28.Tang Q, Liu W, Zhang Q, Huang J, Hu C, Liu Y, Dynamin-related protein 1-mediated mitochondrial fission contributes to IR-783-induced apoptosis in human breast cancer cells. J Cell Mol Med; 2018. pp. 1–12. [DOI] [PMC free article] [PubMed] [Google Scholar]
- 29.Mottram LF, Boonyarattanakalin S, Kovel RE, Peterson BR. The Pennsylvania Green Fluorophore: A Hybrid of Oregon Green and Tokyo Green for the Construction of Hydrophobic and pH-Insensitive Molecular Probes. Org Lett. 2006;8:581–4. doi: 10.1021/ol052655g. [DOI] [PMC free article] [PubMed] [Google Scholar]
- 30.Bharate SS, Vishwakarma RA. Thermodynamic equilibrium solubility measurements in simulated fluids by 96-well plate method in early drug discovery. Bioorg Med Chem Lett. 2015;25:1561–7. doi: 10.1016/j.bmcl.2015.02.013. [DOI] [PubMed] [Google Scholar]
- 31.Kamkaew A, Burgess K. Aza-BODIPY Dyes with Enhanced Hydrophilicity. Chem Comm. 2015;51:10664–7. doi: 10.1039/c5cc03649f. [DOI] [PMC free article] [PubMed] [Google Scholar]
Associated Data
This section collects any data citations, data availability statements, or supplementary materials included in this article.
Supplementary Materials
Details of the Synthesis, NMR spectra and HRMS for compound 1-3, B and C, photophysical properties (brightness, UV/Vis and fluorescence spectra), Figures for X-ray Crystal Structure of 1, photostability of A, B and 1, solubility of B and 1 and organelle co-localization of A and B.


