

Abstract
The molten globule nuclear receptor co-activator binding domain (NCBD) of CREB binding protein (CBP) selectively recruits transcription co-activators (TCAs) during the formation of the transcription preinitiation complex. NCBD:TCA interactions have been implicated in several cancers, however, the mechanisms of NCBD:TCA recognition remain uncharacterized. NCBD:TCA intermolecular recognition has challenged traditional investigation as both NCBD and several of its corresponding TCAs are intrinsically disordered. Using 40µs of explicit solvent molecular dynamics simulations, we relate the conformational diversity of ligand-free NCBD to its bound configurations. We introduce two novel techniques to quantify the conformational heterogeneity of ligand-free NCBD, dihedral quasi-anharmonic analysis (dQAA) and hierarchical graph-based diffusive clustering. With this integrated approach we find that three of four ligand-bound states are natively accessible to the ligand-free NCBD simulations with root-mean squared deviation (RMSD) less than 2Å. These conformations are accessible via diverse pathways while a rate-limiting barrier must be crossed in order to access the fourth bound state.
Keywords: intrinsically disordered proteins, NCBD, quasi-anharmonic analysis, graph-theoretic spectral clustering
1. Introduction
Intrinsically disordered proteins (IDPs) play a vital role in regulating cellular processes in eukaryotic cells.1,2 Structural studies have revealed that unlike well-folded globular proteins, IDPs exist as highly dynamic ensembles even under equilibrium conditions, with diverse and constantly fluctuating secondary/tertiary structure.3 The ability of IDPs to adapt their binding surface to recognize various binding partners provides a novel means of regulating various cellular activities.4 Given the abundance of IDPs in the human genome and their involvement in neurodegenerative, cardiovascular, and amyloid-related diseases,5,6 there is tremendous interest in understanding the basic molecular mechanisms by which IDPs recognize their binding partners and facilitate their specific functions. For example, some IDPs possess the remarkable ability to undergo synergistic folding upon recognizing their binding partners.7 The contrasting ability of IDPs to achieve a high degree of structural plasticity while retaining binding specificity presents a serious challenge in characterizing their sequence-structure-function relationships.
The intrinsically disordered nuclear co-activator binding domain (NCBD) of the CREB binding protein (CBP) interacts with numerous transcription co-activator proteins (TCA), including the steroid receptor co-activators (SRC),8 p53,9 p73,10 interferon regulatory factors (IRF)11 and the viral protein Tax.12 As NCBD aids recruitment of the transcriptional machinery, its dysfunction (and that of its binding partners) is implicated in several forms of leukemia13 and lung cancer.14 Circular dichroism (CD) and ultra-violet (UV) spectroscopic studies reveal that native NCBD adopts a compact structure with a high degree of helicity but lacks the sigmoid unfolding curve characteristic of folded proteins.15 Structural studies using nuclear magnetic resonance (NMR) and X-ray crystallography indicate that NCBD adopts unique conformations when complexed with specific partners15,16 and that synergistic folding facilitates the interdigitation of three helices, a feature common in NCBD’s bound topology (identified by α1 − α3; see Fig. 1).17,18 Increasingly, the specific orientations of these three α-helices are thought to confer the specificity inherent to NCBD:TCA intermolecular recognition.15–18
Fig. 1: Bound and unbound forms of NCBD.
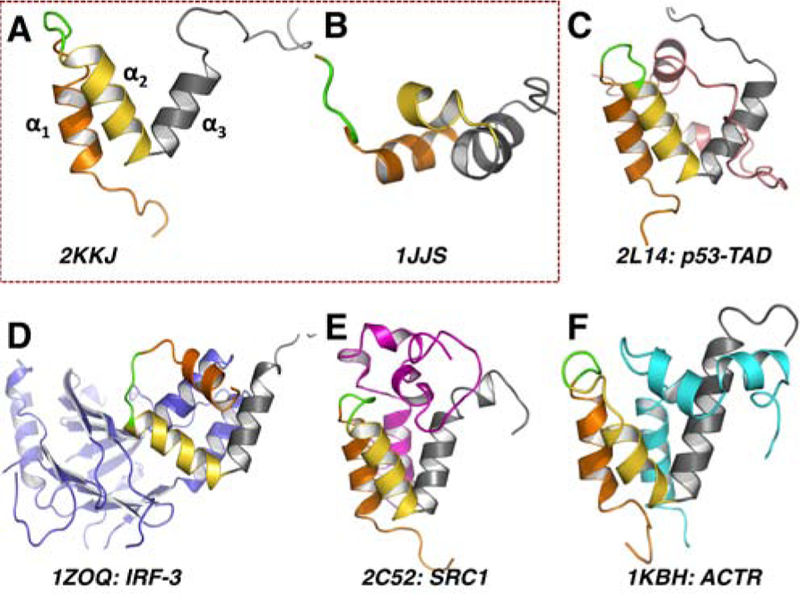
NMR ensembles of the ligand-free structures: 2KKJ (A) and 1JJS (B); NCBD in complex with (C) p53 trans-activation domain (TAD) (2L14: TAD in pink); (D) interferon regulatory factor 3 (IRF3) (1ZOQ: IRF3 in pale blue); (E) steroid receptor coactivator 1 (SRC1) (2C52: SRC1 in magenta); (F) interaction domain of activator for thyroid hormone and retinoid receptors (ACTR) (1KBH: ACTR in cyan). In all panels, the three helix bundle of NCBD is highlighted in orange (α1), yellow (α2) and gray (α3), while the specificity loop (PSSP) is in green.
While a number of studies point to the behavior and structure of NCBD in its bound state,15–18 the conformational heterogeneity of apo-form NCBD has been challenging to characterize. Emerging evidence from NMR experiments16 suggest that native NCBD can adopt conformations that largely resemble the SRC/ACTR-bound conformation. However, that study also revealed that ligandfree NCBD does not sample states that resemble the IRF-bound conformations. Moreover, Fraenkel et al.19 have determined the apo-form of NCBD to be quite different from Poulsen et al.16 Based on the current insights gained from experimental studies, the biophysical mechanisms underlying NCBD:TCA recognition process remain unclear. Likewise, a quantitative description of disorder-to-order transitions between the ligand-free or ligand-bound NCBD ensembles is lacking.
In this paper, we address the aforementioned issues and outline an integrated experimental and computational strategy to analyze disorder-to-order transitions in NCBD’s conformational landscape. Our aims are to: (a) obtain insights into the nature of intrinsic fluctuations accessible to ligand-free NCBD, (b) identify regions within NCBD that are implicated in its disorder-to-order transitions and (c) elucidate whether ligand-free NCBD can access conformations that resemble the ligand-bound conformations. To this end, we exploit recent advances in molecular simulation technologies to extensively sample ligand-free NCBD. Using graphics processing units (GPUs), we accelerate conventional all-atom explicit solvent molecular dynamics simulations to microsecond time-scales. The aggregate dataset constitutes 40µs of MD simulation and required approximately two months of total clock-time.
Long time-scale simulations challenge conventional trajectory analysis methods. In particular, biophysically relevant events within such trajectories are often difficult to detect.20,21 Likewise, experimental techniques also present modeling challenges; results from small-angle neutron scattering (SANS) experiments on NCBD suggest a distinctly long-tail (or anharmonic) behavior in the distributions of radius of gyration and end-to-end distance values.22 This long-tailed behavior implies that atomic fluctuations in NCBD involve significant higher-order correlations, which are commonly overlooked with typical trajectory analysis tools.23 Recently, we introduced quasi-anharmonic analysis (QAA) as an effective computational model to quantify these higher-order correlations which emerge prominently within long simulations.24 QAA provides insights into the inherent anharmonicity in atomic fluctuations and is thus ideal for quantifying the disorder-to-order transitions in NCBD observed from both experiments and simulations. Furthermore, QAA organizes the conformational heterogeneity in NCBD fluctuations into a small set of conformational sub-states that share structural and energetic homogeneity.
Markov state models (MSMs) and their variants also provide organizational principles for molecular simulations. These methods exploit the kinetic connectivities27 or structural similarities26 between conformational sub-states and have been useful for determining transition pathways between conformational sub-states.20,25 As a comparison to QAA, MSMs discretize conformation space into a network or graph of sub-states rather than projecting it into a low-dimensional, continuous representation. A central contribution of the work here is an approach which exploits both the dimensionality reduction (and visual interpretability) of QAA and rigorous graph theoretic methods to determine a hierarchy of transitions between sub-states. With this integrated approach, we determined that ligand-free NCBD can indeed access conformations representative of the ligand-bound form. Within our simulations, NCBD’s α1 and α2 helices in the ligand-free and ligand-bound conformations are largely similar; α3 however, can exhibit a wide degree of flexibility and does not generally sample conformations that are similar to the ligand-bound state.
2. Approach
We performed ten 4µs all-atom explicit solvent MD simulations of apo-NCBD (Section 3). To identify biophysically relevant motions within these simulations, we developed a novel, broadly extensible, dimensionality reduction framework based on quasi-anharmonic analysis in the dihedral angle space, called dihedral QAA or dQAA (Section 4). To validate our simulations we used two order parameters: radius of gyration (Rg) and helicity (H; defined here as the percentage of NCBD that adopts α-helical structure as assigned by STRIDE28), which can be measured experimentally via SANS22 and circular dichroism16 experiments respectively.
To determine meta-stable conformational states, we invoke a multi-scale Markov diffusion approach (Section 5) to group similar conformations in the dQAA space. Iterative diffusion-based clustering in the dQAA space results in a hierarchical description of the NCBD conformational landscape. Each level of the hierarchy provides a set of increasingly broad (or inclusive) metastable states, allowing the conformational landscape of NCBD to be viewed as a collection of nested sub-states. As we demonstrate, dQAA coordinates provide a natural framework for organizing the conformational heterogeniety of the apo-NCBD ensemble and help identify disordered or compact conformational states. In addition, the Markov diffusion approach captures meta-stable states that provide insight into the nature of structural changes that NCBD must undergo in order to sample conformations close to the ligand-bound state (Section 6).
3. Molecular Simulations for NCBD
A total of six NMR and X-ray NCBD structures are available in ligand-free and ligand-bound form. Fig. 1 shows the variation in the orientation of the three α-helices between these structures. While NCBD adopts very similar helical orientations when binding ACTR, SRC1 and p53, the interfaces and helical turns of NCBD when complexed to each ligand are quite different. Furthermore, NCBD adopts a radically different orientation for interacting with IRF3; α3 twists and rests on a very different axis from that in the ACTR interaction.
In the interest of sampling the large conformational space of ligand-free NCBD, we initiated a 4µs long simulation for each of the 10 conformations in the NMR ensemble (2KKJ) that is representative of the ligand-free state. We used the AMBER suite of tools29 and the ff99SB30 force-field to model the proteins. Each of the ten conformations was immersed in a cubic box of SPC water molecules such that the solvent box boundary was never less than 10Å from the protein. Counterions consisting of 10 Cl− were added to ensure system neutrality. The box sizes were approximately 90 × 90 × 90 Å 3 (with slight variations for each of the ten simulations). Using the protocol highlighted in our previous work,31 each of the simulation systems was subjected to energy minimization and equilibration. A final MD equilibration of 1.0ns duration was run to ensure the systems reached a stable conformation. All the simulations were carried out at 300K using the NVE ensemble. Each of the ten systems had between 9,000 and 12,000 water molecules, resulting in system sizes varying between 18,000 and 22,000 atoms.
Production runs were carried out using the recently developed ACEMD (accelerated MD) code specifically for graphics processing unit (GPU) systems.32 In order to accelerate the MD simulations to reach microsecond time-scales, the systems were simulated using a time-step of 4fs using a hydrogen mass-partitioning scheme.33 The alteration to the dynamics due to the mass-partitioning scheme is minimal since individual atom masses do not appear explicitly in the equilibrium distribution.32 Ten production runs sampling 4µs per simulation were performed. Coordinates were saved every 200 ps, resulting in about 20,000 conformations per simulation or an aggregate total of 200,000 conformations for all simulations (40µs total).
Comparison with NMR:
To compare our production runs with NMR data, we used SPARTA34 to predict the 1H, 13C, and 15N chemical shifts for the ensembles generated from MD simulations. SPARTA uses backbone ϕ and ψ torsion angles, side-chain χ1 angles, and sequence information to predict backbone chemical shifts of protein structures.34 We found that the simulations show reasonable agreement with the chemical shifts from the experimental ensembles (2L14, 1KBH and 2KKJ). In particular, the correlation coefficients between the mean MD and the experimental 15N shifts are 0.74, 0.78, and 0.88, respectively, for the 2L14, 1KBH and 2KKJ data. We note that computed 1H and 13C chemical shifts are less consistent with respective experiments presumably due to force-field inaccuracies and the 4 fs MD integration time-step.35 While the agreement between experiments and computations is a cursory check on the quality of data obtained, we must also note that the chemical shifts from the experimental ensembles may not be fully representative of the conformational heterogeneity of apo-NCBD.
Comparison with SANS:
We next compare simulation results with experimentally derived Rg values from small-angle neutron scattering (SAS) experiments. The distribution of Rg values from MD simulations is observed to be more constrained than that obtained from SANS, possibly due to MD sampling deficits (Fig. 2a panel B, blue: aggregate simulations; red dash: single simulation; red: SANS data). This is in part because MD trajectories are strongly biased by the chosen starting pose, which is commonly an energy-minimized X-ray or NMR ensemble structure.36,37 We note that the range of SANS-derived Rg values suggests that NCBD may undergo disorder-to-order motions on a larger scale than observed in the present simulations.
Fig. 2: Disorder-to-order transitions in NCBD ligand-free ensemble.

(a) A comparison of simulated NCBD ensembles with NMR (A) and SAS (B) experimental data, illustrating qualitative agreement. Chemical shift data is taken from three ensembles, 2KKJ (16363cat.bmrb, red), 2L14 (17071cat.bmrb, brown), 1KBH (5228cat.bmrb, cyan), and compared to computed mean chemical shifts from the simulations. (B) Rg is shown for SANS data (tan, solid), aggregated MD data (blue, normalized), and a single MD trajectory (2KKJ, model 3)(dashed red, normalized). Not all of the conformational landscape is sampled by MD, as is evident from the second SANS peak. (b) Rg during first 400ns of a single MD trajectory (2KKJ, model 2), with 1ns (blue) and 5ns (red) exponential smoothing showing disorder-to-order transitions. Conformations at six timepoints are aligned to crystal structure 1KBH.
From a molten globule state to a near ACTR-bound form:
To quickly overview significant conformational events in the MD trajectory, we track Rg on-line along a subset of one of the simulation trajectories using two different exponential window smoothing timescales (Fig. 2b). We observe that NCBD changes from a molten-globule form (high Rg) to a near ACTR-bound form (gray cartoon for comparison, shown along with RMSDs). The pathway chosen by this trajectory is highly dynamic, involving several significant rearrangements of the α1-α2 (PSSP) loop and α3. Interestingly, the conformational changes persist across the timescales of the exponential window, confirming the evolution of NCBD from a molten globule state to a near ACTR-bound form. In this particular trajectory, generated from model 2 of the NMR ensemble (2KKJ), NCBD adopts a form that is about 4.27 Å (Cα-RMSD) from the bound form; however, other trajectories adopt conformations that are much closer to the ACTR-bound form (see Section 5).
4. dQAA: Quasi-anharmonic analysis in the dihedral angle space
The conformational heterogeneity we observed in long timescale simulations of NCBD motivated us to eliminate the sensitivity to Cartesian alignment by analyzing the NCBD ensemble in the dihedral angle space. For a N residue protein there are a total of 2N backbone ϕ and ψ angles, ϕ = {ϕi}1,…,N, ψ = {ψi}1,…,N. Each backbone dihedral angle pair (ϕi, ψi) can be converted into a Euclidean representation by xi−3 = cos(ϕi); xi−2 = sin(ϕi); xi−1 = cos(ψi); xi = sin(ψi), yielding a 4N vector x. We first considered dihedral PCA (dPCA), where a covariance matrix is generated from this data and is diagonalized to obtain a low-dimensional representation of the conformational ensemble.45–47 We observed that NCBD conformers projected into low-dimensional dPCA space lacked coherency (or homogeneity) with respect to the Rg values, indicating that dPCA is unable to fully describe the disorder-to-order motions of NCBD (data not shown).
Protein motions are anharmonic; therefore, capturing the conformational diversity of protein fluctuations requires effective models that quantify anharmonic motional signatures.23,38–42 Anharmonicity is best summarized by higher-order statistics.38,39 Our previously developed framework, quasi-anharmonic analysis (QAA), exploits these higher-order statistical signatures of protein motions.24 When applied to µs time-scale simulation data of proteins involved in molecular recognition and enzyme catalysis, QAA revealed (i) functionally relevant, hierarchically-organized conformational sub-states and (ii) a set of on-pathway intermediates between these sub-states. This result is consistent with the understanding that proteins sample from a hierarchical, multilevel energy landscape with minima and maxima separated by energy barriers.43,44 We observed that the sub-states determined with QAA were energetically coherent, indicating that our low-dimensional representation appropriately depicts energetically-related conformers as neighbors. We emphasize, however, that the resultant energy coherence within observed sub-states is an emergent property of QAA, indicating that our higher-order statistical approach selects meaningful reaction coordinates.
With the intention of capturing anharmonic disorder-to-order motions, we pursued anharmonicity as an informative statistic in the form of dihedral QAA (dQAA), basing our technique on the diagonalization of a tensor of fourth-order statistics in the dihedral angle space. This tensor describes dihedral angle fluctuations and their couplings and can be efficiently diagonalized with a technique called joint-diagonalization of cumulant matrices (JADE), a well known machine learning algorithm for analyzing multi-variate data.48 To begin with, second-order correlations are removed from the dihedral angle fluctuation data. Next, a fourth order cumulant tensor K is computed consisting of both auto- and cross-cumulants. The cumulant tensor will have a total 4N × (4N + 1)/2 matrices each of size 4N × 4N accounting for auto- and cross-cumulant terms. Finally, the fourth order dependencies denoted by the sum of the cross-cumulant terms are minimized, a procedure equivalent to diagonalizing K. No closed form solution exists for diagonalizing a tensor, however an approximate solution can be found using efficient algebraic techniques such as Jacobi rotations.49 Just as an eigenbasis diagonalizes a covariance matrix, a matrix U is found to approximately diagonalize the cumulant tensor. The basis matrix U represents anharmonic modes of motion derived by minimizing the fourth-order dependencies in dihedral angle fluctuations, in addition to eliminating the second-order correlations as is the case with dPCA. Unlike in dPCA, the column vectors of U (sorted decreasingly by amplitude (ǁUiǁ)) can be non-orthogonal and hence intrinsically coupled.
Results:
Using 40 µs simulations of NCBD, we performed dQAA to reduce 232-dimensional input data (from 58 dihedral angles in each conformer) to a 50-dimensional subspace. For visualization, we projected the conformers along the top three QAA modes as shown in Fig. 3. To assess if the projected conformers share any structural similarities, we colored the conformations using two biophysically relevant order parameters: (a) Rg and (b) H (helicity). The dQAA space colored with Rg revealed two compact (homogeneous) clusters with low Rg values, one open conformation cluster with high Rg and one heterogeneous cluster. Thus, dQAA modes can reveal disorder-to-order motions, an ability that can be further tested by recursively applying dQAA on the heterogeneous cluster. The results from a recursive decomposition highlight the rich conformational diversity present in the simulated NCBD ensemble and illustrate the ability of dQAA to capture meaningful conformational transitions. Although dQAA cannot directly compensate for the deficiencies of MD sampling, the determined anharmonic modes suggest functionally relevant disorder-to-order transitions. Similar results can be seen by coloring the dQAA space with helicity values, showing that the sub-states involve transitions in NCBD from a more extended form to a more helically compact form. This emergent homogeneity in dQAA space suggests a new strategy to identify metastable states in the MD trajectory, which we discuss next.
Fig. 3: dQAA identifies a hierarchy of disorder-order promoting motions and homogeneous clusters in 2KKJ µs timescale ensemble.

MD trajectory frames are projected along the top three dQAA modes and colored by (a) Rg and (b) Helicity. (a) Level 1 of the dQAA hierarchy reveals two compact, low Rg clusters (II and III). Cluster IV has high Rg values (red) indicating a more open conformation. Mean conformers in each cluster (I: yellow, II: green, III: maroon, IV: blue) are superimposed on the bound conformer of NCBD-ACTR (orange) and the respective RMSDs are given. Successive application of the dQAA analysis to heterogenous clusters (Level 2 and 3) highlight a rich conformational diversity when painted with Rg values values. (b) In level 1, dQAA clusters I and III are predominantly low in helicity (blue) and dQAA clusters II and IV are predominantly high in helicity (pink). The ability to separate ordered (high helicity) from disordered (low helicity) conformers improves as dQAA is applied recursively to subsets of conformers.
5. Hierarchical clustering in the dQAA-space to identify meta-stable states
Observing that neighboring conformers in dQAA-space have similar Rg and H values, and noting that this coherence is an emergent property of dQAA representation, we hypothesize that nearest neighbors in dQAA-space are dynamically and kinetically related. We use the conformational coordinates returned by dQAA to build long-lived metastable states using graph-theoretic spectral clustering approaches. To this end, we consider each frame in the trajectory as a node in an undirected graph and connect each node to 10 of its nearest Euclidean neighbors in the three-dimensional dQAA space. The edges are assigned weights inversely proportional to the difference in their radius of gyration values, thus merging both the dynamic and emergent properties of the dQAA space into the edge weights. We then cluster this network using a hierarchical Markov diffusion framework.50 This approach is an adaptation of our earlier work developing spectral graph partitioning algorithms for segmenting natural images,50 understanding protein dynamics and allosteric propagation,51 relating signal propagation on a protein structure to its equilibrium dynamics,52 and finally discovering metastable states in MD trajectories.53
We begin hierarchical clustering by constructing a Markov transition matrix using an affinity matrix of edge weights between conformer pairs in the dQAA space. We then initiate a Markov chain (or random walk) on the weighted undirected network. As Markov transition probabilities homogenize through diffusion, an implicit clustering emerges from the network. First, a set of nodes representing the putative clusters are identified. The number of clusters chosen is determined by the algorithm so that every node in the network has some Markov probability of transitioning into at least one of the clusters. Then, a Markov transition matrix is newly constructed using this reduced representation. The important principle behind this construction is that upon reaching a stationary distribution at the coarsest hierarchy level, the Markov chain has also converged at finer (more local) network levels. This consistency regulates the overall topology of the network and helps build a multi-resolution representation of metastable states.
We expect that fine-grained hierarchy levels will produce many small clusters containing close neighbors in the QAA space; that is, within each such cluster most members will be drawn from the same, narrow time-window. As Markov diffusion progresses (fine-grained to coarse-grained), conformers that are more distant neighbors will be connected by edges in the diffused network and will therefore be assigned to the same cluster. Thus, the hierarchical clustering can highlight dynamical connections between conformers at different timescales.
Results:
The affinity matrix hierarchy derived by the clustering algorithm is shown in Fig. 4. The affinity matrices show several regions of high cross-talk at lower levels of the hierarchy. Iterative diffusion of the Markov chain derived from the initial affinity matrix (200000 × 200000), results in six hierarchy levels (Table 1). The mean Cα-RMSD to cluster center at the bottom hierarchy level is 3.2Å, indicating that clustering in dQAA-space also captures structural similarity between trajectory frames in Cartesian-space. Clusters with low mean RMSDs to the four experimental bound conformations and the two experimental unbound conformations occur at each hierarchy level. At the finest level of the hierarchy, the clusters representing the bound conformations are very small, but as the hierarchy progresses, they are found in more dominant sub-states, indicating that the bound conformations are energetically accessible. As seen in Table 1, the alignment to 1ZOQ is poor. However, if only helices α2 and α3 are considered, the RMSD is very low (data not shown). In contrast, for the three other ligand bound states, α1 and α2 align well to the simulations. Thus, a barrier involving the repositioning of this helix may need to be crossed in order to access the IRF-3 bound state.
Fig. 4: A hierarchy of conformational sub-states in the disorder-to-order transitions of NCBD conformational landscape.

A total of 6 levels are found by the hierarchical clustering. For hierarchy levels 3–6, the log of the affinity between each substate pair is shown.
Table 1:
Conformational similarity between determined sub-states and extant structural models. Sub-states are ranked according to membership, 1 being the largest. For the coarsest hierarchy levels, sub-state rank and RMSD from sub-state center to experimental conformation is given for the sub-state with lowest RMSD to the experimental conformation.
| PDB | ligand-free 1JJS | ACTR 1KBH | IRF3 1ZOQ | SRC1 2C52 | ligand-free 2KKJ | p53 2L14 | |
|---|---|---|---|---|---|---|---|
| Level | rank/RMSD(Å ) | rank/RMSD(Å ) | rank/RMSD(Å ) | rank/RMSD(Å ) | rank/RMSD(Å ) | rank/RMSD(Å ) | Total number of clusters |
| 3 | 895/5.3 | 928/1.8 | 313/7.3 | 928/1.9 | 928/1.4 | 910/5.2 | 928 |
| 4 | 49/6 | 110/1.9 | 122/7.3 | 168/2.0 | 81/1.5 | 132/5.2 | 172 |
| 5 | 10/6.3 | 30/1.9 | 25/7.4 | 30/2.1 | 30/1.5 | 30/5.3 | 30 |
| 6 | 1/6.4 | 3/2.0 | 5/7.4 | 3/2.2 | 3/1.6 | 3/5.3 | 6 |
6. Intermediate states of ligand-free NCBD access ligand-bound conformations
The organization of the ligand-free NCBD ensemble indicates the presence of six large conformational sub-states that interconvert between each other. One can visualize the six sub-states from the coarsest hierarchy level as illustrated in Fig. 5(a). Of the six sub-states, sub-states 4 and 5 constitute over 88% of the entire ligand-free ensemble, consisting of 98,143 and 79,672 conformers respectively. The remaining sub-states (1, 2, 3 and 6) represent rare transitions in the landscape. It is interesting to observe that sub-states 1 and 6 are somewhat isolated from the conformational states, however a sizable population of conformations exist in each state (see affinity map in 5(a)). Although one may attribute the isolation to the MD sampling protocol, it is important to note that descending through the various levels of the hierarchy (Level 5 through Level 2) indicates that both sub-states 1 and 6 are connected via extremely lowly populated states (see Fig. 4), indicating that multiple paths exist through which states 1 and 6 can be reached. We also note that while certain pairs of sub-states (such as [2,3] and [4,5]) freely interconvert between each other, sub-state 3 alone can access conformations that are similar to that of sub-state 5. Therefore, sub-state 3 acts as an intermediate state from which conformations in sub-states 2, 4 and 5 interconvert.
Fig. 5: Intermediate states of ligand-free NCBD enable access to ligand-bound conformations.

Intermediate states of ligand-free NCBD enable access to ligand-bound conformations (a) Log affinities between sub-states at hierarchy level 6 are shown. For each of the 6 clusters, an ensemble of random conformers within that cluster are shown, and the percent of total frames within the cluster is given. High affinity (red) between two clusters indicate that those clusters are similar in dQAA space. Low affinity (blue - white) indicates that clusters have low similarity in dQAA space. (b) Comparing NCBD ensembles with the bound ligands (A) ACTR (1KBH; cyan) and (B) SRC1 (2C52; cyan) showing the orientations of α3 indicated by red arrows.
Sub-state 1 (rank 3) represents the state closest to the bound conformations observed experimentally (Table 1). As illustrated in Fig. 5(b), a representative structure from sub-state 1 is compared with two ligand-bound structures, namely 1KBH (panel A) and 2C52 (panel B). Sub-state 1 represents the third least populated state of all sub-states (9,488 or 4.7% of conformers). However, when compared with the bound structures, on an average, it exhibits smaller RMSD values to the bound 1KBH (RMSD: 2.0 Å ) and 2C52 (RMSD: 2.2 Å ) conformers. This observation indicates that the ligand-free state of NCBD can access sub-states resembling the bound state.
It may be tempting to conclude that sub-state 1 is isolated from other conformational sub-states. However, as noted above, closer examination of the cluster hierarchy (Fig. 4, Level 4) reveals that concerted structural changes along a complex pathway are required for NCBD to adopt a binding competent conformation. By descending through the hierarchy, one can observe from Level 4 that a small subset of states (indicated by arrows on Fig. 4) closely resemble conformations in sub-state 1. This conformational state arises out of a rare state mostly consisting of conformers similar to sub-states 2 and 3 in level 6 of the hierarchy. Note that sub-state 2 in level 6 of the hierarchy consists of just 938 (or less than 0.05%) of the overall conformers, representing a rare transition. In this substate, the α3 helix adopts a conformation that is more extended and hence represents an intermediate state that mediates a transition from sub-states 4 and 5 to the bound sub-state 1.
The observed clusters and conformational changes also provide a hypothesis for interconversions necessary for facilitating NCBD-ligand binding. For one, if NCBD is relatively compact, as in sub-states 4 and 5, then α3 must initially undergo partial unfolding, seen in sub-states 2 and 3, to allow for the ligand to bind. Only then can α3 adapt itself to form a full α-helix, as seen from experimental ensembles. Since we have not performed a comparison of our simulations with the ligand-bound state of either 1KBH or 2C52, we cannot provide a quantitative picture about the nature of changes that are required. However, based on the structural information available from experiments, such a partial unfolding-refolding pathway may indeed be responsible for facilitating NCBD’s recognition of its binding partners. A similar scenario can also be proposed for α1, which twists when binding with IRF3 (seen in Fig. 1D), although these experiments will be pursued in the future.
7. Conclusions and Future Work
As part of pursuing further work in the area, we propose to incorporate simulations from a second NMR ensemble (1JJS) as well as several ligand-bound conformations to map out the conformational landscape of NCBD. Furthermore, by extending the Markov diffusion framework, we will elucidate the kinetic rates of significant conformational transitions.
The methodologies we have put forward yield the following insights: (a) ligand-free NCBD can indeed access conformations representative of the ligand-bound form and (b) structural changes required for ligand-free NCBD to access states that resemble ligand-bound conformations require concerted changes throughout the protein. We show that within our simulations, ligand-free α1 and α2 orientations largely resemble those of ligand-bound conformations; α3 however, can exhibit a wide degree of flexibility and does not generally sample conformations that are similar to ligand-bound states.
References
- 1.Fuxreiter M, Tompa P, Simon I, Uversky VN, Hansen JC and Asturias FJ, Nat. Chem. Biol 4, 728 (2008). [DOI] [PMC free article] [PubMed] [Google Scholar]
- 2.Babu MM, van der Lee R, de Groot NS and Gsponer J, Curr. Opi. Struct. Biol 21, 432 (2011). [DOI] [PubMed] [Google Scholar]
- 3.Dyson HJ and Wright PE, Nat. Rev. Mol. Cell Biol 6, 197 (2005). [DOI] [PubMed] [Google Scholar]
- 4.Dunker AK, Silman I, Uversky VN and Sussman JL, Curr. Opi. Struct. Bio 18, 756 (2008). [DOI] [PubMed] [Google Scholar]
- 5.Stefani M, Biochimica et Biophysica Acta (BBA) - Molecular Basis of Disease 1739, 5 (2004). [DOI] [PubMed] [Google Scholar]
- 6.Zhang QC, Yeh T. l., Leyva A, Frank LG, Miller J, Kim YE, Langen R, Finkbeiner S, Amzel ML, Ross CA and Poirier MA, J. Biol. Chem 286, 8188 (2011). [DOI] [PMC free article] [PubMed] [Google Scholar]
- 7.Acevedo ML and Kraus WL, Mol. Cell. Biol 23, 335 (2003). [DOI] [PMC free article] [PubMed] [Google Scholar]
- 8.Li H and Chen JD, J. Biol. Chem 273, 5948 (1998). [DOI] [PubMed] [Google Scholar]
- 9.Gu W, Shi X-L and Roeder RG, Nature 387, 819 (1997). [DOI] [PubMed] [Google Scholar]
- 10.Burge S, Teufel DP, Townsley FM, Freund SMV, Bycroft M and Fersht AR, Proc. Natl. Acad. Sci. USA 106, 3142 (2009). [DOI] [PMC free article] [PubMed] [Google Scholar]
- 11.Lin R, Heylbroeck C, Pitha PM and Hiscott J, Mol. Cell. Biol 18, 2986 (1998). [DOI] [PMC free article] [PubMed] [Google Scholar]
- 12.Scoggin KES, Ulloa A and Nyborg JK, Mol. Cell. Biol 21, 5520 (2001). [DOI] [PMC free article] [PubMed] [Google Scholar]
- 13.Mullighan CG, Zhang J, Kasper LH, Lerach S, Payne-Turner D, Phillips LA, Heatley SL, Holmfeldt L, Collins-Underwood JR, Ma J, Buetow KH, Pui C-H, Baker SD, Brindle PK and Downing JR, Nature 471, 235 (2011). [DOI] [PMC free article] [PubMed] [Google Scholar]
- 14.Torres-Arzayus MI, Font de Mora J, Yuan J, Vazquez F, Bronson R, Rue M, Sellers WR and Brown M, Cancer Cell 6, 263 (2004). [DOI] [PubMed] [Google Scholar]
- 15.Lee CW, Martinez-Yamout MA, Dyson HJ and Wright PE, Biochemistry 49, 9964 (2010). [DOI] [PMC free article] [PubMed] [Google Scholar]
- 16.Kjaergaard M, Teilum K and Poulsen FM, Proc. Natl. Acad. Sci. USA 107, 12535 (2010). [DOI] [PMC free article] [PubMed] [Google Scholar]
- 17.Demarest SJ, Martinez-Yamout M, Chung J, Chen H, Xu W, Dyson HJ, Evans RM and Wright PE, Nature 415, 549 (2002). [DOI] [PubMed] [Google Scholar]
- 18.Demarest SJ, Deechongkit S, Dyson HJ, Evans RM and Wright PE, Protein Sci 13, 203 (2004). [DOI] [PMC free article] [PubMed] [Google Scholar]
- 19.Lin CH, Hare BJ, Wagner G, Harrison SC, Maniatis T and Fraenkel E, Mol. Cell 8, 581 (2001). [DOI] [PubMed] [Google Scholar]
- 20.Bowman G, Beauchamp K, Boxer G and Pande VS, J. Chem. Phys 131, p. 124101 (2009). [DOI] [PMC free article] [PubMed] [Google Scholar]
- 21.Balsera MA, Wriggers W, Oono Y and Schulten K, J. Phys. Chem 100, 2567 (1996). [Google Scholar]
- 22.Zaccai G and Jacrot B, Annu. Rev. Biophysics. Bioeng 12, 139 (1983). [DOI] [PubMed] [Google Scholar]
- 23.Kurylowicz M, Yu C-H and Pomès R Biophys. J 98, 386 (2010). [DOI] [PMC free article] [PubMed] [Google Scholar]
- 24.Ramanathan A, Savol A, Langmead C, Agarwal P and Chennubhotla C, PLoS ONE 6, p. e15827 (2011). [DOI] [PMC free article] [PubMed] [Google Scholar]
- 25.Bowman G GR and Pande VS, Proc. Natl. Acad. Sci. USA 107, 10890 (2010). [DOI] [PMC free article] [PubMed] [Google Scholar]
- 26.Morcos F, Chatterjee S, McClendon CL, Brenner PR, Lóopez-Rendón R, Zintsmaster J, Ercsey-Ravasz M, Sweet CR, Jacobson MP, Peng JW and Izaguirre JA, PLoS Comput. Biol 6, p. e1001015 (2010). [DOI] [PMC free article] [PubMed] [Google Scholar]
- 27.Deng N, Zheng W, Gallicchio E and Levy RM, J. Am. Chem. Soc 133, 9387 (2011). [DOI] [PMC free article] [PubMed] [Google Scholar]
- 28.Heinig M and Frishman D, Nucl. Acids Res 32, W500 (2004). [DOI] [PMC free article] [PubMed] [Google Scholar]
- 29.Case DA, Cheatham TE, Darden T, Gohlke H, Luo R, Merz KM, Onufriev A, Simmerling C, Wang B and Woods RJ, J. Comp. Chem 26, 1668 (2005). [DOI] [PMC free article] [PubMed] [Google Scholar]
- 30.Hornak V, Abel R, Okur A, Strockbine B, Roitberg A and Simmerling C, Proteins: Struct. Func. Bioinfo 65, 712 (2006). [DOI] [PMC free article] [PubMed] [Google Scholar]
- 31.Ramanathan A and Agarwal PK, J. Phys. Chem. B 113, 16669 (2009). [DOI] [PMC free article] [PubMed] [Google Scholar]
- 32.Harvey MJ, Giupponi G and Fabritiis GD, J. Chem. Theory Comput 5, 1632 (2009). [DOI] [PubMed] [Google Scholar]
- 33.Feenstra KA, Hess B and Berendsen HJC, J. Comp. Chem 20, 786 (1999). [DOI] [PubMed] [Google Scholar]
- 34.Shen Y and Bax A, J. Biomol. NMR 38, 289 (2007). [DOI] [PubMed] [Google Scholar]
- 35.Mittal J and Best RB, Biophys. J 99, L26 (2010). [DOI] [PMC free article] [PubMed] [Google Scholar]
- 36.Caves LS, Evanseck J and Karplus M, Protein Sci 7, 649 (1998). [DOI] [PMC free article] [PubMed] [Google Scholar]
- 37.Grossfield A, Feller SE and Pitman MC, Proteins: Struc. Func. Bio 67, 31 (2007). [DOI] [PubMed] [Google Scholar]
- 38.Mao B, Pear MR, McCammon JA and Northrup SH, Biopolymers 21, 1979 (1982). [DOI] [PubMed] [Google Scholar]
- 39.Ichiye T and Karplus M, Biochemistry 27, 3487 (1988). [DOI] [PubMed] [Google Scholar]
- 40.Pontiggia F, Colombo G, Micheletti C and Orland H, Phys. Rev. Lett 98, p. 048102 (2007). [DOI] [PubMed] [Google Scholar]
- 41.Woods KN, Phys. Rev. E 81, p. 031915 (2010). [DOI] [PubMed] [Google Scholar]
- 42.Schiró G, Caronna C, Natali F and Cupane A, J. Am. Chem. Soc 132, 1371 (2010). [DOI] [PubMed] [Google Scholar]
- 43.Frauenfelder H, Parak F and Young RD, Ann. Rev. Biophys. Biophys. Chem 17, 451 (1988). [DOI] [PubMed] [Google Scholar]
- 44.Miller MA and Wales DJ, J. Chem. Phys 111 (1999). [Google Scholar]
- 45.Altis A, Nguyen P, Hegger R and Stock G, J. Chem. Phys 126, p. 244111 (2007). [DOI] [PubMed] [Google Scholar]
- 46.Mu Y, Nguyen P and Stock G, Proteins: Struct. Func. Bio 58, 45 (2004). [Google Scholar]
- 47.Maisuradze GG and Leitner DM, Proteins: Struct. Func. Bio 67, 569 (2007). [DOI] [PubMed] [Google Scholar]
- 48.Cardoso J-F, Neural Computation 11, 157 (1999). [DOI] [PubMed] [Google Scholar]
- 49.Golub GH and Van Loan CF, Matrix Computations (Johns Hopkins University Press, 1996). [Google Scholar]
- 50.Chennubhotla C and Jepson A, Neural Info. Proc. Sys 17, 273 (2005). [Google Scholar]
- 51.Chennubhotla C and Bahar I, Mol. Sys. Biol 2, p. 36 (2006). [DOI] [PMC free article] [PubMed] [Google Scholar]
- 52.Chennubhotla C and Bahar I, PLoS Comput Biol 3, 1716 (2007). [DOI] [PMC free article] [PubMed] [Google Scholar]
- 53.Savol A, Burger V, Agarwal P, Ramanathan A and Chennubhotla C, Bioinformatics 27, i52 (2011). [DOI] [PMC free article] [PubMed] [Google Scholar]