Abstract
Humans and monkeys have similar capacities to discriminate the frequencies of mechanical sinusoids delivered to their hands in the range that corresponds to the sense of flutter (10–50 Hz). Previous studies showed that monkeys can discriminate whether comparison stimuli are higher or lower in frequency than a base stimulus that does not vary from trial to trial during an experiment. We verified this result in two monkeys trained in this manner. To confirm that these animals were able to discriminate, we tested them in a variant of the task in which the frequency of the base stimulus changed randomly from trial to trial. The monkeys failed to discriminate in this new testing mode; instead they seemed to categorize the comparison stimuli, ignoring the base stimulus. After further training in the randomized base condition, the two monkeys learned to discriminate accurately. We then explored how the stimulation parameters affected performance. We found that animals could discriminate accurately with stimulus durations as short as 250 msec, with interstimulus intervals as long as 10 sec, with 50% differences between base and comparison stimulus amplitudes or when stimulated on a different finger. Performance did not degrade in these conditions, even though the monkeys had never been trained or tested under them. The results show that monkeys may try to categorize rather than discriminate when the task allows either strategy, although they are capable of performing true discriminations very robustly. These findings have important implications for investigating the neuronal processes underlying sensory discrimination.
Keywords: flutter, psychophysics, discrimination, categorization, monkeys, vibrotactile stimuli
An important problem in sensory physiology is the isolation of the neural codes that explain the capacity of a subject to make detections and discriminations of sensory stimuli. In this respect, LaMotte and Mountcastle (1975) and Mountcastle et al. (1990)have made a number of important observations in a sensory modality called the sense of flutter. They determined that both humans and monkeys have similar capacities for detecting and discriminating the frequencies of mechanical sinusoids delivered to their hands. The aim of those studies was to discover how the neural code of primary somatosensory cortex (S1) is related to somesthetic performance in the sense of flutter. In the task they designed, animals had to indicate whether the frequency of a comparison stimulus was lower or higher than a base stimulus that did not vary in frequency from trial to trial during a run. The results revealed a set of neurons with quickly adapting properties, the activity of which was entrained by the stimuli, firing in phase with the oscillatory signal. These neurons responded identically to the two stimuli, they did so even during passive stimulation, and their activities seemed unrelated to any kind of comparison process that presumably takes place during discrimination. Mountcastle and colleagues (1990) concluded that the neuronal signals that determine psychophysical performance should be sought in more central structures linked to S1 cortex. Also in the flutter submodality but using a slightly different paradigm, Recanzone et al. (1992b) found similar entrained neuronal activity in S1. They revealed differences in the timing of these responses that were functions of stimulus frequency and showed that these differences correlated closely with the behavioral performance of the animals. This group also reported a number of changes in the properties of S1 neurons occurring as a result of experience with the task.
The sense of flutter offers a number of advantages as a model for how sensory processing takes place in the cortex. For this reason we decided to investigate further some of the questions that were left open by the groundbreaking work of Mountcastle. When we reexamined the psychophysics of the task, we found the paradigm to be ambiguous; when the base stimulus is kept constant, the task can be solved either by comparing the two stimuli or by categorizing the second stimulus as “high” or “low,” ignoring the base stimulus. We found that monkeys trained with fixed base stimuli use the second strategy and cannot make discriminations when the first stimulus is changed from trial to trial. In the present paper we present the results of a comprehensive set of psychophysical experiments designed to test the conditions under which monkeys can perform true discriminations in this modality. We also discuss the importance of the distinction between true discrimination tasks and other paradigms.
MATERIALS AND METHODS
Classical somesthetic task. Two male monkeys (Macaca mulatta; 6–8 kg) were trained to discriminate the frequencies of mechanical sinusoids delivered to the skin of one of the fingers of the left, restrained hand (Mountcastle et al., 1990). They indicated the difference in frequency between the two stimuli by pressing one of two target switches with the unrestrained hand and were rewarded for correct discrimination. Eight human subjects were also tested to construct stimulus control sets, as reported previously (Mountcastle et al., 1990). They served to adjust the amplitudes of the comparison stimuli at different frequencies so that they matched in subjective intensity that of the base stimuli. All procedures concerning the animals and human subjects were performed according to institutional protocols that meet or exceeded the National Institutes of Health and Society for Neuroscience guidelines.
During the task, the left arm of the animal was secured in a half cast and maintained in a palm-up position. The right hand operated an immovable key (elbow joint at 90°). The target switches were located at 70 and 90 mm to the right of the midsaggital plane; they were placed at reaching distance, 250 mm from the animal’s shoulder and at eye level. The stimulator tip (2 mm) delivered mechanical sinusoids in the range of flutter (2–50 Hz) on the skin surface of the distal segment of the third digit. Stimuli were delivered by a computer-controlled Chubbuck linear motor stimulator (Chubbuck, 1966).
Monkeys were initially trained by following the procedure described previously (Mountcastle et al., 1990). Briefly, they received their normal food rations but were deprived of liquid, except for the juice or water drops obtained during the training and testing sessions. The animals worked 7 d/week, 6 hr/d on average; they typically performed ∼1200 trials per day, with a total intake of 300–500 ml of liquid. The initial training phase consisted of four main parts. First, the monkey learned to place his right hand on the key after the probe was lowered and indented the skin surface of the distal segment of the third digit. Second, after the skin indentation, a single stimulus lasting 2 sec was delivered, after which the monkey had to release the key. Third, the single stimulus was broken in two, by inserting an interstimulus interval during which the probe did not move. This interval was very short at first and increased progressively. At this stage the monkey had to release the key after the end of the second stimulus. Finally, the second stimulus changed to a frequency either much lower or much higher than the first, and the arm of the monkey was physically guided toward the corresponding target switch. In this step the button that the animal had to push was illuminated. Once the monkey performed consistently, the guiding lights were switched off, and other comparison frequencies were included. It took the monkeys ∼40 d to go through the complete process. The frequency of the first stimulus was kept constant throughout this training period, but later on three values were used: 20, 30, and 40 Hz. During the testing phase one of these three frequencies was randomly chosen typically for every block of 100 trials.
The trained monkey began a trial by placing his right hand on the immovable key in a period not exceeding 1 sec, after a step indentation (500 μm) of the skin of the left hand. He maintained this position throughout a variable delay period of 1.5–4.5 sec, until the probe started oscillating. Two stimuli, termed base andcomparison, of 1 sec duration were delivered in sequence, with an interstimulus interval of 1 sec. He indicated detection of the end of the second stimulus by removing his hand from the key within 600 msec, and indicated whether the frequency of the second stimulus was lower or higher than the frequency of the first by projecting his right hand to the corresponding switch within 600 msec. The medial switch was used to indicate that the comparison frequency was lower than the base, and the lateral switch was used to indicate that the comparison frequency was higher than the base. The animal was rewarded for correct discrimination with a drop of water or juice. The tactile stimuli were neither visible nor audible to the animal.
Training for true discrimination. For the animals to carry out the task when the base frequency changed from trial to trial, they had to be retrained. The working regimen and the sequence of events in a trial were the same as described above, but the specific training technique was adjusted to the new conditions of the task. A simple stimulus set was used at first. It consisted of two base frequencies, 20 and 34 Hz, each having two possible comparison frequencies, 12 and 28 Hz for a base of 20 Hz and 26 and 42 Hz for a base of 34 Hz. In this situation, the monkey could get a reward on 50% of the trials (those with comparison frequencies of 42 and 12 Hz) by simply categorizing the comparison frequency. Thus it was very important to double or triple the reward when he discriminated correctly on those trials involving 26 and 28 Hz. These two frequencies were chosen because the animal could not distinguish between them, and categorizing both as low or high did not produce a consistent outcome. After the monkeys reached nearly perfect performance with this stimulus set, other base and comparison frequencies were added progressively. It was difficult for the animals to learn the new task; they were trained for about 2 months before data were collected in this condition. The data collection period lasted ∼2 months more. During this phase, some of the parameters in the task, e.g., stimulus duration and interstimulus interval, were varied to investigate their effect on discrimination (see Results).
Analysis of behavioral performance. Psychometric curves were obtained for the two monkeys and eight human subjects using fixed base frequencies. The data from humans were used to construct the stimulus control sets for frequency discrimination; these data are not shown, because they are almost identical to those reported by Mountcastle et al. (1990). The results in this case were plotted as the percentage of trials in which the comparison stimulus was identified as higher in frequency than the base stimulus, as a function of the frequency of the comparison stimulus. We used logistic Boltzmann equations to fit these data:
| Equation 1 |
where p is the percent of trials called high,x is the comparison frequency, A1 andA2 are the minimum and maximum values ofp, respectively, x0 is the stimulus frequency for which p = (A1 +A2)/2, and dx determines the width of the function. All regressions fitted the data significantly, with a χ2 of p < 0.01. Psychometric thresholds [i.e., difference limens (DLs)] were computed by subtracting the inverse of the stimulus frequency identified as higher than the standard on 75% of the trials, from the inverse of the frequency identified as higher on 25% of the trials, and dividing the result by 2. These values were obtained directly from the fitted functions, expressed in terms of cycle lengths in milliseconds. Weber fractions were also directly calculated from these curves. All tests, except stimulation on different fingers, were performed on both monkeys. Results shown are from monkey 1, but in all cases monkey 2 performed similarly.
RESULTS
Discrimination versus categorization
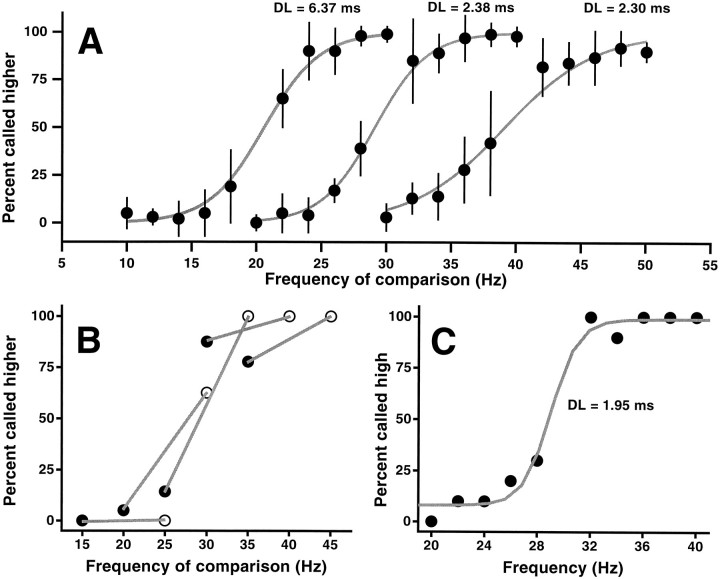
As mentioned above, humans and monkeys were found to have similar capacities for discriminating the frequencies of mechanical sinusoidal vibrations delivered to their hands, in the range of 10–50 Hz (LaMotte and Mountcastle, 1975; Mountcastle et al., 1990). We verified these results in two monkeys by following the original testing situation (LaMotte and Mountcastle, 1975; Mountcastle et al., 1990); in all trials during a run, the base stimulus of the fixed frequency (20, 30, or 40 Hz) was followed by a comparison stimulus of a higher or lower frequency, after an interstimulus interval of 1 sec. The comparison frequencies used varied in steps of 2 Hz from the base and were chosen pseudorandomly in each trial. Animals learned to indicate whether the comparison frequencies were lower or higher than the base after ∼1.5 months of training. They did so with DLs and Weber fractions similar to those reported before (Mountcastle et al., 1990). The results shown in Figure 1A represent the performance of monkey 1 averaged over 10 consecutive days during which the data were collected. On most days the base frequency was changed for approximately every block of 100 trials.
Fig. 1.
Capacity of monkey 1 to discriminate the differences in frequency between two tactile stimuli. A, Psychophysical performance when the base stimulus frequency is held constant at 20, 30, or 40 Hz during a run (100 trials). Data points show the percent of trials in which the frequency of the comparison stimulus was judged as higher than that of the base stimulus, as a function of the frequency of comparison. The curves are logistic functions fitted to the data points. Data were collected during 10 consecutive days and are based on 100 trials per point. Error bars indicate ±1 SD of the 10 daily means and thus indicate the day-to-day variability in performance. B, Failure to discriminate the frequency difference between the two stimuli when the base frequency changes from trial to trial. In each case the comparison frequency was 5 Hz higher or lower than the base frequency. The base frequencies correspond to the midpoints of the line segments.Filled and open symbols correspond to comparison frequencies below and above the base, respectively.C, Capacity of the same monkey to categorize frequencies. Without further training, single stimuli were delivered, and the monkey had to indicate whether they were higher or lower than 30 Hz; the same set of frequencies as in the middle curve of A were used, but without the base stimulus. Monkeys had to discover the limits of the low and high categories through trial and error. The data are shown as the percentage judged high; the first 50 trials in this test were excluded. The animal made accurate categorizations. Each data point inB and C represents 30 trials. In all cases, stimuli were delivered at seven times the detection threshold at 30 Hz, adjusted for equal subjective magnitude. Stimulus duration was 1 sec, with 1 sec of interstimulus interval.
We assumed that if these two monkeys were discriminating the differences in frequency between the two stimuli, they would also be able to discriminate them when the frequency of the base stimulus changed from trial to trial. However, the monkeys were unable to do so. According to the results of Figure 1A, the monkeys could reliably distinguish frequency differences of 5 Hz between base and comparison stimuli. When the base frequency was randomly varied between 20 and 40 Hz, all comparison frequencies <30 Hz were called lower than the base, whereas those comparison frequencies >30 Hz were called higher than the base, even though the differences between the two stimuli were 5 Hz. This is shown in Figure 1B, where filled and open symbols indicate trials in which the comparison frequency was lower and higher than the base, respectively; the base frequency corresponds to the middle of the line segments. Identical results were obtained when the frequency differences between base and comparison were increased to 8 and 10 Hz. It thus seemed that the monkeys were only paying attention to the second stimulus, categorizing it as low or high with respect to 30 Hz, which was the base frequency used during training.
To test this possibility, in separate runs the base stimulus was removed, and single stimuli were delivered in each trial. In this new condition the monkeys were rewarded for correctly categorizing the stimulus as lower or higher in frequency than 30 Hz. The monkeys had to press the medial button every time the frequency of the single stimulus was <30 Hz and the lateral button when it was >30 Hz. They had no explicit indication that 30 Hz marked the division between the two categories and had to discover this through trial and error. The frequencies in this case were the same as those used for themiddle curve in Figure 1A. In the first 10 or so trials in this condition the monkeys reacted too late, as if they had been waiting for the second stimulus. In the next 30 or so they reacted in time, and performance increased steadily. Although they had not been explicitly trained for it, the monkeys figured out how to do the task in <50 trials, after which they made precise categorizations. Figure 1C shows the results. The psychometric curve is very similar to those in Figure 1A, for discrimination using a base stimulus of fixed frequency. Similar results were obtained when the single stimuli had to be categorized as lower or higher than 20 or 40 Hz; the psychometric curves in those cases were like the one shown in Figure 1C, except shifted to the left (for 20 Hz) or to the right (for 40 Hz). These results suggest that monkeys performing the classical discrimination task do not compare the two stimuli at every trial. They instead classify the second stimulus as low or high, possibly setting the limits of each category during the first few trials in a run. Humans tested in this situation were able to discriminate in both cases (data not shown) with no further training required.
True discrimination
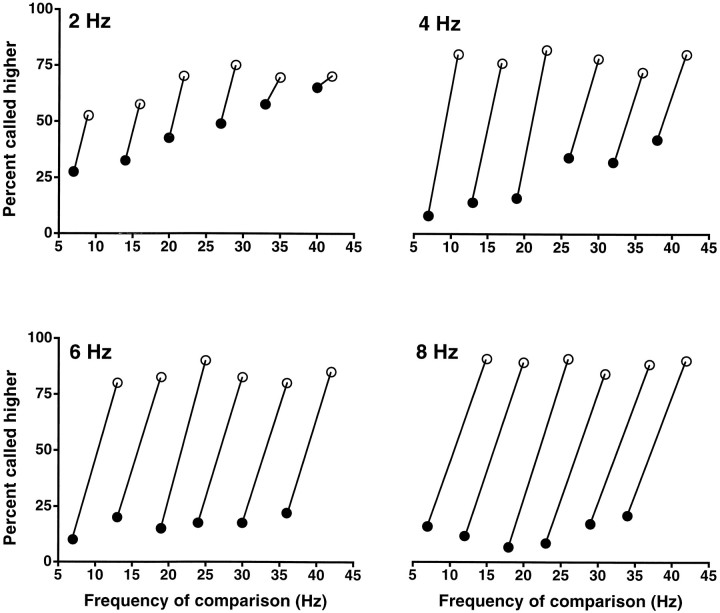
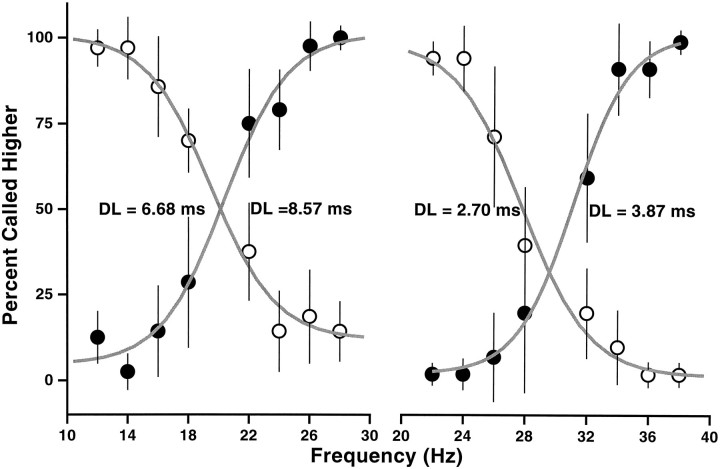
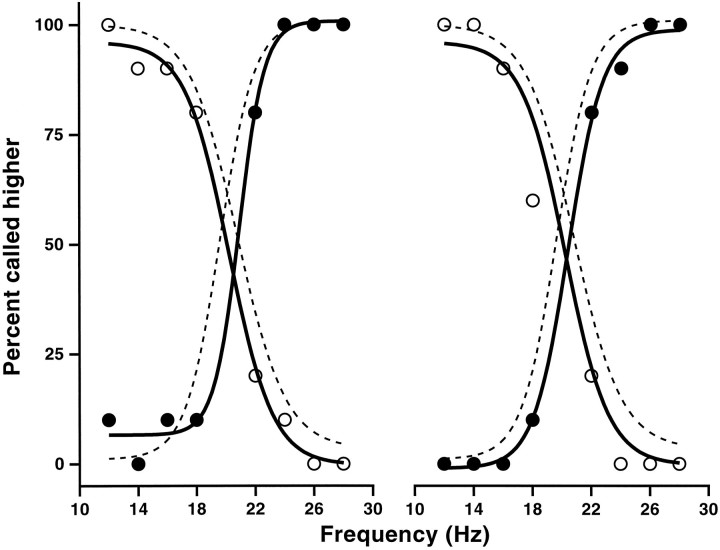
The same animals used in the previous tests were retrained to make discriminations when the base stimulus varied from trial to trial. During the final phase of training, the differences between base and comparison frequencies were kept constant at 10 Hz. A set of frequency pairs was selected such that either frequency in the pair could occupy the base or comparison position; at each trial one of the pairs from the set was chosen pseudorandomly, and the elements of the pair were designated, also pseudorandomly, as the base and comparison frequencies. Animals required about 2 months of continuous training to discriminate correctly in this situation. Figure 2 shows the discriminative capacity of monkey 1 when tested with sets of pairs with differences of 8, 6, 4, and 2 Hz between the base and comparison stimuli. In each run these differences were kept constant. In Figure 2each test pair is joined by a line, and each of the joined data points acts as either the base or the comparison frequency.Filled symbols indicate trials in which the base was higher, and open symbols indicate trials in which it was lower than the comparison. Performance is >75% correct for differences of 8 and 6 Hz; it degrades somewhat at 4 Hz and is barely above chance for 2 Hz. This dependence on the frequency difference is to be expected if the two stimuli are indeed being compared during the task. It thus seemed that in this case the monkeys were truly discriminating. We reasoned that if this was true, then they should be able to discriminate under more demanding conditions, namely when the difference between base and comparison frequencies also varied from trial to trial. Figure3 shows the results when monkey 1 was presented with mixed sets of stimuli in which both the base frequency and the frequency differences were varied pseudorandomly in each trial. These sets were designed so that the results could be sorted with respect to a reference frequency, 20 or 30 Hz in the examples shown. For each panel in Figure 3, the results have been ordered and separated in two: for the graphs on the left, filled symbolscorrespond to trials in which the base stimulus was 20 Hz, andopen symbols correspond to trials in which the comparison stimulus was 20 Hz; the graphs on the right were generated in the same way but using a different set of frequencies that had 30 Hz as the reference point. The performance reached in these cases is very similar to that exhibited in the first test (Fig.1A). From these results, it seems almost certain that the animals learned to discriminate on a trial by trial basis. We conclude that this capability develops when the monkeys are forced to discriminate during training, which is accomplished by systematically varying the first and second stimuli. When the first stimulus is held constant, the animals seem to use a categorization strategy that only requires analysis of the second stimulus.
Fig. 2.
Frequency discrimination between two tactile stimuli when the base stimulus frequency changes from trial to trial. Sets of frequency pairs were used in which the difference between base and comparison frequencies was kept constant at 8, 6, 4, and 2 Hz. The monkey had been retrained with similar stimulus sets but with 10 Hz differences. Base–comparison frequency pairs are joined bylines. Each data point in a pair acts as both base and comparison frequency. Filled symbols indicate trials in which the base frequency was higher than the comparison; open symbols indicate trials in which the comparison frequency was higher than the base. Results are indicated as the percentage of trials in which the comparison frequency was judged as higher than the base frequency. The plots show that the difficulty of the task increased with smaller frequency differences. Data points are based on 100 trials. Other stimulation parameters are as in Figure 1.
Fig. 3.
Discrimination capacity of monkey 1 when the base frequency and the frequency difference between the two stimuli are varied simultaneously on every trial. Stimulus sets were constructed in which a reference frequency was paired with eight other frequencies so that it could occupy either the base or the comparison position. These stimulus sets were not used to train the monkeys, only to test them. The base–comparison frequency pairs were chosen pseudorandomly at each trial. For the left panel, filled symbolscorrespond to trials in which 20 Hz was the base frequency; open symbols correspond to trials in which 20 Hz was the comparison frequency. For the right panel the data were sorted similarly but with respect to a reference frequency of 30 Hz. Data points are based on 100 trials, performed during 10 consecutive days. Error bars represent ±1 SD of the 10 daily means. Performance in all cases is comparable to that shown in Figure 1A. Other stimulation parameters are as in Figure 1.
Effect of stimulus duration
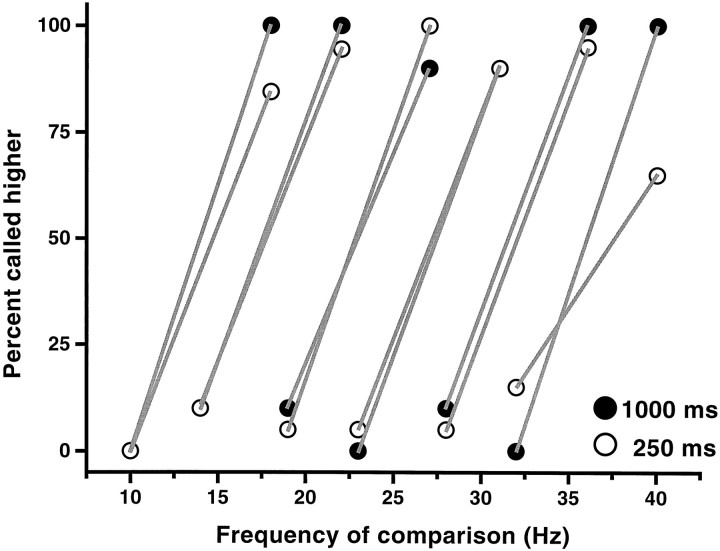
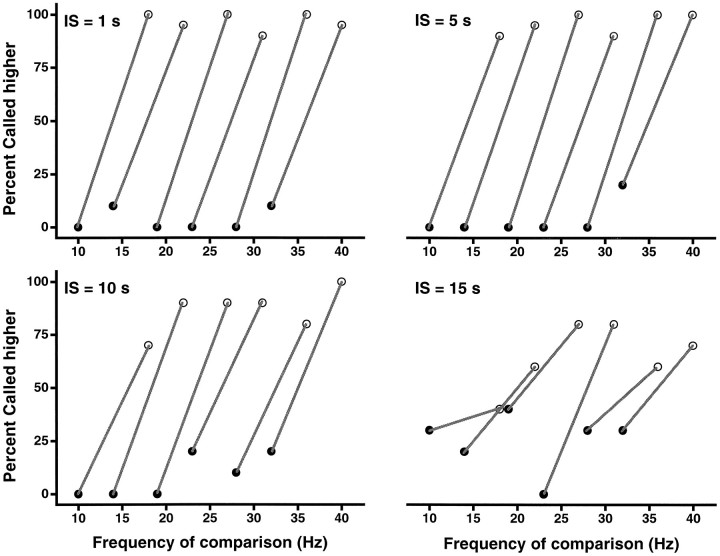
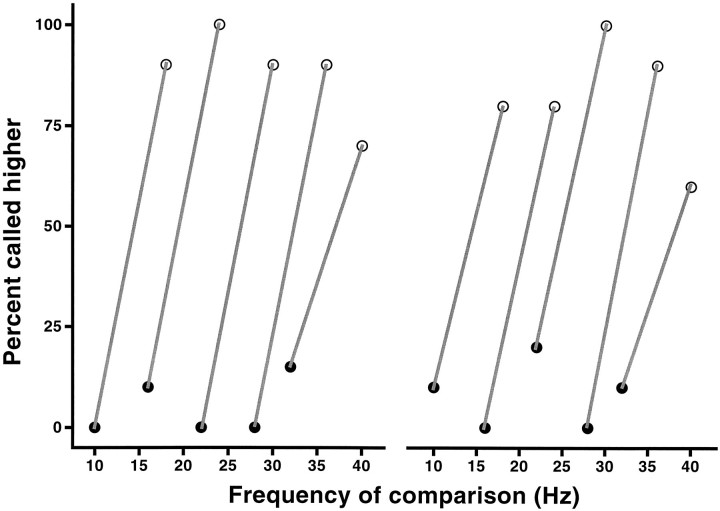
A question that had not been addressed in studies with monkeys is the minimal stimulus duration required for discrimination. We measured this quantity in the two monkeys by reducing the duration of the two stimuli. For this test, frequency differences of 8 Hz were used to make sure that the animals were fully capable of discriminating. We found that animals could discriminate accurately when stimulation lasted ≥250 msec. This implies that just a few cycles are required to carry out the discrimination. Only two cycles suffice at 10 Hz, although the minimum number of cycles increases with frequency. Stimulating for <200 msec produced a noticeable drop in performance. The results shown in Figure 4 were obtained when the shorter stimuli were presented to the monkeys for the first time.
Fig. 4.
Discrimination capacity as a function of stimulus duration. Filled symbols correspond to 1000 msec, andopen symbols correspond to 250 msec duration. Performance is similar in the two conditions. Stimulus sets consisted of frequency pairs separated by 8 Hz in which both frequencies could occupy the base and the comparison positions. These pairs were presented in pseudorandom order. Pairs are joined bylines. Data points are based on 100 trials.
Effect of interstimulus interval
Because of the design of the task, when animals are truly discriminating they have to pay attention to the first stimulus and store some trace of it during the interstimulus period, to compare it with the second stimulus. This presumably involves a short-term or working memory process. We measured the time scale of this underlying process by evaluating the discriminative capacity of the two monkeys as a function of the interstimulus interval. Frequency differences in this case were large (8 Hz), so that the difficulty of the task lied only in the length of the interstimulus interval. As shown in Figure5, animals discriminated accurately with interstimulus periods of 1 and 5 sec; their performance diminished slightly with 10 sec, and it deteriorated noticeably with 15 sec. The data in this figure are displayed in the same format as Figure 2; stimuli were selected in pairs with fixed frequency differences of 8 Hz. Interstimulus intervals were kept constant during each block of trials. An important issue in this experiment is that animals had not been tested or trained previously with interstimulus intervals of >1 sec. It thus seems that the mechanism that normally (i.e., for 1 sec interstimulus intervals) stores information about the first stimulus lasts on the order of 10–15 sec. However, it is likely that with adequate training these animals could be able to make accurate discriminations with longer interstimulus intervals; we did not explore this possibility. In a simple variant of this experiment, the interstimulus interval varied randomly from trial to trial between 1 and 4.5 sec. For all tests corresponding to Figures 2, 3, 4, 5 and 8, the results were indistinguishable from those obtained with a fixed 1 sec interstimulus interval.
Fig. 5.
Frequency discrimination as a function of interstimulus interval. The same stimulus set, frequency pairs separated by 8 Hz with both frequencies occupying the base and the comparison positions, was used in the four plots. Base and comparison frequency pairs are joined by lines. Results are shown for interstimulus intervals (IS) of 1, 5, 10, and 15 sec. The animal’s performance deteriorated for interstimulus intervals of >10 sec. Data points are based on 20 trials.
Fig. 8.
Frequency discrimination as a function of the locus of stimulation. Sets of frequencies like those in Figure3A were used. Stimuli were delivered to the same digit used throughout the experiments (digit 3) and to two others. The plot on the left shows the discrimination accuracy as a function of frequency for stimulation of fingers 2 (continuous lines) and 3 (dashed lines). The plot on theright shows the results for stimulation of fingers 3 (dashed lines) and 4 (continuous lines).Open symbols indicate trials in which 20 Hz was the comparison frequency; filled symbols indicate trials in which 20 Hz was the base frequency. The dashed curves in the two panels are the same; for clarity, their corresponding data points are not shown. Each point comprises 10 trials; all data were collected during a single day. Performance was the same irrespective of the finger stimulated.
Effect of stimulus amplitude
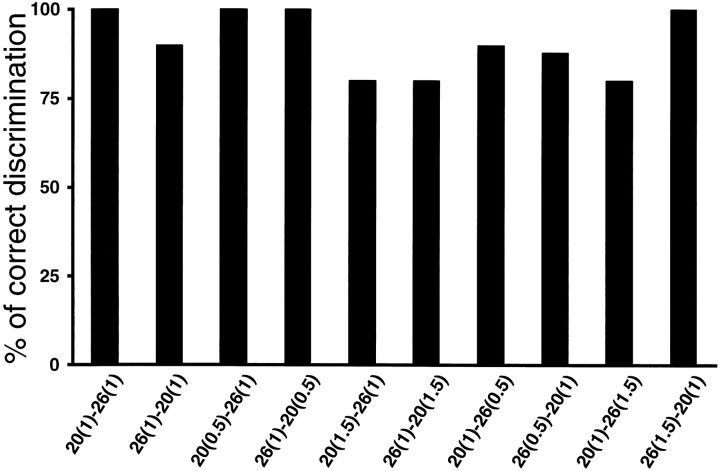
Normally, when two stimuli are presented at different frequencies, subjects also perceive a difference in intensity, even though the physical amplitude of the vibrations is the same (LaMotte and Mountcastle, 1975). Thus in principle it is possible to discriminate two stimuli of different frequencies based on the difference in their corresponding subjective intensities. To eliminate this possibility, all previous tests were performed having adjusted the amplitudes of the stimuli such that they were subjectively judged to be of equal intensity, as had been performed previously (Mountcastle et al., 1990). The standard amplitude used was seven times the detection threshold at 30 Hz, and corrections were made to this value for each frequency. These corrections were small, for example, ∼12% for a frequency of 20 Hz. To confirm that animals were paying attention to the frequencies and not to the amplitudes of the stimuli, we introduced large differences in the relative amplitudes of the base and comparison stimuli. These were larger than the differences used in a similar experiment using the original fixed base frequency paradigm (LaMotte and Mountcastle, 1975). After a few trials of adjustment in this new situation, animals were able to make accurate discriminations. In Figure 6 a single pair of frequencies, 20 and 26 Hz, was used. Either frequency could appear in the base or comparison position. One of the stimuli was always delivered at the standard amplitude, and the other was delivered at 0.5, 1.0, or 1.5 times the standard amplitude. The monkey performed >75% correct irrespective of the amplitude combination. In Figure 7 pairs of frequencies with differences of 6 Hz were delivered, with both frequencies used as base and comparison (as in Fig. 2). In this test, either the comparison stimulus had an amplitude equal to 1.5 times that of the base (Fig. 2,left panel), or vice versa (Fig. 2, right panel). The results demonstrate that the discrimination process is largely insensitive to the stimulus amplitudes. This may be attributable to the fact that the animals had had a long training period before variations in amplitude were introduced; a different outcome may result in animals with little training.
Fig. 6.
Discrimination between frequencies when the first and second stimuli differ in amplitude by 50%. Base and comparison frequencies (20 or 26 Hz) are indicated below each graph, in that order. The numbers in parenthesesindicate the stimulus amplitudes relative to the standard amplitude used in previous tests (equal to 7 times the detection threshold at 30 Hz). Results are plotted as the percentage of trials in which the animal discriminated correctly. The 10 conditions were delivered randomly and were measured in a single run. All data points are from 20 trials per class.
Fig. 7.
Results of a second test in which the first and second stimuli differ in amplitude by 50%. Pairs of stimuli with constant frequency differences of 6 Hz are presented. As in Figure 2, both frequencies in a pair occupy the base and comparison positions and are joined by lines. In the left panelcomparison stimuli were 1.5 times stronger in amplitude than the base stimuli. In the right panel base stimuli were 1.5 times stronger than the comparison stimuli. Data for the two plots were measured in a single run and represent 20 trials per class. Performance was largely insensitive to the amplitude differences.
Effect of stimulus location
During all training sessions and throughout the previous experiments, animals were stimulated on the tip of the third finger of the left hand. We finally investigated whether the particular stimulation point used had a quantitative impact on the performance of the discrimination task. When monkey 1 was stimulated on the fourth and second digits, we found that he required only a few trials, on the order of 10, to adjust to the new situation. Afterward he reached performance levels identical to those seen before. The results are shown in Figure 8, where the set of frequencies used was the same as in Figure 3A. The dashed curves in Figure 8 correspond to stimulation on the third digit, the standard situation; they are identical in the two panels. The DLs obtained from these curves, for 20 Hz as the base and 20 Hz as the comparison frequency, were 3.20 and 4.57 msec, respectively. When tested on different digits the results were very similar; for the second (Fig. 8,left panel) the corresponding DLs were 2.26 (filled symbols) and 4.31 msec (open symbols), and for the fourth digit (Fig. 8, right panel) they were 3.56 (filled symbols) and 4.42 msec (open symbols). Apart from slight shifts with respect to the reference frequency, the curves are essentially indistinguishable. The data for all the curves in the figure were collected in a single day. The monkey had only once been stimulated on the second digit, 2 months before the experiment, and had never been stimulated on the fourth digit. This result indicates that the discrimination process is fully generalized to fingers other than the one used during training.
DISCUSSION
The major observation in the present work is that monkeys discriminate the frequencies of two vibratory stimuli delivered to their hands only when the first stimulus changes from trial to trial during training. When the base stimulus is kept constant throughout whole runs, animals learn to perform the task by categorizing the frequency of the second stimulus, presumably paying no attention to the first one. In retrospect, this strategy is consistent with the theoretical fact that a constant signal transmits no information and can thus be ignored. Analysis of the environment probably focuses on inputs that do vary and thereby carry high amounts of information. As discussed below, this finding has important methodological consequences for investigating the brain mechanisms implicated in sensory discrimination, in particular in the somatosensory system. We also determined the effect that the stimulus parameters have on the performance of the task: (1) a small number of cycles of the base and the comparison stimuli suffice for discrimination; (2) information about the first stimulus is stored for about 10 sec; (3) frequency discrimination is largely unaffected by differences in the magnitude of the stimuli; and (4) discrimination tested by stimulating a given finger is readily generalized to other fingers. These four findings show that when the monkeys are trained adequately, their ability to discriminate is extremely robust.
The sense of flutter has been used to search for the neural mechanisms responsible for sensory discrimination (Talbot et al., 1968;Mountcastle et al., 1969, 1972, 1990; LaMotte and Mountcastle, 1975;Recanzone et al., 1992b). Mountcastle and colleagues (Mountcastle et al., 1990) studied the activity of neurons in the S1 cortex (areas 3b and 1) that were active in phase with the oscillatory stimuli, firing with higher probability at times that differed by integer multiples of the stimulus period. This neural representation of the stimulus seemed independent of the mechanisms that presumably underlie the discrimination process (Mountcastle et al., 1990, their Fig. 13), in that signs of holding the base stimulus during the interstimulus period or of a comparison between the two stimuli were not observed. It thus seemed that the neural machinery performing the discrimination should be sought beyond S1 cortex. A variety of observations explained in the paper by Mountcastle et al. (1990) are consistent with this conclusion, which is probably correct. Nevertheless, in view of the present results, the possibility still exists that S1 plays an active role in discrimination other than encoding the physical properties of the stimuli. Recanzone et al. (1992b) did find a strong correlation between the timing of the S1 responses and the behavior of the animals in their task. As argued below, the interpretations of these two sets of findings depend on the assumptions made regarding how exactly the animals perform the tasks. The present psychophysical measurements are most important for the interpretation of future experiments in structures that are downstream from S1. It is very likely that in such structures neurons exhibiting activity related to the first stimulus during the interstimulus period would fire only when the animal discriminates the two stimuli and not when an alternate strategy such as categorization is operating.
Using the frequency discrimination task with a fixed base, recordings from the primary motor cortex (M1) contralateral to the responding arm revealed selective neural discharges which reflected the discrimination process (Mountcastle et al., 1992). This differential activity actually was observed only during the comparison stimuli, which would be expected if animals based their decisions exclusively on the second stimulus. Similar responses have been recorded from monkeys trained to categorize the speed of tactile motion on the basis of a single stimulus; some neurons from M1 cortex (E. Salinas and R. Romo, unpublished results), the supplementary motor area (Romo et al., 1993,1997), and the putamen (Romo et al., 1995; Merchant et al., 1997) reflect the sensory decision process in their activity.
Werner (1980) has clearly stated the distinctions between the different questions that can be asked about the magnitude of a sensation. In particular, he noted that the question, “Is anything there?” leads to the detection problem; the question, “How much of it is there?” leads to the scaling problem; and the question, “Is this different from that?” defines the discrimination problem. We interpret our results as showing that monkeys may try to avoid true discrimination, which requires the internal comparison of stimuli presented in sequence and, whenever possible, adopt alternate strategies. This will depend on the complexity of the task and on the training history of the animals. However, in many studies it is extremely important to know what an animal is actually doing, and thus it is crucial to determine whether the task is ambiguous, i.e., whether it can be related to more than one of the above-mentioned problems: discrimination, scaling, and detection. With time, an animal may even switch to a recognition strategy. We observed that when a monkey was repeatedly tested with a particular stimulus set (changing the base frequency) for several days, he eventually memorized the whole set or developed a combination of categorization strategies that allowed him to stop discriminating. When this happened, the monkey typically performed almost perfectly on the repeated set but failed dramatically in the task when a slightly different set of frequencies was used. Thus to make sure the monkey used discrimination and not recognition, it was necessary to vary the stimulus sets continuously.
In vision, discrimination tasks often use very rich stimulus ensembles (for example, see Naya et al., 1996; Miller et al., 1996), and an ambiguity is hardly possible. But for studies of the somatosensory system that typically involve very simple stimulus sets, our findings have important implications. Tremblay et al. (1996) used two surfaces of different roughness, presented consecutively, to study texture discrimination. They proposed that the recorded activity from S1 neurons may underlie the perception of texture. However, in their paradigm the first stimulus is always the same, smooth, and the second stimulus is either smooth or rough. This task is essentially a detection problem or, at best, a scaling problem. It is thus possible that the monkeys were not analyzing the surfaces in detail, beyond what was strictly necessary to detect the rough one. In another study,Tremblay et al. (1993) investigated the responses of thalamic neurons to air puffs, using a paradigm in which a stimulus of fixed intensity was presented a variable number of times followed by a stimulus of higher intensity. The monkey either had to react after the high-intensity stimulus or to ignore the air puffs and react to a change in a visual stimulus. A comparison between the two conditions was taken as a measure of the effect of attention on the neuronal responses. They found no difference across conditions. However, the task was probably easier than intended; it is not a discrimination problem but a simpler scaling problem. As noted by Tremblay et al. (1993), attentional modulation is substantially more evident in complex discrimination tasks than in simple detection tasks (Posner et al., 1978; Whang et al., 1991). Thus, it seems that a more demanding paradigm, i.e., a true discrimination task, is required to resolve whether attention affects or not the thalamic responses. In the flutter submodality, Recanzone et al. (1992a) used a similar paradigm in which a base stimulus of constant frequency was repeated a variable number of times and was followed by a second stimulus of higher frequency. They found that animals improved their performance progressively, with a rapid initial improvement attributed to a cognitive process and a slower improvement afterward attributed to changes in the neural representations of the stimuli. They also found that performance was always better when the stimuli were applied to the trained finger, although performance tested by stimulating a different digit also improved throughout the experiment. In contrast, we found that when tested on a digit different from the trained one, monkeys required only a very small number of trials to reach their usual level of performance. One likely explanation for this discrepancy is that the paradigm used by Recanzone et al. (1992a) is a scaling problem; the frequency of the first stimulus was fixed at 20 Hz. Discrimination presumably involves complex cortical processes, such as short-term memory and a comparison mechanism, that may be relatively independent of the somatotopic location of the input signals. On the other hand, performance in a scaling task might depend more strongly on the quality of the neuronal signal representations. This is consistent with the suggestion of Recanzone et al. (1992a) that the initial improvement in performance was attributable to higher-level cognitive activity. The same group found that the responses of S1 neurons explained the discriminative capacities of monkeys in their task (Recanzone et al., 1992b). Processing of somatosensory information at the level of S1 may be enough to solve a scaling task, as they observed, but might be insufficient to solve a true discrimination task. Our interpretations are also consistent with a study in which the hand representation in S1 was lesioned in monkeys trained to categorize the speed of moving tactile stimuli (Zainos et al., 1997). After the lesion the monkeys never recovered the ability to categorize, but their ability to detect skin indentations, a much simpler task, was intact. In conclusion, the distinction between a true discrimination task that forces the animal to use higher cognitive mechanisms and simpler tasks that allow alternate strategies is subtle, and is not always obvious, but is crucial for the interpretation of neurophysiological results.
The discrimination paradigm described here eliminates the possibility of ambiguities and is well suited for neurophysiological studies. In this task the stimulus can be finely controlled; the same primary afferents are activated by the two stimuli; there is sensory and motor lateralization; and it probably involves a working memory mechanism for the analysis and comparison of time-dependent signals. It is thus an interesting model for exploring the neuronal basis of these processes.
Footnotes
The research of R. Romo was supported in part by an International Research Scholars Award from the Howard Hughes Medical Institute and grants from DGAPA-UNAM, CONACyT and Fundación Miguel Alemán AC. We appreciate the technical assistance of Antonio Zainos and Sergio Méndez.
Correspondence should be addressed to Ranulfo Romo, Instituto de Fisiología Celular, Universidad Nacional Autónoma de México, Apartado Postal 70-253, 04510 México DF, México.
REFERENCES
- 1.Chubbuck JK. Small motion biological stimulator. Appl Digest. 1966;5:1319–1341. [Google Scholar]
- 2.LaMotte RH, Mountcastle VB. The capacities of humans and monkeys to discriminate between vibratory stimuli of different frequency and amplitude: a correlation between neural events and psychological measurements. J Neurophysiol. 1975;38:539–559. doi: 10.1152/jn.1975.38.3.539. [DOI] [PubMed] [Google Scholar]
- 3.Merchant H, Zainos A, Hernández A, Salinas E, Romo R. Functional properties of primate putamen neurons during the categorization of tactile stimuli. J Neurophysiol. 1997;77:1132–1154. doi: 10.1152/jn.1997.77.3.1132. [DOI] [PubMed] [Google Scholar]
- 4.Miller EK, Erickson CA, Desimone R. Neural mechanisms of visual working memory in prefrontal cortex of the macaque. J Neurosci. 1996;16:5154–5167. doi: 10.1523/JNEUROSCI.16-16-05154.1996. [DOI] [PMC free article] [PubMed] [Google Scholar]
- 5.Mountcastle VB, Talbot WH, Sakata H, Hyvarinen J. Cortical neuronal mechanisms in flutter vibration studied in unanesthetized monkeys. J Neurophysiol. 1969;32:453–484. doi: 10.1152/jn.1969.32.3.452. [DOI] [PubMed] [Google Scholar]
- 6.Mountcastle VB, LaMotte RH, Carli G. Detection thresholds for stimuli in humans and monkeys: comparison with threshold events in mechanoreceptive afferent nerve fibers innervating the monkey hand. J Neurophysiol. 1972;35:122–135. doi: 10.1152/jn.1972.35.1.122. [DOI] [PubMed] [Google Scholar]
- 7.Mountcastle VB, Steinmetz MA, Romo R. Frequency discrimination in the sense of flutter: psychophysical measurements correlated with postcentral events in behaving monkeys. J Neurosci. 1990;10:3032–3044. doi: 10.1523/JNEUROSCI.10-09-03032.1990. [DOI] [PMC free article] [PubMed] [Google Scholar]
- 8.Mountcastle VB, Atluri PP, Romo R. Selective output-discriminative signals in the motor cortex of waking monkeys. Cereb Cortex. 1992;2:277–294. doi: 10.1093/cercor/2.4.277. [DOI] [PubMed] [Google Scholar]
- 9.Naya Y, Sakai K, Miyashita Y. Activity of primate inferotemporal neurons related to a sought target in pair-association task. Proc Natl Acad Sci USA. 1996;93:2664–2669. doi: 10.1073/pnas.93.7.2664. [DOI] [PMC free article] [PubMed] [Google Scholar]
- 10.Posner MI, Nissen MJ, Ogden WC. Attended and unattended processing modes: the role of set of spatial locations. In: Pick HL, Salzmann IJ, editors. Models of processing and perceiving information. Erlbaum; Hillsdale, NJ: 1978. pp. 288–321. [Google Scholar]
- 11.Recanzone GH, Jenkins WM, Hradek GT, Merzenich MM. Progressive improvements in discriminative abilities in adult owl monkeys performing a tactile frequency discrimination task. J Neurophysiol. 1992a;67:1015–1030. doi: 10.1152/jn.1992.67.5.1015. [DOI] [PubMed] [Google Scholar]
- 12.Recanzone GH, Merzenich MM, Schreiner CE. Changes in the distributed temporal response properties of SI cortical neurons reflect improvements in performance on a temporally based tactile discrimination task. J Neurophysiol. 1992b;67:1071–1091. doi: 10.1152/jn.1992.67.5.1071. [DOI] [PubMed] [Google Scholar]
- 13.Romo R, Ruiz S, Crespo P, Zainos A, Merchant H. Representation of tactile signals in primate supplementary motor area. J Neurophysiol. 1993;90:2690–2694. doi: 10.1152/jn.1993.70.6.2690. [DOI] [PubMed] [Google Scholar]
- 14.Romo R, Merchant H, Ruiz S, Crespo P, Zainos A. Neuronal activity of primate putamen neurons during categorical perception of somaesthetic stimuli. NeuroReport. 1995;6:1013–1017. doi: 10.1097/00001756-199505090-00016. [DOI] [PubMed] [Google Scholar]
- 15.Romo R, Merchant H, Zainos A, Hernández A. Categorical perception of somesthetic stimuli: psychophysical measurements correlated with neuronal events in primate medial premotor cortex. Cereb Cortex. 1997;7:317–326. doi: 10.1093/cercor/7.4.317. [DOI] [PubMed] [Google Scholar]
- 16.Talbot WH, Darian-Smith I, Kornhuber HH, Mountcastle VB. The sense of flutter vibration: comparison of the human capacity with response patterns of mechanoreceptive afferents from the monkey’s hand. J Neurophysiol. 1968;31:302–334. doi: 10.1152/jn.1968.31.2.301. [DOI] [PubMed] [Google Scholar]
- 17.Tremblay F, Bushnell MC, Duncan GH. Thalamic VPM nucleus in the behaving monkey. II. Responses to air-puff stimulation during discrimination and attention tasks. J Neurophysiol. 1993;69:753–763. doi: 10.1152/jn.1993.69.3.753. [DOI] [PubMed] [Google Scholar]
- 18.Tremblay F, Ageranioti-Belanger SA, Chapman CE. Cortical mechanisms underlying tactile discrimination in the monkey. I. Role of primary somatosensory cortex in passive texture discrimination. J Neurophysiol. 1996;76:3382–3403. doi: 10.1152/jn.1996.76.5.3382. [DOI] [PubMed] [Google Scholar]
- 19.Werner G. The study of sensation in physiology. In: Mountcastle VB, editor. Medical physiology, Vol I. Mosby; St. Louis: 1980. pp. 605–628. [Google Scholar]
- 20.Whang KC, Burton H, Shulman GL. Selective attention in vibrotactile tasks: detecting the presence and absence of amplitude change. Percept Psychophys. 1991;50:157–165. doi: 10.3758/bf03212216. [DOI] [PubMed] [Google Scholar]
- 21.Zainos A, Merchant H, Hernández A, Salinas E, Romo R (1997) Role of primary somatic sensory cortex in the categorization of tactile stimuli: effects of lesions. Exp Brain Res, in press. [DOI] [PubMed]


