

Abstract
Activation of the NMDA subtype of glutamate receptor is required for activity-dependent structural plasticity in many areas of the young brain. Previous work has shown that NMDA receptor currents decline approximately at the time that developmental synaptic plasticity ends, and in situ hybridization studies have suggested that receptor subunit changes may be occurring during the same developmental interval. To establish a system in which the relationship between these properties of developing synapses can be explored, we have combined patch-clamp recordings with mRNA- and protein-level biochemical analyses to study the developmental regulation of NMDA receptors in the superficial layers of the rat superior colliculus. These experiments document an abrupt decrease in the NMDA receptor contribution to synaptic currents that occurs before eye opening and is closely associated with changes in NR1 protein, rapidly rising levels of the NMDA receptor subunit NR2A, and decreasing levels of NR2B. The functional and molecular changes also are correlated with the developmental decline in structural plasticity in these layers. In addition, both physiological and biochemical methods show evidence of GABA-mediated inhibition in the superficial collicular layers beginning after eye opening. This may provide an additional heterosynaptic mechanism for controlling excitation and plasticity in this neuropil by pattern vision. Thus our findings lend support to the idea that high levels of NMDA receptor function are associated with the potential for structural rearrangement in CNS neuropil and that the functional downregulation of this molecule results, at least partially, from changes in its subunit composition.
Keywords: NMDA receptors, GABA, activity-dependent, superior colliculus, development, downregulation
The NMDA glutamate receptor subtype appears early in development (LoTurco et al., 1991; Durand et al., 1996) and is believed to be critical in structurally refining connections on the basis of activity correlations (Cline et al., 1987;Cline and Constantine-Paton, 1989; Bear et al., 1990; Hahm et al., 1991; Rabacchi et al., 1992; Simon et al., 1992; Schlaggar et al., 1993; Lewin et al., 1994; Schnupp et al., 1995). In many brain regions NMDA channel function decreases during development as synapses mature and the capacity for synaptic rearrangement declines (Fox et al., 1991;Carmignoto and Vicini, 1992; Hestrin, 1992). This concordance suggests that high NMDA receptor function may be necessary for activity to modify connections structurally.
The roles of the NMDA receptor in synaptic development presumably require Ca2+ entry through its channel (Mayer and Westbrook, 1987; Cline and Tsien, 1991; Fields et al., 1991; Yuste and Katz, 1991). As connections refine, the amount of Ca2+ that NMDA receptors admit to the postsynaptic cell probably increases. Because Ca2+ can be toxic at high concentrations (Choi, 1988; McDonald and Johnston, 1990), neurons should require mechanisms for controlling this increase. These findings suggest that the developmental decline in NMDA receptor function may be an activity-driven protective mechanism that incidentally decreases potential for structural change (for review, seeScheetz and Constantine-Paton, 1994). A similar activity-dependent developmental exchange of nicotinic cholinergic receptor subunits that may reduce postsynaptic Ca2+ entry with age has been documented at the neuromuscular junction (Schuetze and Vicini, 1984;Martinou and Merlie, 1991; Dan and Poo, 1992).
Molecular studies have described changes in NMDA receptor subunit protein and transcript expression during brain development (Monyer et al., 1994; Sheng et al., 1994; Wang et al., 1995; Zhong et al., 1995;Dunah et al., 1996; Wenzel et al., 1996). Electrophysiology has identified different functional properties of NMDA receptors composed of different subunits (Monyer et al., 1992, 1994; Williams et al., 1993). In cerebellar granule cells, changes in particular subunits have been associated with developmental changes in the properties of the natively expressed receptors (Takahashi et al., 1996), and in neocortex, single-cell PCR has correlated increased NR2A transcripts with decreased fall time of NMDA currents (Flint et al., 1997). However, no studies have investigated developmental alterations in both NMDA receptor subunit transcripts and proteins in pathways and during periods in which functional changes in synapses and structural plasticity also occur.
This study documents the developmental downregulation of NMDA receptor function and a correlated change in receptor subunit transcripts and protein. Focusing on the superficial visual layers of the rat superior colliculus, we show that this functional change in NMDA receptors is unexpectedly abrupt and occurs several days before eye-opening and the onset of pattern vision. The downregulation is associated temporally with the completion of map refinement and loss of plasticity in this neuropil. We also show that increases in GABAergic inhibition, which could downregulate NMDA receptor function heterosynaptically, occur relatively later, several days after pattern vision begins.
MATERIALS AND METHODS
Animals. Timed pregnant Sprague Dawley female rats were purchased from Camm Research Institute (Wayne, NJ), and their litters were used for all experiments in this paper. The day of birth was counted as postnatal day 0 (P0).
Electrophysiology. For electrophysiology, pups aged P8–P20 were anesthetized with ether and decapitated. A block of tissue containing the superior colliculus was dissected rapidly and placed in ice-cold artificial cerebral spinal fluid (ACSF) containing (in mm): 117 NaCl, 3 MgCl2, 4 KCl, 3 CaCl2, 1.2 NaHPO4, 26 NaHCO3, and 16 glucose, saturated with 95% O2/5% CO2 to a final pH of 7.4. Parasagittal slices of the superior colliculus were cut on a Vibratome (Pelco, Redding, CA) at 400 μm thickness and then placed in a recording chamber under a piece of nylon mesh for stability during recording. The slices were maintained at room temperature (22–24°C) and perfused with the same bath solution at 4 ml/min. Recording began 2 hr later, to allow slices to recover from anesthesia and cutting.
Patch electrodes were pulled from borosilicate glass (World Precision Instruments, Sarasota, FL) on a horizontal pipette puller (Model P-87, Sutter Instrument, Novato, CA) to a tip resistance of 5–10 MΩ. Electrodes were filled with a cesium-based solution that contained (in mm): 122.5 Cs-gluconate, 17.5 CsCl, 10 HEPES (CsOH), 0.2 Na-EGTA, 2 Mg-ATP, 0.3 Na-GTP, and 8 NaCl with 0.2% biocytin at pH 7.3. Amplifier and electrode offsets were zeroed with the electrode in the bath solution before a patch was obtained. The liquid junction potential between the electrode solution and the bath was measured in several experiments (Barry and Lynch, 1991) and varied between 9 and 12 mV. To compensate for this, we added an estimated offset of 10 mV to all reported voltages.
Whole-cell recordings were made from neurons in the stratum griseum superficiale of the superior colliculus, using the “blind” technique of Blanton and colleagues (1989). All cells studied in this report had seal resistances of 2–2.5 GΩ. Series resistance was <21 MΩ (mean ± SD = 17 ± 2 MΩ), and recordings were terminated if this changed during an experiment. The response signals were recorded with an Axoclamp ID patch-clamp amplifier. They were filtered at 5 kHz and interfaced (CED 1401 Plus, Cambridge Electronic Design, Cambridge, England) with a Pentium-based computer (Gateway 2000, North Sioux City, SD) that stored the data and provided on-line display of responses and off-line data analysis. CED patch and voltage-clamp software was used to acquire and analyze the data. Customized routines for averaging postsynaptic currents using MATLAB were written by J. Shi.
For analyses of evoked events, bipolar stimulation was applied to the deep stratum griseum superficiale (SGS) and stratum opticum with a pair of insulated tungsten microelectrodes (100 KΩ; World Precision Instruments, Sarasota, FL) glued side by side to a tip separation of 40 μm. Stimuli were 0.5 msec currents delivered at low frequency (0.2 Hz). Stimulus intensity was set just above the threshold response of the neuron, between 60–100 μA (usually ∼80 μA). For a collection of responses to be analyzed quantitatively, the cells were held near their resting potentials (−60 mV) while the slice was bathed in Mg2+-free ACSF. At least 13 evoked EPSCs (eEPSCs) were averaged for each neuron, first in the bath solution and then in the solution containing the NMDA receptor antagonist 2-amino-5-phosphonovalerate (AP5). Data were discarded if evoked responses obtained after the washout of AP5 were not within 20% of the initial baseline value. Stimulation, particularly in the younger slices, tended to suppress spontaneous activity for ∼5–10 min. Consequently, evoked responses usually were analyzed either in slices from which no spontaneous data were taken or in slices that remained in good condition after analyses of spontaneous events were complete. Less frequently, intervals of spontaneous events were recorded after studying evoked responses but only after the slice was allowed at least 10 min to recover.
Frequencies of spontaneous EPSCs (sEPSCs) were obtained by randomly selecting intervals of at least 70 sec from the stored data for each neuron and counting the number of sEPSCs that occurred in that interval. Cells held in Mg2+-free ACSF, particularly when exposed to bicuculline, showed occasional slower and larger currents, which appeared to be summating sEPSCs from a barrage of synchronized activity. If individual sEPSCs could be detected clearly in these volleys, they also were counted. However, if individual sEPSCs could not be detected, the entire interval was eliminated from analysis, and, if necessary, longer recording intervals were analyzed. The number of events falling in these intervals was counted to determine the average sEPSC frequency for that cell. For quantitative analyses of spontaneous current amplitudes and kinetics, averages of the spontaneous currents for each neuron were obtained in Mg2+-free ACSF with and without AP5. Each average incorporated 30–40 continuously recorded events. All single events with relatively rapid rise times (<12 msec) were used, providing they had amplitudes at least three times the baseline. Recordings from cells that failed to maintain stable baselines or that failed to recover from drug treatments with synaptic currents to within 20% of the control recordings were discarded.
The NMDA receptor contribution to all currents was estimated as the difference current obtained by digitally subtracting the average obtained in the presence of AP5 from the average for that same neuron obtained in the absence of AP5. Kinetics of averaged events and difference currents were examined with a double- or single-exponential least-squares fit. Curves fit by only a single exponential were rare: for most neurons all averages with and without AP5 and the difference current could be fit with double exponentials, using the criterion that the amplitude of the second component was ≥2% of the total amplitude. The contribution of the NMDA receptor current could be demonstrated by the addition of AP5 as the expected decrease in decay times and smaller relative amplitude of the slow component (see Table1). However, to obtain a single standard measure of decay for the purposes of comparison across all averages and all neurons, we measured the fall time τ of total current averages and difference currents with the single-exponential τ estimator as the time from peak to 0.37 peak amplitude.
Table 1.
Current averages for eEPSCs
| Neuron | Curve fitting | τ1 (msec) | R.A. (100%) | τ2 (msec) | R.A. (100%) |
|---|---|---|---|---|---|
| P8 | 0 Mg | 74.3 | 0.506 | 447.4 | 0.494 |
| AP5 | 12.4 | 0.642 | 286.1 | 0.358 | |
| Diff. C. | 95.6 | 0.513 | 516.6 | 0.487 | |
| P16 | 0 Mg | 45.9 | 0.531 | 233.1 | 0.469 |
| AP5 | 15.9 | 0.780 | 241.7 | 0.220 | |
| Diff. C | 93.5 | 0.593 | 255.4 | 0.407 |
Current averages for eEPSCs are best fit by double exponentials, using the criterion that the amplitude of the second component was ≥2% of the total amplitude. Averages are for the recordings shown in Figure 1a. R.A., Relative amplitude; Diff. C., difference current, eNMDA (see Materials and Methods).
Drug solutions were bath-applied, as indicated below, at the following concentrations: 1 μm GABAA receptor antagonist bicuculline methiodide (Sigma, St. Louis, MO), 50 μm NMDA receptor antagonist AP5 [Research Biochemicals (RBI), Natick, MA], and 10 μm non-NMDA glutamate receptor antagonist 6-cyano-7-nitroquinoxaline-2,3-dione (CNQX) (RBI). A complete solution change was accomplished approximately once per minute. After all drug applications or changes in Mg2+ concentration, we allowed at least 20–30 min of washout before new recordings were made. However, with CNQX, even after 45 min of washout, the recording frequently had not returned to baseline conditions.
The location and morphology of recorded cells were evaluated by intracellular staining with biocytin in 16 experiments from slices spanning the P8–P20 interval. In those experiments slices were fixed in 4% formalin overnight, cut at 90 μm on dry ice with a sliding microtome, post-fixed in 4% formalin, and stained with Texas Red-conjugated streptavidin (Jackson ImmunoResearch, West Grove, PA). All cells (n = 25) were localized within the superficial collicular layers. They represented at least four morphological classes (narrow- and wide-field vertical cells, stellate cells, and piriform cells) identified in the rat SGS (Langer and Lund, 1974). All cells had elaborated dendritic trees, even in the youngest slices (P8) examined. A more complete analysis of these cells will appear as part of a subsequent report.
Molecular analyses. Pups between P0 and P27 were used in these studies. Adult tissue was obtained from the mothers. For all biochemical experiments rats were killed by exposure to carbon dioxide, followed by cervical dislocation, and the superficial layers of the superior colliculus were dissected out rapidly. Tissue used for RNA isolation was frozen immediately in liquid nitrogen and stored at −80°C until needed. Tissue subsequently was homogenized directly from the freezer in 25 vol of buffer (4 m guanidinium, 17 mmN-lauroylsarcosine, 100 mm Tris, 5 mm Na citrate, and 100 mm 2-mercaptoethanol). An equal volume of acid phenol, pH 4.5, and one-fifth vol of chloroform:isoamylalcohol (24:1) were added and mixed thoroughly. The mixture was left on ice for 20 min and then centrifuged for 20 min at 16,000 × g at 4°C. The aqueous layer was removed and ethanol-precipitated, washed with 75% ethanol, dried, and redissolved in 400 μl of TE (10 mm Tris and 1 mm EDTA) and 100 μl of 3 m Na-acetate. This solution was extracted with acid phenol a second time and ethanol-precipitated as before. The RNA was redissolved in TE and frozen in 10 μg aliquots at −80°C.
A ribonuclease protection assay (RPA) was used to measure RNA levels of three NMDA receptor subunits (NR1, NR2A, and NR2B) in a single sample, along with a probe for 28S transfer RNA (115 base pairs; Ambion, Austin, TX) as a loading control. The NR1 probe protects a 180 base pair fragment between positions 421 and 600 (Moriyoshi et al., 1991). The NR2A probe protects a 369 base pair fragment from 2993 to 3362 (Ishii et al., 1993). The NR2B probe protects a 262 base pair fragment from 4019 to 4280 (Monyer et al., 1992). All probes were synthesized byin vitro transcription with [32P]uridine 5′-triphosphate. The specific activity of the NR1 probe was 16-fold lower than that of the NR2 subunit probes to equalize exposure times. The protection assay was run with the RPA II kit (Ambion), using 10 μg of total RNA, 20,000 cpm of each NMDA receptor subunit probe, 1000 cpm of 28S probe, and 1 μg of cold 28S probe. All probes were determined to be in at least fourfold molar excess over the sample RNA. In each run, separate control lanes for each probe with 10 μg of yeast RNA gave no signal. Gels were dried and exposed to x-ray film at −80°C for 4–8 d. Each film contained lanes for each age, and densitometric values from each film were normalized to the value for the adult lane to facilitate comparison across films with different exposures.
Immunoblotting. For protein extraction, tissue was homogenized immediately in 20 vol of buffer (10 mmphosphate buffer, pH 7.0, 5 mm EGTA, 5 mm EDTA, 1 mm DTT, and COMPLETE protease inhibitor; Boehringer Mannheim, Indianapolis, IN) and then either fractionated or frozen in liquid nitrogen and stored at −80°C until needed. Homogenates were fractionated by using a modification of the Yip and Kelly (1989)procedure. Rapidly thawed homogenate was centrifuged for 10 min at 4°C at 16,000 × g, and the supernatant (crude soluble fraction) was collected and placed on ice. The pellet was resuspended in one-fourth vol of 2 mm HEPES, pH 7.2, and centrifuged for 10 min at 4°C at 11,000 × g. The supernatant was discarded, and the pellet was resuspended in 0.5 mm HEPES, pH 7.3, containing 0.32 m sucrose and centrifuged for 8 min at 450 × g. The supernatant from this spin (crude particulate fraction) and the crude soluble fraction were placed in Laemmli buffer, heated to 90°C for 5 min, and then frozen in aliquots at −80°C.
Immunoblotting of proteins was performed with primary antibodies to NMDA receptor subunits (NR1, 0.5 μg/ml; NR2A 1:400; NR2B 1:600; Chemicon, Temecula, CA), the 65 kDa isoform of glutamic acid decarboxylase (GAD65, 1:2000; Boehringer Mannheim), and the two GABA transporters found exclusively in the brain (GAT-1, 1:200; GAT-3, 1:1000; Chemicon) (Ikegaki et al., 1994). Two additional antibodies to NR1 [Tingley et al. (1993); combined N- and C-terminal antibodies @ 1:400, courtesy of Richard Huganir (Johns Hopkins Medical School, Howard Hughes Medical Institute, Baltimore, MD); Siegel et al. (1994); 54.1 @ 1:4000, courtesy of Reinhardt Jahn (Yale University School of Medicine, Howard Hughes Medical Institute, New Haven, CT)] were used to substantiate the original findings with the Chemicon reagent. Proteins were run on 6 or 8% polyacrylamide minigels at 5 or 10 μg per lane and then transferred to nitrocellulose by electroblotting (Idea Scientific, Minneapolis, MN). Total protein was visualized with Ponceau stain. Blots were blocked with 1% dried milk in 0.1% Tween/0.1 m PBS (TPBS) for 30 min and then incubated in primary antibody in TPBS for 1 hr at room temperature. After four 10 min rinses in milk–TPBS, blots were incubated in secondary antibody (horseradish peroxidase-conjugated goat anti-rabbit, 1:12,000 or goat anti-mouse, 1:2000 in milk–TPBS). Blots were washed six times for 5 min in TPBS, reacted with chemiluminescent substrate (Pierce, Rockford, IL), and exposed to film (Kodak, Rochester, NY).
Band density on the autoradiographs was measured by densitometry with National Institutes of Health Image 1.57 and its gel-plotting macros. Pixel intensities were calibrated to optical densities with a density wedge. Measurements were confirmed to be within the linear range of the film by analysis of a dilution series processed with the samples. All data are reported as mean ± SE of band optical densities.
RESULTS
NMDA receptor changes
Electrophysiology
All cells analyzed for this study had resting potentials between −60 and −50 mV and input resistances between 331 and 904 MΩ (mean = 617 ± 208 MΩ). There was no consistent change in either of these properties across the P8–P20 age range examined. In initial studies EPSCs were examined after a wide range of stimulus intensities and frequencies. In most young neurons (younger than ∼P14) high-stimulation intensities produced a response that clearly was not limited to monosynaptic inputs and that decremented even after interstimulus intervals of several minutes. Consequently, most analyses and all quantification used low-frequency stimulation at the lowest intensity that evoked a reproducible response. This focus on minimal excitatory potentials evoked at low frequencies (minimal eEPSCs) reduced but did not always eliminate a slight amplitude decrement with time.
In accord with previous findings (Hestrin, 1992), EPSCs recorded in response to stimulation of the stratum opticum appeared to be glutamatergic: CNQX significantly reduced peak amplitude and rise time of the eEPSC but had relatively little effect on decay, whereas AP5 applied to neurons at relatively polarized potentials (20–40 mV) consistently decreased fall times. The reversal potentials for these currents were ∼0 mV.
In initial quantitative studies neurons were clamped at 40 mV, and CNQX was applied to study the remaining slow component attributable to NMDA receptor activation. In many cases, particularly in younger slices studied at these potentials, it was impossible to maintain responses within 20% of initial amplitude during prolonged recording. Consequently, to obtain a relatively large, minimally biased sampling of the levels of activity and of the NMDA receptor currents present under normal physiological conditions in this neuropil, we adopted an alternative approach. After levels of spontaneous activity were assayed in normal ACSF, most data were taken near resting potential (−60 mV) in 0 Mg2+ ACSF. Under these conditions, as expected, all cells were sensitive to both CNQX and AP5 at all holding potentials, and combined application of CNQX and AP5 abolished the events.
Effects of AP5 application on these minimal eEPSCs were studied quantitatively in 35 neurons taken from slices spanning the P8–P20 interval. AP5 reduced the peak amplitudes of the averages by varied amounts and produced prominent decrements in the decay time, particularly evident in neurons from younger slices. Examples of the minimal eEPSC averages and difference (or NMDA receptor) currents (average eEPSCw/o AP5 − average eEPSCw AP5 = eNMDA) obtained in these recordings are shown in Figure1a. Table 1 shows the relative amplitudes and τ values for the same average currents obtained from the double-exponential least-squares fit. However, for the comparisons that follow (see Materials and Methods), rise time (R.T.) for the total and NMDA currents was measured as the time from baseline to 90% peak amplitude, and decay (τ) was estimated as time to 0.37 of peak amplitude. Peak amplitudes of total current averages varied between −456 and −28 pA (mean = −112 ± 94 pA) but showed no consistent change with age. Peak amplitudes of the difference currents representing the eNMDA current varied from −166 pA to −12 pA and also revealed no consistent change with age. In contrast, τ for eNMDA showed a pronounced drop over this interval (Fig. 1b). Rise times, which should be more sensitive than the slower decays to changes in capacitance (Spruston et al., 1993) do not show this effect, indicating that the decay change is not an artifact of alterations in dendritic filtering with age.
Fig. 1.
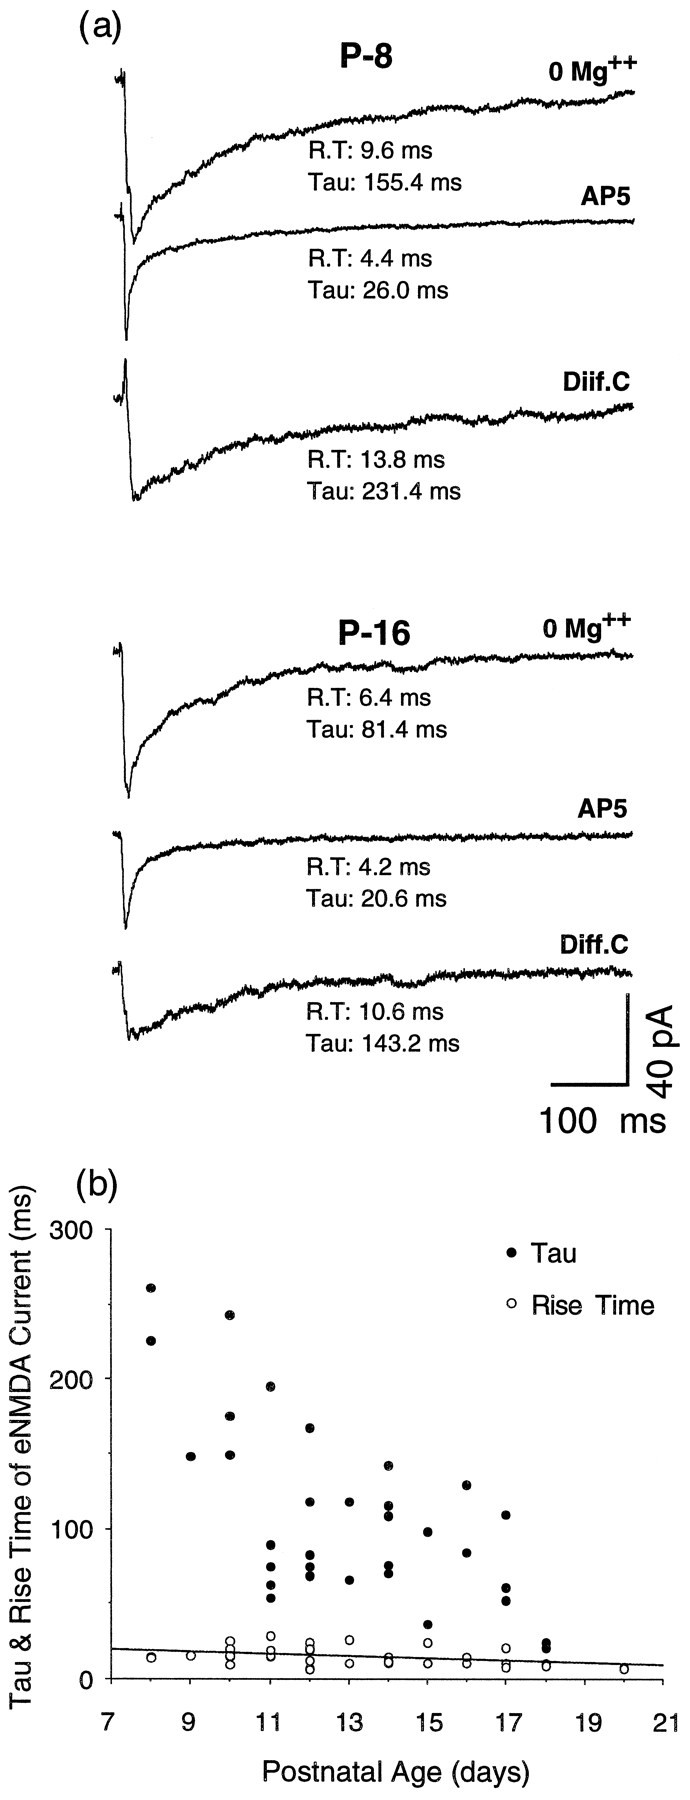
Analyses of evoked currents. a, Averaged evoked currents and difference currents from aP8 and a P16 neuron. Currents were evoked by minimal stimulation of the stratum opticum with the slice maintained in 0 Mg2+ ACSF and the cells held at −60 mV. Each average incorporates at least 13 evoked currents. The difference current (Diff. C) was obtained by digitally subtracting the current average in 0 Mg2+ ACSF with AP5 from the current average in 0 Mg2+ ACSF. It represents the current attributable to NMDA receptor activation or eNMDA. R.T., Rise time as measured from the baseline to 90% of peak amplitude. τ values (Tau) are for the single-exponential least-squares fit (see Materials and Methods and Table 1). b, Scatterplot of τ (•) and rise times (○) of eNMDA obtained as described ina and in Materials and Methods. The regression line for rise time against age is shown, but the correlation coefficient for this line is low (r2 = 0.15); n = 34 neurons.
Evoked responses provide information about changes in synapses derived mainly from the collicular inputs (optic tract and cortex; Langer and Lund, 1974), but they do not sample other synapses in the neuropil effectively. In addition, inferences from the kinetics of these responses are complicated because of possible contributions from polysynaptic inputs and because, particularly in poorly myelinated young axons, a volley in the afferent pathway does not necessarily arrive at all synapses synchronously. Consequently, to obtain a more representative estimate of changes in neurotransmitter function at synapses in the superficial layers of the superior colliculus, we focused the rest of this analysis on the fast sEPSCs that are numerous and of relatively large amplitude in the young collicular neurons. Based on the following criteria, these events appear to be glutamatergic. In pilot studies CNQX application to all cells held at 20 or 40 mV reduced the peak amplitude but not the duration of these events. In all cells studied, these currents were decreased in duration by AP5. Their frequency was not reduced on application of bicuculline to the ACSF (see Fig. 8). As with the eEPSC analysis, all recordings analyzed quantitatively were from neurons clamped at −60 mV.
Fig. 8.
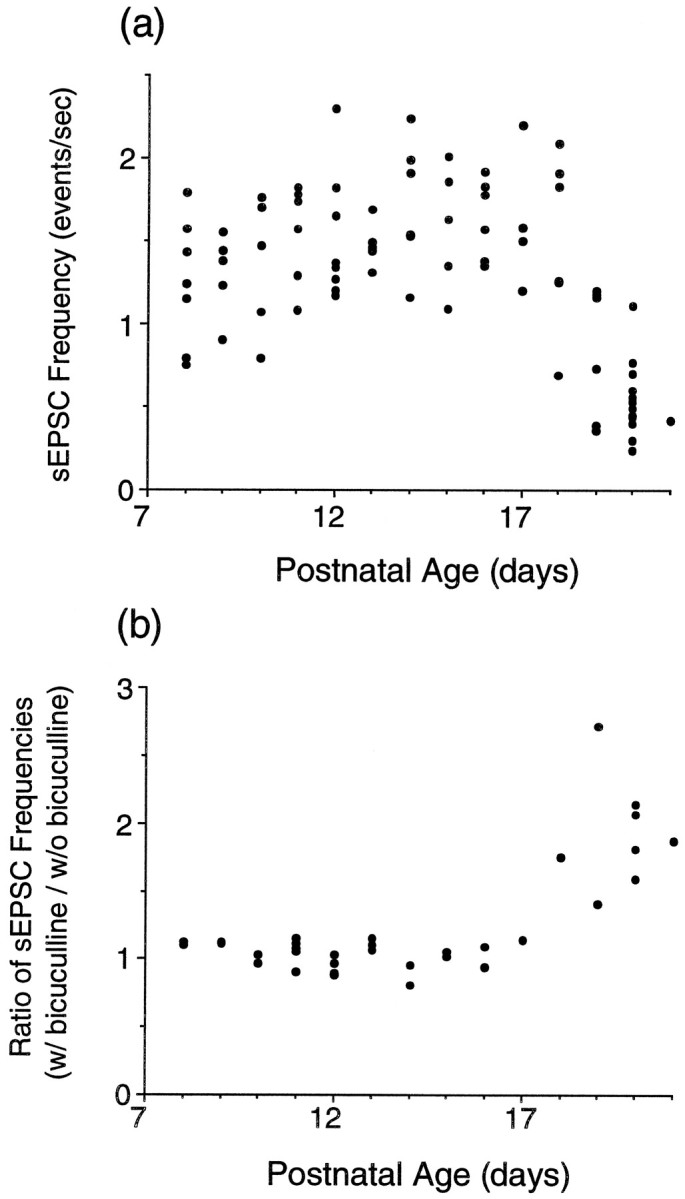
Spontaneous excitatory current (sEPSC) frequencies plotted against the age of the slice. a, sEPSC frequencies recorded in 2 mm Mg2+ with neurons clamped at −60 mV. b, The effect of bicuculline methiodide on sEPSC frequency in cells held at −60 mV in 0 Mg2+ ACSF.
The NMDA receptor contribution to the sEPSCs was measured quantitatively by maintaining slices in Mg2+-free ACSF and applying the averaging procedure (described in Materials and Methods) to determine average sEPSC current with and without AP5 and average sNMDA (sEPSCw/o AP5 − average sEPSCw AP5 = sNMDA). In P10 or younger colliculi, the sEPSCs recorded in the presence of AP5 showed a marked reduction in duration, as compared with the sEPSCs of the same neurons in the absence of AP5. As shown by the representative traces in Figure2, this qualitatively obvious difference in spontaneous events recorded in the presence and absence of AP5 was absent in neurons from older slices, indicating a decreased contribution of NMDA receptors to these currents with age.
Fig. 2.

Examples of sEPSCs recorded in 0 Mg2+ with and without AP5 from a P8neuron and a P15 neuron. AP5 application has a more pronounced effect on the fall time of the events in the younger slice.
The NMDA receptor component of sEPSCs was studied in 75 neurons. Figure3 illustrates representative average sEPSCs recorded from four neurons in slices from P8–P20 pups. As in the eEPSC analysis, for purposes of comparison the fall time τ is estimated as the time to 0.37 of peak amplitude. For the sEPSC currents, however, current onset was measured as the time from baseline to current peak (Tp).
Fig. 3.

Averaged spontaneous currents and difference currents (sNMDA) from P8, P12,P19, and P20 neurons. Each average incorporates 30–60 spontaneous events selected according to strict criteria and averaged by custom-written software that aligned onsets (see Materials and Methods). Difference currents (Diff. C.) were obtained as in Figure 1.Tp, Time to peak, measured as the time from baseline to the peak current. τ values (Tau) are for the single-exponential least-squares fit.
The peak amplitudes of the sNMDA current did not change significantly with age (Fig. 4a; range from −69 to −2 pA; mean = 15 ± 13 pA), although there was a tendency to obtain large peak amplitudes for the average sEPSCw/oAP5 (Fig. 4b; range from −113 to −8 pA; mean = −41 ± 26 pA) in older slices (Fig.4c).
Fig. 4.
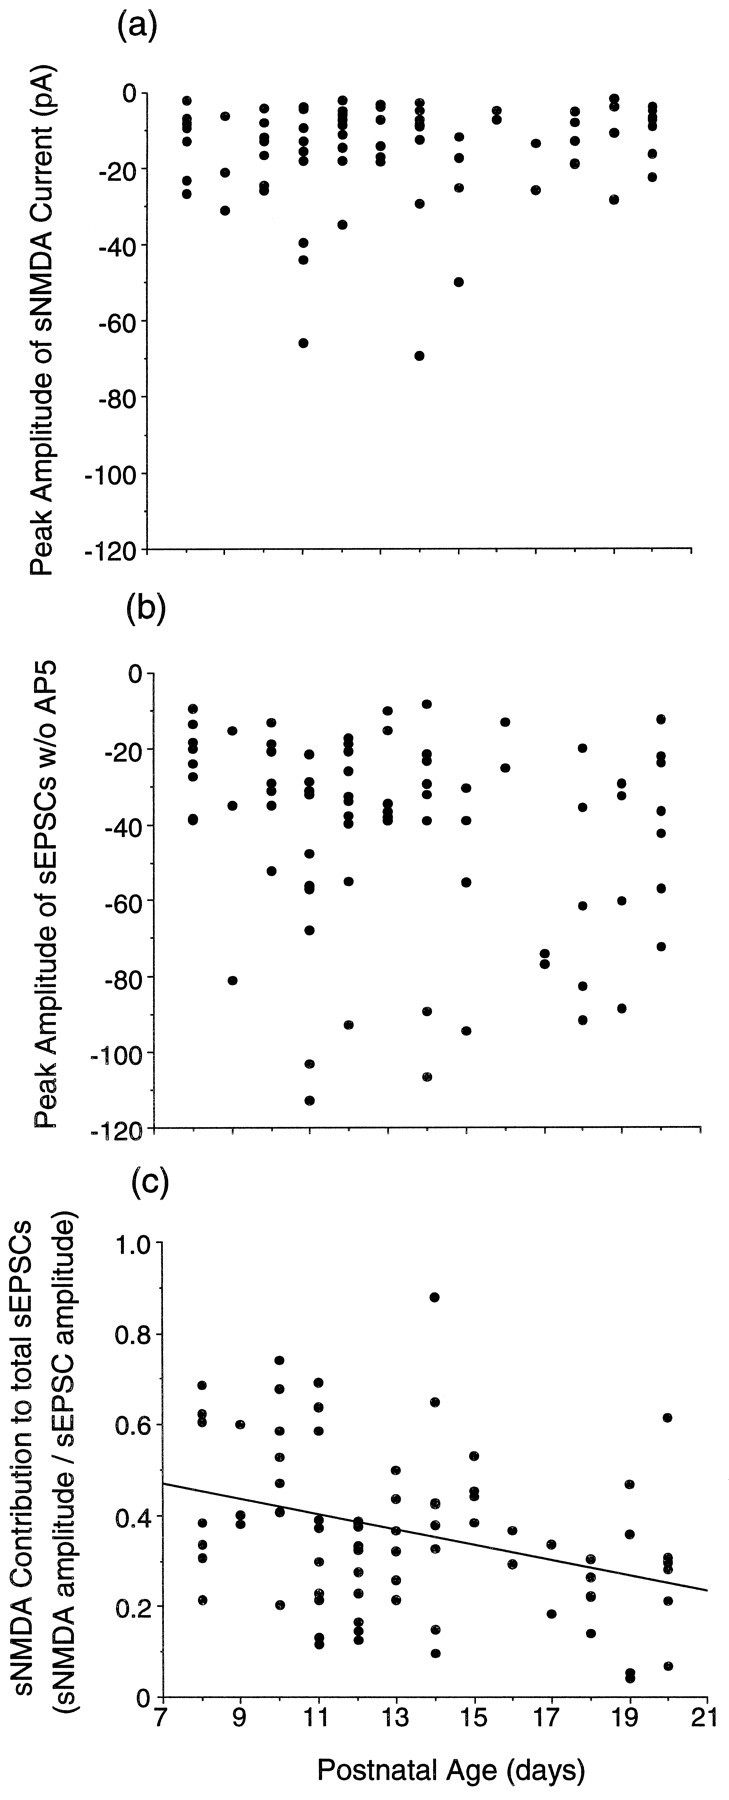
Peak amplitude of sNMDA (sEPSCsw/o AP5− sEPSCsw AP5) does not change across the P8–P12 interval. The peak amplitude of the total current shows a slight increase with age. a, Peak amplitude of average sNMDA against the age of the slice. b, Peak amplitude of total average current (total sEPSC; sEPSCsw/o AP5) against the age of the slice. c, The ratio of sNMDA peak amplitude relative to total sEPSC plotted against the age of the slice. Theregression line for sNMDA/sEPSCsw/o AP5against age is shown. The correlation is poor (r2 = 0.12); n= 75 neurons.
Developmental changes in the kinetics of the sNMDA current are shown in the scatterplot of Figure 5a. In contrast to the relatively constant amplitude of sNMDA over the P8–P20 interval, the decay of sNMDA drops abruptly between P10 and P11. Figure 5b shows this change plotted as the mean and SD of τ sNMDA in neurons recorded from slices of the same age. Figure5c shows the mean and SD of the time to peak for sNMDA of the same averages. Values of τ from neurons between P8 and P10 and from neurons between P11 and P20 were found to be significantly different (p < 0.01, Student’s ttest for different sizes of populations). No significant difference was found for the times to peak in the same two populations. Thus, as in the eEPSC analyses, there is no evidence that the pronounced differences in decay are attributable to changes in the dendritic filtering properties of the neurons.
Fig. 5.

Analyses of sNMDA kinetics.a, Scatterplot of τ and time to peak of sNMDA. Theregression line for time to peak versus age is shown, but the correlation coefficient is low (r2 = 0.10). b, The mean and SD of τ sNMDA for data shown in a when neurons are grouped by the postnatal day of recording. Fall times of sNMDA drop significantly at P11. The neurons in the P8–P10 group have τ values that are significantly different from the neurons in the P11–P20 group at the p < 0.01 level.c, Mean and SD of the time to peak of the same neurons. There is no difference in time to peak between the P8–P10 group and the P11–P20 group of neurons; n = 75 neurons.
NMDA receptor transcript and protein analysis
RNase protection assays were used to assay quantitatively the changes in the levels of NMDA receptor subunit transcripts NR1, NR2B, and NR2A. Quantitative Western blotting of protein from colliculi of the same age that used antibodies specific for NR1, NR2B, and NR2A were used to measure levels of the corresponding proteins. Time points were chosen for ease of comparison with previous anatomical (Simon et al., 1992), molecular (Hofer et al., 1994), and biochemical (Scheetz et al., 1996) results in this same neuropil. To assure accurate comparisons with the previous studies and the current physiological assays of synaptic function, we took great care to dissect out only the superficial visual layers of the superior colliculus for these analyses.
The time course for NR1 protein levels differed from the levels of expression of the corresponding transcript. The NR1 mRNA is low at P0 and P6, increases from P6 to P19, and then declines slightly into adulthood (Fig. 6a,b). This time course is similar to that seen previously with quantitative Northern blotting (Hofer et al., 1994). Nevertheless, NR1 protein levels are highest in the first postnatal week and decline thereafter to a low adult level (Fig. 6e,f). This discrepancy is not attributable to a peculiarity of the antibody used in the Western blot analysis or simply to changing splice variants (Zukin and Bennett, 1995); multiple anti-NR1 antibodies recognizing different epitopes showed a decrease in NR1 protein during the interval when the transcript analysis would predict a rise in protein levels (Fig.7).
Fig. 6.

Time course of NMDA receptor subunit mRNA and protein development in the superficial layers of the superior colliculus. The left side of the figure shows a typical RNase protection assay gel (a) and averaged optical density measurements for the NMDA receptor subunit mRNAs NR1 (b), NR2A (c), and NR2B (d). Each transcript has been normalized to the adult level to facilitate comparison between films (n = 5). The right side of the figure shows a typical immunoblotting protein time course (e) and averaged optical density measurements for the NMDA receptor subunit proteins NR1 (f), NR2A (g), and NR2B (h) (n = 8 blots for each). In e, the Western blots for NR1 and NR2A were run on the same blot after it was cut between the two bands, suggesting that the developmental changes are not an artifact of protein loading. Note that the absolute optical densities for different subunits are not comparable because of the different affinities of the antibodies and film exposure times.
Fig. 7.

Immunoblotting time course with three different antibodies against NR1 protein: Chemicon (top;n = 8), Jahn (middle;n = 8), and Huganir (bottom,n = 2). The decline of protein levels with age is not an artifact associated with a particular epitope. In all cases the adult protein levels are significantly lower than than protein levels in the first week of life.
Protein and transcript levels were matched more closely for the NR2 subunits examined. The NR2A subunit showed developmental changes that were more abrupt than those seen for either NR1 or NR2B, particularly at the protein level (Fig. 6e,g). Transcript levels for NR2A were barely discernible at P6 and P0, rose almost fourfold between P6 and P12, and continued to rise steeply to P19 and then showed a second large increase between P27 and adulthood. Protein levels followed the early rises quite closely but showed a slight decrease between P27 and the adult (Fig.6e,g). The NR2B subunit mRNA (Fig.6a,d) and protein (Fig. 6e,h) both declined with age, with a similar time course. Absolute levels of NR1 transcript at their peak (P19) were 35 times higher than peak NR2B subunit transcript levels at their peak (P0), and absolute levels of transcript for NR2A at its peak (adulthood) were approximately fourfold lower than peak levels of NR2B. The considerably lower level of NR2A could explain the relatively larger SE in the NR2A mRNA measurements.
In situ hybridization studies indicate that the most recently cloned NR2 subunit, NR2D, also is expressed in the superior colliculus. Pilot studies with a probe for NR2D indicated that this subunit was present at levels at least an order of magnitude lower than the other two NR2 subunits in the superficial collicular layers, even from P6–P12 when previous studies suggest it might be maximal (Wenzel et al., 1996). This made accurate quantification of its transcript difficult. Protein levels for NR2D could not be quantified because an appropriate antibody was not yet available.
Thus our data indicate that the NMDA receptors in the visual layers of the superior colliculus are composed predominantly of NR1 and NR2B subunits during the first postnatal week and of NR1 and NR2A subunits after P19. Most significantly, however, between P8 and P12 when the most dramatic functional changes in NMDA receptor current are taking place, the molecular composition of the receptor is changing also.
Development of GABAergic neurotransmission
Analysis of the frequency of sEPSCs in Mg2+-containing ACSF across the P8–P12 interval revealed a drop in frequency at P18 (Fig.8a). This observation suggested that inhibition became significantly more pronounced in this neuropil in the third postnatal week. To explore this possibility, we added bicuculline methiodide after the last washout of AP5 for a final interval of spontaneous recording in 0 Mg2+. Under these conditions neurons from older slices showed a marked increase in the frequency of spontaneous events, whereas the frequency of single spontaneous events in younger neurons was unchanged. These data are plotted in Figure 8b as the ratio of the frequency of spontaneous events with bicuculline to the frequency in the same neuron without bicuculline. The data suggest an abrupt increase in bicuculline-sensitive inhibition at P18.
Inhibition can play a powerful role in clamping dendritic membrane at potentials that will maintain the Mg2+ block on the NMDA receptor channel. Consequently, to better comprehend the regulation of this receptor, we believed it was important to document the time course of the changes in the GABA system at the same time points used to assay levels of NMDA receptor subunit expression. We concentrated these analyses on indices characteristic of GABA neurotransmission by using quantitative Western blotting for the 65 kDa isoform of GAD, which is the form found in synapses (Kaufman et al., 1991), and for two transporter proteins (GAT-1 and GAT-3) responsible for the high-affinity uptake of GABA.
As shown in Figure 9, none of the GABAergic proteins examined could be detected at P0. GAD was seen first at P12 and increased until P27 (Fig. 9a). Of the GABA transporter proteins, GAT-1 appeared at P6, increased rapidly at P19, and then declined slightly into adulthood (Fig. 9b), whereas GAT-3 appeared at P19 and reached adult levels at P27 (Fig.9c).
Fig. 9.
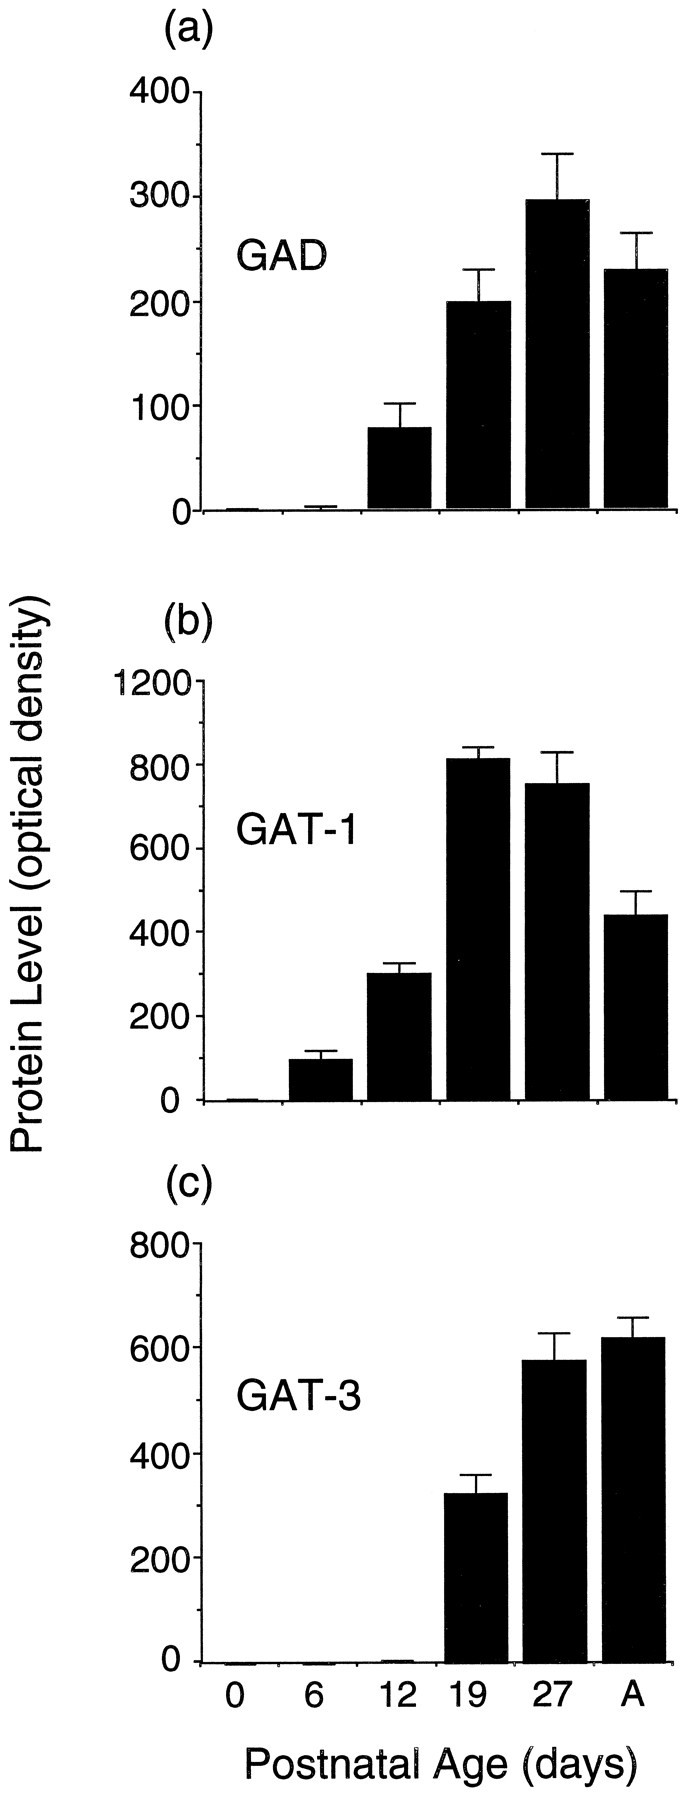
Immunoblotting time course of protein isolated from the superficial layers of the superior colliculus for proteins involved in GABAergic neurotransmission: the synthetic enzyme GAD (top; n = 11) and the GABA transporters GAT-1 (middle; n = 6) and GAT-3 (bottom; n = 6).
DISCUSSION
Functional and molecular synaptic changes
This study documents a pronounced developmental downregulation of the NMDA receptor contribution to synaptic currents in the superficial layers of the superior colliculus because of an abrupt decrease in the fall time of NMDA receptor currents (Figs. 2, 5). These changes, occurring between P10 and P11, coincide with retinocollicular projection refinement, which is complete by P11–P12 (Simon and O’Leary, 1992) and requires functional NMDA receptors (Simon et al., 1992).
Pronounced changes in NMDA receptor subunit expression also occur approximately at this time. Consistent with our previous Northern analysis (Hofer et al., 1994), the current protection analysis documents a rapid rise in NR1 subunit transcripts between P6 and P12. NR1 is the subunit common to all NMDA receptors, so this increase could reflect requirements for more NMDA receptors, as might be expected during intense neuropil expansion (Warton and McCart, 1989). Nevertheless, NR1 protein levels begin to decrease during the same interval, suggesting that more than simple receptor addition is occurring. NR1 translation rates may slow at this time. However, considering that the effects of slowing translation probably would be masked by rising transcript levels, a more likely possibility is that NMDA receptors are more stable in the fetus and neonate than during map refinement in the juvenile animal. Elimination of receptors, both extrajunctional (Burden, 1977) and junctional (Balice-Gordon et al., 1993), occurs in muscle during synaptic competition. Although superficial superior colliculus synapse density does not show a net decrease until the second postnatal month (Warton and McCart, 1989), NR1 protein decreases during map refinement could be comparable to cholinergic receptor decreases during synapse elimination at the neuromuscular junction, specifically removal of many receptors at nonsynaptic sites while receptors are inserted at effective synapses.
Simultaneous with NR1 protein changes is a shift in the prominence of NR2A subunits relative to NR2B subunits. Native NMDA receptors require both NR1 and NR2 subunits to produce the large conductances characteristically measured in neurons (Kutsuwada et al., 1992; Meguro et al., 1992; Sheng et al., 1994; Luo et al., 1997). Transfection of heterologous cells demonstrates that receptors composed of NR1 and NR2B subunits have longer open times than NR1/NR2A receptors (Monyer et al., 1992, 1994). Recently, single-cell PCR in somatosensory cortex has indicated that decreases in receptor fall time are associated tightly with increases in mRNA for NR2A (Flint et al., 1997). Our study provides evidence for a similar correlation between NR2A transcript increase and fall time decrease in the superior colliculus. We add the findings that NMDA receptor proteins also are changing significantly at this time and confirm, in a large population of cells, that the functional and molecular changes occur in close correlation. However, there are some caveats to the idea that the NR2A subunit is solely responsible for observed functional changes. Our earlier Northern blot analysis (Hofer et al., 1994) showed that the expression of NR1 splice variants shifts at this time toward a predominance of shorter species lacking C-terminal sequences that, in heteromeric NR1/NR2 receptors, facilitate current potentiation by PKC activators (Zukin and Bennett, 1995). Also, we do not yet know what is happening to NR2D. Although likely to be present at lower levels than either NR2A or NR2B, the NR2D subunit has its greatest expression in perinatal tissue and greatly increases channel open time when expressed with NR1 in heterologous cells (Monyer et al., 1994). Moreover, NR2D protein is higher in the superior colliculus than in cortex, and its levels have been reported to peak at P10 and then decline (Dunah et al., 1996).
The vast majority of GABAergic inhibition in the superficial superior colliculus is intrinsic (Mize, 1992), and the present analyses suggest that inhibition might develop relatively late. Earlier EM studies reported presumed inhibitory synapses within rat retinocollicular neuropil at the end of the first postnatal week (Lund and Lund, 1972). However, our immunoblotting analysis of GAD and GAT protein levels supports a later onset. GAD65 first becomes reliably detectable in these superficial collicular layers at P12. It shows a pronounced increase by P19, as do both GABA transporters. In this neuropil sEPSC rates are high from P8 to P17. At P18, 4 d after eye opening and approximately at the time when the optics clear, these rates drop to nearly one-half of their previous values. The timing of this change corresponds to that when applied bicuculline first increases the sEPSC rate. The timing of this change suggests that inhibition onset may be triggered by high levels of activity from pattern vision and is consistent with the finding that GAD65, which predominates in synaptic terminals, has been shown to be modulated by activity (Kaufman et al., 1991).
Several paradoxical observations are present in the physiological data on inhibition, however. For example, our recordings reveal little evidence of Cl−-mediated IPSCs in these cells.ECl in these recordings is approximately −40 mV, so we initially assumed that depolarizing IPSCs were lost in the noise in cells held at −60 mV. However, traces recorded at more positive holding potentials also failed to reveal a distinct population of spontaneous currents reversing at negative potentials. In the one previous study of inhibition in the early rat colliculus, Warton and colleagues (1990), using sharp electrodes, reported that inhibition became more pronounced after eye opening. Nevertheless, between P9 and P12, 16 of 21 neurons responded to intracollicular stimulation with Cl−-dependent IPSCs in that study, indicating that such currents exist even in young colliculi. Perhaps the inhibitory interactions we detected as increases in sEPSC frequency in response to bicuculline occur predominantly on neurons we did not sample or exceptionally locally in the serial dendrodendritic synapses characteristic of the superficial superior colliculus (Lund and Lund, 1972; Mize et al., 1991). In the latter location they may shunt excitatory current without producing discernible current at the soma. Clearly, additional work focused specifically on inhibition is necessary to resolve these ambiguities.
The superficial layers of the developing rat superior colliculus were examined in one of the first studies to evaluate NMDA receptor downregulation in development and to suggest that changing subunit composition of the receptor might be involved (Hestrin, 1992). Isolating NMDA currents in evoked responses with positive holding potentials and bath-applied CNQX, Hestrin documented slowly declining NMDA receptor current decay occurring between P11 and P33. Glutamate and CNQX applied to patches excised from a subset of collicular neurons showed that the NMDA receptor decay declined because of changing open time of the NMDA channel itself. Our investigation confirms and extends these results, because our evoked recordings also suggest this slow change in NMDA receptor current decay (see Fig. 1b) in addition to the abrupt decline between P10 and P11. The two studies differ because Hestrin did not sample spontaneous events extensively and, perhaps more significantly, did not perform many recordings early in the second postnatal week when the NMDA receptor contribution abruptly decreases.
NMDA receptor-mediated activity and structural plasticity
In mammals, structural plasticity is studied more in the geniculocortical pathway than in the retinocollicular pathway. Plasticity in the afferent layers of mammalian visual cortex has been correlated with the normal developmental downregulation of NMDA receptor function in those layers (Fox et al., 1989). Dark rearing (Fox et al., 1991; Carmignoto and Vicini, 1992) and tetrodotoxin (TTX) application to cortex (Carmignoto and Vicini, 1992) delay the decrease in receptor function. In addition, Carmignoto and Vicini (1992)suggested that developmental changes in NMDA receptor channel gating properties in rat layer IV could account for the changes in synaptic receptor function. However, the complexity of cortical circuitry and differences in developmental maturity across layers have caused difficulty in identifying and isolating the specific target cell populations that demonstrate functional changes to be able to study them quantitatively at the molecular level. In the superficial layers of the mammalian superior colliculus, integrated functional and molecular studies are facilitated because the cells are developmentally more homogeneous and they are separated physically from the neurons in deeper layers.
Structural plasticity in the superior colliculus appears to terminate during the period when we have documented significant changes in NMDA receptors. In rats, retinocollicular axons can fill in an induced scotoma until P10 (Lund and Lund, 1976), and corticocollicular inputs can fill retinal scotomas until P15 (Mustari and Lund, 1976). Spontaneous activity and NMDA receptor function have been implicated in collicular synaptogenesis before pattern vision by evidence that TTX disrupts the elimination of the ipsilateral retinocollicular projection (Thompson and Holt, 1989), that early temporally patterned spontaneous activity occurs in the fetus of many species (Maffei and Galli-Resta, 1990; Meister, 1996), and that both retinocollicular map refinement (Simon et al., 1992) and several indices of normal synaptic differentiation (Hofer et al., 1994; Scheetz et al., 1996) in the rat can be stalled by chronic NMDA receptor antagonism begun at P0. The differentiation of inhibitory transmission after eye opening that we have observed may represent an additional mechanism for controlling both excitation and the potential for structural change in this neuropil.
Footnotes
This work was supported by National Institutes of Health Grants NS32290 to M.C.P. and NS09569 to S.M.A. from the National Institute of Neurological Disorders and Stroke and the National Institute of Mental Health. We thank Dr. Nigel Daw for his critical reading of this manuscript and Dr. Richard Huganir for his generous donation of antibodies against the NR1 subunit.
Correspondence should be addressed to Dr. Martha Constantine-Paton, Department of Biology, P.O. Box 108203, Yale University, New Haven, CT 06520.
REFERENCES
- 1.Balice-Gordon RJ, Chua CK, Nelson CC, Lichtman JW. Gradual loss of synaptic cartels precedes axon withdrawal at developing neuromuscular junctions. Neuron. 1993;11:801–815. doi: 10.1016/0896-6273(93)90110-d. [DOI] [PubMed] [Google Scholar]
- 2.Barry PH, Lynch JW. Liquid junction potentials and small cell effects in patch-clamp analysis. J Membr Biol. 1991;121:101–117. doi: 10.1007/BF01870526. [DOI] [PubMed] [Google Scholar]
- 3.Bear M, Kleinschmidt A, Gu Q, Singer W. Disruption of experience- dependent synaptic modifications in striate cortex by infusion of an NMDA receptor antagonist. J Neurosci. 1990;10:909–924. doi: 10.1523/JNEUROSCI.10-03-00909.1990. [DOI] [PMC free article] [PubMed] [Google Scholar]
- 4.Blanton MG, LoTurco JJ, Kriegstein AR. Whole-cell recording from neurons in slices of reptilian and mammalian cerebral cortex. J Neurosci Methods. 1989;30:203–210. doi: 10.1016/0165-0270(89)90131-3. [DOI] [PubMed] [Google Scholar]
- 5.Burden S. Development of the neuromuscular junction in the chick embryo: the number, distribution, and stability of acetylcholine receptors. Dev Biol. 1977;57:317–329. doi: 10.1016/0012-1606(77)90218-4. [DOI] [PubMed] [Google Scholar]
- 6.Carmignoto G, Vicini S. Activity-dependent decrease in NMDA receptor responses during development of the visual cortex. Science. 1992;258:1007–1011. doi: 10.1126/science.1279803. [DOI] [PubMed] [Google Scholar]
- 7.Choi DW. Glutamate neurotoxicity and diseases of the nervous system. Neuron. 1988;1:623–634. doi: 10.1016/0896-6273(88)90162-6. [DOI] [PubMed] [Google Scholar]
- 8.Cline HT, Constantine-Paton M. NMDA receptor antagonists disrupt the retinotectal topographic map. Neuron. 1989;3:413–426. doi: 10.1016/0896-6273(89)90201-8. [DOI] [PubMed] [Google Scholar]
- 9.Cline HT, Tsien RW. Glutamate-induced increases in intracellular Ca2+ in cultured frog tectal cells mediated by direct activation of NMDA receptor channels. Neuron. 1991;6:259–267. doi: 10.1016/0896-6273(91)90361-3. [DOI] [PubMed] [Google Scholar]
- 10.Cline HT, Debski E, Constantine-Paton M. NMDA receptor antagonist desegregates eye-specific stripes. Proc Natl Acad Sci USA. 1987;84:4342–4345. doi: 10.1073/pnas.84.12.4342. [DOI] [PMC free article] [PubMed] [Google Scholar]
- 11.Dan Y, Poo M-M. Hebbian depression of isolated neuromuscular synapses in vitro. Science. 1992;256:1570–1573. doi: 10.1126/science.1317971. [DOI] [PubMed] [Google Scholar]
- 12.Dunah AW, Yasuda RP, Wang Y, Luo J, Davila-Garcia MI, Gbadegesin M, Vicini S, Wolfe BB. Regional and ontogenic expression of the NMDA receptor subunit NR2D protein in rat brain using a subunit-specific antibody. J Neurochem. 1996;67:2335–2345. doi: 10.1046/j.1471-4159.1996.67062335.x. [DOI] [PubMed] [Google Scholar]
- 13.Durand GM, Kovalchuk Y, Konnerth A. Long-term potentiation and functional synapse induction in developing hippocampus. Nature. 1996;381:71–75. doi: 10.1038/381071a0. [DOI] [PubMed] [Google Scholar]
- 14.Fields RD, Yu C, Nelson PG. Calcium, network activity, and the role of the NMDA channels in synaptic plasticity in vitro. J Neurosci. 1991;11:134–146. doi: 10.1523/JNEUROSCI.11-01-00134.1991. [DOI] [PMC free article] [PubMed] [Google Scholar]
- 15.Flint AC, Maisch US, Weishaupt JH, Kriegstein AR, Monyer H. NR2A subunit expression shortens NMDA receptor synaptic currents in developing neocortex. J Neurosci. 1997;17:2469–2476. doi: 10.1523/JNEUROSCI.17-07-02469.1997. [DOI] [PMC free article] [PubMed] [Google Scholar]
- 16.Fox K, Sato H, Daw N. The location and function of NMDA receptors in cat and kitten visual cortex. J Neurosci. 1989;9:2443–2454. doi: 10.1523/JNEUROSCI.09-07-02443.1989. [DOI] [PMC free article] [PubMed] [Google Scholar]
- 17.Fox K, Daw N, Sato H, Czepita D. Dark-rearing delays the loss of NMDA-receptor function in kitten visual cortex. Nature. 1991;350:342–344. doi: 10.1038/350342a0. [DOI] [PubMed] [Google Scholar]
- 18.Hahm J-O, Langdon RB, Sur M. Disruption of retinogeniculate afferent segregation by antagonists to NMDA receptors. Nature. 1991;351:568–570. doi: 10.1038/351568a0. [DOI] [PubMed] [Google Scholar]
- 19.Hestrin S. Developmental regulation of NMDA receptor-mediated synaptic currents at a central synapse. Nature. 1992;357:686–689. doi: 10.1038/357686a0. [DOI] [PubMed] [Google Scholar]
- 20.Hofer M, Prusky GT, Constantine-Paton M. Regulation of NMDA receptor mRNA during visual map formation and after receptor blockade. J Neurochem. 1994;62:2300–2307. doi: 10.1046/j.1471-4159.1994.62062300.x. [DOI] [PubMed] [Google Scholar]
- 21.Ikegaki N, Saito N, Hashima M, Tanaka C. Production of specific antibodies against GABA transporter subtypes (GAT1, GAT2, GAT3) and their application to immunocytochemistry. Mol Brain Res. 1994;26:47–54. doi: 10.1016/0169-328x(94)90072-8. [DOI] [PubMed] [Google Scholar]
- 22.Ishii T, Moriyoshi K, Sugihara H, Sakurada K, Kadotani H, Yokoi M, Akazawa C, Shigemoto R, Mizuno N, Masu M, Nakanishi S. Molecular characterization of the family of the N-methyl-d-aspartate receptor subunits. J Biol Chem. 1993;268:2836–2843. [PubMed] [Google Scholar]
- 23.Kaufman DL, Houser CR, Tobin AJ. Two forms of the GABA synthetic enzyme glutamate decarboxylase have distinct intraneuronal distributions and cofactor interactions. J Neurochem. 1991;56:720–723. doi: 10.1111/j.1471-4159.1991.tb08211.x. [DOI] [PMC free article] [PubMed] [Google Scholar]
- 24.Kutsuwada T, Kashiwabuchi N, Mori H, Sakimura K, Kushiya E, Araki K, Meguro H, Masaki H, Kumanishi T, Arakawa M, Mishina M. Molecular diversity of the NMDA receptor channel. Nature. 1992;358:36–41. doi: 10.1038/358036a0. [DOI] [PubMed] [Google Scholar]
- 25.Langer TP, Lund RD. The upper layers of the superior colliculus of the rat: a Golgi study. J Comp Neurol. 1974;158:405–436. doi: 10.1002/cne.901580404. [DOI] [PubMed] [Google Scholar]
- 26.Lewin GR, McIntosh E, McMahon SB. NMDA receptors and NMDA-dependent tuning of the receptor fields of spinal cord neurons. Nature. 1994;369:482–485. doi: 10.1038/369482a0. [DOI] [PubMed] [Google Scholar]
- 27.LoTurco JJ, Blanton MG, Kriegstein AR. Initial expression and endogenous activation of NMDA channels in early neocortical development. J Neurosci. 1991;11:792–799. doi: 10.1523/JNEUROSCI.11-03-00792.1991. [DOI] [PMC free article] [PubMed] [Google Scholar]
- 28.Lund RD, Lund JS. Development of synaptic patterns in the superior colliculus of the rat. Brain Res. 1972;42:1–20. doi: 10.1016/0006-8993(72)90038-8. [DOI] [PubMed] [Google Scholar]
- 29.Lund RD, Lund JS. Plasticity in the developing visual system: the effects of retinal lesions made in young rats. J Comp Neurol. 1976;169:133–154. doi: 10.1002/cne.901690202. [DOI] [PubMed] [Google Scholar]
- 30.Luo J, Wang Y, Yasuda RP, Dunah AW, Wolfe BB. The majority of N-methyl-d-aspartate receptor complexes in adult rat cerebral cortex contain at least three different subunits (NR1/NR2A/NR2B). Mol Pharmacol. 1997;51:79–86. doi: 10.1124/mol.51.1.79. [DOI] [PubMed] [Google Scholar]
- 31.Maffei L, Galli-Resta L. Correlation in the discharges of neighboring rat retinal ganglion cells during prenatal life. Proc Natl Acad Sci USA. 1990;87:2861–2864. doi: 10.1073/pnas.87.7.2861. [DOI] [PMC free article] [PubMed] [Google Scholar]
- 32.Martinou J-C, Merlie J. Nerve-dependent modulation of acetylcholine receptor ε-subunit gene expression. J Neurosci. 1991;11:1291–1299. doi: 10.1523/JNEUROSCI.11-05-01291.1991. [DOI] [PMC free article] [PubMed] [Google Scholar]
- 33.Mayer ML, Westbrook GL. Permeation and block of N-methyl-d-aspartic acid receptor channels by divalent cations in mouse cultured central neurones. J Physiol (Lond) 1987;394:501–527. doi: 10.1113/jphysiol.1987.sp016883. [DOI] [PMC free article] [PubMed] [Google Scholar]
- 34.McDonald JW, Johnston MV. Physiological and pathophysiological roles of excitatory amino acids during central nervous system development. Brain Res Rev. 1990;15:41–70. doi: 10.1016/0165-0173(90)90011-c. [DOI] [PubMed] [Google Scholar]
- 35.Meguro H, Mori H, Araki K, Kushiya E, Kutsuwada T, Yamazaki M, Kumanishi T, Arakawa M, Sakimura K, Mishina M. Functional characterization of a heteromeric NMDA receptor channel expressed from cloned cDNAs. Nature. 1992;357:70–74. doi: 10.1038/357070a0. [DOI] [PubMed] [Google Scholar]
- 36.Meister M. Multineuronal codes in retinal signaling. Proc Natl Acad Sci USA. 1996;93:609–614. doi: 10.1073/pnas.93.2.609. [DOI] [PMC free article] [PubMed] [Google Scholar]
- 37.Mize RR. The organization of GABAergic neurons in the mammalian superior colliculus. Prog Brain Res. 1992;90:219–248. doi: 10.1016/s0079-6123(08)63616-x. [DOI] [PubMed] [Google Scholar]
- 38.Mize RR, Jeon C-J, Hamada OL, Spencer RF. Organization of neurons labeled by antibodies to gamma-aminobutyric acid (GABA) in the superior colliculus of the rhesus monkey. Vis Neurosci. 1991;6:75–92. doi: 10.1017/s0952523800000924. [DOI] [PubMed] [Google Scholar]
- 39.Monyer H, Sprengel R, Schoepfer R, Herb A, Higuch M, Lomeli H, Burnashev N, Sakmann B, Seeburg PH. Heteromeric NMDA receptors: molecular and functional distinction of subtypes. Science. 1992;256:1217–1221. doi: 10.1126/science.256.5060.1217. [DOI] [PubMed] [Google Scholar]
- 40.Monyer H, Burnashev N, Laurie DJ, Sakmann B, Seeburg PH. Developmental and regional expression in the rat brain and functional properties of four NMDA receptors. Neuron. 1994;12:529–540. doi: 10.1016/0896-6273(94)90210-0. [DOI] [PubMed] [Google Scholar]
- 41.Mustari MJ, Lund RD. An aberrant crossed visual corticotectal pathway in albino rats. Brain Res. 1976;112:27–44. doi: 10.1016/0006-8993(76)90332-2. [DOI] [PubMed] [Google Scholar]
- 42.Rabacchi S, Bailly Y, Delhaye-Bouchaud N, Mariani J. Involvement of the N-methyl-d-aspartate (NMDA) receptor in synapse elimination during cerebellar development. Science. 1992;256:1823–1825. doi: 10.1126/science.1352066. [DOI] [PubMed] [Google Scholar]
- 43.Scheetz AJ, Constantine-Paton M. Modulation of NMDA receptor function: implications for vertebrate neural development. FASEB J. 1994;8:745–752. doi: 10.1096/fasebj.8.10.8050674. [DOI] [PubMed] [Google Scholar]
- 44.Scheetz AJ, Prusky G, Constantine-Paton M. Chronic NMDA receptor antagonism during retinotopic map formation depresses CaM kinase II differentiation in rat superior colliculus. Eur J Neurosci. 1996;8:1322–1328. doi: 10.1111/j.1460-9568.1996.tb01594.x. [DOI] [PubMed] [Google Scholar]
- 45.Schlaggar B, Fox K, O’Leary D. Postsynaptic control of plasticity in developing somatosensory cortex. Nature. 1993;364:623–626. doi: 10.1038/364623a0. [DOI] [PubMed] [Google Scholar]
- 46.Schnupp J, King A, Smith A, Thompson I. NMDA-receptor antagonists disrupt the formation of the auditory space map in the mammalian superior colliculus. J Neurosci. 1995;15:1516–1531. doi: 10.1523/JNEUROSCI.15-02-01516.1995. [DOI] [PMC free article] [PubMed] [Google Scholar]
- 47.Schuetze SM, Vicini S. Neonatal denervation inhibits the normal postnatal decrease in endplate channel open time. J Neurosci. 1984;4:2297–2302. doi: 10.1523/JNEUROSCI.04-09-02297.1984. [DOI] [PMC free article] [PubMed] [Google Scholar]
- 48.Sheng M, Cummings J, Roldan LA, Jan YN, Jan LY. Changing subunit composition of heteromeric NMDA receptors during development of rat cortex. Nature. 1994;368:144–147. doi: 10.1038/368144a0. [DOI] [PubMed] [Google Scholar]
- 49.Siegel SJ, Brose N, Janssen WG, Gasic GP, Jahn R, Heinemann SF, Morrison JH. Regional, cellular, and ultrastructural distribution of N-methyl-d-aspartate receptor subunit 1 in monkey hippocampus. Proc Natl Acad Sci USA. 1994;91:564–568. doi: 10.1073/pnas.91.2.564. [DOI] [PMC free article] [PubMed] [Google Scholar]
- 50.Simon D, O’Leary D. Development of topographic order in the mammalian retinocollicular projection. J Neurosci. 1992;12:1212–1232. doi: 10.1523/JNEUROSCI.12-04-01212.1992. [DOI] [PMC free article] [PubMed] [Google Scholar]
- 51.Simon D, Prusky G, O’Leary D, Constantine-Paton M. N-methyl-d-aspartate receptor antagonists disrupt the formation of a mammalian neural map. Proc Natl Acad Sci USA. 1992;89:10593–10597. doi: 10.1073/pnas.89.22.10593. [DOI] [PMC free article] [PubMed] [Google Scholar]
- 52.Spruston N, Jaffe DB, Williams SH, Johnston D. Voltage- and space-clamp errors associated with the measurement of electrotonically remote synaptic events. J Neurophysiol. 1993;70:781–802. doi: 10.1152/jn.1993.70.2.781. [DOI] [PubMed] [Google Scholar]
- 53.Takahashi T, Feldmeyer D, Suzuki N, Onodera K, Cull-Candy SG, Sakimura K, Mishina M. Functional correlation of NMDA receptor ε subunits expression with the properties of single-channel and synaptic currents in the developing cerebellum. J Neurosci. 1996;16:4376–4382. doi: 10.1523/JNEUROSCI.16-14-04376.1996. [DOI] [PMC free article] [PubMed] [Google Scholar]
- 54.Thompson I, Holt C. Effects of intraocular tetrodotoxin on the development of the retinocollicular pathway in the Syrian hamster. J Comp Neurol. 1989;282:371–388. doi: 10.1002/cne.902820305. [DOI] [PubMed] [Google Scholar]
- 55.Tingley WG, Roche KW, Thompson AK, Huganir RL. Regulation of NMDA receptor phosphorylation by alternative splicing of the C-terminal domain. Nature. 1993;364:70–73. doi: 10.1038/364070a0. [DOI] [PubMed] [Google Scholar]
- 56.Wang YT, Bosy TZ, Yasuda RP, Grayson DR, Vicini S, Pizzorusso T, Wolfe BB. Characterization of NMDA receptor subunit-specific antibodies: distribution of NR2A and NR2B receptor subunits in the rat brain and ontogenic profile in the cerebellum. J Neurochem. 1995;65:176–183. doi: 10.1046/j.1471-4159.1995.65010176.x. [DOI] [PubMed] [Google Scholar]
- 57.Warton SS, McCart R. Synaptogenesis in the stratum griseum superficial of the rat superior colliculus. Synapse. 1989;3:136–148. doi: 10.1002/syn.890030205. [DOI] [PubMed] [Google Scholar]
- 58.Warton SS, Perouansky M, Grantyn R. Development of GABAergic synaptic connections in vivo and in cultures from the rat superior colliculus. Dev Brain Res. 1990;52:95–111. doi: 10.1016/0165-3806(90)90225-n. [DOI] [PubMed] [Google Scholar]
- 59.Wenzel A, Villa M, Mohler H, Benke D. Developmental and regional expression of NMDA receptor subtypes containing the NR2D subunit in rat brain. J Neurochem. 1996;66:1240–1248. doi: 10.1046/j.1471-4159.1996.66031240.x. [DOI] [PubMed] [Google Scholar]
- 60.Williams K, Russell SL, Shen YM, Molinoff PB. Developmental switch in the expression of NMDA receptors occurs in vivo and in vitro. Neuron. 1993;10:267–278. doi: 10.1016/0896-6273(93)90317-k. [DOI] [PubMed] [Google Scholar]
- 61.Yip RK, Kelly PT. In situ phosphorylation in hippocampal tissue slices. J Neurosci. 1989;9:3618–3630. doi: 10.1523/JNEUROSCI.09-10-03618.1989. [DOI] [PMC free article] [PubMed] [Google Scholar]
- 62.Yuste R, Katz LC. Control of postsynaptic Ca2+ influx in developing neocortex by excitatory and inhibitory neurotransmitters. Neuron. 1991;6:333–344. doi: 10.1016/0896-6273(91)90243-s. [DOI] [PubMed] [Google Scholar]
- 63.Zhong J, Carrozza DP, Williams K, Pritchett DB, Molinoff PB. Expression of mRNAs encoding subunits of the NMDA receptor in developing rat brain. J Neurochem. 1995;64:531–539. doi: 10.1046/j.1471-4159.1995.64020531.x. [DOI] [PubMed] [Google Scholar]
- 64.Zukin RS, Bennett MVL. Alternatively spliced isoforms of the NMDAR1 receptor subunit. Trends Neurosci. 1995;18:306–313. doi: 10.1016/0166-2236(95)93920-s. [DOI] [PubMed] [Google Scholar]