

Abstract
GABAergic and glycinergic IPSCs were studied in identified retinal ganglion cells (RGCs) of light-adapted rat retinal slices, using whole-cell recording techniques. GABAergic IPSCs were blocked specifically by SR95531 (3 μm) and bicuculline (3 μm) and glycinergic IPSCs by strychnine (0.3 μm). From 37 RGCs studied, 25 showed exclusively GABAergic IPSCs, 6 presented only glycinergic IPSCs, and 6 showed both. This distribution may result from differences in amacrine cells input rather than from receptor heterogeneity, because both GABA and glycine elicited Cl−-selective currents in all RGCs tested. TTX markedly reduced GABAergic IPSCs frequency, whereas glycinergic IPSCs were unaffected. Ca2+-free media, with or without high Mg2+, blocked TTX-resistant GABAergic and glycinergic IPSCs. These results suggest that GABAergic IPSCs in RGCs can be elicited either by Na+-dependent action potentials or by local Ca2+ influx in medium or large dendritic field GABAergic amacrine cells, whereas glycinergic IPSCs are generated by action potential-independent Ca2+ influx in narrow field glycinergic amacrine cells. Both types of IPSCs had fast rise times and biexponential decays, but glycinergic IPSC decay was significantly slower than that of GABAergic IPSCs. An elementary conductance of 54 pS for the glycine-gated channels was estimated from single-channel events, clearly detected in the falling phase of glycinergic IPSCs, and from responses to exogenous glycine.
Keywords: synaptic currents, GABA, glycine, retina, patch-clamp, neurotransmitter receptors
Two main inhibitory neurotransmitters are involved in the organization of the receptive fields of retinal ganglion cells (RGCs): GABA and glycine (Wässle and Boycott, 1991). Both neurotransmitters are found in mammalian amacrine cells, which in their majority are presynaptic to RGCs. GABA immunoreactivity (Agardh et al., 1986; Mosinger et al., 1986; Osborne et al., 1986; Mosinger and Yazulla, 1987; Vaney and Young, 1988; Chun and Wässle, 1989; Wässle and Chun, 1989; Koontz and Hendrickson, 1990) and uptake of both [3H]GABA (Pourcho, 1980) and [3H]muscimol (Pourcho, 1980;Pourcho and Goebel, 1983; Wässle et al., 1987) have been detected in amacrine cells. Glutamic acid decarboxylase (GAD), the GABA-synthesizing enzyme, was found immunocytochemically (Mosinger and Yazulla, 1987; Brecha et al., 1988) and by in situhybridization with GAD mRNA in amacrine cells (Sarthy and Fu, 1989). Glycine accumulates in other amacrine cells of mammalian retinas (Marc and Liu, 1985), where it also was detected immunocytochemically (Hendrickson et al., 1988; Davenger et al., 1991; Pourcho and Owarczak, 1991; Koontz et al., 1993).
GABAA receptor subunits have been localized in RGCs and in the inner plexiform layer, possibly at RGC dendrites (Hughes et al., 1989, 1991; Grünert et al., 1993; Greferath et al., 1994a; Koulen et al., 1996). Glycine receptor subunits also have been found at similar sites (Pourcho and Owarczak, 1991; Grünert and Wässle, 1993; Greferath et al., 1994b). Moreover, receptors to both transmitters are segregated spatially in clusters on the somatodendritic membranes of rat RGCs (Koulen et al., 1996).
On the basis of the effects of strychnine and bicuculline on light-evoked unitary activity of cat RGCs, Saito (1983) proposed a differential distribution of GABAergic versus glycinergic synapses in the ON versus the OFF pathways. Other work has failed to confirm these results: GABA and glycine suppressed, whereas strychnine and bicuculline enhanced, the light-evoked responses recorded from cat RGCs, regardless of their type (Bolz et al., 1985a,b). Hence, the precise role of inhibitory inputs on RGCs remains highly controversial.
More recently, GABA and/or glycine were found to induce currents in cultures of goldfish (Ishida and Cohen, 1988; Cohen et al., 1989;Ishida, 1992) and murine RGCs (Tauck et al., 1988), in isolated rat retinas (Rörig and Grantyn, 1993), and in primate retinal slices (Zhou et al., 1994). The action of both transmitters on RGCs involves a Cl− conductance increase (Tauck et al., 1988; Cohen et al., 1989). Nevertheless, with the exception of infrequent GABAergic IPSCs observed in 5-d-old rats (Rörig and Grantyn, 1993), no study has been performed on the GABAergic and glycinergic IPSCs of RGCs.
In the present work we have analyzed GABAergic and glycinergic IPSCs in RGCs of light-adapted rat retinal slices. We have found marked differences between these two classes of IPSCs concerning their time course, their distribution among the ganglion cell population studied, and their sensitivity to tetrodotoxin and removal of external Ca2+ ions. Some of these results have been reported in preliminary form (Protti et al., 1996).
MATERIALS AND METHODS
Tissue preparation. Vertical slices were prepared from the retinas of adult rats (4–7 weeks old). Animals were anesthetized deeply with Metofane (1.4 gm of methoxyflurane and 0.15 mg of 2,6-di-tributyl-p-cresol per 120 ml; Janssen GmbH, Russelsheim, Germany) and decapitated. The initial dissection followed the procedures described by Boos et al. (1993). Briefly, eyes were enucleated rapidly and transferred to a beaker filled with ice-cold physiological saline [bicarbonate-buffered saline (BBS); see Solutions and Drug Application]. After the cornea was cut along the ora serrata, lens and vitreous were removed and the retina was separated from the sclera. Then the retina was cut into four pieces with a scalpel blade, one of the fragments was embedded in 2% agar dissolved in BBS (kept at a constant temperature of 38°C), and the resulting block was cooled rapidly. The block was transferred to a microslicer (Dosaka EM, Kyoto, Japan) where 200-μm-thick slices were cut. The slices were kept at 33°C in BBS for 1 hr before their use for electrophysiological recording.
Electrophysiological recordings and analysis. Experiments were performed at 20–23°C with an upright microscope (Zeiss Axioskop, Oberkochen, Germany) equipped with Nomarski differential interference contrast optics and a water immersion objective (63×, 0.9 numerical aperture). The criteria for RGCs identification will be described in Results. The dissection, as well as the incubation and recording, was done under laboratory light conditions. Consequently, the retinal slices were light-adapted. Nevertheless, light responses were observed on some occasions. The recording chamber was perfused at a rate of 1–1.5 ml/min with BBS.
All of the experiments were performed with the tight-seal whole-cell recording (wcr) configuration of the patch-clamp technique (Hamill et al., 1981). Seal formation was achieved without previous cleaning of the neuronal surface by maintaining a moderate positive pressure in the pipette while approaching the cell. Recordings were performed with an EPC-9 amplifier and borosilicate glass pipettes having resistances of 3.5–5 MΩ when filled with Cl−-containing intracellular solution (S1; see below). Pipettes were coated with dental wax to decrease their capacitance. In wcr, capacitive currents were canceled, and series resistance compensation was applied in the range of 60–80%. Only cells with uncompensatedRs ≤ 20 MΩ were used in this study. The average capacitance of RGCs was 5.03 ± 0.55 pF, and their input resistance, when dialyzed with a CsCl solution (S1; see below), was 2.95 ± 0.15 GΩ (n = 42; mean ± SEM). Membrane potential values were corrected for liquid junction potentials.
For the study of effects of various drugs on IPSCs parameters, membrane currents were recorded in control saline for 4 min, the bath was exchanged to the drug containing solution, and data acquisition was interrupted during 3–4 min to allow for complete equilibration of the test solution within the slice. After this period, data acquisition continued. In general, we acquired 4 min of data in each experimental condition.
Membrane currents were digitized on-line at 200 μsec/point and stored in disk for subsequent analysis. Detection and analysis of IPSCs were performed with a program written by Dr. P. Vincent, as described inVincent and Marty (1993). Unless otherwise noted, a detection threshold of 7–10 pA was used. Each detected event was inspected visually to discard from the analysis glutamatergic synaptic currents, which were characterized by a decay time constant of the order of 1 msec (see Results). Amplitude distributions of IPSCs were constructed from the events with IGOR software (WaveMetrics, Lake Oswego, OR). Noise histograms were produced from events-free sections of the recordings; 1000 measurements of the difference in mean current between two 1 msec segments, separated by 1.5 msec, were taken at random positions in the recording; the resulting distribution was scaled to the peak number of events of the data histogram. For the analysis of IPSCs decay, individual events were aligned at their onset, averaged, and fit by a double-exponential function. All data point histograms of single-channel currents and the corresponding fits with gaussian functions were performed with IGOR software. Statistical values are given as the mean ± SEM.
Solutions and drug application. The standard external solution (BBS) consisted of (in mm): 125 NaCl, 2.5 KCl, 2 CaCl2, 1 MgCl2, 1.25 NaH2PO4, 26 NaHCO3, and 10 glucose (pH of 7.4 when equilibrated with a mixture of 95% O2/5% CO2). Most of the experiments were performed with an intracellular solution (S1) having a Cl− concentration close to that in the extracellular solution. Its composition was (in mm): 150 CsCl, 4.6 MgCl2, 0.1 CaCl2, 1 EGTA, 10 HEPES-Cs, 0.4 Na-GTP, and 4 Na-ATP, pH 7.3. In experiments designed to establish the Cl− selectivity of agonist-induced currents, an internal solution with low Cl− concentration, close to physiological levels, was used. This solution contained (in mm): 150 Cs gluconate, 4.6 MgCl2, 0.1 CaCl2, 1 EGTA, 10 HEPES-Cs, 0.4 Na-GTP, and 4 Na-ATP. In some experiments a solution equivalent to S1, but with K+ replacing Cs+ as the main cation, was used. Neurobiotin 2 mg/ml was included in the recording pipettes.
Bicuculline methochloride, GABA, glycine, and 6-cyano-7-nitroquinoxaline-2,3-dione (CNQX) were purchased from Tocris Neuramin (Bristol, UK), SR95531 from Research Biochemicals (RBI; Natick, MA), and all other chemicals from Sigma (Deisenhofen, Germany). Drug stocks were prepared as follows: 10 mm GABA, 10 mm glycine, 2 mm strychnine, and 10 mm bicuculline prepared in H20. CNQX and NBQX were prepared in 1 mm NaOH. Tetrodotoxin (TTX) was purchased in 1 mg aliquots containing 5 mg of citrate buffer, and the stock was prepared in H2O at 0.2 mm. Stocks were aliquoted, frozen, and dissolved daily in BBS to reach the desired concentration.
Agonist-induced currents were elicited either by bath perfusion or by local application through a puffer pipette connected to a Picospritzer. In the latter case, pipettes with ∼5 μm tip diameter were positioned at 25 μm from the recorded cell. These pipettes were filled with 20 μl of a HEPES saline solution [(in mm) 145 NaCl, 2.5 KCl, 2 CaCl2, 1 MgCl2, 10 HEPES-Na, pH 7.3] containing the agonists at the indicated concentration.
Histology. After electrophysiological recordings, the patch pipette was removed carefully to preserve the structure of the cell, and the slice was processed for histological examination, following the procedure described by Horikawa and Armstrong (1988). Briefly, slices were fixed overnight at 4°C in a 0.1 m PBS, pH 7.4, containing 4% paraformaldehyde. After a thorough rinsing in PBS, endogenous peroxidases were quenched in a solution containing 1% H2O2, 10% absolute methanol, and 89% PBS. Then the slices were incubated for 2 hr in avidin–biotin–horseradish peroxidase complex (ABC; Vector Labs, Burlingame, CA) in PBS containing 0.4% Triton X-100. The slices were rinsed in PBS and then reacted in a solution containing 0.05% diaminobenzidine and 0.15% nickel ammonium sulfate for 30 min; 0.03% H2O2 was added for the last 5 min of the incubation. Then the slices were mounted in a 10–90% solution of glycerol–PBS and sodium amide. The coverslips were sealed with fingernail polish for storage. Mounts were examined with a 100× oil immersion lens.
RESULTS
Identification and membrane properties of RGCs
In this study RGCs were selected on the basis of their size and location. The soma of the cells studied (12–20 μm) were the largest of the ganglion cell layer (GCL) and were located in the proximal border of this layer, next to the vitreal surface. Their identification as RGCs was confirmed by histological examination after biocytin staining of the recorded cells (see Materials and Methods). The pattern of the dendritic arborization was variable, but the dendrites always projected to the inner plexiform layer; in some cases it was possible to visualize the axon running in the most external border of the GCL (data not shown).
RGCs were characterized by spontaneous action potential firing, routinely recorded in the cell-attached configuration, and by prominent voltage-gated currents observed under wcr. The latter consisted of a fast inactivating inward current caused by Na+channel activity, as it was blocked by addition of TTX (0.4 μm), followed by a noninactivating voltage-dependent outward current associated with the opening of voltage-gated K+ channels. A small slow inward current persisted in TTX and was suppressed by the removal of external Ca2+ from the bathing solution (data not shown). The average density of the peak Na+ current in 28 cells ranged from 20 to 1650 pA/pF (mean ± SEM = 393 ± 86 pA/pF).
Synaptic input to retinal RGCs
Synaptic currents recorded from different RGCs of light-adapted slices corresponded either to EPSCs, which could be blocked by the AMPA receptor antagonists CNQX and NBQX, or to IPSCs, the amplitude of which was unaffected by these blockers. Excitatory and inhibitory events could be distinguished unambiguously by their characteristic kinetic parameters, because the former decayed within 1–2 msec whereas IPSCs had considerably longer decays (see Fig. 4). EPSCs have been observed in salamander RGCs, albeit with slower decay time course (τdecay ∼3.8 msec; Taylor et al., 1995). In this paper we have used the difference in decay kinetics to distinguish the inhibitory from the excitatory synaptic events, thus avoiding the use of glutamatergic antagonists, which in preliminary experiments (results not shown) were observed to induce changes in IPSC frequency, probably by affecting retinal circuits.
Fig. 4.

Comparative kinetics of GABAergic IPSCs, glycinergic IPSCs, and glutamatergic EPSCs. A, Average of 73 GABAergic IPSCs. Only those IPSCs separated from other IPSCs by >150 msec were included in the average. The decay phase was fit by the sum of two exponential functions with time constants of 8.9 and 34.5 msec (amplitude coefficients of −36 and −24.5 pA, respectively); the fit is superimposed on the averaged trace. B, Average of 182 glycinergic IPSCs. Only those IPSCs separated from other IPSCs by >500 msec were included in the average. The decay phase was approximated by a double-exponential function with time constants of 17.6 and 79.6 msec (amplitude coefficients, −41 and −49 pA, respectively). The fit is superimposed on the averaged trace.C, Average of 33 glutamatergic EPSCs. Superimposed on the trace is the fit of the decay phase by a single exponential with a time constant of 0.91 msec. These fast EPSCs were abolished by CNQX (10 μm; data not shown).
A survey of the inhibitory synaptic events recorded in different RGCs revealed that they were heterogeneous and belonged to two different classes: GABAergic and glycinergic. The occurrence of these classes of IPSCs varied from cell to cell. From 37 RGCs analyzed in this study, the majority (25 cells) showed exclusively GABAergic IPSCs, six cells presented only glycinergic IPSCs, and the remaining six cells received mixed GABAergic and glycinergic inputs.
GABAergic IPSCs
Figure 1Aillustrates an example of the IPSCs observed in the majority of RGCs from a continuous wcr in a ganglion cell held at −60 mV in symmetrical Cl− conditions. In this recording, as in the majority of RGCs studied, inward current transients, the amplitude of which ranged from a few picoamps up to >150 pA, appeared with low frequency at random. Bath application of SR95531 (3 μm), a specific GABAA antagonist, blocked the IPSCs, and this effect was partially reversible. To quantify the effects of GABA and glycine receptors antagonists, we analyzed experiments in terms of the overall synaptic activity, measured as the sum of the amplitudes of all synaptic events during intervals of 20 sec, as shown in Figure1B. Then the percentage of block by a given antagonist was calculated from the ratio of the mean current/20 sec in the test period over that in control condition. Using this protocol, we determined that 3 μm SR95531 blocked 96.6 ± 2.8% of the IPSCs (n = 4), whereas bicuculline (3 μm) induced a 95.6 ± 1.4% block of the IPSCs (n = 4). Pooled data are shown in Figure5B.
Fig. 1.

GABAergic IPSCs in RGCs. A, Selected traces from a continuous current recording obtained in symmetrical Cl− conditions. Holding potential, −60 mV. The inward current transients present in a, corresponding to IPSCs, are reversibly blocked by bath application of 3 μm SR95531 (b), a blocker of GABAA receptors. B, Plot of the sum of the amplitudes of all synaptic events detected during 20 sec intervals against time for the cell shown in A in control saline (a), in the presence of 3 μm SR95531 (b), and after removal of the antagonist (c). In this and subsequent figures presenting plots of synaptic activity per unit of time, the gaps in the time axes correspond to periods in which data acquisition was interrupted, allowing for complete equilibration of the drug tested (see Materials and Methods). C, Amplitude distributions of the IPSCs recorded at −60 mV in control condition (left) and in the presence of 0.4 μm TTX (right). The corresponding scaled noise distributions (1000 events each) are displayed in black; bin widths: 5 pA for the IPSCs, 0.5 pA for the scaled noise histogram. The total sampling time was the same for both IPSC histograms (4 min). TTX decreased IPSC frequency without affecting their mean amplitude; the mean IPSC amplitude is 35 pA in the control histogram (450 events, corresponding to a frequency of 1.87 Hz) and 31 pA in the TTX histogram (244 events, corresponding to a frequency of 1.02 Hz). D, The cumulative amplitude distributions for the same experiment are displayed. E, Data pooled from 11 cells on the effects of TTX on mean amplitude (left) and mean frequency (right) of GABAergic IPSCs recorded at −60 mV. The vertical linescorrespond to the SEM; asterisks indicate that the two groups are statistically different at the 0.001 level (Student’st test).
Fig. 5.
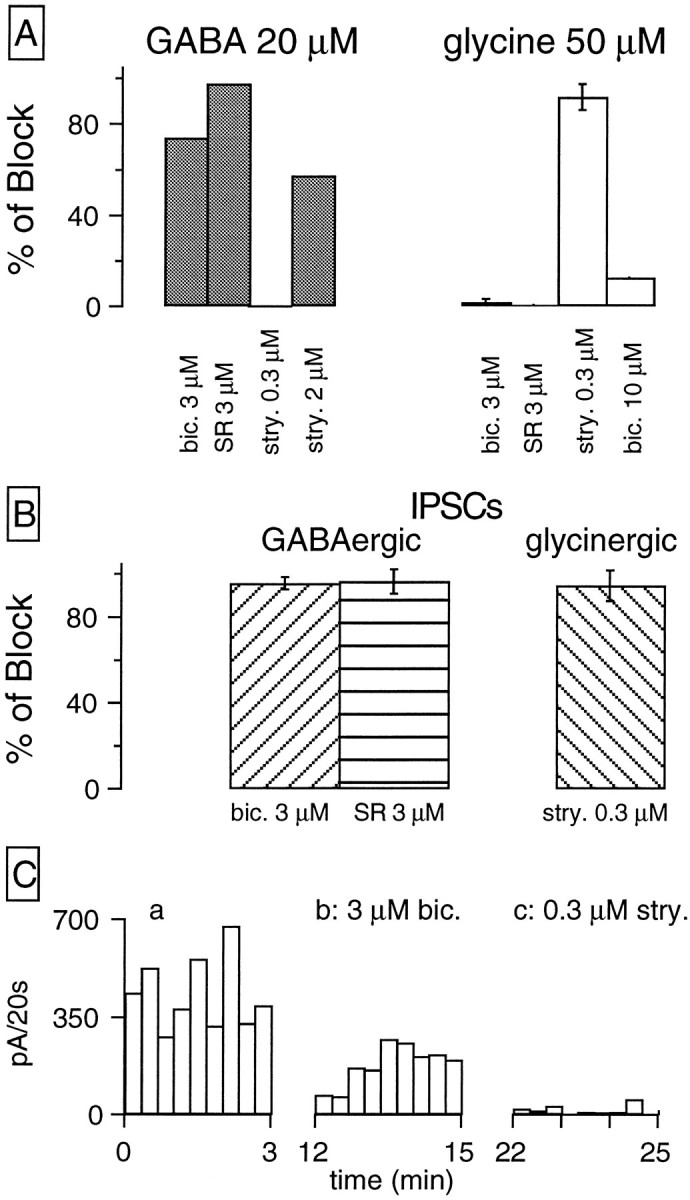
Pharmacological profile of agonist-induced currents and IPSCs. A, Left, The effect of various blockers on the currents induced by bath application of 20 μm GABA (two cells were studied for each blocker).Right, The effects of these blockers on the currents elicited by bath application of 50 μm glycine (number of cells included: three for 3 μm bicuculline, one for 3 μm SR95531, four for 0.3 μm strychnine, and one for 10 μm bicuculline). B, Pooled data on the effect of various blockers on the synaptic activity, studied as the sum of all events detected per unit of time (see GABAergic IPSCs). Four cells were studied in each group. The error bars inA and B correspond to the SEM, calculated for groups in which n ≥ 3. C, Display of the effects of bicuculline and strychnine on the IPSCs recorded from another RGC, which had a mixed population of IPSCs. Holding potential, −60 mV. In this cell the GABAAinhibitor bicuculline produced a 40% block of IPSCs; the remaining activity was abolished by 0.3 μm strychnine.
Effect of tetrodotoxin and Ca2+-free media on GABAergic IPSCs
In RGCs recorded in symmetrical Cl− conditions and held at −60 mV, the addition of TTX (0.4 μm) to the external solution induced a marked decrease in the frequency of GABAergic synaptic events. The histograms of Figure 1Cpresent results from one of these experiments. Amplitude distributions are shown for control conditions (left) and in the presence of TTX (right). In this experiment TTX reduced IPSC frequency by 45% without significantly affecting the mean amplitude. The mean amplitude was 35 pA in control, whereas the value in the presence of TTX was 31 pA. The lack of effect of TTX on IPSCs amplitude was confirmed by the cumulative amplitude distributions displayed in Figure 1D, where no significant shift is observed between the two curves. Figure 1E summarizes data from a pool of 11 RGCs showing that, whereas the mean IPSC frequency in TTX amounts to less than one-half of the frequency in control saline, IPSCs amplitude for the same cells do not differ significantly in the two conditions.
Next, the sensitivity of TTX-resistant IPSCs to external Ca2+ ions was investigated. In two RGCs Ca2+ was removed while keeping the Mg2+ concentration at 1 mm. The frequency of TTX-resistant GABAergic IPSCs was reduced by 22% in one cell and 45% in the other. In four other RGCs in which Ca2+ was removed and the concentration of Mg2+ was increased to 4 mm, the frequency of GABAergic IPSCs was suppressed by 90.2 ± 5%.
Glycinergic IPSCs
In six of the RGCs studied, IPSCs had electrophysiological features that differed from those of GABAergic IPSCs. The two top traces of Figure 2Aillustrate an example of IPSCs recorded in a ganglion cell held at −80 mV in symmetric Cl− conditions. These IPSCs had a fast rising phase, but their time course of decay was slower than that of GABAergic IPSCs (see comparison in Fig. 4). Moreover, the decay phase showed discrete current steps because of the closing and opening of single ionic channels. Current fluctuations persisted for some time after the macroscopic current had reached a level close to baseline and corresponded to openings and closings of single glycine-gated channels. The bottom trace in Figure 2A shows a segment of the middle trace at higher time resolution and increased magnification.
Fig. 2.

Glycinergic IPSCs and single-channel events in RGCs. A, Representative traces of glycinergic IPSCs recorded at −80 mV under symmetrical Cl−conditions. The inset in the lowest paneldisplays at an expanded time scale a section on the decay phase of an IPSC in which discrete current fluctuations, corresponding to the opening and closing of single channels, are clearly detected. The predominant amplitude of the elementary currents was ∼4–5 pA at −80 mV, corresponding to a single-channel conductance of ∼50 pS.B, Display of the IPSCs amplitude distribution for the same cell. The IPSC histogram (bin width, 7 pA) contains 638 events, with a mean amplitude of 80 pA. The solid linecorresponds to the fit of the data by a single gaussian function; fit parameters were a mean of 60 pA and SD of 30 pA. A relatively high detection threshold (15 pA) was used in the analysis to avoid including single-channel events. The scaled noise distribution (1000 events; bin width, 0.7 pA) is displayed in black. C, The upper panel shows single-channel events elicited at −100 mV by bath-applied glycine (50 μm). The left plot in the lower panel illustrates an all-point histogram from the same experiment in which two channels with the same elementary current can be identified (6 sec recording; bin width, 0.2 pA; the leak current has been subtracted for clarity). The solid lines correspond to the fit of the data by three gaussian functions; fit parameters (mean ± SD, in pA) for each gaussian were 0.02 ± 0.04, −5.5 ± 0.7, and −10.8 ± 0.9. Theright lower panel displays the I–Vrelation for the elementary glycine-activated current determined from all-point histograms at three different membrane potentials; thesolid line corresponds to the fit of the data by a linear function, yielding an estimated single-channel conductance of 55 pS. D, Glycinergic synaptic activity is displayed as the sum of the amplitudes of all IPSCs detected during 20 sec intervals as a function of time. The addition of the GABAA antagonist SR95531 (b) did not affect synaptic activity, whereas strychnine at 0.3 μm (c) exerted a profound block on IPSCs and eliminated synaptic activity at 2 μm (d). Holding potential, −60 mV.
The histogram of Figure 2B illustrates the amplitude distribution of IPSCs for the same RGC as in Figure2A. The analysis of these IPSCs was performed by setting the detection threshold at 15 pA to exclude single-channel events. The amplitude distribution presents a single peak with a mean amplitude of 80 pA that, on the basis of the elementary current of the predominant single channels, would correspond to the opening of ∼16–18 single transmitter-gated channels. In five cells studied, the mean amplitude of IPSCs identified as glycinergic on the basis of pharmacological criteria (see below) was 36.11 ± 9.23 pA, whereas their frequency was 0.73 ± 0.14 Hz.
The elementary conductance of the glycine-gated receptor–channel complex was estimated in symmetrical chloride solutions by analyzing (1) the discrete events present in the falling phase of IPSCs (two cells) and (2) the single-channel currents elicited by bath applications of glycine (two cells). A typical trace showing glycine-gated channels after a bath application of glycine in an RGC held at −100 mV is illustrated in Figure 2C (top trace). The left lower panel shows an all-point histogram for this experiment characterized by a multimodal distribution with a peak at 0 pA, representing the closed state, and two equally separated peaks corresponding to two channels with the same mean elementary current. The right lower panel displays the I–V relation for this experiment, which has a slope conductance of 55 pS. In the four cells analyzed, the mean slope conductance was 54 ± 2.4 pS (n = 4).
The experiments of Figure 2D demonstrate the glycinergic nature of these IPSCs. The plots present the sum of the amplitudes of IPSCs recorded during sample intervals of 20 sec against the time of recording in control saline (Fig. 2Da) and under the effect of several drugs. The application of SR95531 (3 μm) induced only a very weak diminution of IPSCs activity (Fig. 2Db), whereas the presence of the classic glycinergic antagonist strychnine (0.3 μm) in the saline elicited a remarkable depression of the IPSCs (Fig.2Dc); increasing the strychnine concentration to 2 μm abolished the IPSCs (Fig. 2Dd). It can be concluded from these experiments that the second class of IPSCs is mediated by glycine. In four cells strychnine (0.3 μm) blocked the IPSCs by 94.6 ± 3.6% (pooled data are shown in Fig.5B). In one of the cells a dose–response curve for the block of IPSCs by strychnine was performed, yielding an IC50 of 22 nm (data not shown).
Effect of TTX and removal of external Ca2+ on glycinergic IPSCs
Figure 3 illustrates one of the experiments performed in two different RGCs in which the effects of TTX (0.4 μm) on the amplitude and frequency of glycinergic IPSCs were analyzed. The histograms plot the mean amplitude (top panels) and mean frequency (bottom panels) of the glycinergic IPSCs for 20 sec periods against the whole-cell recording time. Figure 3, Aa and Ba, corresponds to the measurements of these parameters when the cell was bathed in normal saline. The addition of TTX affected neither the mean IPSC amplitude (Fig. 3Ab) nor the mean frequency (Fig. 3Bb). In contrast, removing Ca2+ from the extracellular medium in the presence of TTX and of 2 mmMg2+ reduced the mean IPSC frequency by 90% (Fig.3Bc). Ca2+ removal did not change significantly the mean amplitude (Fig. 3Ac). The irregular pattern in Figure 3Ac is attributable to the small sample number in each 20 sec bin. The initial values for mean IPSC amplitude and frequency were restored when the normal Ca2+concentration was reestablished in the TTX-containing saline (Fig.3Ad,Bd). The application of SR95531 did not affect the TTX-treated IPSCs (Fig. 3Ae,Be) whereas, as expected, 0.3 μm strychnine markedly reduced both the mean amplitude and frequency of the TTX-treated glycinergic IPSCs (Fig.3Af,Bf). The same pattern of behavior was observed in the other ganglion cell tested.
Fig. 3.

Lack of effect of TTX on glycinergic IPSCs. Shown are plots of the mean amplitude (A) and mean frequency (B) of glycinergic IPSCs detected during 20 sec sample intervals against time in whole-cell recording. Neither the amplitude nor the frequency was affected by the addition of TTX (0.4 μm) to the bathing solution (panels b). However, removal of external Ca2+ led to a drastic reversible reduction in IPSC frequency (panels c, d). The glycinergic nature of the IPSCs was confirmed by the lack of effect of SR95531 (panels e) and the block by a low concentration of strychnine (panels f).
In two other experiments conducted in the presence of TTX, all Ca2+ was removed from the extracellular medium while 4 mm Mg2+ was added. TTX-resistant glycinergic IPSCs were blocked by 85% in one of these RGCs and by 100% in the other.
Time course of synaptic currents
Besides their distinct pharmacological profile and different sensitivity to TTX, GABAergic and glycinergic IPSCs were distinguished easily by their kinetics properties. In RGCs of slices bathed in control saline and recorded with CsCl-filled pipettes, the GABAergic IPSCs showed a characteristic time course exemplified by the average of 73 traces, shown in Figure4A. The 10-to-90% rise time of the averaged IPSC in this case was 0.86 msec, whereas its decay phase was best approximated by two exponentials with time constants of 8.9 (τ1) and 34.5 (τ2) msec [the ratio of their amplitude coefficients (A2/A2 + A1) being 0.42]. Similar features were found in the eight RGCs receiving GABAergic input, which were analyzed in a similar manner with average values for the 10-to-90% rise time of 1.11 ± 0.2; 6.52 ± 1.13 msec for τ1 and 40.3 ± 3.34 msec for τ2, the ratio between the amplitude coefficients being 0.67 ± 0.06. In the presence of TTX, GABAergic IPSCs showed kinetics indistinguishable from those in control saline; 10-to-90% rise time was 0.93 ± 0.2 msec, and biexponential decays had time constants of τ1, 7 ± 0.6 msec and τ2, 40.4 ± 8.3 msec (n = 4).
Glycinergic IPSCs were characterized by much slower decays, as illustrated by the example in Figure 4B, which shows the average of 182 glycinergic IPSCs. The 10-to-90% rise time of this averaged IPSC was 0.89 msec, and the decay phase could be approximated by two exponentials with values for τ1 and τ2 of 20 and 80 msec, respectively (the ratio between the amplitude coefficients was 0.53). In contrast to the GABAergic IPSCs, in this second class of IPSCs the time course parameters showed a marked diversity from cell to cell. Thus in four RGCs the 10-to-90% rise time of averaged IPSCs varied between 0.47 and 1.12 msec (mean ± SEM, 0.78 ± 0.14), the fast component of the decay ranged from 4.8 to 65 msec (mean τ1, 25.2 ± 13.68), and the slow component varied between 80 and 285 msec (mean τ2, 147.75 ± 46.62), the ratio between the amplitude coefficients, A2/(A2 + A1), being 0.54 ± 0.08.
As mentioned before, RGCs also showed EPSCs blocked by bath application of 10 μm CNQX. Their time course was drastically different from that of IPSCs, as shown by the averaged trace in Figure5C. Note the difference in time scales.
Comparative pharmacology of the responses induced by GABA and glycine
With the purpose of establishing the specificity of various antagonists on RGCs of rat retinal slices, we performed a series of experiments in which GABA or glycine were bath-applied, and the effects of bath application of either GABA or glycine antagonists on the responses to these transmitters and on the two classes of IPSCs were compared.
The first interesting observation of these experiments performed in RGCs showing either GABAergic or glycinergic IPSCs is that all of the cells analyzed responded to the application of both transmitters independently of the nature of their synaptic input, i.e., that all RGCs were endowed with both GABAA and glycinergic receptors. Similar results were reported previously in cultures of mammalian RGCs (Tauck et al., 1988; Cohen et al., 1989).
The histograms in Figure 5 summarize the results of our experiments. The left panel shows that bath application of strychnine (0.3 μm) does not affect at all the currents induced by bath-applied GABA (20 μm), whereas when the strychnine concentration was increased to 2 μm, a 57% blockade of the GABA-induced currents was obtained. Bicuculline (3 μm) was more effective, because it blocked GABA-induced currents by 75% whereas SR95531 (3 μm) completely blocked the GABA-induced responses. The right panel of Figure5A shows the effects of antagonists on the currents induced by bath-applied glycine (50 μm). These currents were blocked by 87% by a low concentration of strychnine (0.3 μm) whereas SR95531 (3 μm), which totally blocked the GABA-induced responses, did not affect glycine-induced currents. Bicuculline (3 μm) had a very weak effect on glycine-induced currents, but when its concentration was increased to 10 μm, it could block these responses by ∼15%. Figure5B shows pooled data on the effects of GABA and glycine antagonists on synaptic activity analyzed, as detailed before, in terms of the sum of IPSCs amplitude per unit of time. In view of the antagonist profile shown in Figure 5A, we conclude that the pharmacological criteria used in previous sections to distinguish GABAergic from glycinergic IPSCs can be applied safely in the study of RGCs inhibitory synapses.
RGCs with mixed synaptic inputs
In six RGCs the recordings showed IPSCs of both GABAergic and glycinergic nature, as evidenced by their characteristic electrophysiological features. In these six cells applications of bicuculline (3 μm) and strychnine (0.3 μm) helped us to ascertain the mixed nature of the synaptic input. An example is shown in Figure 5C in which application of bicuculline (3 μm) blocks nearly one-half of the synaptic events (Fig. 5Cb) while strychnine (0.3 μm) blocks the remaining IPSCs (Fig. 5Cc).
Ionic selectivity of GABAergic and glycinergic receptors
Figure 6 illustrates examples from a series of experiments in which we analyzed the Cl−dependence of the responses to local applications of GABA and glycine. In Figure 6A1, in symmetrical Cl−conditions the holding potential was driven to levels ranging between −80 to +60 mV, and GABA (20 μm) was puff-applied (see Materials and Methods). The puff applications of GABA elicited inward currents at negative holding potentials, which reversed polarity at membrane potentials beyond 0 mV. As shown by the peak current-to-voltage (I–V) relations in Figure6A2, GABA-induced currents presented marked voltage-dependent outward rectification, both in symmetrical Cl− solutions (open circles) or when most of the intracellular Cl− was replaced by gluconate (open triangles). Rectifying I–Vrelations were observed in all RGCs tested with GABA puffs, as previously reported for GABA-gated Cl− channels in hippocampal neurons (Gray and Johnston, 1985) and in spinal cord neurons (Bormann et al., 1987). In five RGCs recorded in symmetrical Cl− conditions, currents induced by puff-applied GABA had a reversal potential of 4.8 ± 1.8 mV, whereas in five cells studied with low intracellular Cl−, the reversal potential was −57 ± 1.5 mV. Both values are close to those predicted by the Nernst equation for a Cl−-selective conductance. GABAergic IPSCs recorded at different membrane potentials in symmetrical Cl−(Fig. 6A3) share the main features of the agonist-induced currents, namely strong voltage-dependent outward rectification and reversal potential close to the predicted value for a Cl−-selective conductance.
Fig. 6.

Cl−-selective GABAA and glycine receptors in ganglion cells.A1, Current responses to 250 msec puffs of 10 μm GABA obtained in a cell dialyzed with CsCl at membrane potentials ranging from −80 to +60 mV. In all of the experiments in which agonist-evoked currents were studied as a function of membrane potential, the holding potential was held at −60 mV, changed to the desired value 2 sec before the puff application, and maintained at that level for 2 additional sec while data were acquired. The current previous to the agonist application was subtracted from the traces.A2, Relation between membrane voltage and the peak of the GABA-induced current for the experiment shown in A1(○) and for a different cell dialyzed with low Cl− (▵). A3, GABAergic IPSCs recorded at the membrane potentials, indicated at theleft of the traces for the cell shown inA1. B1, Representative responses to 150 msec puffs of 50 μm glycine obtained from a cell dialyzed with CsCl at membrane potentials ranging from −100 to +60 mV.B2, The I–V relation for the cell shown in A2 (○) and for a different cell dialyzed with low Cl− (▵). The experimental protocol was similar to that described for A. B3, Glycinergic IPSCs recorded in the cell shown in B1 at different holding potentials, indicated at the left of the traces.
Similar experiments were performed for glycinergic currents. Representative currents elicited by puffs of glycine (50 μm) at different holding potentials are shown in Figure6B1 for a RGC recorded in symmetrical Cl− concentrations. In contrast to those observed for the responses to GABA, glycine-induced currents showed no voltage-dependent rectification in symmetrical Cl−(Fig. 6B2, open circles) but had some rectification in low intracellular Cl− (Fig.6B2, open triangles). Furthermore, the time course of recovery of the glycine-evoked currents was much slower than that of the currents induced by GABA. As in the case of responses to GABA, the Cl− selectivity of the glycine currents was confirmed by reversal potential determinations, which were 4.9 ± 1.2 mV (n = 5) in symmetrical Cl−conditions and −55.5 ± 1.3 mV (n = 5) in cells dialyzed with Cs gluconate. Glycinergic IPSCs reversed close to the expected reversal potential for Cl− in symmetrical Cl− conditions, as shown by the example illustrated in Figure 6B3.
DISCUSSION
Differences in RGCs synaptic inputs
The results presented here show that GABAergic and glycinergic IPSCs occur in RGCs. Nevertheless, it is not known to what extent the IPSCs observed in rat retinal slices, which are a common finding in slice preparations from different CNS regions, are attributable to the light-adapted conditions in which the experiments were performed.
The pharmacological dissection of inhibitory synaptic inputs was based on the specific block of GABAergic synaptic events by low concentrations (3 μm) of SR95531 and bicuculline and of glycinergic IPSCs by 0.3 μm strychnine. Actually, higher concentrations of these compounds were shown in the present experiments, as in the previous ones of Cohen et al. (1989), to affect the responses to both amino acids. A distinct class of bicuculline-insensitive GABA receptors, the GABACreceptors, is present in several retinal neurons (for review, seeBormann and Feigenspan, 1995). Enz et al. (1996) have shown that mammalian RGCs lack GABAC ρ receptor subunits. In agreement, we find that all of the GABAergic IPSCs, as well as the responses to exogenous GABA, were blocked completely by bicuculline, thus ruling out the presence of functional GABAC receptors in RGCs.
Despite the presence of receptors to both amino acids in all RGCs examined, GABAergic synapses predominate in the majority of the RGCs analyzed. The wider distribution of GABAergic inputs among RGCs in comparison with the more restricted occurrence of the glycinergic ones may arise from differences in the dendritic field of the amacrine cells involved. As previously reported (see Vaney, 1990), glycine-accumulating amacrine cells in mammalian retinas have much narrower dendritic fields than GABAergic amacrines, which generally are endowed with medium or large dendritic fields. However, RGCs are a morphologically and functionally heterogeneous population (Wässle and Boycott, 1991), and inhibitory synaptic inputs may depend on RGC subtype and on the light conditions that determine which retinal circuits are active. Because no correlation between morphological type and/or response to light stimuli with the synaptic input has been established in the present work, we cannot elucidate this point.
GABAergic versus glycinergic IPSCs
There were marked differences in the properties of GABAergic and glycinergic IPSCs recorded from RGCs. The decay phase of glycinergic IPSCs, in contrast to that of GABAergic IPSCs, showed an important cell-to-cell variability. Different glycine receptor subunits (the α1, α2, α3, and β subunits) have been detected at the rat RGC layer by both immunocytochemical and RNA hybridization techniques (Greferath et al., 1994b; Koulen et al., 1996). An unequal distribution of these subunits among RGCs could contribute to the variation in the time course of decay of the glycinergic IPSCs (seeLegendre and Korn, 1994). Furthermore, the presence of visible current jumps on the decay phase, corresponding to closings of single channels, characterized glycinergic IPSCs. The single-channel conductance (∼54 pS) matches that of the most frequent subconductance state found via analysis of glycinergic IPSCs in spinal cord neurons (Takahashi and Momiyama, 1991) and in cerebellar Golgi cells (Dieudonné, 1995), as well as the estimates from single-channel recordings in spinal neurons (Bormann et al., 1987) and cerebellar granule cells (Kaneda et al., 1996). Single-channel currents trailed the IPSCs. This could arise either from persistence of transmitter in the synaptic cleft or from glycine receptors undergoing reopenings after desensitization in the agonist-bound configuration, as recently proposed for GABAAreceptors (Jones and Westbrook, 1995).
Despite the observed variability in their decay kinetics, glycinergic IPSCs were significantly slower than GABAergic ones. This situation differs from that found in the spinal cord, where GABAergic synaptic potentials have slower decays than glycinergic ones (Yoshimura and Nishi, 1995). In RGCs, glycinergic IPSCs decay was biexponential, the slower time constant falling into the hundreds of milliseconds range. This is in sharp contrast to the very fast monoexponential decay in zebra fish brain (τ, 4–6 msec; Legendre and Korn, 1994). The presence of the α2 subunit in RGCs of adult rats (Koulen et al., 1996) could account for the observed prolonged decay, because this subunit confers long open times to glycine-gated currents (Takahashi et al., 1992). Furthermore, in the spinal cord a developmental shift from α2 to α1 is paralleled by a shortening of the decay of IPSCs (Takahashi et al., 1992). The high sensitivity to strychnine of RGCs glycinergic IPSCs is surprising because the α2 subunit is considered to be responsible for the relative immunity to strychnine poisoning in neonatal rats, and its disappearance during development is associated with an increase in sensitivity of the glycine receptor to this alkaloid (Kuhse et al., 1990).
The decay of GABAergic IPSCs in retinal ganglion cells was also biexponential. The observed values for the fast and slow time constants are in the same range as those for hippocampal granule cells (Edwards et al., 1990), cerebellar stellate cells (Llano and Gerschenfeld, 1993), and cerebellar granule cells (Tia et al., 1996). These values differ from those reported by Jones and Westbrook (1995) in their study of cultured hippocampal neurons, which have GABAergic IPSCs with much slower biexponential decays; the authors interpreted IPSCs decay as arising from receptor desensitization.
Effects of TTX and Ca2+-free media
Another striking difference between the two classes of IPSCs concerns their behavior in the presence of TTX. The frequency of GABAergic IPSCs was reduced markedly by TTX, whereas that of glycinergic IPSCs remained unaffected. Therefore, the release of transmitter from glycinergic amacrine cells responsible for the generation of IPSCs in our RGCs population does not depend on the activation of voltage-gated Na+ channels. Although glycinergic amacrine AII cells are able to discharge Na+ action potentials, their electrotonic compactness may allow transmitter release without the requirement of action potential propagation (Boos et al., 1993). It is also evident that a fraction of the GABAergic IPSCs is generated by transmitter released via a mechanism independent of voltage-gated Na+ channels. The fact that both TTX-resistant GABAergic IPSCs and all of the glycinergic IPSCs were blocked by Ca2+-free media suggests that transmitter can be released either by local depolarization inducing Ca2+ influx into amacrine cell dendrites or by Ca2+ influx at resting membrane potential. In synaptic terminals from goldfish retinal bipolar cells there is a considerable calcium influx through L-type Ca2+channels at membrane potentials close to −55 mV (Kobayashi and Tachibana, 1995). A similar mechanism may operate in amacrine cells, because their resting membrane potential is close to −60 mV (Boos et al., 1993), and it has been shown that transmitter release at amacrine–amacrine cell synapses in culture depends on L-type Ca2+ channels (Gleason et al., 1994).
In conclusion, in our recording (light-adapted) conditions GABAergic IPSCs in RGCs can be elicited either by Na+-dependent action potentials or by local Ca2+ influx, presumably of medium or large dendritic field GABAergic amacrine cells, whereas glycinergic IPSCs are generated by depolarization inducing Ca2+ influx in narrow field glycinergic amacrine cells.
Footnotes
This work was supported by the Max Planck Society and a von Humboldt postdoctoral fellowship to D. A. Protti. We are grateful to H. Wässle for his advice on the preparation of retinal slices. We thank A. Marty, C. Pouzat, and H. von Gersdorff for discussions and comments on this manuscript.
Correspondence should be addressed to Dr. Isabel Llano, Arbeitsgruppe Zelluläre Neurobiologie, Max-Planck-Institut für biophysikalische Chemie, Am Fassberg, 37070, Göttingen, Germany.
REFERENCES
- 1.Agardh EB, Bruun A, Ehinger B, Storm-Mathisen J. GABA immunoreactivity in the retina. Invest Ophthalmol. 1986;27:674–678. [PubMed] [Google Scholar]
- 2.Boos R, Schneider H, Wässle H. Voltage- and transmitter-gated currents of AII amacrine cells in a slice preparation of the rat retina. J Neurosci. 1993;13:2874–2888. doi: 10.1523/JNEUROSCI.13-07-02874.1993. [DOI] [PMC free article] [PubMed] [Google Scholar]
- 3.Bolz J, Frumkes T, Voigt T, Wässle H. Action and localization of γ-aminobutyric acid in the cat retina. J Physiol (Lond) 1985a;362:369–393. doi: 10.1113/jphysiol.1985.sp015684. [DOI] [PMC free article] [PubMed] [Google Scholar]
- 4.Bolz J, Thier P, Voigt T, Wässle H. Action and localization of glycine and taurine in the cat retina. J Physiol (Lond) 1985b;362:395–413. doi: 10.1113/jphysiol.1985.sp015685. [DOI] [PMC free article] [PubMed] [Google Scholar]
- 5.Bormann J, Feigenspan A. GABAc receptors. Trends Neurosci. 1995;18:515–519. doi: 10.1016/0166-2236(95)98370-e. [DOI] [PubMed] [Google Scholar]
- 6.Bormann J, Hamill OP, Sakmann B. Mechanism of anion permeation through channels gated by glycine and γ-aminobutyric acid in mouse cultured spinal neurones. J Physiol (Lond) 1987;385:243–286. doi: 10.1113/jphysiol.1987.sp016493. [DOI] [PMC free article] [PubMed] [Google Scholar]
- 7.Brecha NC, Johnson D, Peichl L, Wässle H. Cholinergic amacrine cells contain glutamate decarboxylase and gamma-aminobutyrate reactivity. Proc Natl Acad Sci USA. 1988;85:6187–6189. doi: 10.1073/pnas.85.16.6187. [DOI] [PMC free article] [PubMed] [Google Scholar]
- 8.Chun MH, Wässle H. GABA immunoreactivity in the cat retina: electron microscopy. J Comp Neurol. 1989;279:55–67. doi: 10.1002/cne.902790106. [DOI] [PubMed] [Google Scholar]
- 9.Cohen BN, Fain GL, Fain MJ. GABA and glycine channels in isolated ganglion cells from goldfish retina. J Physiol (Lond) 1989;417:53–82. doi: 10.1113/jphysiol.1989.sp017828. [DOI] [PMC free article] [PubMed] [Google Scholar]
- 10.Davenger S, Ottersen OP, Storm-Mathisen J. Glutamate, GABA, and glycine in the human retina: an immunocytochemical investigation. J Comp Neurol. 1991;311:483–494. doi: 10.1002/cne.903110404. [DOI] [PubMed] [Google Scholar]
- 11.Dieudonné S. Glycinergic synaptic currents in Golgi cells of the rat cerebellum. Proc Natl Acad Sci USA. 1995;92:1441–1445. doi: 10.1073/pnas.92.5.1441. [DOI] [PMC free article] [PubMed] [Google Scholar]
- 12.Edwards FA, Konnerth A, Sakmann B. Quantal analysis of inhibitory synaptic transmission in the dentate gyrus of rat hippocampal slices: a patch-clamp study. J Physiol (Lond) 1990;430:213–249. doi: 10.1113/jphysiol.1990.sp018289. [DOI] [PMC free article] [PubMed] [Google Scholar]
- 13.Enz R, Brandstätter JH, Wässle H, Bormann J. Immunocytochemical localization of the GABAc receptor ρ subunits in the mammalian brain. J Neurosci. 1996;16:4479–4490. doi: 10.1523/JNEUROSCI.16-14-04479.1996. [DOI] [PMC free article] [PubMed] [Google Scholar]
- 14.Gleason E, Borges S, Wilson M. Control of transmitter release from retinal amacrine cells by Ca2+ influx and efflux. Neuron. 1994;13:1109–1117. doi: 10.1016/0896-6273(94)90049-3. [DOI] [PubMed] [Google Scholar]
- 15.Gray R, Johnston D. Rectification of single GABA-gated chloride channels in adult hippocampal neurons. J Neurophysiol. 1985;54:134–142. doi: 10.1152/jn.1985.54.1.134. [DOI] [PubMed] [Google Scholar]
- 16.Greferath U, Grünert U, Müller F, Wässle H. Localization of GABAA receptors in the rabbit retina. Cell Tissue Res. 1994a;276:295–307. doi: 10.1007/BF00306115. [DOI] [PubMed] [Google Scholar]
- 17.Greferath U, Brandstätter H, Wässle H, Kirsch H, Kuhse J, Grünert U. Differential expression of glycine receptor subunits in the retina of the rat: a study using immunohistochemistry and in situ hybridization. Vis Neurosci. 1994b;11:721–729. doi: 10.1017/s0952523800003023. [DOI] [PubMed] [Google Scholar]
- 18.Grünert U, Wässle H. Immunocytochemical localization of glycine receptors in the mammalian retina. J Comp Neurol. 1993;335:523–537. doi: 10.1002/cne.903350405. [DOI] [PubMed] [Google Scholar]
- 19.Grünert U, Greferath U, Boycott BB, Wässle H. Parasol (Pα) ganglion cells of the primate fovea: immunocytochemical staining with antibodies against GABAA receptors. Vision Res. 1993;33:1–14. doi: 10.1016/0042-6989(93)90052-x. [DOI] [PubMed] [Google Scholar]
- 20.Hamill OP, Marty A, Neher E, Sakmann B, Sigworth F. Improved patch-clamp techniques for high-resolution current recording from cells and cell-free membrane patches. Pflügers Arch. 1981;391:85–100. doi: 10.1007/BF00656997. [DOI] [PubMed] [Google Scholar]
- 21.Hendrickson AE, Koontz MA, Pourcho RG, Sarthy PV, Goebel DJ. Localization of glycine-containing neurons in the Macaca monkey retina. J Comp Neurol. 1988;273:473–487. doi: 10.1002/cne.902730404. [DOI] [PubMed] [Google Scholar]
- 22.Horikawa K, Armstrong W. A versatile means of intracellular labeling: injection of biocytin and its detection with avidin conjugates. J Neurosci Methods. 1988;25:1–11. doi: 10.1016/0165-0270(88)90114-8. [DOI] [PubMed] [Google Scholar]
- 23.Hughes TE, Carey RG, Victorica J, de Blas AL, Karten H. Immunochemical localization of GABAA receptors in the retina of the new world primate Saimiri sciureus. Vis Neurosci. 1989;2:565–581. doi: 10.1017/s0952523800003503. [DOI] [PubMed] [Google Scholar]
- 24.Hughes TE, Grünert U, Karten H. GABAA receptors in the retina of the cat: an immunohistochemical study of whole mounts, sections, and dissociated cells. Vis Neurosci. 1991;6:229–238. doi: 10.1017/s0952523800006246. [DOI] [PubMed] [Google Scholar]
- 25.Ishida AT. The physiology of GABAA receptors. In: Miz RR, Marc RE, Sillito AM, editors. Progress in brain research, Vol 90. Elsevier; Amsterdam: 1992. pp. 29–45. [DOI] [PubMed] [Google Scholar]
- 26.Ishida AT, Cohen BN. GABA-activated whole-cell currents in isolated retina ganglion cells. J Neurophysiol. 1988;60:381–396. doi: 10.1152/jn.1988.60.2.381. [DOI] [PubMed] [Google Scholar]
- 27.Jones MV, Westbrook GL. Desensitized states prolong GABAA channel responses to brief agonist pulses. Neuron. 1995;15:181–191. doi: 10.1016/0896-6273(95)90075-6. [DOI] [PubMed] [Google Scholar]
- 28.Kaneda M, Farrant M, Cull-Candy SG. Whole-cell and single-channel currents activated by GABA and glycine in granule cells of the rat cerebellum. J Physiol (Lond) 1996;485:419–435. doi: 10.1113/jphysiol.1995.sp020739. [DOI] [PMC free article] [PubMed] [Google Scholar]
- 29.Kobayashi K, Tachibana M. Ca2+ regulation in the presynaptic terminals of goldfish retinal bipolar cells. J Physiol (Lond) 1995;483:79–94. doi: 10.1113/jphysiol.1995.sp020569. [DOI] [PMC free article] [PubMed] [Google Scholar]
- 30.Koontz MA, Hendrickson AE. Distribution of GABA immunoreactivity amacrine cell synapses in the inner plexiform layer of macaque monkey retina. Vis Neurosci. 1990;5:17–28. doi: 10.1017/s0952523800000043. [DOI] [PubMed] [Google Scholar]
- 31.Koontz MA, Hendrickson LE, Brace ST, Hendrickson AE. Immunocytochemical localization of GABA and glycine in amacrine and displaced amacrine cells of macaque monkey retina. Vision Res. 1993;33:2617–2628. doi: 10.1016/0042-6989(93)90220-q. [DOI] [PubMed] [Google Scholar]
- 32.Koulen P, Sassoé-Pognetto M, Grünert U, Wässle H. Selective clustering of GABAA and glycine receptors in the mammalian retina. J Neurosci. 1996;16:2127–2140. doi: 10.1523/JNEUROSCI.16-06-02127.1996. [DOI] [PMC free article] [PubMed] [Google Scholar]
- 33.Kuhse J, Schmieden V, Betz H. A single amino acid exchange alters the pharmacology of neonatal rat glycine receptor subunit. Neuron. 1990;5:867–873. doi: 10.1016/0896-6273(90)90346-h. [DOI] [PubMed] [Google Scholar]
- 34.Legendre P, Korn H. Glycinergic inhibitory synaptic currents and related receptor channels in the zebra fish brain. Eur J Neurosci. 1994;6:1544–1557. doi: 10.1111/j.1460-9568.1994.tb00545.x. [DOI] [PubMed] [Google Scholar]
- 35.Llano I, Gerschenfeld HM. Inhibitory synaptic currents in stellate cells of rat cerebellar slices. J Physiol (Lond) 1993;468:177–200. doi: 10.1113/jphysiol.1993.sp019766. [DOI] [PMC free article] [PubMed] [Google Scholar]
- 36.Marc RE, Liu W-LS. [3H]glycine-accumulating neurons of the human retina. J Comp Neurol. 1985;232:241–260. doi: 10.1002/cne.902320209. [DOI] [PubMed] [Google Scholar]
- 37.Mosinger JL, Yazulla S. Double-label analysis of GABA- and GAD-like immunoreactivity in the rabbit retina. Vision Res. 1987;27:23–30. doi: 10.1016/0042-6989(87)90139-8. [DOI] [PubMed] [Google Scholar]
- 38.Mosinger JL, Yazulla S, Studholme KM. GABA-like immunoreactivity in the vertebrate retina: a species comparison. Exp Eye Res. 1986;42:631–644. doi: 10.1016/0014-4835(86)90052-7. [DOI] [PubMed] [Google Scholar]
- 39.Osborne NN, Patel S, Beaton DW, Neuhoff V. GABA neurones in retinas of different species and their postnatal development in situ and in culture in the rabbit retina. Cell Tissue Res. 1986;243:117–123. doi: 10.1007/BF00221859. [DOI] [PubMed] [Google Scholar]
- 40.Pourcho RG. Uptake of [3H]glycine and [3H]GABA by amacrine cells in the cat retina. Brain Res. 1980;198:333–346. doi: 10.1016/0006-8993(80)90748-9. [DOI] [PubMed] [Google Scholar]
- 41.Pourcho RG, Goebel DJ. Neuronal subpopulations in cat retina that accumulate the GABA agonist [3H]muscimol: a combined Golgi and autoradiographic study. J Comp Neurol. 1983;219:25–35. doi: 10.1002/cne.902190104. [DOI] [PubMed] [Google Scholar]
- 42.Pourcho RG, Owarczak MT. Glycine receptor immunoreactivity is localized at amacrine synapses in cat retina. Vis Neurosci. 1991;7:611–618. doi: 10.1017/s0952523800010397. [DOI] [PubMed] [Google Scholar]
- 43.Protti DA, Gerschenfeld HM, Llano I. Inhibitory synaptic currents and agonist-induced responses in ganglion cells from rat retinal slices. Soc Neurosci Abstr. 1996;22:786. [Google Scholar]
- 44.Rörig B, Grantyn R. Glutamatergic and GABAergic synaptic currents in ganglion cells from isolated retinae of pigmented rats during postnatal development. Dev Brain Res. 1993;74:98–110. doi: 10.1016/0165-3806(93)90088-r. [DOI] [PubMed] [Google Scholar]
- 45.Saito H. Pharmacological and morphological differences between X- and Y-type ganglion cells in the cat’s retina. Vision Res. 1983;23:1299–1308. doi: 10.1016/0042-6989(83)90105-0. [DOI] [PubMed] [Google Scholar]
- 46.Sarthy PV, Fu M. Localization of l-glutamic acid decarboxylase mRNA in cat retinal cells by in situ hybridization. J Comp Neurol. 1989;288:593–600. doi: 10.1002/cne.902880406. [DOI] [PubMed] [Google Scholar]
- 47.Takahashi T, Momiyama A. Single-channel currents underlying glycinergic inhibitory postsynaptic responses in spinal neurons. Neuron. 1991;7:965–969. doi: 10.1016/0896-6273(91)90341-v. [DOI] [PubMed] [Google Scholar]
- 48.Takahashi T, Momiyama A, Hirai K, Hishinuma F, Akagi H. Functional correlation of fetal and adult forms of glycine receptors with developmental changes in inhibitory synaptic receptor channels. Neuron. 1992;9:1155–1161. doi: 10.1016/0896-6273(92)90073-m. [DOI] [PubMed] [Google Scholar]
- 49.Tauck DL, Frosch MP, Lipton SA. Characterization of GABA- and glycine-induced currents of solitary rodent retinal ganglion cells in culture. Neuroscience. 1988;27:193–203. doi: 10.1016/0306-4522(88)90230-8. [DOI] [PubMed] [Google Scholar]
- 50.Taylor WR, Chen E, Copenhagen DR. Characterization of spontaneous excitatory synaptic currents in salamander retinal ganglion cells. J Physiol (Lond) 1995;486:207–221. doi: 10.1113/jphysiol.1995.sp020803. [DOI] [PMC free article] [PubMed] [Google Scholar]
- 51.Tia S, Wang JF, Kotchabhadki N, Vicini S. Developmental changes of inhibitory synaptic currents in cerebellar granule neurons: role of GABAA receptor α6 subunit. J Neurosci. 1996;16:3630–3640. doi: 10.1523/JNEUROSCI.16-11-03630.1996. [DOI] [PMC free article] [PubMed] [Google Scholar]
- 52.Vaney DI. The mosaic of amacrine cells in the mammalian retina. In: Osborne NN, Chader GJ, editors. Progress in retinal research, Vol 9. Pergamon; Oxford: 1990. pp. 49–100. [Google Scholar]
- 53.Vaney DI, Young HM. GABA-like reactivity in NADPH-diaphorase amacrine cells of the rat retina. Brain Res. 1988;474:380–385. doi: 10.1016/0006-8993(88)90455-6. [DOI] [PubMed] [Google Scholar]
- 54.Vincent P, Marty A. Neighboring cerebellar Purkinje cells communicate via retrograde inhibition of common presynaptic neurons. Neuron. 1993;11:885–893. doi: 10.1016/0896-6273(93)90118-b. [DOI] [PubMed] [Google Scholar]
- 55.Wässle H, Boycott BB. Functional architecture of the mammalian retina. Physiol Rev. 1991;71:447–480. doi: 10.1152/physrev.1991.71.2.447. [DOI] [PubMed] [Google Scholar]
- 56.Wässle H, Chun MH. GABA-like immunoreactivity in the cat retina: light microscopy. J Comp Neurol. 1989;279:43–54. doi: 10.1002/cne.902790105. [DOI] [PubMed] [Google Scholar]
- 57.Wässle H, Chun MH, Muller F. Amacrine cells in the ganglion cell layer of the retina. J Comp Neurol. 1987;265:391–408. doi: 10.1002/cne.902650308. [DOI] [PubMed] [Google Scholar]
- 58.Yoshimura M, Nishi S. Primary afferent-evoked glycine- and GABA-mediated IPSPs in substantia gelatinosa neurones in the rat spinal cord in vitro. J Physiol (Lond) 1995;482:29–38. doi: 10.1113/jphysiol.1995.sp020497. [DOI] [PMC free article] [PubMed] [Google Scholar]
- 59.Zhou ZJ, Marshak DW, Fain GL. Amino acid receptors of midget and parasol ganglion cells in primate retina. Proc Natl Acad Sci USA. 1994;91:4907–4911. doi: 10.1073/pnas.91.11.4907. [DOI] [PMC free article] [PubMed] [Google Scholar]