

Abstract
The expression of multiple classes of voltage-dependent calcium channels (VDCCs) allows neurons to tailor calcium signaling to functionally discrete cellular regions. In the developing hippocampus a central issue is whether the expression of VDCC subtypes plays a role in key phases such as migration and synaptogenesis. Using radioligand binding and immunoblotting, we show that some N-type VDCCs exist before birth, consistent with a role in migration; however, most N-VDCC subunit expression is postnatal, coinciding with synaptogenesis. Immunoprecipitation studies indicate that the increased expression of N-VDCCs in early development occurs without subunit switching because there is no change in the fraction of β3 subunits in the N-VDCC α1B–β3 heteromers. Fluorescence imaging of cell surface N-VDCCs during this period reveals that N-VDCCs are expressed on somata before dendrites and that this expression is asynchronous between different subfields of the hippocampus (CA3–CA4 before CA1–CA2 and dentate gyrus). Our data argue that N-VDCC expression is an important cue in the genesis of synaptic transmission in discrete hippocampal subfields.
Keywords: rat, development, hippocampus, pyramidal neurons, voltage-dependent calcium channels, subunits, dendrites, ω-conotoxin
In neurons, voltage-dependent Ca2+ channels (VDCCs) orchestrate diverse functions, including neurotransmitter release (Wheeler et al., 1994; Dunlap et al., 1995; Scholz and Miller, 1995), excitability (Llinás and Sugimori, 1979; Llinás, 1988), and gene expression (Bading et al., 1993). Growing evidence indicates that VDCCs are also important in establishing the functional cytoarchitecture of the brain (Llinás and Sugimori, 1979; Mills and Kater, 1990; Vigers and Pfenninger, 1991;Komura and Rakic, 1992; Johnson and Deckwerth, 1993; Spitzer et al., 1994), but their precise role is uncertain. In situhybridization studies have revealed mRNAs encoding VDCCs, which mediate high voltage-activated (HVA) Ca2+ currents in those regions of pre- and postnatal brain undergoing active proliferation and migration (Tanaka et al., 1995). In contrast, electrophysiologyin vitro and in vivo suggests that neurons only express HVA currents once the cells are polarized and are no longer migrating (Peacock and Walker, 1983; Yaari et al., 1987; Reece and Schwartzkroin, 1991; Scholz and Miller, 1995). One explanation is that VDCC expression is phasic and mirrors, or even orchestrates, key developmental events (Jacobson, 1991). Unfortunately, how VDCCs might contribute to such events is complicated by their diversity.
Until recently, VDCCs were classified according to their biophysical and pharmacological characteristics into T, L, N, or P/Q subtypes. Molecular cloning, expression, and biochemical studies now show that this scheme is too simplistic (Hofmann et al., 1994; Dunlap et al., 1995). In brain, VDCCs are large (>400 kDa) heteromers composed of an α1, α2/δ, and β subunit (Wagner et al., 1988; Hell et al., 1993, 1994; Witcher et al., 1993;Hofmann et al., 1994; Leveque et al., 1994). Expression of VDCC gene products in Xenopus oocytes (Mori et al., 1991; Williams et al., 1992a) or transfected cells (Williams et al., 1992b; Fujita et al., 1993; Stea et al., 1993) shows that α1 subunits contain the ion channel pore, whereas the auxiliary α2/δ and β subunits modulate optimal cell surface expression and channel kinetics (Brust et al., 1993; Castellano et al., 1993; Stea et al., 1993; Isom et al., 1994; Olcese et al., 1994). In rat brain, the α1 subunits are encoded by at least five discrete classes (A–E) of cDNA. Although α1Aand α1B correspond to P/Q- and N-VDCCs, respectively (Westenbroek et al., 1992, 1995; Witcher et al., 1993; Hell et al., 1994; Stea et al., 1994), the α1C and α1Dclasses form L-type VDCCs (Hell et al., 1993). Further diversity of VDCCs arises through multiple genes encoding the β subunits and, in many cases, alternative splicing of the α1 and β RNA transcripts (Hofmann et al., 1994; Dunlap et al., 1995). In contrast, α2/δ subunits exist as single splice variants in rat brain (Kim et al., 1992). What function does such diversity serve? Expression studies indicate that the precise complexion of gene products in the α1, α2/δ, and β-VDCC heteromers defines their pharmacology and biophysical characteristics (Hofmann et al., 1994; Dunlap et al., 1995). However, specific VDCC subtypes also have unique patterns of expression in discrete brain regions and even within individual neurons (Jones et al., 1989; Robitaille et al., 1990; Westenbroek et al., 1990, 1992,1995; Cohen et al., 1991; Hell et al., 1993; Haydon et al., 1994; Mills et al., 1994; Elliott et al., 1995). Thus, neurons may exploit VDCC diversity to tailor voltage-dependent Ca2+ influx in discrete functional compartments (Elliott et al., 1995). Consequently, we hypothesize that changes in functional demand experienced by developing neurons could be reflected in the dynamics of specific VDCC complex expression.
We now provide a comprehensive analysis of the expression of the neuron-specific N-type VDCC from embryonic to adult stages in rat hippocampus. This VDCC has important roles in neurotransmitter release (Robitaille et al., 1990; Cohen et al., 1991; Haydon et al., 1994;Wheeler et al., 1994; Dunlap et al., 1995; Scholz and Miller, 1995), dendritic function (Mills et al., 1994), and neuronal migration (Komura and Rakic, 1992). Via expression (Dubel et al., 1992; Williams et al., 1992b; Brust et al., 1993; Fujita et al., 1993; Stea et al., 1993) and biochemical studies (Wagner et al., 1988; Westenbroek et al., 1992;Witcher et al., 1993; Leveque et al., 1994; Scott et al., 1996), it seems that most N-VDCCs in adult brain are α1B, α2/δ, and β3 heteromers, although subpopulations containing β1 or β4 rather than β3 subunits also may exist (Scott et al., 1996). Using site-directed antibodies and selective fluorescent and radioactive labels, we have found that our data support a significant role for N-VDCCs in the development of the nervous system.
MATERIALS AND METHODS
Synthetic peptides. Peptides corresponding to residues 852–868 of the α1B (Dubel et al., 1992) sequence (GenBank accession number M92905) and residues 1–15 of the β3 (Castellano et al., 1993) sequence (GenBank accession number M88751), plus a C-terminal cysteine for coupling, were synthesized by Vetrogen (London, Ontario, Canada). The identity of the peptides was confirmed by amino acid analysis and mass spectroscopy [(M)+2, m/z = 1017 and (M)+1,m/z = 1829 for the α1B and β3 peptides, respectively].
Preparation of antibodies. Peptides were coupled to keyhole limpet hemocyanin with the heterobifunctional cross-linkerm-maleimidobenzoyl-N-hydroxysulfosuccinimide ester (sulfo-MBS; Pierce, Rockford, IL), and the conjugates were dialyzed against PBS. After New Zealand White rabbits were immunized with the conjugates (Division of Comparative Medicine, University of Toronto), antisera were collected and the IgG fraction was enriched by using MAPS affinity chromatography (Bio-Rad, Mississauga, Ontario, Canada). Throughout, antisera were characterized by ELISA and immunoblotting (see below).
Membrane preparation. Cortical membranes were prepared (Jones and So, 1993) from Wistar rats (timed-pregnant; Harlan Sprague Dawley, Indianapolis, IN) at E16, E18, and postnatal (P) days 0 (birth), 1.5, 2.5, 4, 6, 10, 16, 25, and 40. Hippocampal membranes were prepared likewise except that E16 tissue was omitted because of the lack of definition (Altman and Bayer, 1990a–c; Jacobson, 1991). All membranes were frozen and stored in liquid N2. To provide adequate tissue, we separated animals younger than P2.5 into three groups (>3 pups/group) according to littermate.
Determination of N-type calcium channels. N-VDCCs were determined by radioligand binding with 125I-labeled ω-conotoxin ([125I]ω-CgTx) (81.4 TBq/mmol; DuPont NEN, Boston, MA) (Cruz and Olivera, 1986; Jones and So, 1993;Mills et al., 1994). In developmental binding assays membranes from at least three separate animals (>P2.5) or groups of animals (<P2.5; see above) were analyzed. Specific binding was determined by subtracting nonspecifically bound radioactivity (defined as that in the presence of 1 μm unlabeled ωCgTx) from total bound radioactivity.
Solubilization and immunoprecipitation. Membranes were radiolabeled with [125I]ω-CgTx (12.5 kBq/mg membrane protein), 1 nm final concentration, in buffer A [10 mm HEPES-NaOH, pH 7.4, 0.1 m NaCl, and 0.2 mg/ml BSA plus fresh protease inhibitors (0.75 mmbenzamidine and 0.1 mm PMSF)] for 15 min at 22°C. The mixture was centrifuged at 100,000 × g for 45 min at 4°C to separate bound and free label, and the pellet was solubilized (at 1 mg/ml protein) by resuspension in 10 mm HEPES-NaOH, pH 7.4, 1.0 m NaCl, and 1% (w/v) digitonin (Wako Chemicals, Neuss, Germany) plus fresh protease inhibitors for 45 min at 4°C. After centrifuging (100,000 × g for 45 min at 4°C) to remove insoluble material, the solubilized membranes were diluted 10-fold with buffer A. Immunoprecipitations were performed by mixing protein A– agarose (or streptavidin–agarose for biotinylated α1B antibodies) pre-equilibrated in buffer D [buffer A containing 0.1% (w/v) digitonin] with the appropriate antiserum for 6 hr at 4°C. The protein A–agarose–antibody complexes (100 μl of 50% slurry) were mixed with the labeled solubilizate and rocked gently for 12 hr at 4°C. Immune complexes were harvested by centrifugation and washed three times with a 20-fold excess of buffer D, and then the radioactivity in the pellets was determined by gamma counting. For competition analysis the primary antisera were incubated with the appropriate peptides (25 μm in blocking solution) for at least 45 min.
Gel electrophoresis and immunoblotting. Protein samples were heated in SDS sample buffer containing β-mercaptoethanol (α2/δ and β3 blots) or dithiothreitol (α1B blots), and the proteins were resolved by electrophoresis on 5 or 7.5% SDS-polyacrylamide gels (Laemmli, 1970). The proteins were transferred electrophoretically to nitrocellulose (0.45 μm; Towbin et al., 1979), blocked in Tris-buffered saline (TBS) containing 5% (w/v) nonfat dried milk, and probed with the appropriate MAPS-purified antibodies diluted in blocking solution (anti-α1B, 2–8 μg/ml; anti-β3, 1–4 μg/ml; anti-α2/δ, 1:2000). After washing in 3× TTBS [TBS containing 0.05% (v/v) Tween-20] and 3× TBS (15 min/wash), the blots were treated with the appropriate secondary antibodies conjugated to horseradish peroxidase (1:4000–12,000; in blocking solution). After 2 hr the blots were rewashed and immunoreactive proteins were detected by enhanced chemiluminescence (ECL; Amersham, Oakville, Ontario, Canada). To confirm competition by peptides, we routinely exposed blots overnight. Densitometric analysis of films was performed with a Bio-Rad Model GS-670 imaging densitometer. Molecular weights were determined with prestained markers (Kaleidoscope, Bio-Rad).
Confocal imaging of N-type calcium channels in brain slices.Hippocampal slices, 200–250 μm thick, were sectioned from E18 to adult Wistar rats in ice-cold artificial cerebrospinal fluid (ACSF) solution (in mm): 124 NaCl, 26 NaHCO3, 3 KCl, 1.25 Na2HPO4, 2 CaCl2, 2 MgCl2, and 10d-glucose. After incubating in ACSF bubbled with 95% O2/5% CO2 for 1 hr at 20°C, individual sections were treated for 30–45 min with 1.0 μm ω-CgTx or 0.5–1.0 μmmonofluoresceinated ω-CgTx (Fl-ω-CgTx) prepared and purified as described previously (Mills et al., 1994) in ACSF bubbled with 95% O2/5% CO2 at or below room temperature. Then slices were rinsed in ACSF, fixed overnight in 4% paraformaldehyde, dehydrated, cleared in methylsalicylate, and mounted in Mowiol. Individual pyramidal neurons in Fl-ω-CgTx-labeled slices were outlined by filling with the intracellular dye Lucifer yellow (0.1% in ACSF; Molecular Probes, Eugene, OR) introduced through patch-clamp electrodes (Mills et al., 1994) before fixation. Labeled slices were viewed with an inverted scanning confocal microscope (Bio-Rad MRC-600) equipped with an argon ion laser (ILT), using the fluorescein filter set and either fluor (10× and 20×) or planapo (60×) objectives, as detailed earlier (Mills et al., 1994). Lucifer yellow fills were visualized by identical optics. Digitized images were cropped, and in some cases colorized, using Photoshop 3.0 software (Adobe Systems, Mountainview, CA) and displayed without any further manipulation.
RESULTS
Ontogeny of N-VDCC complexes determined by radioligand binding
Expression of N-VDCCs was examined first through the binding of a radioiodinated analog of the selective N-channel ligand ω-conotoxin ([125I]ω-CgTx) (Cruz and Olivera, 1986) to membranes from rats at different stages in development (Fig.1). Specific binding was detected in both hippocampus and cortex even at the earliest times examined (E18 or E16, respectively). In cortical membranes, binding increased 10-fold between E16 and P25. From E16 to P10, binding increased at a constant rate (0.024 pmol/mg per day) and thereafter slowly leveled off until it reached a plateau value (0.55 pmol/mg) at P25 characteristic of the adult level. Binding also increased in hippocampal membranes but in a more complex manner. Until P6, the rate was similar to that in E16–P10 cortex (0.025 pmol/mg per day). After P6, binding increased more gradually, reached a peak at P16, and thereafter showed a modest decline to adult levels. The ages at which 50% of the maximal binding (E0.5) seen within the first 6 weeks of birth occurred were 7.0 and 3.5 d for cortex and hippocampus, respectively. Direct assays of the [125I]ω-CgTx–N-VDCC interaction (Fig.2) showed that these binding changes reflected developmental differences in N-VDCC density rather than toxin binding affinities. Because the ω-CgTx binding assay is not a true equilibrium reaction (Jones and So, 1993), the affinities were obtained by direct assay of the kinetics of toxin association with, and dissociation from, membranes prepared from P0 and P40 hippocampi. At both P0 and P40, [125I]ω-CgTx binding conformed to a simple bimolecular reaction, for which the kinetics of association (kon = 3.0 × 10⁸l · mol−1 · min−1 at P0 and P40) or dissociation [koff = 5.8 × 10⁻⁴ · min−1(P0) and 5.3 × 10⁻⁴· min−1 (P40)] were essentially identical and gave very similar Kd values [1.9 pm(P0) and 1.8 pm (P40)].
Fig. 1.

Expression of N-VDCCs in development determined by radioligand binding. Shown are ontogeny of [125I]ω-CgTx binding in cortical (▪) or hippocampal (•) rat brain synaptic membranes. Values (pmol/mg total protein) represent mean ± SEM (n = 4) except for P40, in which n = 7.
Fig. 2.
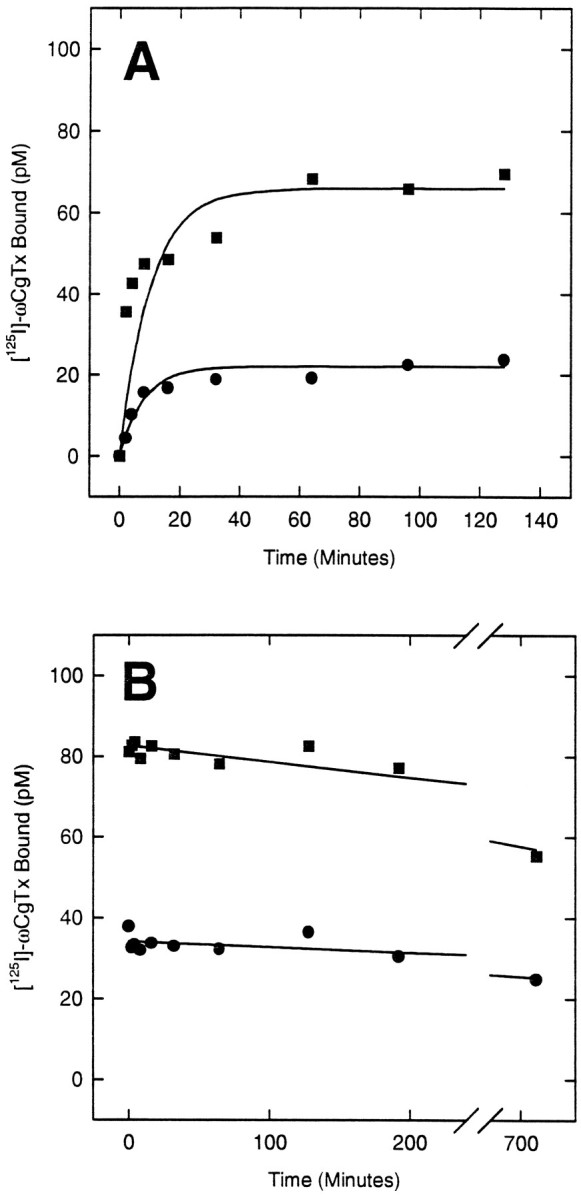
Kinetics of binding of [125I]ω-CgTx to hippocampal membranes from newborn (P0) or postnatal day 40 (P40) rats. A, Association kinetics. B, Dissociation kinetics. The rates of [125I]ω-CgTx binding or dissociation were determined by filtration assays (see Materials and Methods) for membranes at P0 (•) and P40 (▪). Curves were fit assuming bimolecular reaction kinetics (see Results) and using a nonlinear least-squares algorithm.
Antibody characterization
To resolve N-VDCC expression in detail, we raised specific polyclonal antibodies against the α1B and β3 subunits previously shown to form the major N-VDCC complex in brain (Wagner et al., 1988; Dubel et al., 1992; Westenbroek et al., 1992; Williams et al., 1992b; Brust et al., 1993; Fujita et al., 1993; Stea et al., 1993; Witcher et al., 1993; Leveque et al., 1994; Scott et al., 1996). High-titer antisera from rabbits immunized with synthetic peptides deduced from the coding sequences of α1B and β3 were assayed by immunoprecipitation and immunoblotting (Fig. 3). Antisera against α1B showed dose-dependent immunoprecipitation of up to 55% of the total [125I]ω-CgTx binding sites from detergent extracts of adult rat brain membranes (Fig. 3A). Control immunoprecipitations that used preimmune serum, α1Bantiserum pretreated with excess competing antigenic peptide (other peptides were ineffective; data not shown), or membranes treated with excess unlabeled ω-CgTx before labeling with [125I]ω-CgTx all failed to immunoprecipitate [125I]ω-CgTx binding sites, as expected (Fig.3A, inset). On immunoblots of adult rat brain, our α1B antibodies to a peptide within the α1Bdomain II–III linker recognized a band of approximateMr 220 kDa (Fig. 3B, lane 1), as reported previously (Westenbroek et al., 1992; Hell et al., 1994). This band is identical in size to that obtained with mAb CC18, an anti-N-VDCC monoclonal antibody raised against a fusion protein corresponding to the entire α1B II–III linker (Scott et al., 1996) (Fig. 3B, lane 3). The specificity of the α1B antibody was confirmed by our ability to eliminate the 220 kDa band by pretreatment of the α1B antiserum with competing antigenic peptide (Fig. 3B, lane 2) and by the persistence of the 220 kDa band on affinity purification of N-VDCCs, using wheat germ agglutinin and heparin–agarose (Fig.3B, lanes 4 and 5; peptide controls, lanes 6 and 7, respectively) (Westenbroek et al., 1992;Witcher et al., 1993). Antisera against β3 also proved effective in selectively immunoprecipitating [125I]ω-CgTx binding sites from detergent extracts of adult rat brain membranes (Fig. 3C andinset). The maximum fraction of [125I]ω-CgTx binding sites that could be immunoprecipitated by the β3 antibodies was consistently 76 ± 4% (n = 5) of that immunoprecipitated by α1B antibodies. On immunoblots, our β3antibody recognized a single band of Mr 55 kDa identical to that predicted from the β3 cDNA (Fig.3D).
Fig. 3.

Characterization of α1B(A, B) and β3(C, D) polyclonal antibodies.A, Immunoprecipitation of [125I]ω-CgTx-labeled N-VDCCs by anti-α1B antibodies. [125I]ω-CgTx-labeled N-VDCCs were solubilized with digitonin (see Materials and Methods), and their interaction with anti-α1B antibodies was demonstrated by the concentration dependence of immunoprecipitation. The data were fit assuming a saturation curve of the form y = 2254 × [1−exp(−x/134)], according to Westenbroek et al. (1992), as above. The value of 2254 dpm corresponds to 55% of the total [125I]ω-CgTx in each reaction.Inset, The specificity of the interaction between anti-α1B antibodies and solubilized [125I]ω-CgTx binding sites was determined by comparing the radioactivity in experimental immunoprecipitations (e) with that in control immunoprecipitations made with preimmune serum (a); control membranes, i.e., those pretreated with excess cold ω-CgTx before radiolabeling (b); competing antigenic peptide (25 μm) (c); and preimmune serum plus competing peptide antigen (25 μm) (d). B, Antibodies against α1B recognize a band of ∼220 kDa on immunoblots (lane 1) and several bands of lower molecular weight. Staining of the 220 kDa, but not the minor bands, was eliminated if the antibody was treated first with competing competing α1Bpeptide antigen (40 μm) (lane 2). The band recognized by our α1B antibodies is identical in molecular weight to that recognized by monoclonal antibodies to an α1B fusion protein (lane 3) (Gift of Dr. V. Lennon, Mayo Clinic, Rochester, MN), persists on purification of digitonin-solubilized N-VDCCs with heparin–agarose (lane 4), and is intensified after an additional wheat germ affinity chromatography step (lane 5). The 220 kDa bands in lanes 4 and 5 both can be displaced by pretreatment of the α1B antibody with competing peptide (lanes 6 and 7, respectively). Blots were analyzed with MAPS-purified α1B antibody (10 μg/ml) and detected by ECL (see Materials and Methods). C, Immunoprecipitation of [125I]ω-CgTx-labeled N-VDCCs by anti-β3 antibodies. Digitonin solubilized [125I]ω-CgTx-labeled N-VDCCs immunoprecipitated as described for anti-α1B antibodies (A, above), and the data were fit to the saturation equationy = 1717 × [1−exp(−x/48)], as above. The value 1717 dpm corresponds to 42% of the total [125I]ω-CgTx sites in each reaction.Inset, Specificity of the β3immunoprecipitations, determined as in A, inset. Experimental immunoprecipitations (f) were compared with the following controls: control membranes (a) (see A, inset b), competing antigenic peptide (25 μm) (b), control membranes plus competing peptide (c), immunoprecipitates with no primary antibody (d), control membranes and no primary antibody (e), and preimmune serum (g). D, Antibodies against β3 recognize a band of 55 kDa on immunoblots (lane 1), which can be displaced completely by competing peptide antigen (lane 2) (40 μm). Molecular weights were derived from prestained molecular weight standards (arrowheads at left).
Immunoblot analysis of the expression of N-VDCC subunits in hippocampal development
The ontogeny of N-VDCC subunit proteins was determined by immunoblot analysis with anti-α1B and β3antibodies (Fig. 4). Although both mAb CC18 and our polyclonal α1B antibodies gave similar results, mAb CC18 was used because of its greater sensitivity of detection. Expression of the ubiquitous α2/δ subunit was examined with a commercially available monoclonal antibody to the skeletal muscle protein that cross-reacts with that in brain (Upstate Biotechnology, Lake Placid, NY). Expression of the 220 kDa α1B subunit (Fig. 4A,D) was detectable but very weak at E18 (the earliest stage examined), rose markedly (48-fold increase) after birth to reach a maximum at P10, and thereafter followed a slight decline to adult levels. In contrast, a phasic profile was noted for the band corresponding to the reduced form of the α2/δ subunit (Mr 150 kDa; Gurnett et al., 1996) (Fig.4B,E). Expression of α2/δ was evident as early as E18 (45% of adult levels), waned until P4, and then rose to a plateau level at P10. The expression of β3subunits also increased markedly with development but with a profile distinct from either the α1B or the α2/δ subunits. Thus, β3 subunit expression increased eightfold from birth, attained a maximum level at P25, and then declined slightly to its adult level (Fig.4C,F).
Fig. 4.

Ontogeny of N-VDCC subunits in hippocampal membranes as determined by immunoblotting. Immunoblots were probed with the following antibodies: α1B (A), α2/δ (B), and β3 (C) (see Materials and Methods).Lanes a–j correspond to the following ages at which the hippocampal membranes were prepared: E18, P0, 1.5, 2.5, 4, 6, 10, 16, 25, and 40. Arrowheads at left denote positions of molecular weight markers (see Materials and Methods). Densitometric scans of immunoblots corresponding to α1B, α2/δ, and β3 are shown in D–F, respectively. Each panel shows data ± SEM obtained from three separate sets of animals, normalized to the values seen at P16.
Immunoprecipitation analysis of the expression of α1B–β3 N-VDCC complexes in the developing hippocampus
Although immunoblotting delineated the ontogeny of the α1B, α2/δ, or β3 subunits, the degree of their coassembly was unclear. We therefore analyzed the extent of α1B–β3complexation during development by immunoprecipitation assays of solubilized N-VDCCs. The extent of α1B–α2/δ complexation was not examined because of poor recognition of native α2/δ in digitonin extracts by anti-skeletal muscle α2/δ antibodies, as reported elsewhere (Sakamoto and Campbell, 1991), and the possibility that N-VDCCs contain α2/δ isoforms that are not recognized by this antibody (Westenbroek et al., 1992). Because immunoprecipitation assays demand the use of solubilized material, we first tested for developmental differences in the ease of solubilization of [125I]ω-CgTx binding sites. Surprisingly, although the ontogeny of the [125I]ω-CgTx binding sites in each reaction (Fig. 5A, open bars) mirrored that in the membrane binding assays, as expected (see Fig. 1), the ontogeny of solubilized [125I]ω-CgTx binding sites (Fig. 5A, solid bars) showed a shallower profile, with a maximum at P4. The source of this discrepancy became apparent by examining the percentage of [125I]ω-CgTx binding sites solubilized at each developmental day. Between E18 and P10 the fraction of sites that could be solubilized declined by 40% and thereafter remained constant (30% for hippocampus). Thus, the developmental changes in the concentration of solubilized [125I]ω-CgTx binding sites shown in Figure 5A (solid bars) reflect changes in both N-VDCC expression and solubilization. At E18, [125I]ω-CgTx binding sites are poorly expressed but readily solubilized; at later stages [125I]ω-CgTx binding sites are more prevalent but less readily solubilized.
Fig. 5.
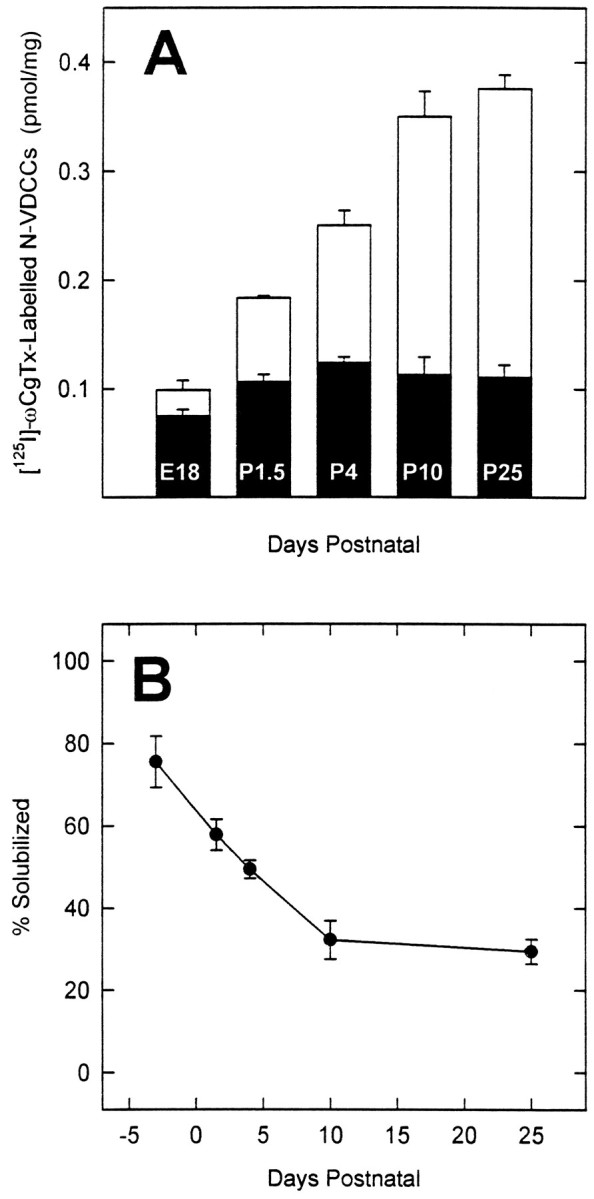
The extent of solubilization of hippocampal N-VDCCs changes during development. A, Comparison of the number of [125I]ω-CgTx binding sites in digitonin-treated membranes from different days in development before (open bar) and after (solid bar) centrifugation at 100,000 × g for 1 hr (see Materials and Methods). Note the different ontogeny for the solubilized (solid bar) versus the total number (open bar) of [125I]ω-CgTx binding sites.B, Solubilization of [125I]ω-CgTx binding sites decreases in development. In both A andB the data represent the mean ± SEM (n = 7).
Having defined the developmental profile for the concentration of solubilized [125I]ω-CgTx binding sites, we examined that fraction that could be immunoprecipitated by β3 antibodies (Fig. 6A). As shown, [125I]ω-CgTx radioactivity in the β3 immunoprecipitates rose from low levels at E18, peaked at P10, and then declined modestly to P25. From the similar ratio in the normalized β3 immunoprecipitated and solubilized [125I]ω-CgTx binding site profiles between E18 and P25 (Fig. 6A, inset), we infer that changes in the α1B–β3 complexes parallel those of the entire N-VDCC population. To examine α1B–β3 complexation further, we immunoprecipitated the β3 subunits associated with [125I]ω-CgTx-labeled N-VDCCs, using biotinylated α1B antibodies bound to streptavidin–agarose. Then the α1B complexes were tested for associated β3subunits by immunoblotting with digoxygenylated anti-β3antibodies. The use of both biotin and digoxygenin-labeled antibodies was essential in reducing nonspecific bands from IgGs in the immunoprecipitates. As shown in Figure 6B, both the radioactivity corresponding to [125I]ω-CgTx binding sites and β3 expression in the α1Bimmunoprecipitates have very similar developmental profiles (Fig.6B). This was confirmed further by the similarity in the ratios of the normalized profiles for β3 expression and [125I]ω-CgTx radioactivity between E18 and P25 (Fig. 6B, inset).
Fig. 6.

Immunoprecipitation analysis of α1B–β3 complexation during development.A, Immunoprecipitation of [125I]ω-CgTx-labeled N-VDCCs by anti-β3 antibodies. Hippocampal membranes from rats at various ages were labeled with [125I]ω-CgTx, solubilized with digitonin, and immunoprecipitated by anti-β3 antibodies, and then the radioactivity was counted (see Materials and Methods). The specific radioactivity in the immunoprecipitates is shown as the mean ± SEM (n = 3). The inset shows the ratio of the [125I]ω-CgTx radioactivity in the β3 immunoprecipitates to that in the solubilizates after normalizing the respective data to values obtained at P10. The lines of best fit and 95% confidence limits, corresponding to the linear equation y = b0 +b1 · x (in whichy and x correspond to the ratio and the days postnatal, respectively), are shown as solid anddotted lines, respectively. The corresponding regression coefficients b0 andb1 were 0.94 and −0.003, respectively.B, Immunoprecipitation of β3 subunits by anti-α1B antibodies. Hippocampal membranes from rats at E18, P1.5, P4, P10, and P25 (lanes a–e, respectively) were labeled with [125I]ω-CgTx, solubilized with digitonin, and immunoprecipitated by biotinylated anti-α1antibodies on streptavidin–agarose (see Materials and Methods). The level of β3 in the immunoprecipitates was assayed by immunoblotting with digoxygenylated anti-β3 antibodies and quantified densitometrically (axis,right). The concentration of [125I]ω-CgTx binding sites at the corresponding ages was determined from the radioactivity in the immunoprecipitates before electrophoresis (axis, left). The ratio of the β3 subunits determined densitometrically to the [125I]ω-CgTx radioactivity in the α1B immunoprecipitates is shown in theinset after the respective data had been normalized to the values obtained at P10. The lines of best fit and 95% confidence limits, determined by linear regression, are shown assolid and dotted lines, respectively, and the corresponding regression coefficients (calculated as above) were 0.90 for b0 and 0.006 forb1, respectively.
Visualization of N-type VDCCs on hippocampal pyramidal neurons
To examine N-VDCC expression in intact neurons, we labeled developing brain slices selectively with Fl-ω-CgTx (Mills et al., 1994). In previous studies we have shown Fl-ω-CgTx to be a powerful biologically active probe of N-VDCCs, which is internalized only slowly at room temperature (Mills et al., 1994). Thus, Fl-ω-CgTx labeling highlights only those N-VDCCs at the nerve cell surface—a significant advantage compared with most immunocytochemical approaches. Hippocampal brain slices sectioned at different days were labeled with Fl-ω-CgTx, fixed, and visualized by laser confocal microscopy (Figs.7, 8). Elsewhere we have shown that labeling of adult hippocampal slices by Fl-ω-CgTx can be displaced completely by pretreating the slices with native ω-CgTx (Mills et al., 1994). To exclude any developmental artifacts in such control experiments, we compared E18 (Fig. 7A) and P40 (Fig.7C) hippocampal slices treated with native ω-CgTx before Fl-ω-CgTx labeling. In both E18 (Fig. 7B) and P40 (Fig.7D) controls, staining was completely absent. We next examined Fl-ω-CgTx labeling in hippocampal slices from E19 to adulthood (Fig. 7E–H). At E19, Fl-ω-CgTx labeling was barely discernible in any hippocampal subfield (Fig.7E). However, by birth (Fig. 7F), surface expression of N-VDCCs was prevalent in the pyramidal layers of subfields CA3–CA4, the somata of the subiculum, and to a lesser extent in the external granule cell layer of the dentate gyrus and stratum radiatum of CA3–CA4. Surprisingly, staining was barely detectable in CA1–CA2 (Fig. 7F, asterisk) at this stage and only began to appear at ∼P4. This period also demarcated the onset of expression of N-VDCCs in the internal granule cell layer of the dentate gyrus (DGi; Fig. 7G). Once initiated, N-VDCC expression increased to adult levels (Fig. 7E) throughout all hippocampal subfields. The lack of Fl-ω-CgTx labeling in the CA1 region of rats before P4 (Fig. 7F) did not reflect simply a lack of cells in this region, because individual CA1 neurons adjacent to the subiculum (Fig. 8A, inset) could be filled with the intracellular dye Lucifer yellow at P2 (Fig.8A) or P3 (Fig. 8B). We next exploited the late onset of Fl-ω-CgTx labeling in CA1 neurons to examine the spatiotemporal patterns of N-VDCC expression. Hippocampal slices again were labeled with Fl-ω-CgTx, and individual cells in stratum pyramidale were outlined by Lucifer filling. As shown in Figure 8C, N-VDCC labeling in P7 CA1 neurons was confined mainly to regions containing the somata and very proximal dendrites (<30 μm) despite the disclosure of exuberant dendritic arbors in these neurons by Lucifer yellow (Fig. 8E). In contrast, Fl-ω-CgTx labeling of adult CA1 neurons revealed intense, often punctate, staining extending throughout the entire somatodendritic region, as detailed previously (Mills et al., 1994) (Fig. 8D).
Fig. 7.
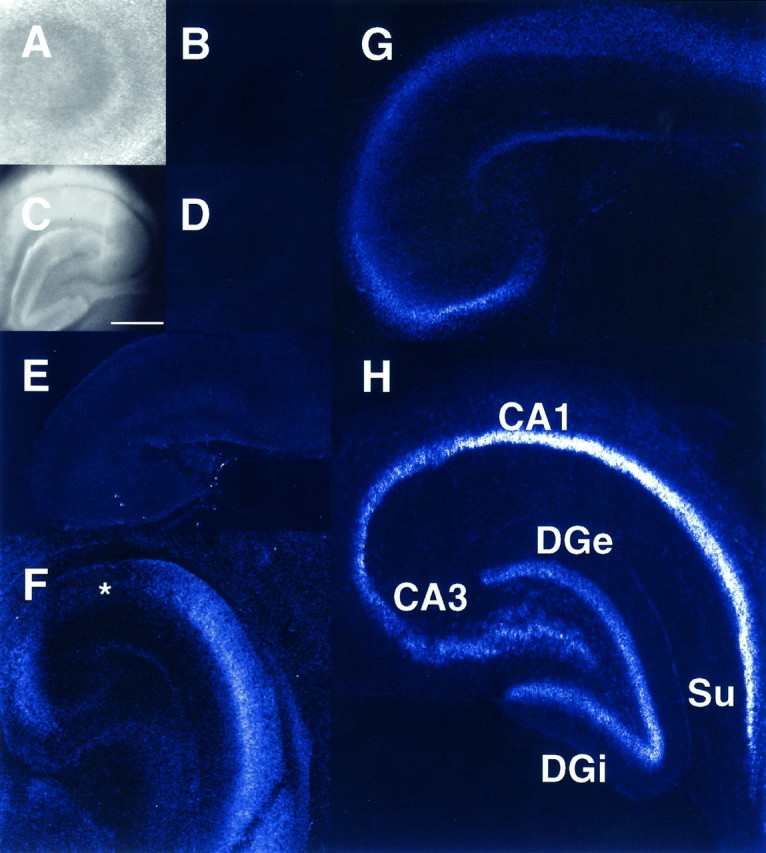
Distribution of N-VDCCs in the developing rat hippocampus, as determined by Fl-ω-CgTx labeling. Hippocampi were sectioned, labeled with Fl-ω-CgTx, and imaged at low power by confocal fluorescence microscopy, as described (see Materials and Methods). A–D, Control experiments reveal lack of fluorescence (B, D) in hippocampal slices pretreated with ω-CgTx before labeling with Fl-ω-CgTx at both P0 (A, B) and P40 (C,D). A and C show phase micrographs corresponding to the slices in B andD. Scale bar in C, 500 μm.E–H, Distribution of fluorescence in hippocampal slices labeled with Fl-ω-CgTx. E, Hippocampus at E19; note absence of marked staining. F, Hippocampus at P0; note relative absence of staining in subfields CA1–CA2 (asterisk) and the dentate gyrus, as compared with CA3–CA4 and the subiculum (Su). G, At day 4, labeling is detected in the somata and dendrites of all subfields, except the internal granule cell layer of the dentate gyrus (DGi). H, Labeling of adult hippocampus by Fl-ω-CgTx is now evident in all fields and is consistently higher on the somata than in the dendrites. DGe, Dentate gyrus. All measurements were replicated in at least five separate experiments.
Fig. 8.
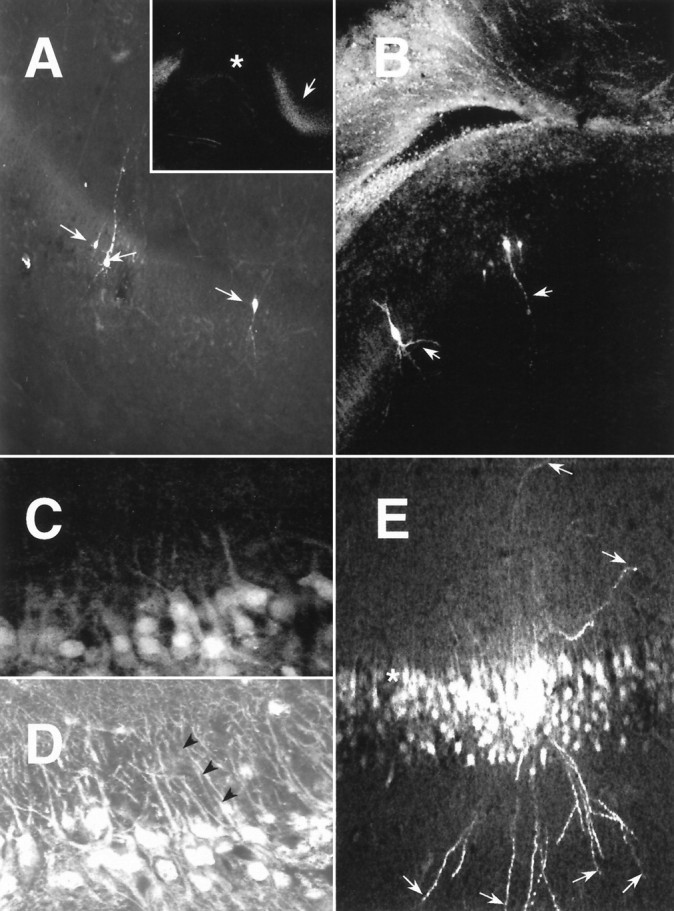
Comparative distributions of Fl-ω-CgTx labeling and CA1 neurons identified by filling with the intracellular dye Lucifer yellow. A, Hippocampal CA1 neurons at P2 filled with Lucifer yellow show extensive arborization (arrows) but weak staining with Fl-ω-CgTx (inset, asterisk). In contrast to CA1, staining with Fl-ω-CgTx is much stronger in the adjacent subiculum (inset, arrow). B, Direct comparison of the distributions of Fl-ω-CgTx labeling and CA1 neurons identified by Lucifer yellow filling (arrows) at P3. Note the much weaker staining of the CA1 subfield neurons, as compared with those in the cingulate cortex (top left).C, Fl-ω-CgTx labeling in P7 CA1 neurons. Note the strong staining of the somata and the very proximal dendritic regions and the sharp decline in labeling that occur within a few soma diameters from the cell body. D, Fl-ω-CgTx labeling in adult CA1 neurons. Note that the staining, while often punctate, is sustained for distances corresponding to several soma diameters on dendrites emanating from identifiable somata (arrowheads) and pervades the dendritic arbor. E, At high magnification, Lucifer filling of P7 CA1 neurons reveals extensive dendritic arborization and stains even the most distal dendritic regions (arrows), whereas the Fl-ω-CgTx labeling is restricted to somata and very proximal dendrites (asterisk), as inC.
DISCUSSION
We have defined the spatiotemporal expression of N-VDCCs in the hippocampus via selective ligand binding, immunoblotting of N-VDCC subunits, subunit coupling, and fluorescent imaging of channels expressed at the cell surface. Although some α1B, α2/δ, and β3 subunits are found at E18, most of their expression occurs between P0 and P16, in agreement with our [125I]ω-CgTx binding data. Nevertheless, N-VDCC expression is not uniform throughout the hippocampus but occurs in subfields CA3–CA4 and the subiculum before dentate gyrus and CA1–CA2. In all regions N-VDCCs appear on somata before dendrites.
Numerous studies have shown that bona fide VDCC function depends on the coexpression of α1, α2/δ, and β subunits (Brust et al., 1993; Stea et al., 1993; Isom et al., 1994; Olcese et al., 1994; Gurnett et al., 1996). The presence of α1, α2/δ, and β3 subunits in the prenatal hippocampus argues that embryonic N-VDCCs may be functionally competent; nevertheless, the levels of both α1B and β3 subunits are very low (<5% of adult levels) at E18. In contrast, α2/δ subunits are much more prevalent at E18 (45% of adult levels) than either α1B or β3 subunits, and their expression is phasic. These data presumably reflect complexation of the α2/δ subunits with other non-N-type VDCCs (Dunlap et al., 1995; Liu et al., 1996a), the expression patterns of which are tailored to the developing prenatal hippocampus. Likewise, the more sustained expression of β3, as compared with α1B, subunits at later stages of development is rationalized most simply via the association of the β3 subunits with other non-α1B subunits, notably α1A, known to be expressed in adult brain (Liu et al., 1996a). Of greater interest is whether the degree of α1B–β3complexation changes in development. Changes in heteromer composition in development are well documented (Sheng et al., 1994; Murray et al., 1995) and would be especially significant for VDCCs because the α1B–β subunit interaction is known to be promiscuous (De Waard et al., 1995; Liu et al., 1996a; Scott et al., 1996) and can be displaced by interaction with G-proteins (De Waard et al., 1997;Zamponi et al., 1997). Moreover, multiple β subunits can exist in individual cell types (Liu et al., 1996b), and different β subunits confer discrete kinetic characteristics to VDCCs (De Waard and Campbell, 1995). Nevertheless, our immunoprecipitation data clearly indicate that the ratio of α1B:β3 subunits remains constant between E18 and P40 despite changes in the absolute levels of the α1B–β3 complexes. The enhanced expression of N-VDCCs without accompanying changes in subunit composition that we observed in brain also has been seen during NGF-induced differentiation of PC12 cells in culture (Liu et al., 1996b). Together, these data suggest that N-VDCC subunit expression and assembly are highly coordinated.
Throughout, we failed to detect major (>5%) excursions from the anticipated sizes of the α1B,α2/δ, or β3 subunits, indicating that they do not undergo extensive processing during development. Occasionally, minor bands were seen for α1B, suggesting that other variants may exist besides the 220 kDa subunits reported previously (Westenbroek et al., 1992; Hell et al., 1994) or that α1B subunits undergo extensive differential post-translational modifications or proteolysis. The lower size of the α1B subunits determined by SDS-PAGE, as compared with the 262 kDa predicted from the corresponding cDNA (Dubel et al., 1992), is typical of α1B (Westenbroek et al., 1992) and other α1VDCC subunits and has been attributed to anomalous migration in 5% gels (Hell et al., 1993).
Particularly intriguing is our observation that the ease of solubilization of N-VDCCs decreases between E18 and P10, presumably via an increased association of N-VDCCs with detergent-intractable components, especially those of the neuronal cytoskeleton. An interaction of N-VDCCs with the cytoskeleton is supported by the polarized distribution (Jones et al., 1989; Westenbroek et al., 1992;Mills et al., 1994; Christie et al., 1995) and the immobility of >70% (Jones et al., 1989) of N-VDCCs in mature hippocampal neurons and by the fact that the first postnatal week is a major phase for maturation of the neuronal cytoskeleton (Burgoyne, 1991).
To resolve only the surface N-VDCCs, we used high-resolution imaging of slices labeled with a selective fluorescent analog of ω-CgTx (Mills et al., 1994). The validity of such CgTx-based approaches (Jones et al., 1989; Robitaille et al., 1990; Cohen et al., 1991; Komura and Rakic, 1992; Filloux et al., 1994; Haydon et al., 1994; Mills et al., 1994) is substantiated by the similar temporal expression patterns of the 220 kDa α1B subunit, ω-CgTx binding sites, and overall Fl-ω-CgTx labeling. Our study also agrees with that ofFilloux et al. (1994), who used [125I]ω-CgTx autoradiography to explore N-VDCC ontogeny in the rat brain; however, we did not detect the developmental increase in [125I]ω-CgTx affinity reported by these authors. More significantly, the ontogeny of Fl-ω-CgTx labeling is very similar to that obtained via in situ hybridization (Tanaka et al., 1995) where, from E18 onward, both α1B and β3 mRNAs are evident in all cell body layers throughout the hippocampal formation. The only real discrepancy concerns the lower expression of Fl-ω-CgTx labeling in CA1–CA2 relative to adjacent regions before P7. The simplest explanation is that neurons in discrete hippocampal subfields translate and insert N-VDCCs differentially at the nerve surface. However, disparities between Fl-ω-CgTx labeling and mRNA expression also could reflect staining of N-VDCCs trafficked to presynaptic terminals impinging on the somata rather than to N-VDCCs made by translation in the postsynaptic cell. However, such an explanation would require targeting of N-VDCCs to axon terminals before their expression on somata—a result that is inconsistent with our observation that N-VDCCs are expressed initially on cell bodies.
The initial surface expression of N-VDCCs in the soma before the distal dendrites is intriguing but has been seen for other ion channels (Strichartz et al., 1984; Nicola et al., 1992; Maletic-Savatic, 1995). Previously, it has been postulated that the transport of proteins into neurites arises via their initial expression at the soma surface and subsequent diffusion in the plane of the membrane to more peripheral regions (Small et al., 1984). However, the absence of a clear somatodendritic (or dendritic) gradient of N-VDCC expression, despite the presence of dendrites in P7 or adult neurons (Westenbroek et al., 1992; Mills et al., 1994), indicates that VDCCs also are inserted (and immobilized) directly into the dendritic membrane. Thus, expression of N-VDCCs in the neurites may proceed only after these regions are mature enough to support the appropriate trafficking, insertion, and immobilization mechanisms.
The possible role of N-VDCC expression in the development of the hippocampus is especially significant. In the rat, formation of the hippocampus begins at E14 (Altman and Bayer, 1990a–c; Jacobson, 1991). Neuroblasts, which have arisen through proliferation in the neuroepithelium, migrate to specified positions, settle, and elaborate axons and dendrites. In CA1–CA4 such events are complete by birth (Altman and Bayer, 1990a,b), but in dentate gyrus they continue for several weeks postnatally (Altman and Bayer, 1990c). However, although CA3 cells are generated earlier than CA1 cells, they take longer to settle in stratum pyramidale, reflecting a subicular-to-dentate morphogenetic gradient complete by E22 (Altman and Bayer, 1990b). Thus, the sequence of N-VDCC surface expression seems to parallel the postmitotic age of the neurons rather than their time of settling in stratum pyramidale. The absence of α1B subunits in neurogenic zones, but their prenatal expression elsewhere, is compatible with a role for N-VDCCs in migration, as proposed for cerebellar neurons (Komura and Rakic, 1992). However, the perinatal levels of α1B are only 2–5% of those found in adult. Thus if N-VDCCs indeed do facilitate migration, relatively few channels are needed, or few cells are migrating at any one instant. Most N-VDCCs appear within the early postnatal period, consonant with reported increases in HVA Ca2+ currents, such as those generated by N-VDCCs in culture (Yaari et al., 1987; Scholz and Miller, 1995). This period is marked initially by dendritic arborization and gliogenesis, but the event that most closely defines N-VDCC expression is synaptogenesis, the bulk of which occurs in the first few weeks after birth (Jacobson, 1991). An intimate relationship between N-VDCC expression and synaptogenesis is supported by changes in ω-CgTx binding in mouse brain growth cone particles (Vigers and Pfenninger, 1991). Certainly, the pattern of expression of N-VDCCs, unlike several other voltage-gated ion channels (Yaari et al., 1987; Maletic-Savatic et al., 1995; Scholz and Miller, 1995), is remarkably similar to that of other proteins implicated in synaptic function (Burgin et al., 1990;Bahn et al., 1994; Lomeli et al., 1994; Melloni et al., 1994; Sheng et al., 1994). Enhanced expression of N-VDCCs during synaptogenesis agrees well with their role in neurotransmitter release (Dunlap et al., 1995;Scholz and Miller, 1995). Although the role of N-VDCCs in neurotransmission is shared with other VDCCs in adult neurons (Wheeler et al., 1994; Scholz and Miller, 1995), two lines of evidence suggest that N-VDCCs may be especially significant in the immature hippocampus. First, neurotransmission in developing cultures is dominated initially by N-VDCCs, the role of which declines as their task becomes shared by P/Q-VDCCs (Scholz and Miller, 1995). Second, the efficacy of CA1 synapses is reported to be high [release probability (Pr) close to unity] in very young (P4–P6) hippocampi but diminishes to a lower level (Pr <0.5) with maturation (Bolshakov and Siegelbaum, 1995). A purely presynaptic role for N-VDCCs is probably unlikely, however, because N-VDCCs also are found on hippocampal dendrites (Jones et al., 1989; Westenbroek et al., 1992; Mills et al., 1994; Christie et al., 1995) and their spines (Mills et al., 1994). Although the functional contribution such postsynaptic N-VDCCs make is unclear (Mills et al., 1994; Elliott et al., 1995), one plausible role is to direct afferent axons to discrete synapses. Such a role also may explain the shift in synapses from dendritic shafts to spines that is seen between P7 and P15 (Harris et al., 1992).
Several physiological correlates of hippocampal maturation emerge within the same time window as N-VDCC expression in the immature hippocampus. Toward the end of the first postnatal week CA1 pyramidal cells begin to exhibit adult electrophysiological characteristics and population spiking (Bekenstein and Lothman, 1991; Bolshakov and Siegelbaum, 1995). Remarkably, this phase coincides with our initial detection of N-VDCCs in CA1 and the arrival of the commissural and perforant fibers to CA1 and dentate gyrus, respectively (Bekenstein and Lothman, 1991). The early expression of N-VDCCs in the lateral blade of the dentate gyrus merits attention because the lateral perforant pathway relays primarily olfactory inputs, whereas the medial pathway relays presubicular and nonolfactory inputs from the entorhinal cortex (Shepherd, 1990). Marked changes in activity-dependent plasticity, notably paired pulse facilitation (PPF) and long-term potentiation (LTP) and depression (LTD), also occur in the early postnatal period. LTD is greatest before P14 (Dudek and Bear, 1993) whereas LTP reaches adult levels at ∼P14 (Dudek and Bear, 1993). Although the relative contribution of pre- and postsynaptic mechanisms to such events is controversial (Kullmann and Siegelbaum, 1995), the absence of PPF and LTP, but not LTD, at CA3–CA1 synapses in P4–P8 animals can be rationalized by their high-release probability (Pr 0.9) (Bolshakov and Siegelbaum, 1995). Thus, N-VDCCs may be of central importance to synaptic plasticity simply by virtue of their predominant role in juvenile transmitter release (Scholz and Miller, 1995).
Footnotes
This work was supported by grants from Natural Sciences and Engineering Research Council Canada to W.W. and L.R.M.; from Medical Research Council Canada, the Ontario Mental Health Foundation, and the Bloorview Epilepsy Program to O.T.J.; and from the Sandoz Aging Foundation to O.T.J. and L.R.M. G.M.B. was the recipient of a fellowship from the Savoy Foundation. We thank Dr. V. Lennon for her generous gift of mAb CC18C (National Institutes of Health Grant CA-37343), C. Niesen for the Lucifer yellow fills, J. Wadia for assistance with the image analysis, and J. Francis for assistance with the microdissection.
Correspondence should be addressed to Dr. Owen T. Jones, Playfair Neuroscience Unit, Mc11-434, Toronto Hospital Research Institute, Toronto Western Hospital, 399 Bathurst Street, Toronto, Ontario, Canada M5T 2S8.
REFERENCES
- 1.Altman J, Bayer SA. Mosaic organization of the hippocampal neuroepithelium and the multiple germinal sources of dentate granule cells. J Comp Neurol. 1990a;301:325–342. doi: 10.1002/cne.903010302. [DOI] [PubMed] [Google Scholar]
- 2.Altman J, Bayer SA. Prolonged sojourn of developing pyramidal cells in the intermediate zone of the hippocampus and their settling in the stratum pyramidale. J Comp Neurol. 1990b;301:343–364. doi: 10.1002/cne.903010303. [DOI] [PubMed] [Google Scholar]
- 3.Altman J, Bayer SA. Migration and distribution of two populations of hippocampal granule cell precursors during the perinatal and postnatal periods. J Comp Neurol. 1990c;301:365–381. doi: 10.1002/cne.903010304. [DOI] [PubMed] [Google Scholar]
- 4.Bading H, Ginty DD, Greenberg ME. Regulation of gene expression in hippocampal neurons by distinct calcium signaling pathways. Science. 1993;260:181–186. doi: 10.1126/science.8097060. [DOI] [PubMed] [Google Scholar]
- 5.Bahn S, Volk B, Wisden W. Kainate receptor gene expression in the developing rat brain. J Neurosci. 1994;14:5525–5547. doi: 10.1523/JNEUROSCI.14-09-05525.1994. [DOI] [PMC free article] [PubMed] [Google Scholar]
- 6.Bekenstein JW, Lothman EW. A comparison of the ontogeny of excitatory and inhibitory neurotransmission in the CA1 region and dentate gyrus of the rat hippocampal formation. Dev Brain Res. 1991;63:237–243. doi: 10.1016/0165-3806(91)90083-u. [DOI] [PubMed] [Google Scholar]
- 7.Bolshakov VY, Siegelbaum SA. Regulation of hippocampal transmitter release during development and long-term potentiation. Science. 1995;269:1730–1734. doi: 10.1126/science.7569903. [DOI] [PubMed] [Google Scholar]
- 8.Brust PF, Simerson S, McCue AF, Deal CR, Schoonmaker S, Williams ME, Velicelebi G, Johnson EC, Harpold MM, Ellis SB. Human neuronal voltage-dependent calcium channels: studies on subunit structure and role in channel assembly. Neuropharmacology. 1993;32:1089–1102. doi: 10.1016/0028-3908(93)90004-m. [DOI] [PubMed] [Google Scholar]
- 9.Burgin KE, Waxham MN, Rickling S, Westgate SA, Mobley WA, Kelly PT. In situ hybridization histochemistry of Ca2+/calmodulin-dependent protein kinase in developing rat brain. J Neurosci. 1990;10:1788–1798. doi: 10.1523/JNEUROSCI.10-06-01788.1990. [DOI] [PMC free article] [PubMed] [Google Scholar]
- 10.Burgoyne RD. The neuronal cytoskeleton. Wiley–Liss; New York: 1991. [Google Scholar]
- 11.Castellano A, Wei X, Birnbaumer L, Perez-Reyes E. Cloning and expression of a neuronal calcium channel β subunit. J Biol Chem. 1993;268:12359–12366. [PubMed] [Google Scholar]
- 12.Christie BR, Eliot LS, Ito K, Miyakawa H, Johnston D. Different Ca2+ channels in soma and dendrites of hippocampal pyramidal neurons mediate spike-induced Ca2+ influx. J Neurophysiol. 1995;73:2553–2557. doi: 10.1152/jn.1995.73.6.2553. [DOI] [PubMed] [Google Scholar]
- 13.Cohen MW, Jones OT, Angelides KJ. Distribution of Ca2+ channels on frog motor nerve terminals revealed by fluorescent ω-conotoxin. J Neurosci. 1991;11:1032–1039. doi: 10.1523/JNEUROSCI.11-04-01032.1991. [DOI] [PMC free article] [PubMed] [Google Scholar]
- 14.Cruz LJ, Olivera BM. Calcium channel antagonists: ω-conotoxin defines a new high-affinity state. J Biol Chem. 1986;261:6230–6233. [PubMed] [Google Scholar]
- 15.De Waard M, Campbell KP. Subunit regulation of the neuronal α1A Ca2+ channel expressed in Xenopus oocytes. J Physiol (Lond) 1995;485:619–634. doi: 10.1113/jphysiol.1995.sp020757. [DOI] [PMC free article] [PubMed] [Google Scholar]
- 16.De Waard M, Witcher DR, Pragnell M, Liu H, Campbell KP. Properties of the α1–β anchoring site in voltage-dependent Ca2+ channels. J Biol Chem. 1995;270:12056–12064. doi: 10.1074/jbc.270.20.12056. [DOI] [PubMed] [Google Scholar]
- 17.De Waard M, Liu H, Walker D, Scott VES, Gurnett CA, Campbell KP. Direct binding of G-protein βγ complex to voltage-dependent calcium channels. Nature. 1997;385:446–450. doi: 10.1038/385446a0. [DOI] [PubMed] [Google Scholar]
- 18.Dubel SJ, Starr TVB, Hell J, Ahlijanian MK, Enyeart JJ, Catterall WA, Snutch TP. Molecular cloning of the α1 subunit of an ω-conotoxin-sensitive calcium channel. Proc Natl Acad Sci USA. 1992;89:5058–5062. doi: 10.1073/pnas.89.11.5058. [DOI] [PMC free article] [PubMed] [Google Scholar]
- 19.Dudek SM, Bear MF. Bidirectional long-term modification of synaptic effectiveness in the adult and immature hippocampus. J Neurosci. 1993;13:2910–2918. doi: 10.1523/JNEUROSCI.13-07-02910.1993. [DOI] [PMC free article] [PubMed] [Google Scholar]
- 20.Dunlap K, Luebke JI, Turner TJ. Exocytotic Ca2+ channels in mammalian central neurons. Trends Neurosci. 1995;18:89–98. [PubMed] [Google Scholar]
- 21.Elliott EM, Malouf AT, Catterall WA. Role of calcium channel subtypes in calcium transients in hippocampal CA3 neurons. J Neurosci. 1995;15:6433–6444. doi: 10.1523/JNEUROSCI.15-10-06433.1995. [DOI] [PMC free article] [PubMed] [Google Scholar]
- 22.Filloux F, Schapper A, Scott R, Olivera BM, McIntosh JM. Complex patterns of [125I]ω-conotoxin GVIA binding site expression during postnatal rat brain development. Dev Brain Res. 1994;78:131–136. doi: 10.1016/0165-3806(94)90017-5. [DOI] [PubMed] [Google Scholar]
- 23.Fujita Y, Mynlieff M, Dirksen RT, Kim M, Niidome T, Nakai J, Friedrich T, Iwabe N, Miyata T, Furuichi T, Furutama D, Mikoshiba K, Mori Y, Beam KG. Primary structure and functional expression of the ω-conotoxin-sensitive N-type calcium channel from rabbit brain. Neuron. 1993;10:585–598. doi: 10.1016/0896-6273(93)90162-k. [DOI] [PubMed] [Google Scholar]
- 24.Gurnett CA, De Waard M, Campbell KP. Dual function of the voltage-dependent Ca2+ channel α2δ subunit in current stimulation and subunit interaction. Neuron. 1996;16:431–440. doi: 10.1016/s0896-6273(00)80061-6. [DOI] [PubMed] [Google Scholar]
- 25.Harris KM, Jensen FE, Tsao B. Three-dimensional structure of dendritic spines and synapses in rat hippocampus (CA1) at postnatal day 15 and adult ages: implications for the maturation of synaptic physiology and long-term potentiation. J Neurosci. 1992;12:2685–2705. doi: 10.1523/JNEUROSCI.12-07-02685.1992. [DOI] [PMC free article] [PubMed] [Google Scholar]
- 26.Haydon PG, Henderson E, Stanley EF. Localization of individual calcium channels at the release face of a presynaptic nerve terminal. Neuron. 1994;13:1275–1280. doi: 10.1016/0896-6273(94)90414-6. [DOI] [PubMed] [Google Scholar]
- 27.Hell JW, Westenbroek RE, Warner C, Ahlijanian MK, Prystay W, Gilbert MM, Snutch TP, Catterall WA. Identification and differential subcellular localization of the neuronal class C and class D L-type calcium channel α1 subunits. J Cell Biol. 1993;123:949–962. doi: 10.1083/jcb.123.4.949. [DOI] [PMC free article] [PubMed] [Google Scholar]
- 28.Hell JW, Appleyard SM, Yokoyama CT, Warner C, Catterall WA. Differential phosphorylation of two size forms of the N-type calcium channel α1 subunit which have different COOH termini. J Biol Chem. 1994;269:7390–7396. [PubMed] [Google Scholar]
- 29.Hofmann F, Biel M, Flockerzi V. Molecular basis for Ca2+ channel diversity. Annu Rev Neurosci. 1994;17:399–418. doi: 10.1146/annurev.ne.17.030194.002151. [DOI] [PubMed] [Google Scholar]
- 30.Isom LL, De Jongh KS, Catterall WA. Auxiliary subunits of voltage-gated channels. Neuron. 1994;12:1183–1194. doi: 10.1016/0896-6273(94)90436-7. [DOI] [PubMed] [Google Scholar]
- 31.Jacobson M. Developmental neurobiology, 3rd Ed. Plenum; New York: 1991. [Google Scholar]
- 32.Johnson EM, Jr, Deckwerth TL. Molecular mechanisms of developmental neuronal death. Annu Rev Neurosci. 1993;16:31–46. doi: 10.1146/annurev.ne.16.030193.000335. [DOI] [PubMed] [Google Scholar]
- 33.Jones OT, So AP. Preparation and characterization of biotinylated analogs of ω-conotoxin. Anal Biochem. 1993;214:227–232. doi: 10.1006/abio.1993.1481. [DOI] [PubMed] [Google Scholar]
- 34.Jones OT, Kunze DL, Angelides KJ. Localization and mobility of ω-conotoxin-sensitive Ca2+ channels in hippocampal CA1 neurons. Science. 1989;244:1189–1193. doi: 10.1126/science.2543080. [DOI] [PubMed] [Google Scholar]
- 35.Kim H-L, Kim H, Lee P, King RG, Chin H. Rat brain expresses an alternatively spliced form of the dihydropyridine-sensitive L-type calcium channel α2 subunit. Proc Natl Acad Sci USA. 1992;89:3251–3255. doi: 10.1073/pnas.89.8.3251. [DOI] [PMC free article] [PubMed] [Google Scholar]
- 36.Komura H, Rakic P. Selective role of N-type calcium channels in neuronal migration. Science. 1992;257:806–809. doi: 10.1126/science.1323145. [DOI] [PubMed] [Google Scholar]
- 37.Kullmann DM, Siegelbaum SA. The site of expression of NMDA receptor-dependent LTP: new fuel for an old fire. Neuron. 1995;15:997–1002. doi: 10.1016/0896-6273(95)90089-6. [DOI] [PubMed] [Google Scholar]
- 38.Laemmli UK. Cleavage of structural proteins during the assembly of the head of bacteriophage T4. Nature. 1970;227:680–685. doi: 10.1038/227680a0. [DOI] [PubMed] [Google Scholar]
- 39.Leveque C, El Far O, Martin-Martout N, Sato K, Kato R, Takahashi M, Seagar MJ. Purification of the N-type calcium channel associated with syntaxin and synaptotagmin. A complex implicated in synaptic vesicle exocytosis. J Biol Chem. 1994;269:6306–6312. [PubMed] [Google Scholar]
- 40.Liu H, De Waard M, Scott VES, Gurnett CA, Lennon VA, Campbell KP. Identification of three subunits of the high-affinity ω-conotoxin MVIIC-sensitive Ca2+ channel. J Biol Chem. 1996a;271:13804–13810. [PubMed] [Google Scholar]
- 41.Liu H, Felix R, Gurnett CA, De Waard M, Witcher DR, Campbell KP. Expression and subunit interaction of voltage-dependent Ca2+ channels in PC12 cells. J Neurosci. 1996b;16:7557–7565. doi: 10.1523/JNEUROSCI.16-23-07557.1996. [DOI] [PMC free article] [PubMed] [Google Scholar]
- 42.Llinás RR. The intrinsic electrophysiological properties of mammalian neurons: insights into central nervous system function. Science. 1988;242:1654–1664. doi: 10.1126/science.3059497. [DOI] [PubMed] [Google Scholar]
- 43.Llinás RR, Sugimori M. Calcium conductances in Purkinje cell dendrites: their role in development and integration. Prog Brain Res. 1979;51:323–334. doi: 10.1016/S0079-6123(08)61312-6. [DOI] [PubMed] [Google Scholar]
- 44.Lomeli H, Mosbacher J, Melcher T, Hoger T, Geiger JRP, Kuner T, Monyer H, Higuchi M, Bach A, Seeburg PH. Control of kinetic properties of AMPA receptor channels by nuclear RNA editing. Science. 1994;266:1709–1713. doi: 10.1126/science.7992055. [DOI] [PubMed] [Google Scholar]
- 45.Maletic-Savatic M, Lenn NJ, Trimmer JS. Differential spatiotemporal expression of K+ channel polypetides in rat hippocampal neurons developing in situ and in vitro. J Neurosci. 1995;15:3840–3851. doi: 10.1523/JNEUROSCI.15-05-03840.1995. [DOI] [PMC free article] [PubMed] [Google Scholar]
- 46.Melloni RH, Apostolides PJ, Hamos JE, DeGennaro LJ. Dynamics of synapsin I gene expression during the establishment and restoration of functional synapses in the rat hippocampus. Neuroscience. 1994;58:683–703. doi: 10.1016/0306-4522(94)90448-0. [DOI] [PubMed] [Google Scholar]
- 47.Mills LR, Kater SB. Neuron-specific and state-specific differences in calcium homeostasis regulate the generation and degeneration of neuronal architecture. Neuron. 1990;4:149–163. doi: 10.1016/0896-6273(90)90451-k. [DOI] [PubMed] [Google Scholar]
- 48.Mills LR, Niesen CE, So AP, Carlen PL, Spigelman I, Jones OT. N-type Ca2+ channels are located on somata, dendrites, and a subpopulation of dendritic spines on live hippocampal pyramidal neurons. J Neurosci. 1994;14:6815–6824. doi: 10.1523/JNEUROSCI.14-11-06815.1994. [DOI] [PMC free article] [PubMed] [Google Scholar]
- 49.Mori Y, Friedrich T, Kim M, Mikami A, Nakai J, Ruth P, Bosse E, Hofmann F, Flockerzi V, Furuichi T, Tikoshiba K, Imoto K, Tanabe T, Numa S. Primary structure and functional expression from complementary DNA of a brain calcium channel. Nature. 1991;350:398–402. doi: 10.1038/350398a0. [DOI] [PubMed] [Google Scholar]
- 50.Murray N, Zheng YC, Mandel G, Brehm P, Bolinger R, Reuer Q, Kullberg R. A single site in the epsilon subunit is responsible for the change in ACh receptor channel conductance during skeletal muscle development. Neuron. 1995;14:865–870. doi: 10.1016/0896-6273(95)90230-9. [DOI] [PubMed] [Google Scholar]
- 51.Nicola M-A, Becker C-M, Triller A. Development of glycine receptor alpha subunit in cultivated rat spinal neurons: an immunocytochemical study. Neurosci Lett. 1992;138:173–178. doi: 10.1016/0304-3940(92)90499-w. [DOI] [PubMed] [Google Scholar]
- 52.Olcese R, Qin N, Schneider T, Neely A, Wei X, Stefani E, Birnbaumer L. The amino terminus of a calcium channel β subunit sets rates of channel inactivation independently of the subunit’s effect on activation. Neuron. 1994;13:1433–1438. doi: 10.1016/0896-6273(94)90428-6. [DOI] [PubMed] [Google Scholar]
- 53.Peacock JH, Walker CR. Development of calcium action potentials in mouse hippocampal cell cultures. Dev Brain Res. 1983;8:39–52. [Google Scholar]
- 54.Reece LJ, Schwartzkroin PA. Effects of cholinergic agonists on immature rat hippocampal neurons. Dev Brain Res. 1991;60:29–42. doi: 10.1016/0165-3806(91)90152-9. [DOI] [PubMed] [Google Scholar]
- 55.Robitaille R, Adler EM, Charlton MP. Strategic location of calcium channels at transmitter release sites of frog neuromuscular synapses. Neuron. 1990;5:773–779. doi: 10.1016/0896-6273(90)90336-e. [DOI] [PubMed] [Google Scholar]
- 56.Sakamoto J, Campbell KP. A monoclonal antibody to the β subunit of the skeletal muscle dihydropyridine receptor immunoprecipitates the brain ω-conotoxin GVIA receptor. J Biol Chem. 1991;266:18914–18919. [PubMed] [Google Scholar]
- 57.Scholz KP, Miller RJ. Developmental changes in presynaptic calcium channels coupled to glutamate release in cultured rat hippocampal neurons. J Neurosci. 1995;15:4612–4617. doi: 10.1523/JNEUROSCI.15-06-04612.1995. [DOI] [PMC free article] [PubMed] [Google Scholar]
- 58.Scott VES, De Waard M, Liu H, Gurnett CA, Venzke DP, Lennon VA, Campbell KP. β-Subunit heterogeneity in N-type Ca2+ channels. J Biol Chem. 1996;271:3207–3212. doi: 10.1074/jbc.271.6.3207. [DOI] [PubMed] [Google Scholar]
- 59.Sheng M, Cummings J, Roldan LA, Jan YN, Jan LY. Changing subunit composition of heteromeric NMDA receptors during development of rat cortex. Nature. 1994;368:144–147. doi: 10.1038/368144a0. [DOI] [PubMed] [Google Scholar]
- 60.Shepherd GM. The synaptic organization of the brain. Oxford UP; New York: 1990. [Google Scholar]
- 61.Small RK, Blank M, Ghez R, Pfenninger KH. Components of the plasma membrane of growing axons. II. Diffusion of membrane protein complexes. J Cell Biol. 1984;98:1434–1443. doi: 10.1083/jcb.98.4.1434. [DOI] [PMC free article] [PubMed] [Google Scholar]
- 62.Spitzer NC, Xiaonan G, Olsen E. Action potentials, calcium transients, and the control of differentiation of excitable cells. Curr Opin Neurobiol. 1994;4:70–77. doi: 10.1016/0959-4388(94)90034-5. [DOI] [PubMed] [Google Scholar]
- 63.Stea A, Dubel SJ, Pragnell M, Leonard JP, Campbell KP, Snutch TP. A β-subunit normalizes the electrophysiological properties of a cloned N-type calcium channel. Neuropharmacology. 1993;32:1103–1116. doi: 10.1016/0028-3908(93)90005-n. [DOI] [PubMed] [Google Scholar]
- 64.Stea A, Tomlinson WJ, Soong TW, Bourinet E, Dubel SJ, Vincent SR, Snutch TP. The localization and functional properties of a rat brain α1A calcium channel reflect similarities to neuronal Q- and P-type channels. Proc Natl Acad Sci USA. 1994;91:10576–10580. doi: 10.1073/pnas.91.22.10576. [DOI] [PMC free article] [PubMed] [Google Scholar]
- 65.Strichartz GR, Small RK, Pfenninger KH. Components of the plasma membrane of growing axons. III. Saxitoxin binding to sodium channels. J Cell Biol. 1984;98:1444–1452. doi: 10.1083/jcb.98.4.1444. [DOI] [PMC free article] [PubMed] [Google Scholar]
- 66.Tanaka O, Sakagami H, Kondo H. Localization of mRNAs of voltage-dependent Ca2+ channels: four subtypes of α1- and β- subunits in developing and mature rat brain. Mol Brain Res. 1995;30:1–16. doi: 10.1016/0169-328x(94)00265-g. [DOI] [PubMed] [Google Scholar]
- 67.Towbin H, Staehelin T, Gordon J. Electrophoretic transfer of proteins from polyacrylamide gels to nitrocellulose sheets: procedure and some applications. Proc Natl Acad Sci USA. 1979;76:4350–4354. doi: 10.1073/pnas.76.9.4350. [DOI] [PMC free article] [PubMed] [Google Scholar]
- 68.Vigers AJ, Pfenninger KH. N-type and L-type calcium channels are present in nerve growth cones. Numbers increase on synaptogenesis. Dev Brain Res. 1991;60:197–203. doi: 10.1016/0165-3806(91)90048-n. [DOI] [PubMed] [Google Scholar]
- 69.Wagner J, Snowman AM, Biswas A, Olivera BM, Snyder SH. ω-Conotoxin GVIA binding to a high-affinity receptor in brain: characterization, calcium sensitivity, and solubilization. J Neurosci. 1988;8:3354–3359. doi: 10.1523/JNEUROSCI.08-09-03354.1988. [DOI] [PMC free article] [PubMed] [Google Scholar]
- 70.Westenbroek RE, Ahlijanian MK, Catterall WA. Clustering of L-type calcium channels at the base of major dendrites in hippocampal pyramidal neurones. Nature. 1990;347:281–284. doi: 10.1038/347281a0. [DOI] [PubMed] [Google Scholar]
- 71.Westenbroek R, Hell JW, Warner C, Dubel SJ, Snutch TP, Catterall WA. Biochemical properties and subcellular distribution of an N-type calcium channel α1 subunit. Neuron. 1992;9:1099–1115. doi: 10.1016/0896-6273(92)90069-p. [DOI] [PubMed] [Google Scholar]
- 72.Westenbroek RE, Sakurai T, Elliott EM, Hell JW, Starr TVB, Snutch TP, Catterall WA. Immunochemical identification and subcellular distribution of the α1A subunits of brain calcium channels. J Neurosci. 1995;15:6403–6418. doi: 10.1523/JNEUROSCI.15-10-06403.1995. [DOI] [PMC free article] [PubMed] [Google Scholar]
- 73.Wheeler DB, Randall A, Tsien RW. Roles of N-type and Q-type Ca2+ channels in supporting hippocampal synaptic transmission. Science. 1994;264:107–111. doi: 10.1126/science.7832825. [DOI] [PubMed] [Google Scholar]
- 74.Williams ME, Brust PF, Feldman DH, Patthi S, Simerson S, Maroufi A, McCue AF, Velicelebi G, Ellis SB, Harpold MM. Structure and functional expression of an ω-conotoxin-sensitive human N-type calcium channel. Science. 1992a;257:389–395. doi: 10.1126/science.1321501. [DOI] [PubMed] [Google Scholar]
- 75.Williams ME, Feldman DH, McCue AF, Brenner R, Velicelebi G, Ellis SB, Harpold MM. Structure and functional expression of α1, α2, and β subunits of a novel human neuronal calcium channel subtype. Neuron. 1992b;8:71–84. doi: 10.1016/0896-6273(92)90109-q. [DOI] [PubMed] [Google Scholar]
- 76.Witcher DR, De Waard M, Sakamoto J, Franzini-Armstrong C, Pragnell M, Kahl SD, Campbell KP. Subunit identification and reconstitution of the N-type Ca2+ channel complex purified from brain. Science. 1993;261:486–489. doi: 10.1126/science.8392754. [DOI] [PubMed] [Google Scholar]
- 77.Yaari Y, Hamon B, Lux HD. Development of two types of calcium channels in cultured mammalian hippocampal neurons. Science. 1987;235:680–682. doi: 10.1126/science.2433765. [DOI] [PubMed] [Google Scholar]
- 78.Zamponi GW, Bourinet E, Nelson D, Nargeot J, Snutch TP. Crosstalk between G-proteins and protein kinase C mediated by the calcium channel α1 subunit. Nature. 1997;385:442–446. doi: 10.1038/385442a0. [DOI] [PubMed] [Google Scholar]