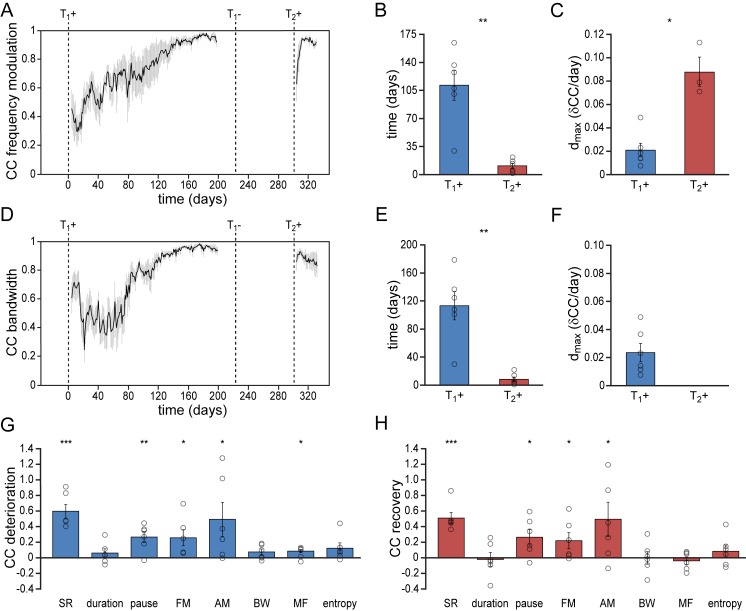
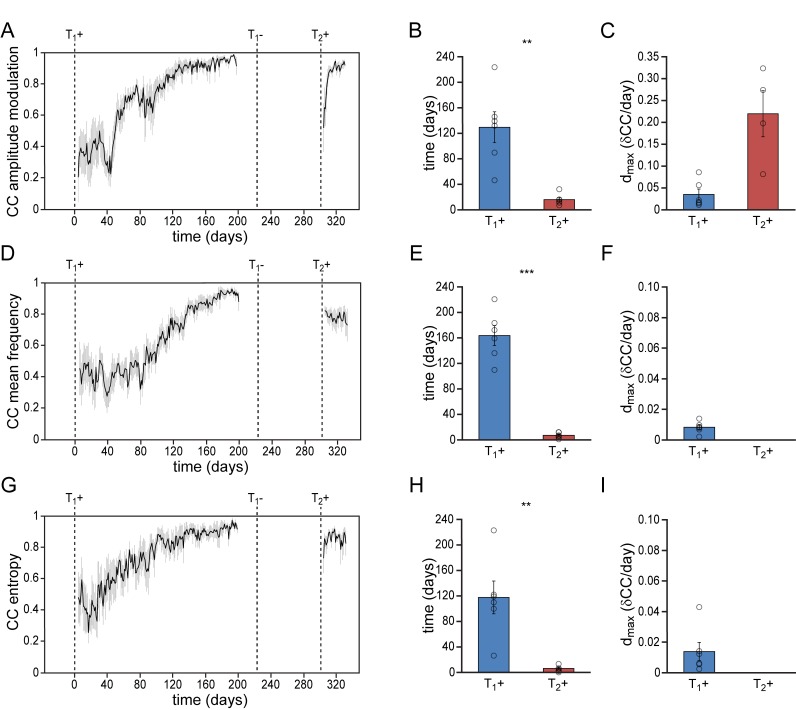
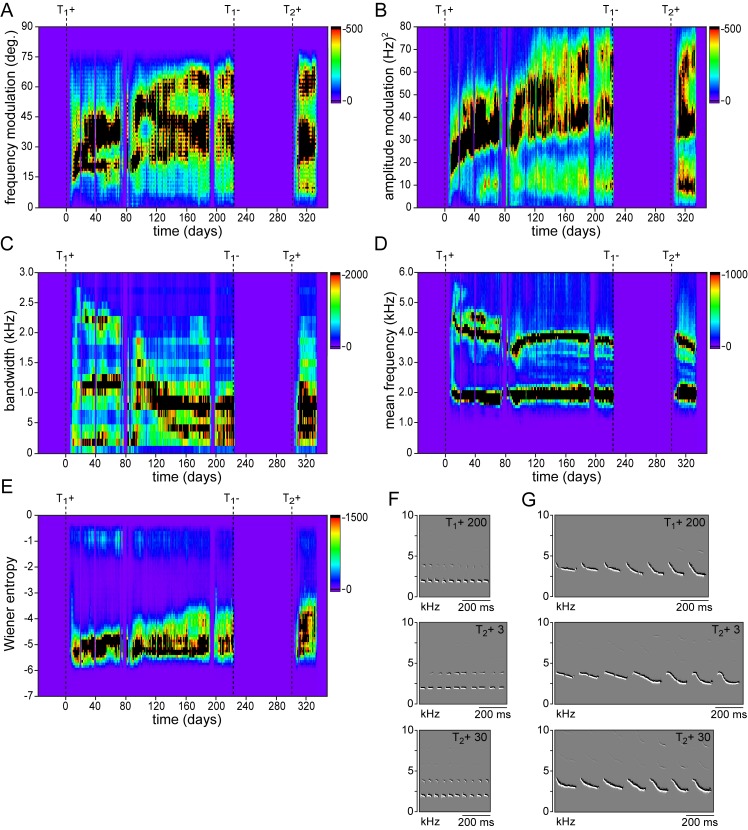
Figure 3. Differential re-development of song features.
(A) Mean correlation plot for all animals illustrating the development of the frequency modulation (FM) distribution in the song during the development (T1+) and re-development (T2+) of song. The correlation plot illustrates a gradual FM development during T1+, followed by a short phase of FM re-development during T2+. (B) Group statistics demonstrating that the stabilization of the FM distribution in the song took less time during a 2nd testosterone treatment (red bars) than during the 1st treatment (blue bars). (C) The peak day-to-day increase in the FM CC (dmax) was significantly higher during a 2nd testosterone treatment than during the 1st treatment. (D) Mean correlation plot for the syllable bandwidth showing a gradual development during a 1st testosterone treatment (T1+), followed by an immediate recovery of syllable bandwidth during a 2nd treatment (T2+). (E) Group statistics demonstrating that stable syllable bandwidths were achieved more quickly during a 2nd testosterone treatment (red bars) than during the 1st treatment (blue bars). (F) The peak day-to-day increase in the syllable bandwidth CC (dmax) for T1+. Dmax could not be calculated for T2+, as we observed no developmental increase of this song feature during the 2nd testosterone treatment. (G) Deterioration in the distribution patterns of all analyzed song features during absence of song production (T1-), and (H) subsequent recovery of song features during testosterone-induced re-development of song (T2+). Grey bars in A and D indicate the SEM. Columns in B,C and E-H represent the mean ± SEM and open circles indicate individual data points (*p<0.05, **p<0.01, ***p≤0.001, paired t-test (B,C,E,F) and one-sample t-test (G,H), n = 6 animals). Source data for acoustic features are available in the Figure 3—source data 1.


