

Abstract
Neurofibromatosis type II (NF2) is a disease that lacks effective therapies. NF2 is characterized by bilateral vestibular schwannomas (VSs) that cause progressive and debilitating hearing loss, leading to social isolation and increased rates of depression. A major limitation in NF2 basic and translational research is the lack of animal models that allow the full spectrum of research into the biology and molecular mechanisms of NF2 tumor progression, as well as the effects on neurological function. In this protocol, we describe how to inject schwannoma cells into the mouse brain cerebellopontine angle (CPA) region. We also describe how to apply state-of-the-art intravital imaging and hearing assessment techniques to study tumor growth and hearing loss. In addition, ataxia, angiogenesis, and tumor–stroma interaction assays can be applied, and the model can be used to test the efficacy of novel therapeutic approaches. By studying the disease from every angle, this model offers the potential to unravel the basic biological underpinnings of NF2 and to develop novel therapeutics to control this devastating disease. Our protocol can be adapted to study other diseases within the CPA, including meningiomas, lipomas, vascular malformations, hemangiomas, epidermoid cysts, cerebellar astrocytomas, and metastatic lesions. The entire surgical procedure takes ~45 min per mouse and allows for subsequent longitudinal imaging, as well as neurological and hearing assessment, for up to 2 months.
Introduction
NF2 is a dominantly inherited genetic disease characterized by bilateral VSs. VSs are nonmalignant tumors composed of neoplastic Schwann cells that arise from the eighth cranial nerve1,2. VSs cause progressive and debilitating hearing loss, leading to social isolation and an increased rate of depression3,4. As these intracranial, extra-axial tumors grow from the internal auditory canal into the CPA area, they can cause dizziness, facial paralysis, other cranial neuropathies, and even death from brainstem compression. Surgical removal and radiation therapy (RT) are the only approved therapies for VS and NF2. However, both treatments have risks, including exacerbation of hearing loss5. There is an urgent need for better understanding of the biology and mechanisms of schwannoma progression and hearing loss and for the development of novel targeted therapeutics.
A major limitation of NF2 basic and translational research is the lack of animal models that allow the full spectrum of research into the biology and molecular mechanisms of NF2 tumor progression, as well as its effects on neurological function. In mice, the short length and small caliber of the vestibular nerves, their encasement in the bony internal auditory canal, and the small size of the CPA pose technical challenges for orthotopic tumor implantation. In this protocol, we describe how to inject schwannoma cells into the mouse brain CPA region (Fig. 1). We also describe how to apply state-of-the-art intravital imaging techniques and hearing tests. These and additional neurological tests can be used to study VS pathobiology from every angle, including tumor growth, hearing and neurological function, angiogenesis, and tumor–stroma interaction, as well as to test the efficacy of novel therapeutic approaches. This model has been used previously to elucidate the role of the HGF/ cMET pathway in VS progression and resistance to RT, and to test the efficacy of cMET inhibitor in controlling VS growth and enhancing RT efficacy6.
Fig. 1. Surgical procedure for stereotactic injection in CPA model.

a, Cut and flip the skin flap, and then expose and clean the periosteum to the temporal crests. b, Use a scalpel to detach the cervical trapezius muscle from the skull and reflect it posteriorly to fully expose the skull above the cerebellum. c, Draw a 2–3-mm circle around the implantation site that is 2.2 mm lateral to the confluence of the sagittal and transverse sinuses, and 0.5 mm dorsal past the transverse sinus. d, Drill a groove (arrow) around the margins of the circle, and deepen the groove by repetitive drilling until the bone flap becomes loose. e, Flip the bone flap carefully, without detaching it. f, Fix the mouse in the stereotactic device and inject tumor cells. g, After injection, flip the bone flap back into its anatomic position. h, Apply one drop of glue to fix the bone flap. Institutional regulatory board permission for our experiments was obtained from the MGH institutional animal care and use committee (IACUC).
Applications of the CPA models
The CPA model can be used for a variety of studies.
Evaluation of tumor growth and testing of the efficacy of potential therapeutics
Tumor cells are transduced with the secreted bioluminescent Gaussia luciferase (GLuc) reporter gene to enable the monitoring of tumor growth by blood GLuc reporter gene assay (Fig. 2), which is an inexpensive, rapid, and sensitive method of measuring tumor growth and response to treatment7–9.
Fig. 2. Confirmation of CPA tumor location and evaluation of tumor growth.

Mouse NF2−/− Schwann cells are stereotactically injected into the CPA region of mice. a, During protocol development, MRI imaging was used to confirm tumor formation in the CPA region. T1-weighted images were obtained following intravenous administration of Magnevist (0.3 mmol/kg) via the tail vein, using the rapid acquisition relaxation-enhanced (RARE) sequence: TR (repetition time), 873 ms; TE (echo time), 17.8 ms; flip angle, 90°; 12 repetitions were acquired and averaged; acquisition time, 5 min 36 s; matrix size, 192 × 192; field of view, 2.5 × 2.5 cm; slice thickness, 0.5 cm; 16 sections were acquired and used29. White arrow points to the CPA tumors. b, High-resolution ultrasound of the brain 12 d after tumor implantation in the CPA. White arrow points to wire mesh of tumors; rendering is from 3D data reconstruction using software from the Vevo770 In Vivo Imaging System and following the manufacturer’s instructions. c, During protocol development and optimization, concomitant measurement of blood GLuc activity and the tumor volume by ultrasound through a cerebellar window in mice bearing CPA NF2−/− schwannoma showed linear correlation between the two measurements (N = 12). d, Representative H&E image of the brain section of a mouse bearing NF2−/− schwannomas (white arrow) located in proximity to the cochlea (black arrow). Scale bars, 2 mm (a); 1 mm (d). Adapted with permission from Zhao, Y. et al. Targeting the cMET pathway augments radiation response without adverse effect on hearing in NF2 schwannoma models. Proc. Natl. Acad. Sci. USA 115, E2077–E2084 (2018). Institutional regulatory board permission for our experiments was obtained from the MGH IACUC.
Neurological function evaluation
Understanding the mechanisms of hearing loss and developing novel strategies to preserve hearing and other neurological functions are the ultimate goals of VS research. In this CPA model, we can test hearing function by measuring distortion-product otoacoustic emissions (DPOAEs) and auditory brainstem response (ABR)6 (Figs. 3, 4). We can also test the severity of ataxia symptoms by a group of ataxia score tests (ledge test, hind-limb clasping test, and gait test) (Figs. 3, 4). These tests are derived from previously published phenotype assessments used in mouse models of Huntington’s disease, spinocerebellar ataxias, and spinobulbar muscular atrophy10. Coordination and motor activity can be assessed by rotarod performance test9 (Fig. 3).
Fig. 3. Surgery and tumor implantation techniques do not affect hearing or neurological function.
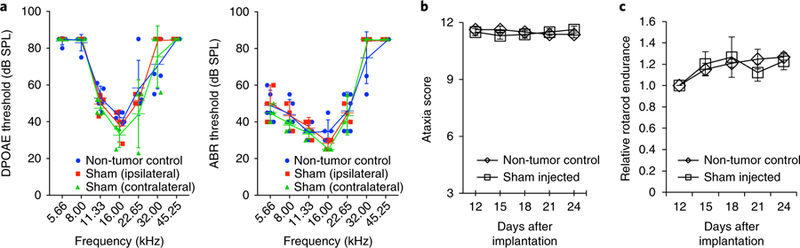
a, In uninjected non-tumor-bearing control mice (n = 5) and in mice that underwent unilateral sham surgery (saline injection) (n = 3), DPOAE and ABR tests show no differences in thresholds either ipsilaterally or contralaterally. Data presented are mean ± SEM. Adapted with permission from Zhao, Y. et al. Targeting the cMET pathway augments radiation response without adverse effect on hearing in NF2 schwannoma models. Proc. Natl. Acad. Sci. USA 115, E2077–E2084 (2018). b,c, Ataxia score test10 (b) and rotarod performance test9 (c) show no differences between uninjected non-tumor-bearing control and sham groups (n = 12). Institutional regulatory board permission for our experiments was obtained from the MGH and MEEI IACUCs.
Fig. 4. CPA tumors induce hearing loss and ataxia in mice.

a, Mice with NF2−/− schwannomas in the CPA model (n = 6) have elevated ABR thresholds ipsilateral to the tumor compared to thresholds contralateral to the tumor or thresholds in non-tumor-bearing control mice (n = 5). Significance of the results: P = 0.03 for 5.66, 8.00, and 22.65 kHz; P = 0.01 for 11.33 and 16.00 kHz. Although DPOAE thresholds demonstrate a trend for elevation at some frequencies, this trend does not reach statistical significance. Adapted with permission from Zhao, Y. et al. Targeting the cMET pathway augments radiation response without adverse effect on hearing in NF2 schwannoma models. Proc. Natl. Acad. Sci. USA 115, E2077–E2084 (2018). b, Compared to non-tumor-bearing mice (n = 12), mice bearing NF2−/− tumors in the CPA model (n = 8) start to show decreased ataxia score 2 weeks after tumor implantation, which deteriorates over time. c, In mice bearing NF2−/− schwannomas in the CPA model, changes in ataxia score10 inversely correlate with tumor growth as measured by blood GLuc assay. Institutional regulatory board permission from the MGH and MEEI IACUCs was obtained for all procedures performed within this protocol.
Characterization of tumor–stroma interaction
Combined with the use of transparent cranial windows11, our CPA model can dynamically examine the changes in the stromal compartment in normal brain and in tumors, during disease progression and in response to therapy. Previously, we used optical frequency domain imaging (OFDI) to study vessel perfusion12 (Fig. 5b–d), and multiphoton laser-scanning microscopy (MPLSM) to measure vessel parameters morphologically (diameter, length, surface area, volume, and branching patterns) and functionally (blood flow and permeability) in growing or regressing tumors and brain tissue9,13 (Fig. 5e–g). Combined with the use of transgenic fluorescent reporter mouse lines, MPLSM can also provide information on tumor–host cell interaction (e.g., leukocyte–endothelial cell interaction, immune cell infiltration)13.
Fig. 5. Intravital microscopy imaging of NF2−/− tumors in the CPA model.

a, Mouse bearing a cranial window. 7 d after window implantation, the area around the window implantation shows no signs of inflammation, and the brain and vasculature are clearly visible13. b–d, Representative 3D functional angiography of blood vessels in normal brain (b), early-stage tumors (c; 2 weeks post implantation), and end-stage tumors (d; 4 weeks post implantation) using OFDI microscopy12. Dotted circle indicates tumor area. Colors reflect the depth of view, with white/yellow pixels closer to the window surface and red/black pixels deeper into the tissue. e–g, Representative intravital multiphoton laser-scanning microscopy (MPLSM) images illustrate the vasculature of NF2−/− tumors implanted in the CPA model9. (Top row) Tumor cells expressing GFP (green) and blood vessels (red) are contrast-enhanced by i.v. injection of tetramethylrhodamine BSA (TAMRA, 68,000 molecular weight, red) at 0 min. After 30 min (bottom row), vascular permeability is assessed by examining the leakage of red-fluorescent TAMRA-BSA from the vessel into the extravascular space. e, The normal brain shows no TAMRA leakage. f, Early-stage tumors show modest leakage (white arrows). g, End-stage tumors show extensive leakage. Scale bars, 500 μm (a–d); 100 μm (e–g). Institutional regulatory board permission from the MGH IACUC was obtained for all procedures performed within this protocol.
Adaptation of our model to other diseases of the CPA
Although VS is the most common tumor of the CPA, various other kinds of tumors arise in this area, including meningiomas, cerebellar astrocytoma, lipomas, vascular malformations, hemangiomas, epidermoids, and metastatic lesions. These lesions cause signs and symptoms secondary to secretion of neurotoxic molecules and extracellular vesicles14,15, and compression of the nearby cranial nerves, including the vestibulocochlear, facial, and trigeminal nerves. Using the appropriate tumor cell lines, our protocol can be adapted to study these diseases and to test promising treatments in a longitudinal fashion6.
Comparison with other schwannoma models
Currently, three transplantation models are being used in schwannoma research, the sciatic nerve model6,9,16, the intracranial model9,16, and the hearing-loss models17,18. In addition, several lines of genetically engineered mouse (GEM) models have been developed; these include traditional Nf2+/– knockout19,20, Schwann cell Nf2 conditional knockout21–23, and Schwann cell–specific mutant Nf2 transgenic mice24.
The sciatic nerve model
For experimental VS studies, a widely used model is injection of schwannoma cells under the sciatic nerve sheath in mice6,9,16. As the sciatic nerve is the largest nerve in the body, the implantation procedure is technically straightforward, and the tumor size can be easily measured by caliper. This model may be useful for studies of tumor progression and treatment efficacy. Compared to our model, the sciatic nerve model better reproduces the neuronal microenvironment of peripheral schwannomas. However, the sciatic nerve model has several important drawbacks. First, it does not reflect the symptoms induced by VSs (including hearing loss and dizziness). Second, using this model, evaluation of the neurological function is limited to rotarod assay, which assesses only motor coordination and does not reflect sensory function. Third, this model does not allow for intravital and longitudinal imaging of the tumor microenvironment and tumor–host interaction, which play a key role in tumor progression and response to therapy.
The intracranial model
To study VS angiogenesis, the intracranial model has been used9,16. In this model, tumor cells are injected between the pia and arachnoid meninges in mice bearing transparent cranial windows. Through the transparent cranial window, this model allows (i) direct monitoring of tumor growth using ultrasound, and (ii) dynamic evaluation of the tumor blood vessels using intravital imaging techniques. However, as the tumors are implanted superficially on the mouse brain, this model does not simulate the tumor-induced hearing loss or neurological dysfunction seen in humans.
The auditory–vestibular nerve complex model
Two recent models reproduce schwannoma-induced hearing loss17,18. Bonne et al. implanted tumor cells into the auditory–vestibular nerve complex in mice17. This model reproduces the natural environment of schwannomas. However, because the tumor cells were injected through the internal auditory canal in this model, the surgery and sham injection immediately caused hearing loss and animals took up to 14 d to recover hearing. Dinh et al. implanted schwannoma cells into the cochleovestibular nerve of rats18. The bigger size of the rat skull greatly enhances the ability to perform surgical procedures. These models are advantageous for their ability to mimic the local VS microenvironment; however, they do not allow real-time imaging studies to evaluate changes in the tumor microenvironment.
GEM models
Several lines of Nf2 GEM models have been developed19–24. The traditional Nf2 homozygous knockout mice are not viable25. The heterozygous knockout of the Nf2 gene leads to a high incidence of bone tumors, and the mice do not present with VSs26. The next generation of Nf2 GEM models includes Schwann cell–specific mutant Nf2 transgenic mice and Nf2 conditional knockout mice. Mice of these models present with Schwann cell hyperplasia, and about one-third of the mice develop spinal schwannomas20,21. However, these models do not accurately replicate the intracranial location of schwannomas observed in human NF2-associated and sporadic VSs2,27. Recently, Clapp’s group generated a new mouse model by crossing conditional Nf2 mutant (Nf2flox/flox) mice with transgenic PostnCre mice in which the periostin promoter drives the expression of the Cre recombinase in the Schwann cell lineage23. They have shown that these mice develop intracranial VSs and begin to develop hearing loss at 8 months of age. This model provides a useful experimental tool for investigating the fundamental questions of NF2 tumor biology. However, as for all GEM models, their use in the development of therapeutic drugs is not practical because of the high cost, long time lines, extensive and complex breeding required, and difficulties in obtaining synchronous tumorigenesis.
Experimental design
Our protocol involves four major components. First, a surgical procedure is used to implant VS cells into the CPA region. The surgical procedure is easy and straightforward, and involves drilling a hole into the skull (the cranial door technique), and stereotactically injecting tumor cells into the CPA in mice (Steps 1–25) (Fig. 1). We have successfully grown murine NF2−/− Schwann cells in syngeneic mice and human HEI-193 schwannoma cells in nude mice to establish schwannomas in the CPA model.
Second, tumor growth is measured by blood GLuc assay (Steps 26–30) (Fig. 2). During the development of our model and protocol optimization, we used MRI to confirm tumor formation in the CPA region as early as 7 d post implantation (Fig. 2a)6. However, MRI is costly and time consuming, and requires frequent anesthesia, making serial tumor size measurements infeasible. Blood GLuc assay can be easily tested by drawing a few microliters of blood6,9. To ensure that blood GLuc activity is a precise surrogate measure for monitoring tumor growth, we performed concomitant blood GLuc assay and measurements of tumor volume using ultrasound. The 3D dynamic contrast-enhanced (3D-DCE) ultrasound imaging allows 3D reconstruction of tumor volume and provides accurate volumetric measurement of tumor size. We demonstrated a strong correlation between ultrasound-measured tumor volume and blood GLuc activity (Fig. 2b,c), indicating that the changes in GLuc activity accurately reflect tumor growth. The use of ultrasound in imaging the brain is limited because of the high acoustic impedance of skull bones. To perform ultrasound measurement of brain tumors, we needed to implant a cranial window with a polyethylene coverslip into the mouse head, which is technically challenging and time consuming. Therefore, during model utilization (after the model development stage), we relied on GLuc activity to monitor tumor growth.
The third part of the Procedure is the evaluation of the severity of tumor-induced neurological symptoms and the potential treatment effects on improving neurological function (Steps 31–44). We measure hearing function by DPOAE and ABR tests6 (Figs. 3a, 4a), and cerebellar ataxia using behavior tests, including hind-limb clasping, and ledge and gait tests10. In the Procedure, we describe how to carry out the hearing function tests. In the CPA model, we found that the ledge test, which evaluates coordination, is the most sensitive test, and can detect changes in mice as early as 2 weeks following tumor implantation. The hind-limb clasping test (a marker of disease progression) and the gait test (measuring muscle function and coordination) showed differences at later time points (Figs. 3b, 4b). Balance, motor strength, and coordination can be assayed by rotarod assay9,10 (Fig. 3c).
Finally, the Procedure can be adapted to include application of a cranial window to study the biology and mechanisms of tumor–host interactions in the CPA model (Fig. 5a; ref. 9). The use of cranial windows enables high-resolution, dynamic longitudinal imaging studies, including OFDI to detect perfused vessels (Fig. 5b–d) and intravital MPLSM to examine tumor vessel morphology, measure blood vessel permeability, and monitor delivery of drugs (Steps 45A and B) (Fig. 5e–g)9. To optimize the subsequent intravital imaging, we recommend applying the cranial window before embarking on the procedure and waiting for at least 1 week after window implantation for potential inflammation to subside before tumor cell implantation during a second surgery. Most importantly, when implanting the cranial window, the surgical procedure may force serous fluid from the wound into the outer ear canal and cause conductive hearing loss. Therefore, the use of cranial windows should be avoided in studies aiming to test hearing function.
Considerations when calculating the number of animals required
To obtain a sufficient number of mice with CPA tumors, the survival rate post surgery and tumor cell implantation, as well as the rate of tumor take should be considered. The animal number calculated enables comparison of tumor growth between groups. The expected difference ranges from 0.2-to 3-fold, with standard deviations ranging from 0.5-to 1.5-fold (see the Troubleshooting section). If the true difference is 50% and the standard deviation is 50%, we have >99% power to detect the difference using a two-sided t test with 5% type 1 error and n = 10. Simulations show that we will have >80% power using the van Elteren test with 5% type 1 error. A sample calculation for a typical experimental treatment study in the CPA model is as follows:
An experimental group size that usually allows the detection of potential statistically significant differences in tumor growth between different treatments is n = 10 mice per group. For example, there could be three treatment groups: a control group (treated with vehicle or placebo), a standard-therapy (e.g., radiation) group, and an experimental therapy group.
The overall survival rate after surgery and tumor implantation is 80%. The survival rate may vary with the experience and technical skill level of the scientist performing the surgeries.
For the NF2−/− mouse Schwann cell line, the tumor take rate is 90%.
In this case, 10 mice × 3 groups/0.8 (80% survival rate)/0.9 (90% tumor take rate) = 41 mice.
Considerations of cost and time
The model described in this protocol has a high cost in terms of reagents; surgical, neurologic, and auditory expertise; and the various techniques and equipment used (including those for specialized imaging and hearing assessment). Cost calculations must also take into account animal housing, as well as the time, effort and expertise needed for animal handling and surgery.
Materials
Biological materials
Mice. Syngeneic immune-competent FVB/C57BL/6 mice, both male and female, 10–12 weeks old, are used for implantation of the mouse NF2−/− Schwann cell line. We breed and maintain our mice at the Gnotobiotic Mouse Cox 7 Core at the Massachusetts General Hospital (https://researchcores.partners.org/cox/about). ! CAUTION All animal studies must be reviewed and approved by the relevant animal-care committees, and must conform to all relevant institutional and national ethics regulations. The protocol we describe here and the procedures we carried out were performed according to the guidelines of the Public Health Service Policy on Human Care of Laboratory Animals, and in accordance with protocols approved by the Institutional Animal Care and Use Committee (IACUC) of Massachusetts General Hospital and Massachusetts Eye and Ear. ! CAUTION When using human VS cell lines, such as the established human HEI-193 cell line or other immortalized human VS cell lines, immune-deficient mice (e.g., nude mice (nu/nu) or NOD SCID mice) should be used.
Cell line. We used a murine NF2−/− Schwann cell line (we obtained this as a gift from X. Breakefield, Massachusetts General Hospital) in our study. ! CAUTION When using other available VS cell lines, such as the established human HEI-193 cell line or other immortalized human VS cell lines, check the authenticity of all cell lines (e.g., genotyping of microsatellite markers to determine mouse origin and to exclude mammalian interspecies contamination, using services such as those provided by IDEXX BioResearch, https://www.idexxbioanalytics.com). We have successfully grown human HEI-193 in nude mice by following the same procedure. The cell lines used in your research should also be regularly checked to ensure that they are not infected with mycoplasma. ▲ CRITICALNF2−/− cells should be transduced before use so they express the GLuc reporter gene, which is a secreted reporter that can be detected in the blood of tumor-bearing animals6,7. GLuc vector and assay kits are commercially available from various biotech companies, such as Thermo Fisher Scientific (cat. no. 16146) and New England BioLabs (cat. no. N8084S). Viral infection can be carried out by following the manufacturer’s instructions.
Reagents
Sterile saline (0.9% (wt/vol), sodium chloride; Hospira, cat. no. SKU ABB19660715Z) is used to dilute ketamine and xylazine.
Coelenterazine free base (the GLuc substrate; NanoLight, cat. no. 303NF-VTZ-FB) ▲ CRITICAL Pre-pare a solution of 5 mg/mL in acidified methanol, make aliquots, and store at −80 °C following the manufacturer’s instructions.
EDTA (Sigma-Aldrich, cat. no. 60–00-4)
Trypsin-EDTA (Thermo Fisher, cat. no. 25200056)
Tetramethylrhodamine BSA (TAMRA-BSA; Invitrogen, cat. no. A23016)
Magnevist (Sigma-Aldrich, cat. no. 50419–188-81)
Ocular lubricant (Paralube; Patterson Veterinary, cat. no. 07–888-2572)
PBS (Corning Cellgro, cat. no. 24018007)
Ethanol (Decon Laboratories, cat. no. 2701)
Povidone–iodine solution (Thermo Fisher Scientific, cat. no. 3955–16)
Anesthesia
▲ CRITICAL Ketamine and xylazine can be obtained from pharmacies; we obtained ours from the Massachusetts General Hospital pharmacy.
Ketamine (90 mg/kg body weight; Ketaset; Patterson Veterinary, cat. no. 07–803-6637); add to sterile saline to obtain the described concentration. ! CAUTION Ketamine may cause prolonged respiratory depression. It is a controlled substance and should be handled accordingly.
Xylazine (9 mg/kg body weight; AnaSed; Patterson Veterinary, cat. no. 07–893-2121); add to sterile saline to obtain the described concentration. ! CAUTION Xylazine may cause prolonged respiratory depression. It is a controlled substance and should be handled accordingly.
Analgesia
Buprenorphine (Buprenex; Patterson Veterinary, cat. no. 07–891-9756) is used at a concentration of 0.1 mg/kg. ! CAUTION Buprenorphine may cause prolonged respiratory depression. Wear protective equipment and avoid contact or inhalation. Buprenorphine is a controlled substance and should be handled accordingly. ▲ CRITICAL Buprenorphine is injected subcutaneously.
Equipment
Surgical supplies
Bone microdrill for brain surgery (Harvard Apparatus, model no. PY272–4950)
Straight iris scissors (Bonn, cat. no. RS-5840)
Straight forceps (Bonn, cat. no. RS-8140)
Dumont forceps, no. 3 and no. 5 (Bonn, cat. nos. RS-5042 and RS-5045)
Ethibond suture 5–0 (Ethicon, SKU no. 319–4433)
Thermal pad (Shor-Line, model no. 712.0000.04)
Sterile gauze (e.g., Covidien, cat. no. 1700)
Sterile cotton swabs (Owens and Minor, cat. no. WOD1002)
Sterile Gelfoam (hemostatic size 100; McKesson, cat. no. 189842)
Cyanoacrylate glue (Krazy Glue, all-purpose, one-drop applicator)
Marking pen (e.g., Newell, cat. no. 32703)
Dissecting scissor (Kent Scientific, cat. no. INS600393)
Stereotactic injection supplies
Stereotactic frame (small-animal stereotactic apparatus; David Kopf, model no. KOPF921)
Bright-field stereomicroscope (Olympus, model no. SZ61)
Syringe, 10 μL (Hamilton, cat. no. 7635–01)
2-inch PT2 needle (Hamilton, cat. no. 7758–01)
BD tuberculin syringe, 1 mL, 26-gauge needle (Fisher, cat. no. 14–823-2E)
Tumor growth, imaging, and neurological function evaluation equipment
GloMax microplate Luminometer (Promega, model no. E6521)
DPOAE/ABR setup (we use a customized rig for our experiments, but commercial off-the-shelf systems are available from several manufacturers, e.g., Tucker-Davis Technologies, Intelligent Hearing Systems)
Microphone-speaker probe (PCB Piezotronic, cat. no. 377C10)
PXI chassis (Artisan Technology Group, cat. no. 778932–01)
LabVIEW (National Instruments, cat. no. 784503–35)
Multiphoton imaging system with a broadband femtosecond laser source (described in refs. 13,28)
Procedure
Surgery to create the cerebellar ‘door’ for tumor implantation ● Timing 30 min
-
1
Inject buprenorphine (0.1 mg/kg body weight) s.c. 15 min before surgery. Anesthetize the animal with an i.p. injection of a ketamine/xylazine mixture (90 mg/kg body weight and 9 mg/kg body weight, respectively). Ensure that the animal is sufficiently anesthetized by testing its pedal reflex and monitoring its respiration.
! CAUTION All experiments with mice should be approved by the relevant IACUC and should adhere to national and institutional guidelines.
? TROUBLESHOOTING
-
2
Apply an ophthalmic lubricant to the eyes to avoid corneal desiccation.
-
3
Place the mouse in the stereotactic frame and stabilize its head under the bright-field microscope.
▲ CRITICAL STEP Ensure that the position of the mouse is secure.
-
4
Make a longitudinal incision into the skin between the occiput and the forehead (Fig. 1a). Expose and clean the periosteum to the temporal crest with a sterile cotton swab.
▲ CRITICAL STEP Do not apply ethanol to open wounds or the exposed skull.
▲ CRITICAL STEP All surgical tools must be sterile.
-
5
Use a scalpel to detach the cervical trapezius muscle from the skull (Fig. 1b) and reflect it posteriorly to fully expose the skull above the cerebellum (Fig. 1c).
! CAUTION Bleeding will occur during this step.
? TROUBLESHOOTING
-
6
Draw a 2-to 3-mm circle around the implantation site that is 2.2 mm lateral to the confluence of the sagittal and transverse sinuses, and 0.5 mm dorsal past the transverse sinus.
-
7
Use a high-speed bone microdrill with a 1.4-mm-diameter burr tip to make a groove around the margins of the circle (Fig. 1d).
▲ CRITICAL STEP Drill slowly and apply cold saline regularly to avoid thermally induced injury to the brain.
▲ CRITICAL STEP The bone overlying the cerebellum is thin. Drill slowly and carefully to avoid damage.
-
8
Gradually deepen the groove by gentle, repetitive drilling until the bone flap becomes loose and/or the cerebellar surface vessels become visible.
▲ CRITICAL STEP Do not apply excessive pressure. Check the depth of the groove and the thickness of the skull. Some bleeding from the skull may occur.
? TROUBLESHOOTING
-
9
Use a Malis dissector to separate the bone flap from the dura mater underneath. Flip the bone flap carefully without detaching it to expose the brain (Fig. 1e).
▲CRITICAL STEP Use sterile saline when removing the bone flap. Be careful not to damage the cerebellar surface vasculature.
▲ CRITICAL STEP The dura is attached to the cranium. Dural capillaries may tear, resulting in bleeding.
? TROUBLESHOOTING
-
10
Place a piece of Gelfoam on the dura mater to stop any bleeding and keep the cerebellum moist.
Implantation of tumor cells into the CPA area ● Timing 10–15 min
-
11
Immediately after the hole has been drilled in the bone, place a Hamilton syringe with a 28-gauge needle loaded with NF2−/− cells (2,500 cells/1 μL) on the stereotactic injection device, and adjust it to an angle of 10–15° offset from the vertical plane.
? TROUBLESHOOTING
-
12
Make sure that the head of the mouse is fixed in the stereotactic device such that the surface of the cerebellum is parallel to the horizontal plane (Fig. 1f).
-
13
Remove the Gelfoam. Use the 3D coordination setup of the stereotactic device to place the tip of the Hamilton syringe needle close to the confluence of the sagittal and transverse sinuses.
-
14
Move the needle 2.2 mm laterally to the confluence of the sagittal and transverse sinuses, inferiorly in the caudal direction to the transverse sinus, and then continue another 0.5 mm.
-
15
Carefully lower the syringe 3.7 mm into the CPA region.
▲ CRITICAL STEP Dural capillaries may tear, resulting in bleeding. Use Gelfoam to stop the bleeding.
-
16
Retract the syringe 1 mm.
-
17
Inject the cell suspension (1 μL) slowly over 30 s.
-
18
Hold the syringe for 60 s.
-
19
Rinse the surface of the cerebellum with sterile saline to remove tumor cells that may have leaked at the injection site.
-
20
Retract the syringe slowly over 30 s until it exits the brain; while retracting the syringe, continuously rinse the surface of the brain with sterile saline.
▲ CRITICAL STEP The slow retraction, coupled with debridement, could mitigate leakage of tumor cells onto the brain surface.
? TROUBLESHOOTING
-
21
Place Gelfoam on the cerebellum to absorb saline and/or blood.
-
22
Flip the bone flap back into its anatomic position (Fig. 1g).
-
23
Use a cotton swab to dry the bone flap and the surrounding areas, and apply one drop of glue to fix the bone flap (Fig. 1h).
-
24
Close the skin, using a running 5–0 Ethibond suture.
-
25
Leave the mouse on the heating pad and allow the mouse to recover from the anesthesia. Apply postoperative analgesia according to the specific animal protocol at your institution. The next day, subcutaneously administer buprenorphine to the mouse at a concentration of 0.1 mg/kg body weight or as needed for analgesia.
! CAUTION After the surgical procedures, the mice should be kept in a pathogen-free condition with sufficient food and water. The quality of each surgery and the health of the mouse are key determinants of imaging quality and the accuracy of neurological function evaluation, as hemorrhage or tissue damage can obscure key features of the brain and tumor vasculature and brain function.
Evaluation of tumor growth by GLuc assay ● Timing 15 min
▲ CRITICAL 7 d after tumor cell implantation, GLuc assay can be performed and repeated every 3 d.
-
26
Prepare a solution of 50 μM coelenterazine in PBS.
▲ CRITICAL STEP Coelenterazine is prone to auto-oxidation, resulting in a decrease in signal over time. To stabilize this substrate, prepare the working concentration and incubate the coelenterazine mixture for 30 min at room temperature (25 °C) in the dark before use.
-
27
Place a mouse in the proper constraints, clean the tail with 70% (vol/vol) ethanol, and use a sterile scalpel to make a small cut into the tail vein (no anesthesia required).
-
28
Withdraw 10 μL of blood from the cut, immediately mix the sample with 10 μL of 10 mM EDTA (as an anticoagulant).
-
29
Measure the GLuc activity using a plate luminometer, which should be set to inject 100 μL of coelenterazine and to acquire photon counts for 10 s.
-
30
Analyze the data by plotting the relative light units (RLUs; y axis) with respect to time (x axis). Animals will be randomized for their GLuc activity level and included in control or treatment arms.
? TROUBLESHOOTING
Hearing test ● Timing 1–1.5 h for each ear of the mouse
▲ CRITICAL Hearing tests can be performed after confirmation of tumor formation by GLuc assay or at different time points after treatments.
▲ CRITICAL The operators responsible for the experimental procedure and data analysis should be blinded to and so unaware of group allocation throughout the experiments.
-
31
Make sure that the mouse is not completely deaf by using a finger friction test close to its head and noting the appropriate acoustic startle reflex (i.e., Preyer’s reflex).
▲ CRITICAL STEP If testing a new mouse strain and establishing reference values for untreated control animals, make sure that the rodents are sex- and age-matched with the tumor-bearing mice, because these variables can influence hearing.
? TROUBLESHOOTING
-
32
Anesthetize the animal with an i.p. injection of ketamine 0.1 mg/g and xylazine 0.02 mg/g.
-
33
Apply an ophthalmic lubricant to the eyes.
-
34
Disinfect the area between the tragus and antitragus of the auricle with a povidone–iodine and/or an alcohol-based solution.
-
35
Create a cut (~3 mm long) parallel to the edges of the tragus and antitragus to inferiorly extend the external auditory canal and create more space for the placement of electrodes and the microphone-speaker probe.
-
36
Place the mouse in the sound-attenuating chamber.
-
37
Position subdermal electrodes at the lower ipsilateral pinna (positive), the nose bridge (negative), and the junction of the tail and torso (ground). Although the vertex of the skull is often used to place the negative electrode in other experiments, this area has been affected by the surgery and should be avoided in these animals.
? TROUBLESHOOTING
-
38
Calibrate the setup.
-
39
Lower the microphone-speaker probe to a standardized position in the external auditory canal, making sure that the distance between the tympanic membrane and the probe is identical between measurements of different ears/animals.
-
40
Carry out an additional in-ear ‘acoustic calibration’ that matches the other measurements in this experimental series. For this, the data are stored as a look-up table, and conversion factors between decibel sound pressure level (SPL) at the ear and voltage at the microphone are established for each input frequency. Curves of the last few tests are juxtaposed and can thus be compared.
-
41
Close the door of the sound-attenuating chamber and make sure that the light and surrounding noise are consistent during measurements.
-
42
Measure DPOAEs and ABRs, potentially on both sides, with repositioning of the pinna electrode, when changing ears. To do this, simultaneously present two primary tones (f1 and f2) with the frequency ratio f2/f1 = 1.2 at half-octave steps from f2 = 5.66–45.25 kHz. Increase the intensity in 5-dB steps from a 15-to an 80-dB SPL. Monitor the 2f1–f2 DPOAE amplitude and the surrounding noise floor to allow the definition of a threshold as the f2 intensity creating a distortion tone that is >0-dB SPL. Record ABR waveforms via the subdermal electrodes described above. The same frequencies and sound levels as for DPOAE measurements should be tested. Amplify the responses (10,000×), filter (0.3–3.0 kHz), and average (512 repetitions). We acquire data using a custom LabVIEW application installed on a PXI chassis. The auditory threshold for each frequency should be set as the lowest intensity at which recognizable peaks can be detected. In the case of no response, 85 dB is chosen as the threshold (i.e., 5 dB above the highest level tested).
▲ CRITICAL STEP Administer an i.p. boost injection of ketamine (half to one-third of the induction dose) every 20–30 min.
? TROUBLESHOOTING
-
43
Remove the electrodes, let the mouse recover from the anesthesia, and return it to its cage.
Evaluation of tumor blood vasculature using intravital microscopy ● Timing 45–60 min for each mouse for MPLSM and 20 min for each mouse for OFDI imaging
▲ CRITICAL Imaging studies can be performed after confirmation of tumor formation by GLuc assay or at different time points after treatments.
▲ CRITICAL The operators responsible for the experimental procedure and data analysis should be blinded and thus unaware of group allocation throughout the experiments.
-
44
Anesthetize the mice as described in Step 1.
-
45
Position the mouse on an imaging stage and fasten the head of the animal within a stereotactic frame to minimize motion artifacts. Carry out MPLSM (option A) to examine tumor blood vessel morphology, measure blood vessel permeability, and monitor delivery of drugs9,13. Alternatively, use optical frequency domain imaging (OFDI) imaging (option B) to detect perfused vessels in tumor and normal tissues11.
-
Multiphoton laser-scanning microscopy
Inject the blood vessel tracer TAMRA-BSA (1% (wt/vol)), 100 μL per 25 g of body weight), into the right retro-orbital sinus.
Add distilled water as an immersion liquid between the cerebellar window and the long-working-distance 20 × 0.40 numerical aperture (NA) objective.
Adjust the height of the objective and navigate to the area of interest.
Turn on the laser of a multiphoton imaging system with a broadband femtosecond laser source as described previously13,28. Set the laser to ~60 mW on sample laser power at an 820-nm wavelength for fluorescent signal detection. We used a 610DF75 emission filter for red fluorescent TAMRA-labeled blood vessels, and a 535DF43 filter for green fluorescent protein (GFP)-labeled tumor cells in front of the photomultiplier tubes.
-
Use the slowest acquisition time to get the best-quality images possible and do not digitally alter gain or offset. Perform xyz imaging, with z (depth) ~100 μm. For measuring the permeability of tumor vasculature, we repeated the imaging of the same area every 15 min to observe leaking of TAMRA-BSA into the surrounding tissue.
▲ CRITICAL STEP Check that the imaging system is working properly according to the manufacturer’s guidelines before each imaging session.
? TROUBLESHOOTING
-
OFDI imaging
-
Adjust the height of the stage to make sure that the tissue is within the working distance of the OFDI lens.
? TROUBLESHOOTING
-
Scan through the tissue and make sure that it is horizontally level.
▲ CRITICAL STEP If the tissue is not level, vessels may appear in one side of the tissue but not the other.
? TROUBLESHOOTING
Adjust the imaging window size in the software to match the tissue size.
-
Next, adjust the stage to make sure that the whole tissue is within the imaging area. Start acquisition.
? TROUBLESHOOTING
-
-
Troubleshooting
Troubleshooting advice can be found in Table 1.
Table 1 |.
Troubleshooting table
| Step | Problem | Possible reason | Solution |
|---|---|---|---|
| 1 | Mouse is not fully anesthetized | •Anesthetic dose was insufficient | Increase the dose of anesthesia |
| • Different strains of mice may have different sensitivities to anesthesia | |||
| Mouse dies while under anesthesia | • Different strains of mice may have different sensitivities to anesthesia | Anesthesia should be carefully titrated and monitored with respiratory gating for the duration of tumor implantation, imaging, and neurological function tests | |
| • When mice become moribund at the end stage, they may be more sensitive to anesthesia | |||
| Mouse experiences hypothermia | The mouse cannot maintain stable body | Use a rectal temperature probe to monitor the body temperature and initiate appropriate actions that stabilize core body temperature, such as applying a heating pad | |
| temperature during general anesthesia | |||
| 5,8,9 | Bleeding from the skull | Injury to blood vessel | Provide hemostasis with Gelfoam, and then rinse with sterile saline |
| 11 | Difficulty in detaching tumor cells from cell culture flask | Trypsin condition is not optimal | Rinse the flask with PBS to completely remove the FBS |
| • Increase the amount of trypsin–EDTA | |||
| • Incubate the trypsin reaction in a 37 °C cell culture incubator | |||
| 20 | Tumor cell leak during the injection | Injection and retraction of the needle were performed too quickly | Inject the cells slowly (over 30 s), hold the syringe for 60 s, and retract over 30 s |
| 30 | Low GLuc reading | • GLuc reporter gene level is low in tumor cells | • Repeat in vitro cell culture and counting |
| • Test the cells for mycoplasma contamination | |||
| • GLuc assay is not optimal | • Re-infect tumor cells with GLuc virus | ||
| • Repeat sorting/selection of GLuc-transduced tumor cells | |||
| • Optimize GLuc assay, including use of a new kit and checking the luminometer setting | |||
| 31 | Hearing loss in mice bearing cranial window | The surgical procedure to implant the cranial window can cause an accumulation of secretions in the external auditory canal | Use mice without cranial windows for hearing testing |
| 37 | High rejection rate during the hearing test (strong background activity) | Electrodes are positioned incorrectly or anesthetic depth is inadequate | Reposition the electrodes or provide anesthetic boost as needed |
| 42 | Large variation between DPOAE and ABR measurements | The positioning of the electrodes is inconsistent and the recording system is not correctly calibrated | Consistently position the electrodes at the same anatomical location and calibrate the system before testing |
| 45A(v) | Cerebellar window becomes loose or dislodged | Too much force may have been used when fixing a window for imaging | Handle the mouse gently when fixing the window and ensure that the mouse is anesthetized while imaging |
| Tumor burden is not detectable by IVM | Tumors may be too small or tumors are implanted too deeply to image | Carefully scan the areas implanted with tumor cells or wait until tumors reach a larger size to image | |
| 45B(i) | Blurry image | • Tissue is outside the focal plane | • Adjust the distance between the tissue and the lens |
| • Coverslip is dirty | |||
| • Clean the coverslip with an alcohol swab | |||
| 45B(ii) | Vessels appear in one side of the tissue but not the other | Tissue is not level | • Adjust the animal to level the tissue |
| • Use a surface normalization algorithm | |||
| 45B(iv) | Vessel appearance and clarity differ between the tumor and the surrounding tissue | Tumor growth leads to changes in tissue topography | Image the tissue twice, both at the tumor plane and in the tissue plane |
Timing
Steps 1–10, surgery: 30 min
Steps 11–25, implantation of tumor cells: 10–15 min
Steps 26–30, blood GLuc measurement: 15 min
Steps 31–43, hearing test: 1–1.5 h/ear
Steps 44 and 45, intravital imaging: 1–2 h/mouse
Anticipated results
7 d following tumor implantation, we expect to detect tumor mass in the CPA region using MRI imaging (Fig. 2a). Once the tumor formation in the CPA region is confirmed, monitoring of tumor growth is continued by testing blood GLuc levels every 3 d. Tumors are expected to grow and mice are expected to become moribund in 3–5 weeks (Fig. 2b,c).
Hearing function is evaluated by measuring DPOAEs and ABRs. The surgical procedure involving skull drilling for a craniotomy and needle injections for tumor cell implantation should not cause hearing loss (Fig. 3a). Increased DPOAE and ABR thresholds should be found in tumor-bearing mice, indicating tumor-induced hearing loss (Fig. 4a).
Surgery and tumor implantation procedures should not result in ataxia symptoms and affect rotarod performance (Fig. 3b,c). Mice are expected to develop symptoms of ataxia 2 weeks after tumor implantation, and the severity of ataxia will increase as tumors progress (Fig. 4b,c).
Imaging of tumor lesions is generally feasible 1–2 weeks after tumor implantation. Using intravital microscopy (IVM), we anticipate finding high levels of angiogenesis in the tumor area, and abnormal tumor vessels both morphologically (with chaotic organization, and highly dense and tortuous vessels) and functionally (with increased permeability and decreased perfusion) (Fig. 5c,d,f,g). In the surrounding brain tissue, we also expect to see vascular morphological changes due to the increase in demand for nutrients induced by the growing tumor (Fig. 5b,e).
Reporting Summary
Further information on research design is available in the Nature Research Reporting Summary.
Supplementary Material
Acknowledgements
We thank S.M. Chin and V. Askoxylakis for their superb technical support. This study was supported by a Department of Defense (DoD) New Investigator Award (W81XWH-16–1-0219, L.X.); an American Cancer Society Research Scholar Award (RSG-12–199-01-TBG, L.X.); the Children’s Tumour Foundation Drug Discovery Initiative (L.X.); an Ira Spiro Award (L.X.); a Simeon J. Fortin Charitable Foundation Postdoctoral Fellowship (M.R.N.); a DoD BCRP Postdoctoral Fellowship (W81XWH-14–1-0034, M.R.N.); grants NCI P01-CA080124, P50-CA165962, R01-CA129371, R01-CA208205, and U01-CA 224348; an Outstanding Investigator Award (R35-CA197743, R.K.J.); the Lustgarten Foundation; the Ludwig Center at Harvard; the National Foundation for Cancer Research; the Gates Foundation (R.K.J.); NIDCD grant R01DC015824 (K.M.S.); the Bertarelli Foundation (K.M.S.); the Nancy Sayles Day Foundation (K.M.S.); the Lauer Tinnitus Research Center (K.M.S.); the Barnes Foundation (K.M.S.); and the Zwanziger Foundation (K.M.S.).
R.K.J. has received consultant fees from Merck, Ophthotech, Pfizer, Sun Pharma Advanced Research Corporation (SPARC), SynDevRx, and XTuit; owns equity in Enlight, Ophthotech, SynDevRx, and XTuit; serves on the board of directors of XTuit and the boards of trustees of Tekla Healthcare Investors, Tekla Life Sciences Investors, Tekla Healthcare Opportunities Fund, and Tekla World Healthcare Fund; and received honorarium for speaking at AMGEN. No funding or reagents from these companies were used in these studies.
Footnotes
Data availability
The data obtained using this protocol are available at https://doi.org/10.1073/pnas.1719966115.
Competing interests
The remaining authors declare no competing interests.
Publisher’s note: Springer Nature remains neutral with regard to jurisdictional claims in published maps and institutional affiliations.
Supplementary information is available for this paper at https://doi.org/10.1038/s41596-018-0105-7.
References
- 1.Evans DG et al. A clinical study of type 2 neurofibromatosis. Q. J. Med 84, 603–618 (1992). [PubMed] [Google Scholar]
- 2.Plotkin SR, Merker VL, Muzikansky A, Barker FG 2nd & Slattery W 3rd Natural history of vestibular schwannoma growth and hearing decline in newly diagnosed neurofibromatosis type 2 patients. Otol. Neurotol 35, e50–56 (2014). [DOI] [PubMed] [Google Scholar]
- 3.West JS, Low JC & Stankovic KM Revealing hearing loss: a survey of how people verbally disclose their hearing loss. Ear Hear 37, 194–205 (2016). [DOI] [PMC free article] [PubMed] [Google Scholar]
- 4.Kim SY et al. Severe hearing impairment and risk of depression: a national cohort study. PLoS ONE 12, e0179973 (2017). [DOI] [PMC free article] [PubMed] [Google Scholar]
- 5.Plotkin SR et al. Hearing improvement after bevacizumab in patients with neurofibromatosis type 2. N. Engl. J. Med 361, 358–367 (2009). [DOI] [PMC free article] [PubMed] [Google Scholar]
- 6.Zhao Y et al. Targeting the cMET pathway augments radiation response without adverse effect on hearing in NF2 schwannoma models. Proc. Natl. Acad. Sci. USA 115, E2077–E2084 (2018). [DOI] [PMC free article] [PubMed] [Google Scholar]
- 7.Tannous BA Gaussia luciferase reporter assay for monitoring biological processes in culture and in vivo. Nat. Protoc 4, 582–591 (2009). [DOI] [PMC free article] [PubMed] [Google Scholar]
- 8.Bovenberg MS, Degeling MH & Tannous BA Enhanced Gaussia luciferase blood assay for monitoring of in vivo biological processes. Anal. Chem 84, 1189–1192 (2012). [DOI] [PMC free article] [PubMed] [Google Scholar]
- 9.Gao X et al. Anti-VEGF treatment improves neurological function and augments radiation response in NF2 schwannoma model. Proc. Natl. Acad. Sci. USA 112, 14676–14681 (2015). [DOI] [PMC free article] [PubMed] [Google Scholar]
- 10.Guyenet SJ et al. A simple composite phenotype scoring system for evaluating mouse models of cerebellar ataxia. J. Vis. Exp 2010, e1787 (2010). [DOI] [PMC free article] [PubMed] [Google Scholar]
- 11.Jain RK, Munn LL & Fukumura D Dissecting tumour pathophysiology using intravital microscopy. Nat. Rev. Cancer 2, 266–276 (2002). [DOI] [PubMed] [Google Scholar]
- 12.Vakoc BJ, Fukumura D, Jain RK & Bouma BE Cancer imaging by optical coherence tomography: preclinical progress and clinical potential. Nat. Rev. Cancer 12, 363–368 (2012). [DOI] [PMC free article] [PubMed] [Google Scholar]
- 13.Brown EB et al. In vivo measurement of gene expression, angiogenesis and physiological function in tumors using multiphoton laser scanning microscopy. Nat. Med 7, 864–868 (2001). [DOI] [PubMed] [Google Scholar]
- 14.Dilwali S, Landegger LD, Soares VY, Deschler DG & Stankovic KM Secreted factors from human vestibular schwannomas can cause cochlear damage. Sci. Rep 5, 18599 (2015). [DOI] [PMC free article] [PubMed] [Google Scholar]
- 15.Soares VY et al. Extracellular vesicles derived from human vestibular schwannomas associated with poor hearing damage cochlear cells. Neuro Oncol 18, 1498–1507 (2016). [DOI] [PMC free article] [PubMed] [Google Scholar]
- 16.Wong HK et al. Anti-vascular endothelial growth factor therapies as a novel therapeutic approach to treating neurofibromatosis-related tumors. Cancer Res 70, 3483–3493 (2010). [DOI] [PMC free article] [PubMed] [Google Scholar]
- 17.Bonne NX et al. An allograft mouse model for the study of hearing loss secondary to vestibular schwannoma growth. J. Neurooncol 129, 47–56 (2016). [DOI] [PubMed] [Google Scholar]
- 18.Dinh CT et al. A xenograft model of vestibular schwannoma and hearing loss. Otol. Neurotol 39, e362–e369 (2018). [DOI] [PMC free article] [PubMed] [Google Scholar]
- 19.McClatchey AI, Saotome I, Ramesh V, Gusella JF & Jacks T The Nf2 tumor suppressor gene product is essential for extraembryonic development immediately prior to gastrulation. Genes Dev 11, 1253–1265 (1997). [DOI] [PubMed] [Google Scholar]
- 20.Giovannini M et al. Schwann cell hyperplasia and tumors in transgenic mice expressing a naturally occurring mutant NF2 protein. Genes Dev 13, 978–986 (1999). [DOI] [PMC free article] [PubMed] [Google Scholar]
- 21.Giovannini M et al. Conditional biallelic Nf2 mutation in the mouse promotes manifestations of human neurofibromatosis type 2. Genes Dev 14, 1617–1630 (2000). [PMC free article] [PubMed] [Google Scholar]
- 22.Kalamarides M et al. Nf2 gene inactivation in arachnoidal cells is rate-limiting for meningioma development in the mouse. Genes Dev 16, 1060–1065 (2002). [DOI] [PMC free article] [PubMed] [Google Scholar]
- 23.Gehlhausen JR et al. A murine model of neurofibromatosis type 2 that accurately phenocopies human schwannoma formation. Hum. Mol. Genet 24, 1–8 (2015). [DOI] [PMC free article] [PubMed] [Google Scholar]
- 24.Messing A et al. P0 promoter directs expression of reporter and toxin genes to Schwann cells of transgenic mice. Neuron 8, 507–520 (1992). [DOI] [PubMed] [Google Scholar]
- 25.Gutmann DH & Giovannini M Mouse models of neurofibromatosis 1 and 2. Neoplasia 4, 279–290 (2002). [DOI] [PMC free article] [PubMed] [Google Scholar]
- 26.McClatchey AI et al. Mice heterozygous for a mutation at the Nf2 tumor suppressor locus develop a range of highly metastatic tumors. Genes Dev 12, 1121–1133 (1998). [DOI] [PMC free article] [PubMed] [Google Scholar]
- 27.Neff BA et al. Cochlear implantation in the neurofibromatosis type 2 patient: long-term follow-up. Laryngoscope 117, 1069–1072 (2007). [DOI] [PubMed] [Google Scholar]
- 28.Meijer EF, Baish JW, Padera TP & Fukumura D Measuring vascular permeability in vivo. Methods Mol. Biol 1458, 71–85 (2016). [DOI] [PMC free article] [PubMed] [Google Scholar]
- 29.McCann CM et al. Combined magnetic resonance and fluorescence imaging of the living mouse brain reveals glioma response to chemotherapy. Neuroimage 45, 360–369 (2009). [DOI] [PMC free article] [PubMed] [Google Scholar]
Associated Data
This section collects any data citations, data availability statements, or supplementary materials included in this article.