

Abstract
D-Dimer (DD) is the smallest fragment of plasmin-mediated cleavage of fibrin. There is a progressive increase in DD concentration with advancing gestation in normal pregnancies, making the upper limit of 0.5 μg/ml used in non-pregnant population an unfavorable marker during pregnancy. Coagulation and fibrinolysis parameters are also markedly disturbed in pregnancies complicated by various pathologies.
We designed this retrospective observational cohort study to investigate the trimester specific reference range for DD throughout normal pregnancy, and to compare the distribution of DD in third trimester healthy pregnancies and those complicated by preeclampsia (PE), severe preeclampsia (SPE), gestational diabetes mellitus (GDM), premature rupture of membranes (PROM) and preterm premature rupture of membranes (PPROM). In addition, we aimed to determine the diagnostic value of DD in PE and SPE.
In this retrospective observational cohort study, 250 normal and 178 complicated pregnancies were included. Normal pregnancies included 88-first trimester, 101-second trimester and 61-third trimester pregnancies. Complicated pregnancy included 34 PE, 44 SPE, 32 GDM, 33 PROM, and 35 PPROM cases during the third trimester. Predefined exclusion criteria were used.
The period of gestation (POG) accounted for 41.9% of the variance in DD, with strong correlation between the POG and DD. The trimester specific reference intervals were computed. The distribution for severe preeclampsia was statistically different compared to other categories in the third trimester. This exceptional distribution led to the generation of a receiver operating characteristic (ROC) curve with an area under curve of 0.828, attesting its possible role in predicting severe preeclampsia.
We determined trimester specific reference intervals of DD. The role of DD has been explored, and it may be of diagnostic value in severe preeclampsia.
Keywords: D-dimer, fibrinolysis, preeclampsia, severe preeclampsia
1. Introduction
D-Dimer (DD) is the smallest fragment of fibrin degradation products (FDPs); a small protein fragment present in blood after a blood clot is degraded by fibrinolysis.[1,2] Pregnancy is characterized by a hypercoagulable state, which has been subject to extensive investigations in the last 2 decades.[3,4] The hemostatic reference intervals are calculated from non-pregnant samples, and thus may not be relevant during pregnancy.[5] It is now well recognized that normal pregnancy leads to an increase in DD, which maybe more than the standard cut-off of 0.5 μg/ml used in the non-pregnant population.[4,6–8] It has been reported that 78% and 99% to 100% of pregnant women present with DD higher than the standard cut-off in the second and third trimester respectively.[9,10] This makes it a nonspecific test during pregnancy.[11] That said, the use of standard DD cut-offs in pregnancy leads to misinterpretation of results which prompts additional work-up and unnecessary treatment.
Pregnancy is associated with gradual increase in levels of coagulation factors and decrease in natural anticoagulants. There occurs a significant decrease in fibrinolysis during pregnancy, which is in disagreement with the gradual rise in DD showing that although depressed, fibrinolysis remains an active process.[12,13] Fibrinolysis is a regulated process which depends on the balance between plasminogen activators (tPA and uPA) and inhibitors (PAI-1/2). The overall effect of hypercoagulability and hypofibrinolysis induced by pregnancy is rise in intravascular thrombosis and FDPs which include DD.
Several studies investigated whether pregnancy related complications such as preeclampsia (PE), gestational diabetes (GDM) and pre-labor rupture of membranes (PROM) are associated with changes in the hemostatic system. The pathogenesis of preeclampsia is not fully understood, but is considered to be multifactorial, centered with endothelial dysfunction and complex interaction between inflammatory and coagulative pathway. Despite extensive research about PE, there is no screening test to date. Since activation of blood coagulation occurs in the early stage of the disease,[14] increase in DD could therefore occur before appearance of hypertension. Thus, the theory that DD could have a diagnostic role in preeclampsia and severe preeclampsia (SPE) needs to be explored. It is well documented that the risk of Venous thromboembolism (VTE) is increased in and after pregnancies complicated by GDM.[15] Thrombin has been found to play an important role in the pathophysiology of preterm births in women with intrauterine bleeding by stimulating myometrial contractions.[16–18] It has been suggested that hypercoagulation is involved in the development of Preterm PROM (PPROM).[19]
Previous studies with the aim of defining a reference interval for DD during pregnancy either used higher thresholds to increase its specificity, or used the 2.5th and 97.5th percentiles as the reference interval. The classic Virchow's triad favors thrombus formation during pregnancy with venous stasis resulting from compression by the gravid uterus, hypercoagulability and endothelial damage. However, with commonly encountered pathologies during pregnancy, a more pronounced exacerbation of this hypercoagulable profile is documented.[20,21] We designed this retrospective observational cohort study to investigate the trimester specific reference range for DD throughout normal pregnancy, and to compare the distribution of DD in third trimester healthy pregnancies and those complicated by PE, SPE, GDM, PROM, and PPROM. In addition, we aimed to determine the diagnostic value of DD in PE and SPE.
2. Materials and methods
2.1. Subjects and study design
A retrospective observational cohort study was designed and 443 women were included during the study period of August 2016 to August 2017. The study was carried out in Tongji Hospital, Tongji Medical College, Huazhong University of Science and Technology, a tertiary teaching hospital that deals mainly with high-risk pregnancies. The study was approved by the Ethics Committee of Tongji Medical College (IORG No: IORG0003571). Due to the retrospective nature of this study, the requirement for informed consent from patients was waived.
Laboratory tests, including a complete blood count, blood biochemistry and coagulation profile consisting of DD concentration and fibrinogen, are performed on the day of admission. The distribution of cases in this study is demonstrated in Figure 1. Predefined exclusion criteria was used to rule out any potential source of elevated DD: family or personal history of VTE; advanced maternal age (>45 years); morbid obesity (BMI > 40 kg/m2); family or personal history of antiphospholipid syndrome; women with previous recurrent spontaneous abortions; suspected or confirmed deep vein thrombosis (DVT); history of smoking; multiple gestation; current infection and fever; HELLP syndrome; coagulation disorders; women who received anticoagulation prophylaxis; abruptio placenta; and women with history of recent surgery including cervical cerclage. For NP (Normal pregnancy), we also excluded women with diabetes, GDM, PE, gestational thrombocytopenia, acute fatty liver of pregnancy and obstetrics cholestasis. No patients among the TTCP (Third trimester complicated pregnancy) category developed placental abruption. In addition, 15 patients were excluded from this category as they developed mixed pathologies.
Figure 1.
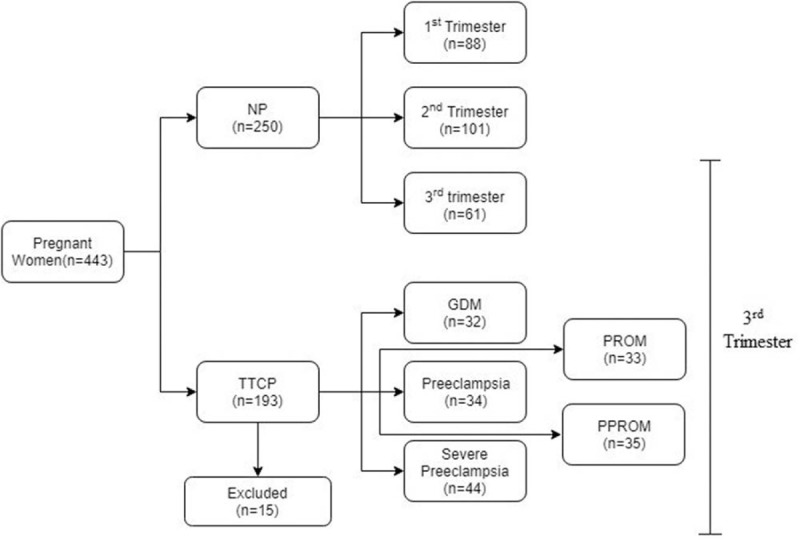
Distribution of Cases into different categories. GDM = gestational diabetes, NP = normal pregnancy, PPROM = preterm PROM, PROM = premature rupture of membranes, TTCP = third trimester complicated pregnancy.
Normal pregnancy was diagnosed on the basis of clinical and ultrasound findings whereas for complicated pregnancies, diagnosis was made on admission as per the current guidelines. Data about the patients’ age, gravidity, parity, gestational age, and clinical outcomes were collected from the database of our medical records. All the blood samples underwent plasma DD quantification after centrifugation using the same assay and according to the manufacturer's guidelines. PATHFAST D-dimer assay was used which is based on the principle of chemiluminescent enzyme immunoassay (CLEIA). Blood for DD assay was collected in citrated vacutainer tubes and was processed the same day. The specimens were not frozen as they were processed within eight hours of the venipuncture. Clotted and hemolyzed specimens were rejected and recollection was ordered on the same day. Data for other laboratory results, including fibrinogen, platelets, hemoglobin and white cell count (WCC) were also collected.
2.2. Statistical analysis
The data for each category were reviewed and tested for outliers using Dixon algorithm (D/R ratio), whereby D is the difference between the largest and second largest value and R is the range of the dataset. If D ≥ 1/3R, the largest datum is erased and the test carried out again. The trimester specific reference intervals for NPs were computed using 2 methods,
1) 95% Prediction interval of logarithmized data and;
2) Bootstrap principle.[22]
Bootstrapping is a non-parametric test, which involves random resampling of observations with replacement. After repeating the procedure 500 times, bootstrap estimates are derived as the means of the percentile estimates. Data for NPs during the 3 trimesters and TTCPs were compared using non-parametric tests. Kruskal-Wallis analysis of variance was used for comparison among different categories; and Kolmogorov Smirnov Z (K-S) test was used for comparison between 2 categories. A receiver-operating characteristic (ROC) curve was plotted for severe preeclampsia category in an attempt to predict severe preeclampsia based on DD value on admission. P value < .05 was considered statistically significant. Statistical analysis was performed using IBM SPSS 23.0 (IBM Corp., New York, NY) and RefVal 4.11 statistical treatment of reference values (IFCC).[23] A P value of less than .05 was considered significant.
3. Results
Three outliers were detected using Dixon algorithm and were excluded in the statistical analysis (In normal third trimester category-10.45 μg/ml, GDM-7.27 μg/ml and severe preeclampsia-16.06 μg/ml). Table 1 and Table 2 shows the obstetrics and demographic characteristics of the different groups studied. The maximum maternal age was 45 years. 62% of study patients were primiparous whereas 38% were multigravidae. We had few patients with at least 2 abortions (n = 16), but they had induced abortions rather than being affected by recurrent pregnancy loss.
Table 1.
Obstetrics and demographic characteristics for normal pregnancies.
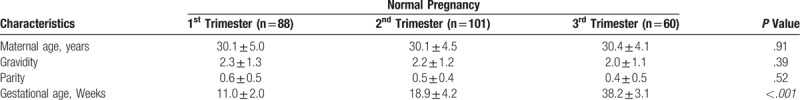
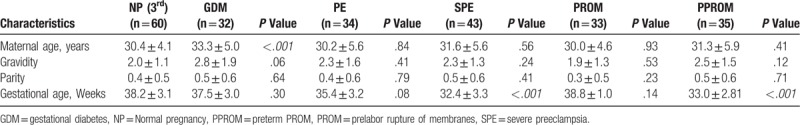
Table 2.
Obstetrics and demographic characteristics for TTCPs.
We used non-parametric statistics as the data for DD was not normally distributed. (Kolmogorov-Smirnov test of normality P < .05). Kruskal-Wallis analysis of variance was used to compare DD for the 3 trimesters. A statistical difference (H (2) = 133.8; P < .001) exist between each trimester with a geometric mean of 0.43 μg/ml for the 1st, 0.66 μg/ml for 2nd and 1.39 μg/ml for the 3rd trimester. The period of gestation (POG) accounted for 41.9% of the variance in DD and a positive correlation (r = 0.648; P < .001) is present between the DD level and POG. Linear regression model was significant (F (1,247) = 178; P < .001) and the predicted DD level is equal to (POG × 0.006)-0.062 when POG (period of gestation) is in days. Figures 2 and 3 show the trend of DD and fibrinogen concentration in NPs. Estimates of the reference intervals of DD with the 95% CI according to the 2 methods used are shown in Table 3. There is statistical difference in fibrinogen level in the 3 trimesters (H (2) = 133.7; P < .001). However, the difference is statistically significant only between the 1st and 3rd trimesters (Table 4) and no correlation exists between DD concentration and fibrinogen level at any trimester (P > .05).
Figure 2.
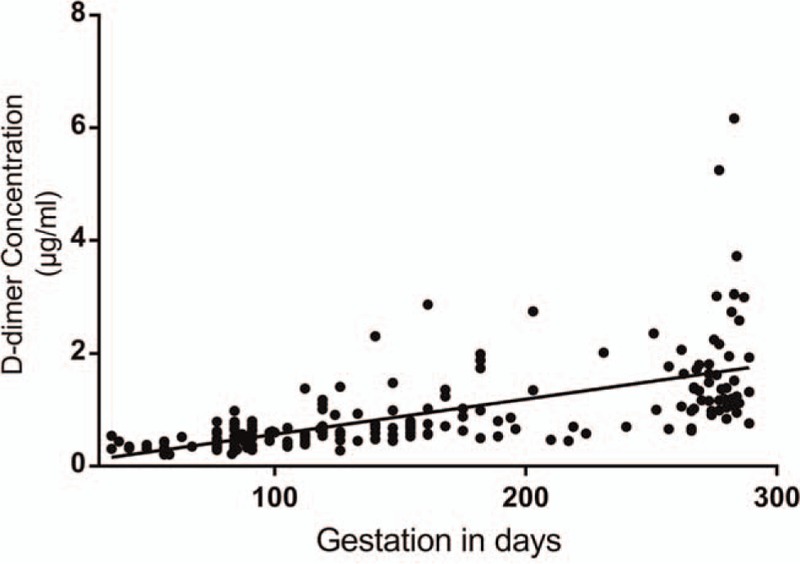
D-dimer trend with advancing gestation.
Table 3.
Reference interval of D-dimer.
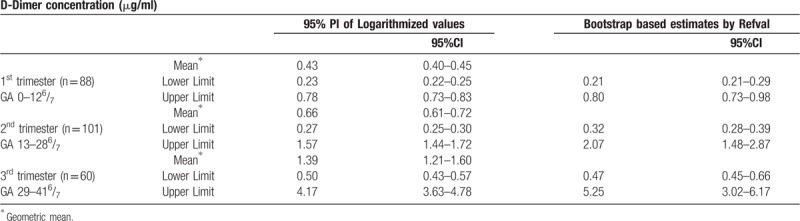
Table 4.
Lab values for normal pregnancies.
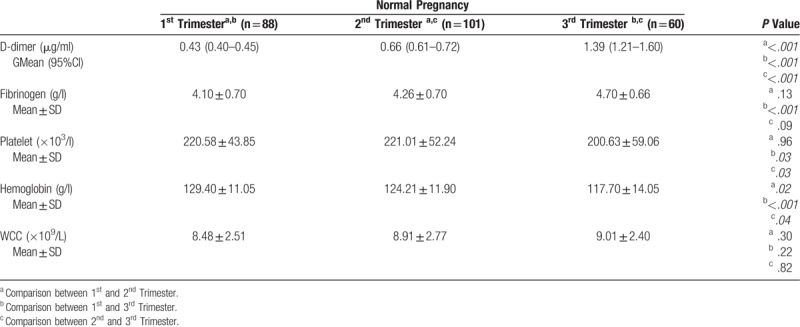
Figure 3.
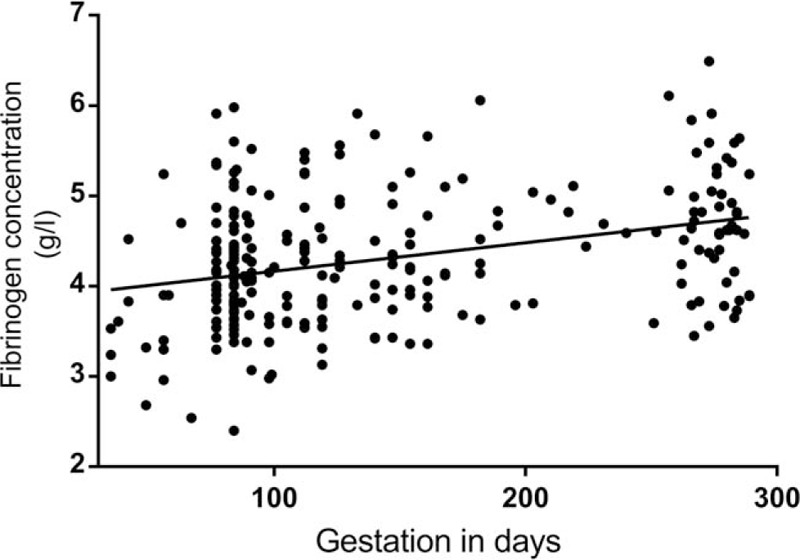
Fibrinogen trend with advancing gestation.
Table 4 and Table 5 shows the laboratory values of NPs and TTCPs. The geometric mean with 95% confidence interval of DD concentration for the study categories is presented in Figure 4. DD was statistically different in the 6 categories included in the third trimester (Kruskal-wallis analysis of variance H (5) = 30.2; P < .005), but there was no statistical difference in the fibrinogen level (P = .266). The distribution of DD was significantly different for SPE category compared to the other categories according to 2 independent samples Kolmogorov-Smirnov Z test (P < .001). In addition, PROM and PPROM had significantly different distribution (P = .01).
Table 5.
Lab values for TTCPs.
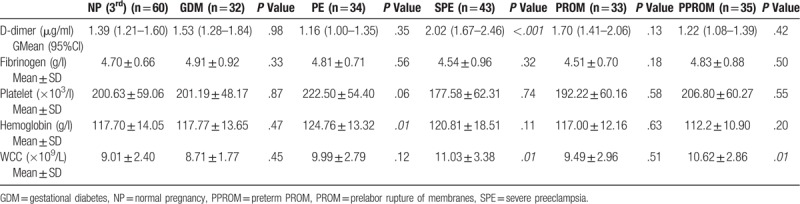
Figure 4.
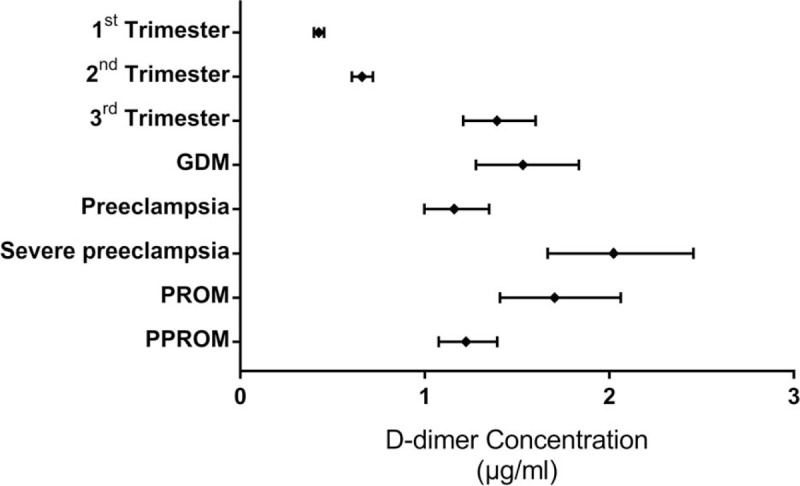
Geometric mean with 95% CI for all categories. CI = Confidence Interval.
A ROC curve for DD in third trimester SPE cases was generated (Fig. 5) and analyzed. DD cut-off that might predict SPE was 1.65 μg/ml at the time of diagnosis during the third trimester, with a sensitivity and specificity of 94% and 67% respectively (AUC = 0.828). We arrived at this cut-off using the Youden index[24] which is maximum at 0.61. However, we decided to use a higher cut-off of 1.94 μg/ml, which will increase the specificity of the test to 75% and still maintain a decent sensitivity of 80%. This decreases the false positive rate with a good true positive rate.
Figure 5.
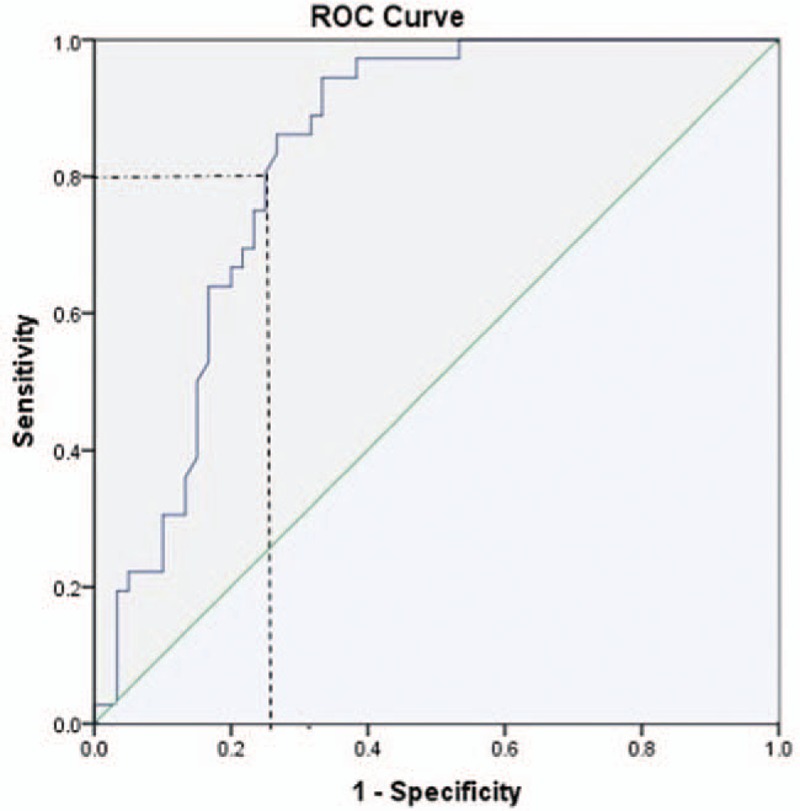
ROC curve for severe preeclampsia. ROC = Receiver Operating Characteristic.
4. Discussion
In this study, we describe for the first time trimester specific reference limit of D-dimer concentration using the bootstrap method of RefVal 4.11 program, which implements the recommendations of International Federation of Clinical Chemistry and Laboratory Medicine (IFCC) on estimation of reference intervals.[22,23] The Bootstrap method is the most substantial advance in reference interval estimation since the recommendations of IFCC (1987). We also computed the reference limit using the 95% prediction interval of logarithmized values (Table 3) since biological parameters tend to follow a log normal distribution rather than the Gaussian distribution. The effect of complicated pregnancies on DD concentration was studied and we attempted to find if DD could predict the occurrence of severe preeclampsia.
Our study, as expected confirmed the well-known fact that DD concentration increases gradually with advancing gestation.[7,8] Previous studies in this field used the non-parametric simple rank based estimates for the reference interval (2.5th–97.5th percentile), or have shown that higher cut-off value during pregnancy would increase the specificity while maintaining the sensitivity for the diagnosis of VTE.[10,25] The upper bound of the reference limit estimated was 0.80 μg/ml, 2.7 μg/ml and 5.25 μg/ml for the 1st, 2nd, and 3rd trimester respectively with bootstrap method and 0.78 μg/ml, 1.57 μg/ml, and 4.17 μg/ml using 95% PI of logarithmized values. The trimester specific reference interval could have advantage for use in clinical practice.
According to linear regression model, 41.9% of the variance in DD across the 3 trimesters could be explained by the period of gestation alone. The predicted increase was of (0.006 × POG) when POG is in days. These results agree with previous studies. The data was collected according to strict predefined inclusion and exclusion criteria to exclude any irrelevant causes of increased DD and avoid selection bias. It is also important to recall that the reference interval should be assay specific as the results are substantially different.[3,25] We utilized the PATHFAST D-dimer assay for all the subjects. During the study episode we encountered 3 confirmed cases of DVT, all of which were complicated with other pathologies known to increase DD. Therefore, additional studies are required to investigate the magnitude of rise in DD in confirmed cases of DVT.
For complicated pregnancies, diagnosis was made on admission as per the current guidelines to exclude any diagnostic biases. As the hypercoagulable state is most exacerbated during the third trimester, we included complicated pregnancies during this trimester only. The distribution of DD in the complicated pregnancy group was statistically different for SPE compared to other categories and for PROM compared to PPROM. PE is a condition, which is associated with noticeable exacerbation of the hypercoagulable state compared to normal pregnancy.[26,27] Even though the pathogenesis of PE is not fully elucidated, activation of inflammatory cytokines and coagulation pathways plays a central role. It is documented that in PE and SPE, the endothelial dysfunction leads to a rise in tPA and PAI-1,[14,28] with a net result of hypercoagulability and dampened fibrinolysis in preeclampsia. However, as a manifestation of placental insufficiency, PAI-2 which has a local role in placental functioning during pregnancy is decreased in SPE and early onset PE (<34 weeks), with a lower PAI-1:PAI-2 ratio.[12,28] Thus, in SPE, lower PAI-2 concentration up-regulates the fibrinolytic system and this corroborates the higher circulating DD concentration seen.
The mean DD in the third trimester was 1.63 ± 1.05 μg/ml, 1.27 ± 0.58 μg/ml, and 2.59 ± 1.37 μg/ml for normal, PE and SPE respectively. In SPE, DD concentration is significantly higher despite the fact that the mean gestational age was smaller compared to the other 2 categories (32.4 ± 3.3); however, the reason for lower mean DD in preeclampsia is unclear. This could probably be explained by the fact that PAI-2 concentration is lower only in SPE, that is, more fibrin clot cleavage and this depends upon the degree of placental insufficiency. In their met-analysis in 2012, Pinheiro et al[29] included 7 studies comparing DD in PE and normal pregnancies, out of which 5 studies found slightly higher DD than in the control, whereas the 2 others have shown no difference. The elevated DD concentration in SPE is the result of exaggerated hypercoagulable state and ongoing fibrinolysis despite elevated PAI-1 concentration.
With the exceptional distribution of DD in SPE subjects, we decided to generate a ROC curve to evaluate if DD might predict SPE for that matter. Area under the curve (AUC) was 0.828, thus revealing good relationship between DD and SPE. We used the Youden index, which is maximum at 0.61, with a sensitivity and specificity of 94% and 67% respectively. The cut-off value of DD that might predict SPE was 1.65 μg/ml at the time of diagnosis during the third trimester. We decided to use a higher cut-off value of 1.94 μg/ml to increase the specificity to 75%. This higher cut-off will decrease the false positive rate but the sensitivity decreases to 80%. Pinheiro et al in their study in 2014[27] had an AUC of 0.938 for DD and 0.873 for PAI-1 in SPE, suggesting both the role of DD and PAI-1 in predicting SPE.
Conflictingly, the DD concentration shows no statistical difference between third trimester normal and GDM category (1.74 ± 0.97). A prior study by Bellart et al[30] have demonstrated that DD is higher in GDM throughout the 3 trimesters with statistical difference only in the third trimester. They also found that GDM is associated with higher TAT complex, and lower protein C and S compared to normal pregnancy. Gorar et al[20] in 2016 reported higher PAI-1 and lower tPA in GDM compared to control groups, but the results were not significant statistically. Overall, the results of prior studies are quite ambiguous to interpret. Our finding is in accordance to a study done by Pöyhönen-Alho et al in 2012.[31]
It has been suggested that hypercoagulation is involved in the etiology of preterm labor and PPROM.[18] Thrombin a serine protease is formed by the cleavage of prothrombin (coagulation factor II) during the clotting process, and in turn, thrombin converts soluble fibrinogen into insoluble fibrin. Based on studies that have demonstrated that thrombin stimulates uterine smooth muscle contractions both in pregnant and non-pregnant animal uterus,[16] it has been suggested that thrombin plays a role in the pathophysiology of preterm birth in patients with intrauterine bleeding.[17,19] This was supported by the fact that pregnant women with preterm births and PPROM had significantly higher concentration of thrombin-antithrombin (TAT) complex which is an indicator of coagulation activation compared to term pregnancy.[17] A. Keren-Politansky et al[18] in 2014 found that PT and aPTT were significantly reduced in pregnant women with premature uterine contractions who delivered preterm compared to those delivering at term, furthermore women with PPROM had lower PT than those delivering preterm. They also found that patients with preterm labor (including PPROM) had no statistical difference in the mean DD concentration compared to term labor. In our study, subjects with PROM (1.93 ± 0.90) had similar distribution of DD as normal pregnancy; however, PPROM (1.31 ± 0.46) had statistically lower DD distribution compared to PROM. This is possibly due to the lower gestational age of PPROM patients at presentation (33.0 ± 2.81 for PPROM vs 38.8 ± 1.0, P < .005 for PROM).
There are certain limitations to this study. Despite showing that a cut-off value for DD of 1.94 μg/ml might predict severe preeclampsia before its occurrence, the diagnostic accuracy is uncertain due to small sample size. Furthermore, as the aim of this paper was generation of a screening test for severe preeclampsia, the design did not include DD concentration prior to the disease onset but only at its first recognition. Therefore, validation of these findings is required in larger cohort.
5. Conclusions
For the interpretation of an observed value, definition of an appropriate reference interval is mandatory. The trimester specific reference interval that we derived greatly increases the specificity of the test, however it needs further verification. The role of DD in pregnancy is not limited to exclude VTE as it may have additional roles for diagnosing pregnancy complications in which the hemostatic system contributes to pathophysiology. From our data we could find the obvious relationship between DD concentration and severe preeclampsia, but additional comprehensive studies are needed to shed light upon its diagnostic role.
Acknowledgment
We thank all participants recruited for this study. We would also like to thank Yang Chengwu, Research Associate Professor, Department of Epidemiology and Health Promotion, College of Dentistry, New York University for his statistical expertise which was invaluable during the analysis and interpretation of the data.
Author contributions
Conceptualization: Uttam Baboolall, Haiyi Liu, Xun Gong, Dongrui Deng, Fuyuan Qiao.
Data curation: Uttam Baboolall, Ying Zha, Haiyi Liu.
Project administration: Uttam Baboolall, Haiyi Liu, Ying Zha, Xun Gong, Dongrui Deng, Fuyuan Qiao.
Formal analysis: Uttam Baboolall, Ying Zha, Haiyi Liu, Xun Gong, Dongrui Deng, Fuyuan Qiao.
Software: Uttam Baboolall
Validation: Uttam Baboolall, Haiyi Liu.
Investigation: Uttam Baboolall, Haiyi Liu.
Writing – original draft: Uttam Baboolall, Haiyi Liu.
Writing – review & editing: Uttam Baboolall, Haiyi Liu, Ying Zha.
Footnotes
Abbreviations: aPTT = activated partial thromboplastin time, DD = D-dimer, FDP = fibrin degradation product, GDM = gestational diabetes, NP = normal pregnancy, PAI = plasminogen activator inhibitor, PPROM = preterm prelabor rupture of membranes, PROM = prelabor rupture of membranes, PT = prothrombin time, TAT = thrombin-antithrombin, tPA = tissue plasminogen activator inhibitor, TTCP = third trimester complicated pregnancy.
UB is the first author.
This retrospective study was approved by the Ethics Committee of Tongji Hospital of Tongji Medical College, Huazhong University of Science and Technology, PR China (IORG No: IORG0003571).
The authors report no conflicts of interest.
References
- [1].Riley RS, Gilbert AR, Dalton JB, et al. Widely used types and clinical applications of D-dimer assay. Lab Med 2016;47:90–102. [DOI] [PubMed] [Google Scholar]
- [2].Haase C, Joergensen M, Ellervik C, et al. Age- and sex-dependent reference intervals for D-dimer: Evidence for a marked increase by age. Thromb Res 2013;132:676–80. [DOI] [PubMed] [Google Scholar]
- [3].Khalafallah AA, Morse M, Al-Barzan AM, et al. D-Dimer levels at different stages of pregnancy in Australian women: A single centre study using two different immunoturbidimetric assays. Thromb Res 2012;130:e171–7. [DOI] [PubMed] [Google Scholar]
- [4].Kawaguchi S, Yamada T, Takeda M, et al. Changes in d-dimer levels in pregnant women according to gestational week. Pregnancy Hypertens 2013;3:172–7. [DOI] [PubMed] [Google Scholar]
- [5].Szecsi PB, Jørgensen M, Klajnbard A, et al. Haemostatic reference intervals in pregnancy. Thromb Haemost 2010;103:718–27. [DOI] [PubMed] [Google Scholar]
- [6].Réger B, Péterfalvi Á, Litter I, et al. Challenges in the evaluation of D-dimer and fibrinogen levels in pregnant women. Thromb Res 2013;131:e183–7. [DOI] [PubMed] [Google Scholar]
- [7].Hedengran KK, Andersen MR, Stender S, et al. Large D-dimer fluctuation in normal pregnancy: a longitudinal cohort study of 4,117 samples from 714 healthy Danish women. Obstet Gynecol Int 2016;2016. [DOI] [PMC free article] [PubMed] [Google Scholar]
- [8].Murphy N, Broadhurst DI, Khashan AS, et al. Gestation-specific D-dimer reference ranges: A cross-sectional study. BJOG An Int J Obstet Gynaecol 2015;122:395–400. [DOI] [PubMed] [Google Scholar]
- [9].Kline JA, Williams GW, Hernandez-Nino J. D-Dimer concentrations in normal pregnancy: new dignostic threshold are need. Clin Chem 2005;51:825–9. [DOI] [PubMed] [Google Scholar]
- [10].Kovac M, Mikovic Z, Rakicevic L, et al. The use of D-dimer with new cutoff can be useful in diagnosis of venous thromboembolism in pregnancy. Eur J Obstet Gynecol Reprod Biol 2010;148:27–30. [DOI] [PubMed] [Google Scholar]
- [11].Thomson A, Greer I. Thromboembolic disease in pregnancy and the puerperium: Acute Management Green-top Guideline No. 37b [Internet]. Vol. 4, RCOG Press. 2015. Available from: https://www.rcog.org.uk/globalassets/documents/guidelines/gtg-37b.pdf%0Ahttp://www.ncbi.nlm.nih.gov/pubmed/5188708. Accessed February 15, 2018. [Google Scholar]
- [12].Pinheiro MB, Gomes KB, Dusse LMS. Fibrinolytic system in preeclampsia. Clin Chim Acta 2013;416:67–71. [DOI] [PubMed] [Google Scholar]
- [13].Moiz B. A review of hemostasis in normal pregnancy and puerperium. Natl J Heal Sci 2017;2:123–7. [Google Scholar]
- [14].Dusse LM, Rios DRA, Pinheiro MB, et al. Pre-eclampsia: Relationship between coagulation, fibrinolysis and inflammation. Clin Chim Acta 2011;412:17–21. [DOI] [PubMed] [Google Scholar]
- [15].Jacobsen AF, Skjeldestad FE, Sandset PM. Incidence and risk patterns of venous thromboembolism in pregnancy and puerperium-a register-based case-control study. Am J Obstet Gynecol 2008;198:1–7. [DOI] [PubMed] [Google Scholar]
- [16].Phillippe M, Elovitz M, Saunders T. Thrombin-stimulated uterine contractions in the pregnant and nonpregnant rat. J Soc Gynecol Investig 2001;8:260–5. [DOI] [PubMed] [Google Scholar]
- [17].Chaiworapongsa T, Espinoza J, Yoshimatsu J, et al. Activation of coagulation system in preterm labor and preterm premature rupture of membranes. J Matern Neonatal Med 2002;11:368–73. [DOI] [PubMed] [Google Scholar]
- [18].Keren-Politansky A, Breizman T, Brenner B, et al. The coagulation profile of preterm delivery. Thromb Res 2014;133:585–9. [DOI] [PubMed] [Google Scholar]
- [19].Erez O, Espinoza J, Chaiworapongsa T, et al. A link between a hemostatic disorder and preterm PROM: a role for tissue factor and tissue factor pathway inhibitor. J fetal neonatal Med 2010;21:732–44. [DOI] [PMC free article] [PubMed] [Google Scholar]
- [20].Gorar S, Alioglu B, Ademoglu E, et al. Is there a tendency for thrombosis in gestational diabetes mellitus? J Lab Physicians 2016;8:101–5. [DOI] [PMC free article] [PubMed] [Google Scholar]
- [21].Jacobsen AF, Skjeldestad FE, Sandset PM. Ante- and postnatal risk factors of venous thrombosis: a hospital-based case-control study. J Thromb Haemost 2008;6:905–12. [DOI] [PubMed] [Google Scholar]
- [22].Linnet K. Nonparametric estimation of reference intervals by simple and bootstrap-based procedures. Clin Chem 2000;46(6 Pt 1):867–9. [PubMed] [Google Scholar]
- [23].Solberg HE. The IFCC recommendation on estimation of reference intervals. The RefVal program. Clin Chem Lab Med 2004;42:710–4. [DOI] [PubMed] [Google Scholar]
- [24].Farrokh Habibzadeh, Parham Habibzadeh MY. On determining the most appropriate test cut-off value: the case of tests with continuous results. Biochem Medica 2016;26:297–307. [DOI] [PMC free article] [PubMed] [Google Scholar]
- [25].Chan WS, Lee A, Spencer FA, et al. D-dimer testing in pregnant patients: Towards determining the next “level” in the diagnosis of deep vein thrombosis. J Thromb Haemost 2010;8:1004–11. [DOI] [PubMed] [Google Scholar]
- [26].Sarah A. Hale, Burton Sobel, Anna Benvenuto, et al. Coagulation and Fibrinolytic system ptotein profiles in women with normal pregnancies and pregnancies complicated by hypertension. Pregnancy Hypertens 2012;152–7. [DOI] [PMC free article] [PubMed] [Google Scholar]
- [27].Pinheiro MB, Carvalho MG, Martins-Filho OA, et al. Severe preeclampsia: Are hemostatic and inflammatory parameters associated? Clin Chim Acta 2014;427:65–70. [DOI] [PubMed] [Google Scholar]
- [28].Khadijah Ismail S, Higgins JR. Hemostasis in pre-eclampsia. Semin Thromb Hemost 2011;37:111–7. [DOI] [PubMed] [Google Scholar]
- [29].de Barros Pinheiro M, Junqueira DR, Coelho FF, et al. D-dimer in preeclampsia: systematic review and meta-analysis. Clinica Chimica Acta 2012;414:166–70. [DOI] [PubMed] [Google Scholar]
- [30].Bellart J, Gilabert R, Fontcuberta J, et al. Coagulation and fibrinolysis parameters in normal pregnancy and in gestational diabetes. Am J Perinatol 1998;15:479–86. [DOI] [PubMed] [Google Scholar]
- [31].Pöyhönen-Alho M, Joutsi-Korhonen L, Lassila R, et al. Alterations of sympathetic nervous system, coagulation and platelet function in gestational diabetes. Blood Coagul Fibrinolysis 2012;23:508–13. [DOI] [PubMed] [Google Scholar]