Abstract
Background:
Melanoma-associated antigen-A (MAGE-A) was recognized as high-expressed in many solid tumors including esophageal carcinoma (EC), nevertheless, was reported to be low/not-expressed in normal tissues. Thus, it was considered as an extraordinary appropriate target for treatment especially in immunotherapy. Therefore, it demanded more detail knowledge on the precise function of MAGE-A.
Methods:
In this study, we used the data from the Cancer Genome Atlas dataset (TCGA-ESCA) to analyze the expression and survival for MAGE A3/4/11 (the subtype of MAGE-A) using the online tool of UALCAN. Furthermore, the high-throughput sequencing data of the patients with esophageal squamous-cell carcinoma (ESCC) from TCGA dataset were performed to analyze the correlation test, gene ontology (GO), and Kyoto Encyclopedia of Genes and Genomes (KEGG) pathway enrichment of MAGE A3/4/9/11 using LinkeDomics (online tool) and ClueGO (inner software of Cytoscape). Finally, relative gene expressions of MAGE A3/4/9/11 were verified by quantitative real-time PCR (q-PCR) in the patients with EC.
Results:
MAGE A3/4/11 was high-expressed in tissues of patients with ESCC, and there was no difference in survival time for patients between the high-expressed with the low/medium-expressed. The Go enrichment analysis showed that the 4 MAGE-A subtypes (MAGE-A3/4/9/11) were enriched in the regulation of the adaptive immune response, translational initiation, interleukin-4 production, response to type I interferon, and skin development, respectively. The KEGG results showed that they were enriched in T cell receptor signaling pathway (MAGE-A3), Th1 and Th2 differentiation, antigen processing and presentation (MAGE-A4), cytokine-cytokine receptor interaction (MAGE-A9), and chemokine signaling pathway (MAGE-A11).
Conclusion:
MAGE A3/4/9/11 was high-expressed in EC, and were enrolled in the regulation of immune response. They may consider as candidate immune target for EC treatment and provided the messages for further research in the function of MAGE-A.
Keywords: biological information, function, MAGE-A, regulation
1. Introduction
The incidence rate of esophageal cancer (EC) is increasing and is the fourth highest in China. About 90% of histology was squamous-cell carcinoma (SCC).[1] As most patients were diagnosed with advanced stage or even with distant metastasis, the 5-year survival rate has remained very low under traditional therapy (including surgery, chemotherapy, radiotherapy). Thus, it demands to search a new therapy for the patients.
Immunotherapy such as chimeric antigen receptor (CAR) T cell therapy (CAR-T) shows great special effect on tumor and has been proved to use in recurrent or refractory acute B cell type lymphoid leukemia (B-ALL) and refractory/recurrent invasive non-Hodgkin lymphoma (NHL) by American Food and Drug Administration (FDA). Nevertheless, the high immune efficiency depends on tumor-specific antigen.[2–4] The complete response rate (CR) was up to 82% of patients with B-ALL that depends on the specific antigen of CD19.[4] Thus, to find a new specific antigen was pivotal to develop the novel immunotherapy for EC.
MAGE antigen is a kind of protein with a peculiar expression profile and is regarded as cancer/testis antigens (CTAs), which is high-expressed in cancer cells and male germinal cells while low/not expressed in normal cells. As these cells lack the immunological target of HLA-molecules, thus, MAGE antigen is considered academically as the proper target for immunotherapy. MAGE A is the subtype of MAGE family members. Recent studies reveal that MAGE A was high-expressed in many tumors and had great immunological effect in certain cancers. However, there is no detail regarding the regulatory role of these genes in EC.
In this study, the data of EC from the Cancer Genome Atlas (TCGA) dataset (TCGA-ESCA) were downloaded and the online tool of UALCAN (http://ualcan.path.uab.edu/index.html) and LinkeDomics (http://www.linkedomics.org) was used to analyze the correlation, survival, Gene ontology, and pathway enrichment, and verified the relative gene expression of MAGE-A3/4/9/11 in the patients with EC. The aim of the study was to obtain further information regarding the function of MAGE-A3/4/9/11 and provide candidate target genes for ESCC immunotherapy.
2. Methods
2.1. The expression of MAGE A3/4/11 in EC
Data of TCGA-ESCA were used for MAGE A3/4/11 expression and survival analysis. There are 185 patients enrolled in this data profile, including 11 of normal, 89 of adenocarcinoma, and 95 of SCC in patients with EC. The analysis was performed on the online tool of UALCAN[5] based on tumor histology.
2.2. Correlation, gene ontology, and pathway enrichment analysis
High-throughput sequencing data (HiSeq RNA 01/28/2016) of TCGA-ESCA were used for MAGE A3/4/9/11 correlation analyses and were performed using the online tool LinkeDomics.[6] The patients enrolled in these data included 158 males and 27 females, and there were 96 patients with SCC and 89 patients with adenocarcinoma. Tissues from patients were sent for HiSeq RNA detection. The data of the patients with SCC were chosen for analysis. Top 50 correlated genes (positively and negatively regulated) were screened on the basis of the Pearson correlation coefficient (PCC) to make the heat map. The gene enrichment analysis, including biological processes (BPs), cell component (CC), and molecular function (MF), was processed by Gene Set Enrichment Analysis (GSEA) of the online tool LinkeDomics. Furthermore, Kyoto Encyclopedia of Genes and Genomes (KEGG) pathway enrichment analysis was predicted by ClueGO in Cytoscape3.6.1.[7,8]
2.3. PCR samples collecting
All samples used for quantitative real-time PCR (q-PCR) were collected from the Panyu Central Hospital and the Third Affiliated Hospital of Southern Medical University from February 8, 2014, to October 16, 2017. The patients enrolled in this study should be diagnosed with clinical pathology of EC. Twenty-four patients were male, and 1 patient was female. This study was approved by the Ethics Committee of Panyu Central Hospital. All patients agreed to participate in this study. The tissues were stored at -80°C after they were collected. These samples, including 25 tumors and 25 normal adjacent tissues as controls, were used for detecting the gene expression of MAGE-A3/4/9/11 by q-PCR.
2.4. q-PCR assay
Total RNA was extracted from all samples according to the instruction of the process.
In brief, first-strand cDNA was synthesized with 1 μg total RNA per sample (Genecopoeia, Inc, Rockville, MD) and then amplified (Genecopoeia, Inc, Rockville, MD) in a final volume of 20 μL under the ABI Vii7 dx detector (ABI, Vernon, CA). The amplifications were performed as follows: predestination for 2 minutes at 50°C, denaturation for 30 seconds at 95°C, followed by 40 cycles of 95°C for 5 seconds, and 65°C for 34 seconds. The experiments were carried out in triplicate and β-actin was used as endogenous reference control. The relative gene expression level was calculated according to the 2-ΔΔCt method.[9] The primer pairs for MAGE A3/4/9/11 and β-actin are summarized in Table 1.
Table 1.
The primer sequence for MAGE-A3/4/9/11 and β-actin.

2.5. Statistical analysis
P < .05 was considered as a statistically significant difference. The false discovery rate (FDR) method was used to adjust the P value for multiple hypothesis testing. FDR <0.05 was established as the threshold.[10,11] The Pearson correlation test was performed to analyze the correlation between MAGE A3/4/9/11 and the other genes. Independent t tests were used to analyze the PCR results using SPSS software (version 16.0; SPSS, Inc., Chicago, IL).
3. Results
3.1. The expression of MAGE A3/4/11 in EC
The results showed that MAGE A3/4/11 was high-expressed in tissues of patients with SCC (n = 95) compared with normal (n = 11), and was also significantly increased in the patients with adenocarcinoma (n = 89) compared with the normal, although there was no significant difference between the patients with squamous and adenocarcinoma (Fig. 1). The survival time of patients between the high-expressed and the low/medium-expressed was not different (Fig. 1).
Figure 1.
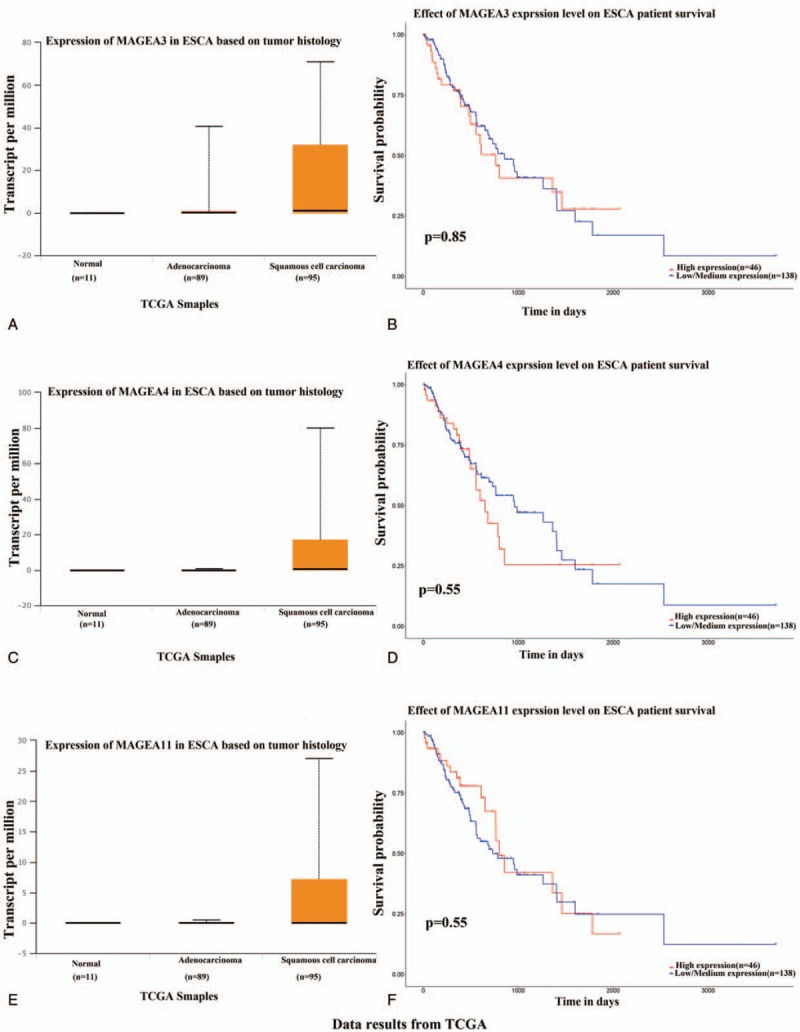
The tissue expression and survival of MAGE-A3/4/11 in patients with esophageal carcinoma using the online tool of UALCAN. MAGE A3/4/11 was high-expressed in tissues of patients with squamous cell carcinoma (n = 95) compared with normal (n = 11), and significantly increased in the patients with adenocarcinoma (n = 89) compared with the normal, although there was no significant difference between the patients with squamous and adenocarcinoma (A, C, E). The survival time of patients between the high-expressed and the low/medium-expressed was also not different (B, D, F).
3.2. Correlation analysis
In the Pearson correlation test, there were 20,104 genes that showed correlation of MAGE-A3/4/9/11, and there were 32, 40, 24, and 79 genes that showed significant correlation with MAGEA 3/4/9/11, respectively. The 50 top correlated genes (including 50 positively regulated and 50 negatively regulated) were screened and made the heat map (Figs. 2–5).
Figure 2.
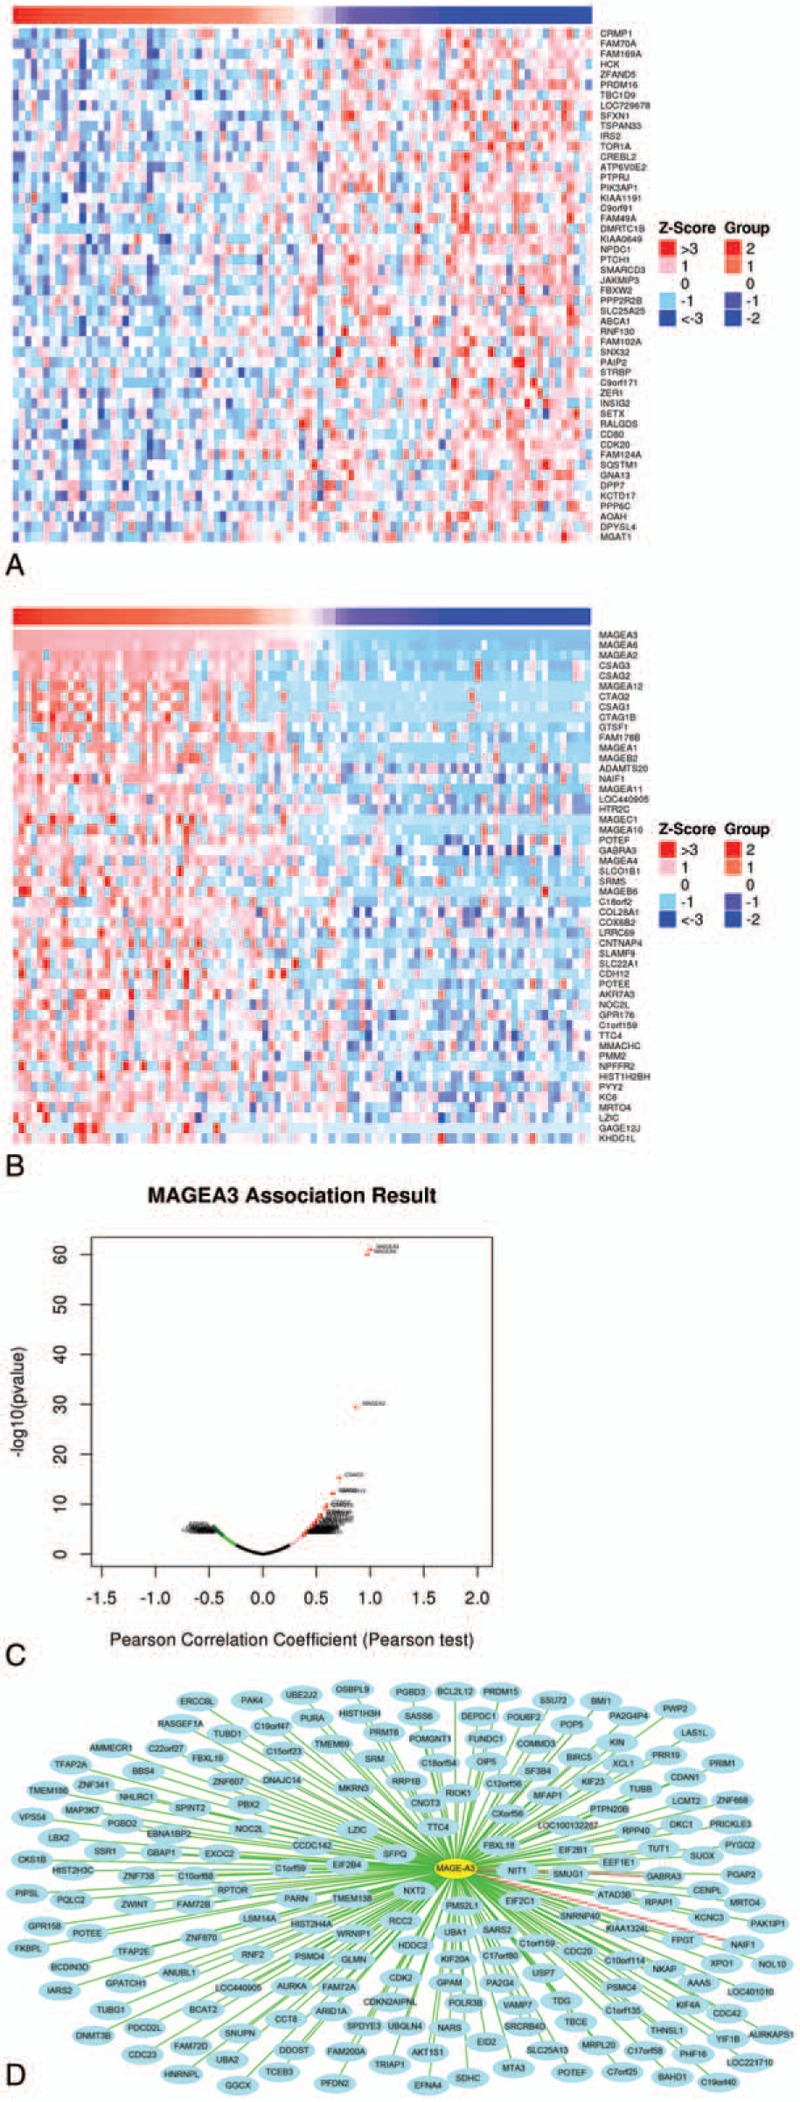
Correlation analysis of MAGE-A3 in patients with esophageal squamous cell carcinoma (ESCC). (A) Fifty top negatively related genes; (B) 50 top positively related genes; (C) Pearson correlation test of MAGE-A3 and its related genes. (D) The positive genes correlated with MAGE-A3 as 0.3 <PCC. The line color of blue to red represents the PCC value from low to high.
Figure 5.
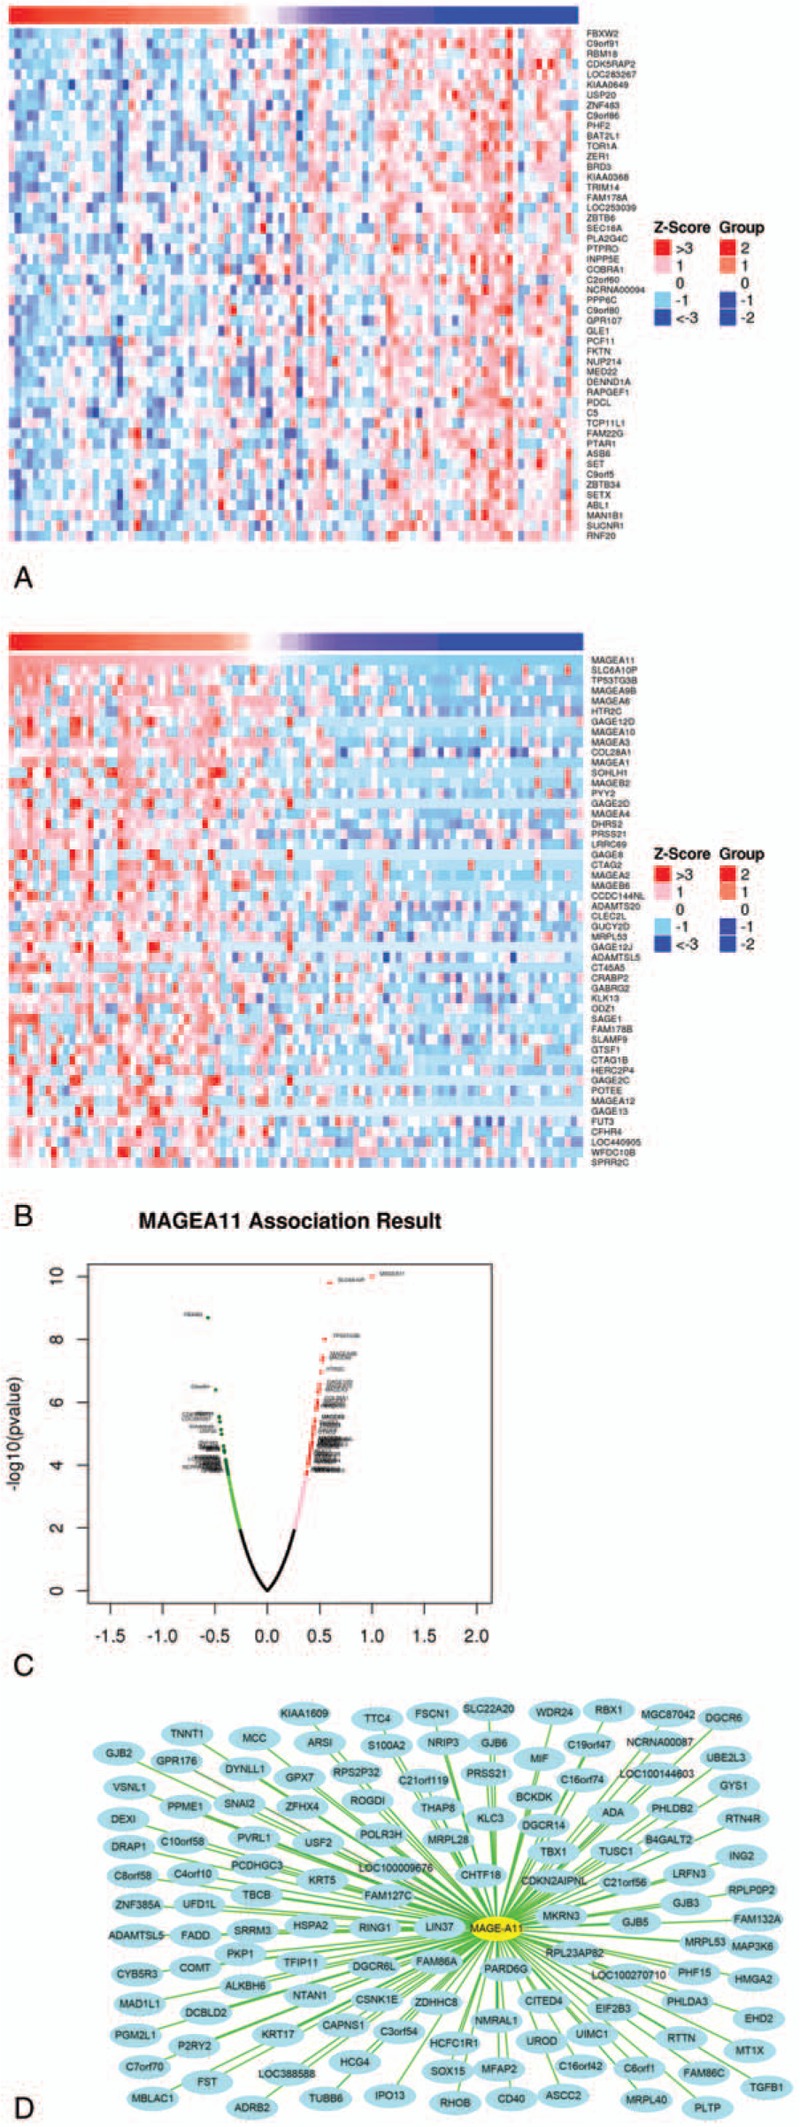
Correlation analysis of MAGE-A11 in patients with esophageal squamous cell carcinoma (ESCC). (A) Fifty top negatively related genes; (B) 50 top positively related genes; (C) Pearson correlation test of MAGE-A11 and its related genes. (D) The positively related genes correlated with MAGE-A11 as 0.3 <PCC. The line color of blue to red represents the PCC value from low to high.
Figure 3.
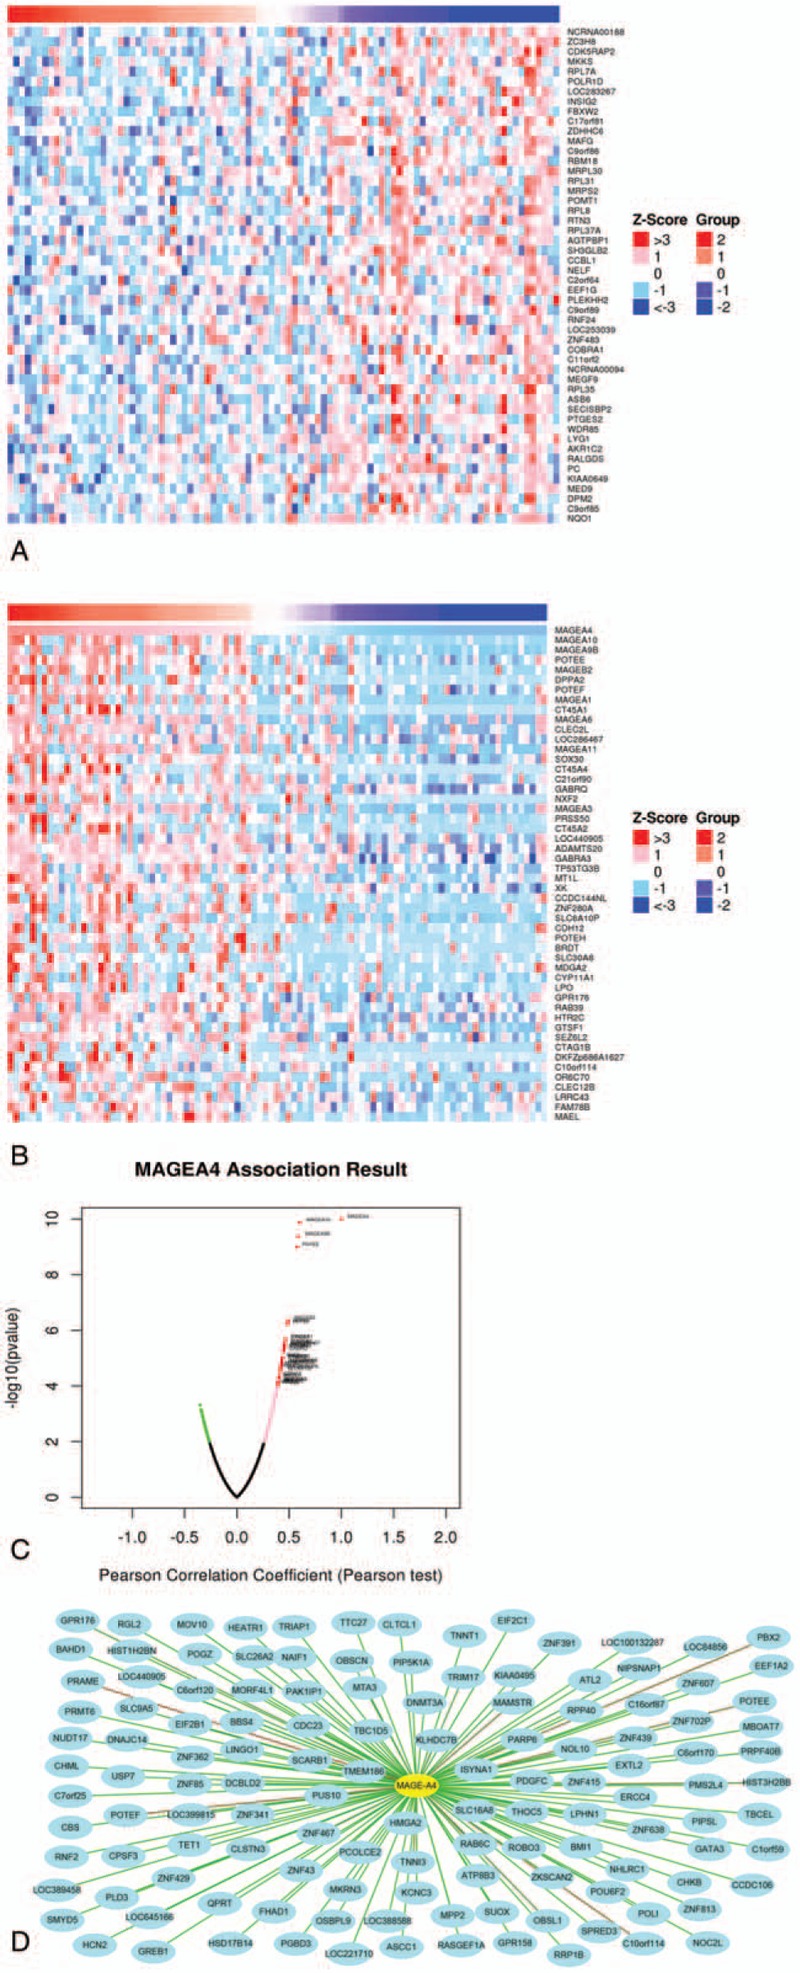
Correlation analysis of MAGE-A4 in patients with esophageal squamous cell carcinoma (ESCC). (A) Fifty top negatively related genes; (B) 50 top positively related genes; (C) Pearson correlation test of MAGE-A4 and its related genes. (D) The positively related genes correlated with MAGE-A4 as 0.35 <PCC. The line color of blue to red represents the PCC value from low to high.
Figure 4.
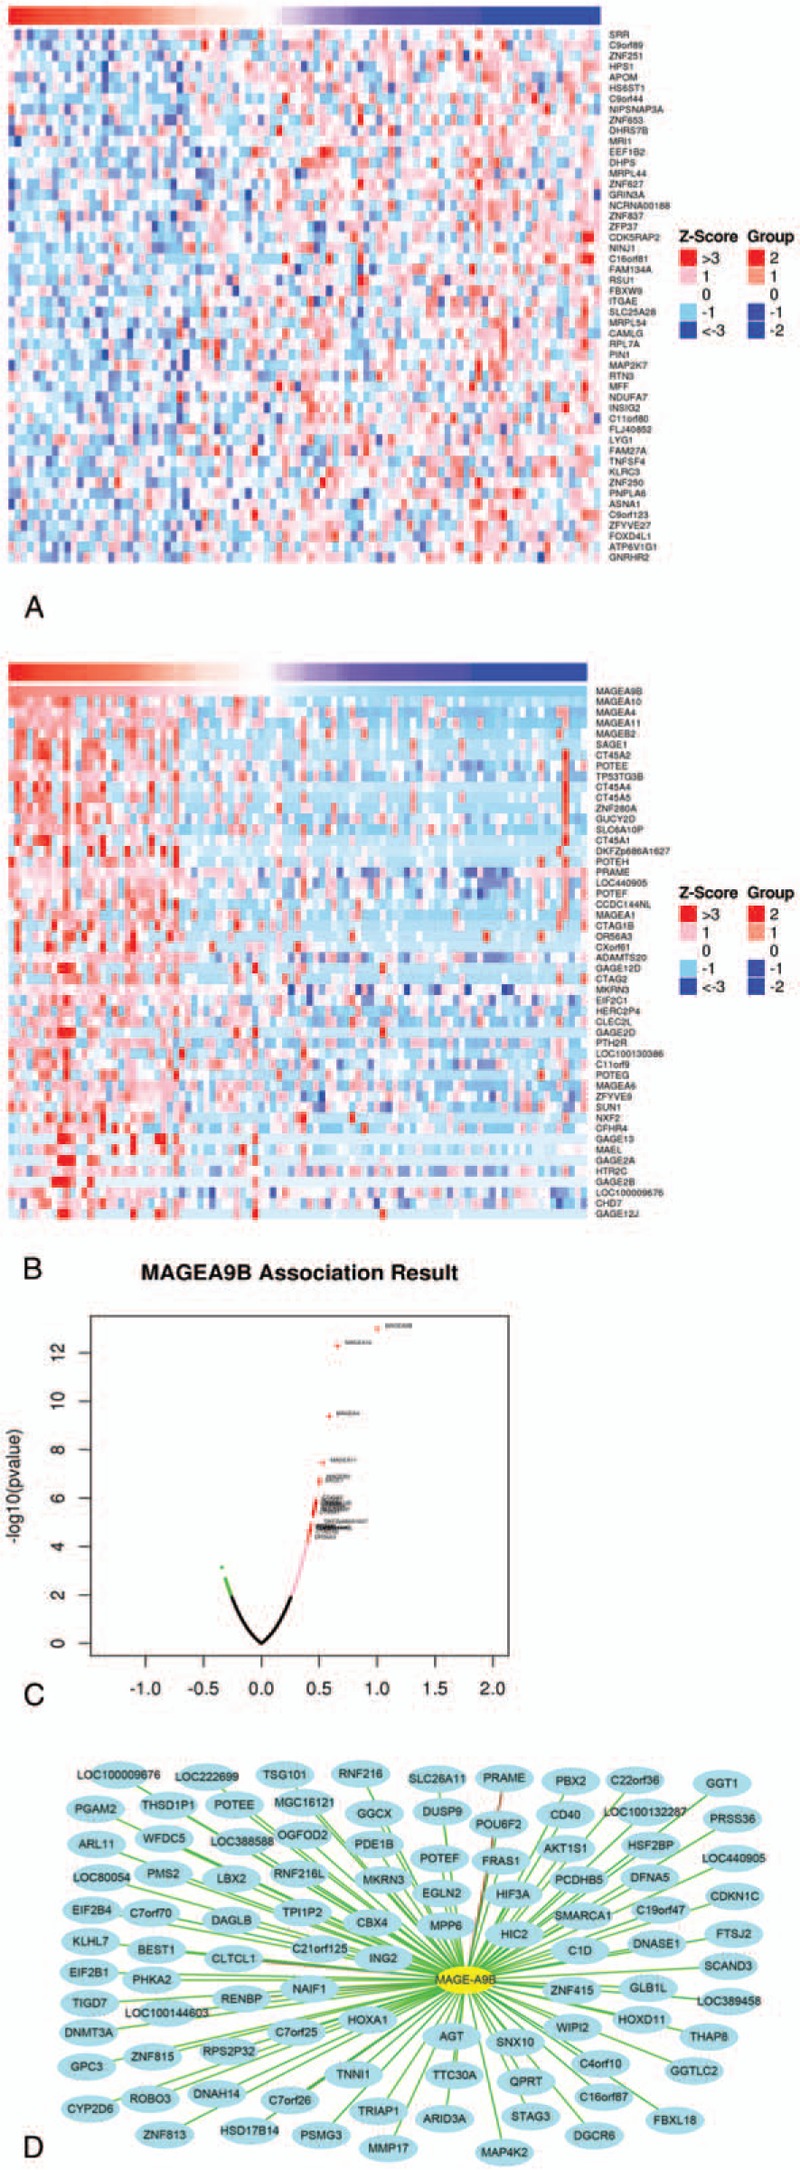
Correlation analysis of MAGE-A9 in patients with esophageal squamous cell carcinoma (ESCC). (A) Fifty top negatively related genes; (B) the 50 top positively related genes; (C) Pearson correlation test of MAGE-A9 and its related genes. (D) The positively related genes correlated with MAGE-A9B as 0.3 <PCC. The line color of blue to red represents the PCC value from low to high.
3.3. Gene ontology and pathway enrichment analysis
The Go enrichment analysis showed that MAGE-A3 was enriched mostly in the adaptive immune response regulation (Table 2). MAGE-A4 was enriched in regulation of translational initiation, translational elongation, rRNA metabolic process, ribonucleoprotein complex biogenesis, mitochondrial translation, ncRNA processing, DNA damage response, detection of DNA damage, multiorganism metabolic process, and protein localization to endoplasmic reticulum (Table 3). MAGE-A9 was shown to be enriched in translational initiation, NADH dehydrogenase complex assembly, mitochondrial translation, interleukin-4 production, multiorganism metabolic process, protein localization to endoplasmic reticulum, and mitochondrial respiratory chain complex I biogenesis (Table 4). MAGE-A11 regulated the epidermis development, detection of chemical stimulus, peptide cross-linking, response to type I interferon, and skin development (Table 5). In KEGG analysis, the genes were enriched in T cell receptor signaling pathway (MAGE-A3), Th1 and Th2 differentiation, antigen processing and presentation (MAGE-A4), cytokine-cytokine receptor interaction (MAGE-A9), and chemokine signaling pathway (MAGE-A11) (P < .05) (Figs. 6–9).
Table 2.
The enrichment analysis of MAGE-A3 in esophageal squamous carcinoma.
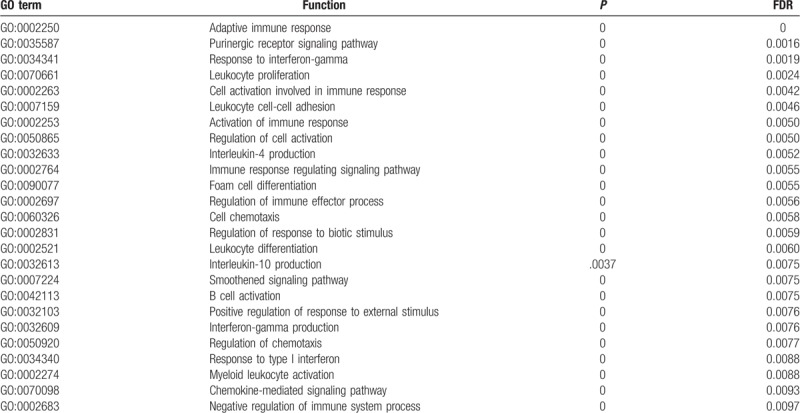
Table 3.
The enrichment analysis of MAGE-A4 in esophageal squamous carcinoma.
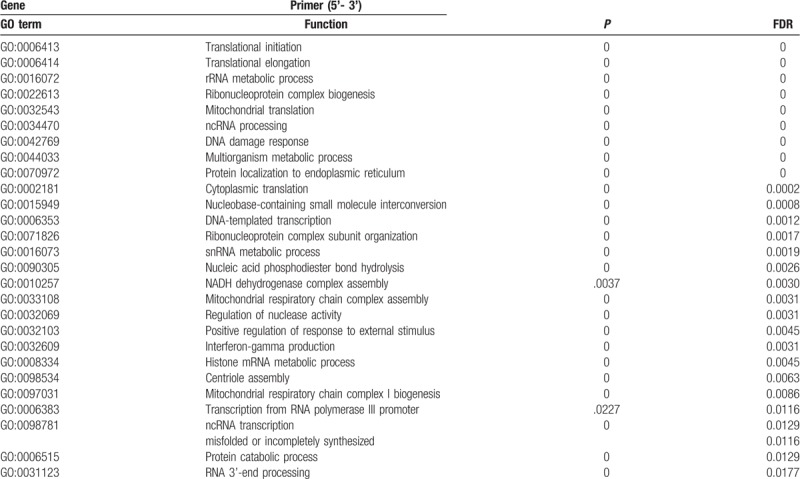
Table 4.
The enrichment analysis of MAGE-A9 in esophageal squamous carcinoma.

Table 5.
The enrichment analysis of MAGE-A11 in esophageal squamous carcinoma.

Figure 6.
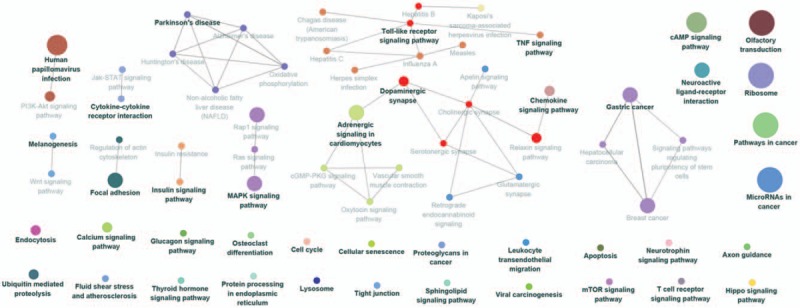
Kyoto Encyclopedia of Genes and Genomes (KEGG) pathway enrichment analysis of MAGE A3 in patients with esophageal squamous cell carcinoma (ESCC). The result showed that A3 was enriched in T cell receptor signaling pathway. The more large volume of the cycle represents the lower P value.
Figure 9.
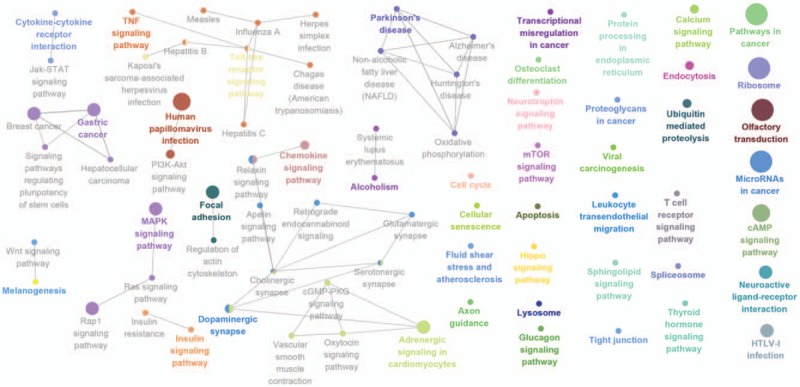
Kyoto Encyclopedia of Genes and Genomes (KEGG) pathway enrichment analysis of MAGE A11 in patients with esophageal squamous cell carcinoma (ESCC). The result showed that A11 was enriched in chemokine signaling pathway. The more large volume of the cycle represents the lower P value.
Figure 7.

Kyoto Encyclopedia of Genes and Genomes (KEGG) pathway enrichment analysis of MAGE A4 in patients with esophageal squamous cell carcinoma (ESCC). The result showed that A4 was enriched in Th1 and Th2 differentiation, antigen processing, and presentation. The more large volume of the cycle represents the lower P value.
Figure 8.
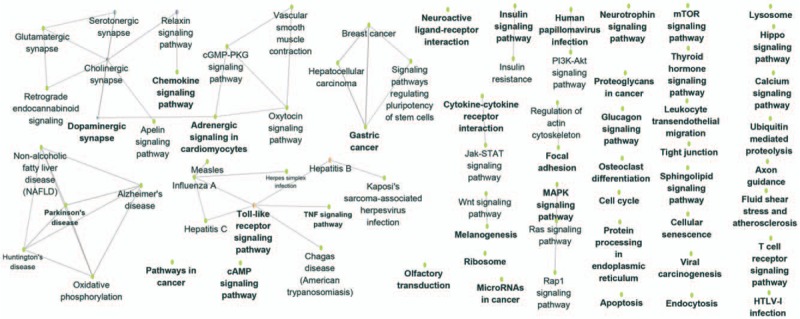
Kyoto Encyclopedia of Genes and Genomes (KEGG) pathway enrichment analysis of MAGE A9 in patients with esophageal squamous cell carcinoma (ESCC). The result showed that A9 was enriched in cytokine-cytokine receptor interaction. The more large volume of the cycle represents the lower P value.
3.4. PCR results
The patients enrolled in this study were diagnosed with clinical pathology (24 patients with squamous esophageal carcinoma and 1 patient with adenocarcinoma) and with the mean age of 62.08 ± 6.70 years. The results showed that the expression of MAGE-A3/4/9/11 was significantly increased in the tumor samples according to the normal adjacent tissues of esophageal carcinoma patients (P < .05, Fig. 10).
Figure 10.
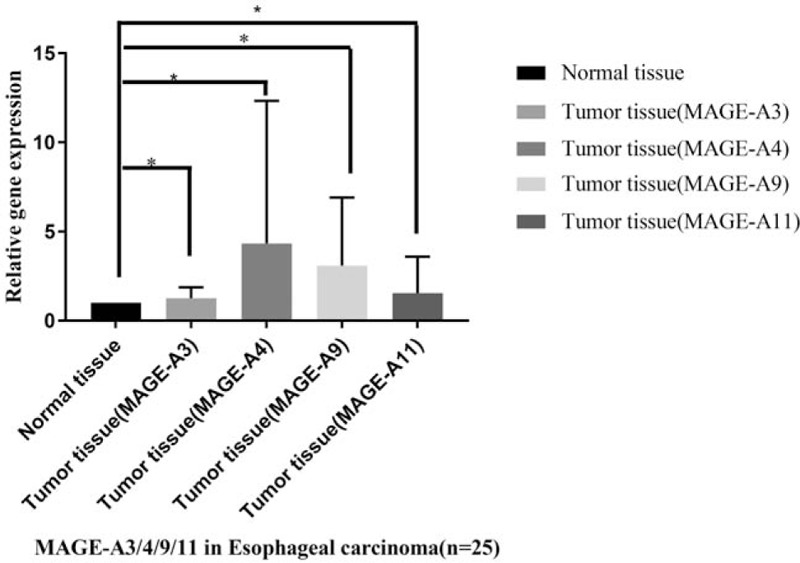
The relative gene expressions of MAGE-A3/4/9/11 in patients with esophageal carcinoma. Twenty-five patients with esophageal carcinoma were enrolled in the study. The adjacent normal tissue was calculated as the control samples. The gene expression of MAGE-A3/4/9/11 was validated by the gene expressions by q-PCR in the tumor tissues compared with normal adjacent tissues. The results showed that the 4 genes were significantly increased in the tumor tissues (∗P < .05).
4. Discussion
A recent study reported that immunotherapy had a profound effect on cancer and may become the new method in curing certain cancers.[12–14] Clinical results of immune checkpoint inhibitors (ICBs) show high effective rate and had been proved to be used in certain cancers (such as lung cancer, malignant melanoma, intestinal cancer, lymphadenoma, and so on) by American FDA.[15–19] Car-T is another significant clinical progress in cancer immunotherapy and has been used in certain hematological oncologies.[3,20,21] Nevertheless, the effect of Car-T on cancers depends on their specific antigen[2,22–24]; thus, it is extremely important to find the proper antigen to develop the particular immune therapy.
As reported, CTAs are the most attractive targets for cancer immunotherapy among all the tumor antigens. MAGE-A was regarded as one of best CTA, as they were highly expressed in certain tumor tissues while low/not expressed in normal tissues.[25–28] MAGE-A subfamily includes 12 closely related genes located at Xq28.[25] MAGE proteins contain the epitopes of cytotoxic T-lymphocyte (CTL), which attracts tumor-specific CTLs.[18,29]
In present study, the results of the data analysis of TCGA-ESCA showed that MAGE-A3/4/11 were all highly expressed in esophageal squamous carcinoma compared with the normal tissues (almost not expressed in the normal) and their expression level was not correlated with the survival time. These indicated that MAGE-A3/4/11 may be a potential immune target for EC.
In order to learn the function of MAGE-A in EC, the HiSeq RNA data of EC were downloaded from TCGA. The correlation test of MAGE-A and its related genes, Go, and KEGG enrichment analysis was performed on the basis of the HiSeq data. The results showed that there were 20,104 genes that showed correlation of MAGE-A3/4/9/11, and there were 32, 40, 24, and 79 genes that showed significant correlation with MAGE-A 3/4/9/11 respectively. Go enrichment results showed that MAGE-A subtypes were enriched in regulation of adaptive immune response (MAGE-A3), immune process (such as interleukin-4 production) (MAGE-A9), and response to type I interferon and skin development (MAGE-A11). Furthermore, KEGG pathway analysis revealed that they were enriched in T cell receptor signaling pathway (MAGE-A3), Th1 and Th2 differentiation, antigen processing and presentation (MAGE-A4), cytokine-cytokine receptor interaction (MAGE-A9), and chemokine signaling pathway (A11). Recent studies showed that administering autologous CD4 (+) T cells could express an MHC class II restricted antitumor TCR that targets MAGE-A3.[30] Wu et al[31] found that the peptide p286–1Y2L9L of CD8+ T cell epitope was derived from cancer-testis antigen MAGE-4.[31] The above results indicated that MAGE-A3/4/9/11 played an important role in regulating the immune response and process. The 4 antigens showed theoretically proper immune target for EC immunotherapy.
Finally, the relative gene expression of MAGE-A3/4/9/11 was detected in the tumor tissues according to normal adjacent tissues of patients with EC by q-PCR. The results showed that the expressions of MAGE-A3/4/9/11 all significantly increased in the tumor tissues. This was consistent with the results of recent studies, which indicated that MAGE-A3/4/9/11 was high-expressed in EC tumor tissues while low/not expressed in normal tissues. Thus, it can be regarded as one of the best CTA for EC immunotherapy.[31–35]
5. Conclusion
MAGE-A (A3/4/9/11) played an important role in regulation of immune response (MAGE-A3), immune process (MAGE-A4, MAGE-A11) and T cell receptor signaling pathway (MAGE-A3), Th1 and Th2 differentiation, antigen processing and presentation (MAGE-A4), cytokine-cytokine receptor interaction (MAGE-A9), and chemokine signaling pathway (A11). The relative gene expressions of MAGE-A3/4/9/11were significantly increased in the tumor tissues according to normal adjacent tissues of patients with EC. The present results revealed that MAGE-A can be considered as a candidate immune target for EC treatment and provided the messages for further research in the function of MAGE-A.
Author contributions
Data curation: Sina Cai.
Formal analysis: Sina Cai.
Investigation: Liping Wang.
Methodology: Xiaona Zhang.
Project administration: Xiaohua Chen, Sina Cai, Xiaona Zhang.
Software: Liping Wang, Wenhui Li.
Validation: Wenhui Li.
Writing – original draft: Xiaohua Chen.
Writing – review & editing: Xiaolong Cao.
Footnotes
Abbreviations: EC = esophageal carcinoma, GO = gene ontology, KEGG = Kyoto Encyclopedia of Genes and Genomes, MAGE-A = Melanoma-associated antigen-A, q-PCR = quantitative real-time PCR, TCGA = the Cancer Genome Atlas.
XC, SC, and LW contributed equally.
This work was supported by the grants of the Technical NewStar of Zhujiang, Pan Yu District, Guangzhou (2013-special-15–6.10) and the Science and Technology Program of Guangzhou (201804010012).
The authors report no conflicts of interest
References
- [1].Chen W, Zheng R, Zhang S, et al. Cancer incidence and mortality in China, 2013. Cancer Lett 2017;401:63–71. [DOI] [PubMed] [Google Scholar]
- [2].Ahmed N, Brawley VS, Hegde M, et al. Human epidermal growth factor receptor 2 (HER2) -specific chimeric antigen receptor-modified T cells for the immunotherapy of HER2-positive sarcoma. J Clin Oncol 2015;33:1688–96. [DOI] [PMC free article] [PubMed] [Google Scholar]
- [3].Turtle CJ, Hanafi LA, Berger C, et al. Immunotherapy of non-Hodgkin's lymphoma with a defined ratio of CD8+ and CD4+ CD19-specific chimeric antigen receptor-modified T cells. Sci Transl Med 2016;8:355ra116. [DOI] [PMC free article] [PubMed] [Google Scholar]
- [4].Mueller KT, Maude SL, Porter DL, et al. Cellular kinetics of CTL019 in relapsed/refractory B-cell acute lymphoblastic leukemia and chronic lymphocytic leukemia. Blood 2017;130:2317–25. [DOI] [PMC free article] [PubMed] [Google Scholar]
- [5].Chandrashekar DS, Bashel B, Balasubramanya SAH, et al. UALCAN: a portal for facilitating tumor subgroup gene expression and survival analyses. Neoplasia 2017;19:649–58. [DOI] [PMC free article] [PubMed] [Google Scholar]
- [6].Vasaikar SV, Straub P, Wang J, et al. LinkedOmics: analyzing multi-omics data within and across 32 cancer types. Nucleic Acids Res 2018;46:D956–d963. [DOI] [PMC free article] [PubMed] [Google Scholar]
- [7].Bindea G, Mlecnik B, Hackl H, et al. ClueGO: a Cytoscape plug-in to decipher functionally grouped gene ontology and pathway annotation networks. Bioinformatics 2009;25:1091–3. [DOI] [PMC free article] [PubMed] [Google Scholar]
- [8].Bindea G, Galon J, Mlecnik B. CluePedia Cytoscape plugin: pathway insights using integrated experimental and in silico data. Bioinformatics 2013;29:661–3. [DOI] [PMC free article] [PubMed] [Google Scholar]
- [9].Livak KJ, Schmittgen TD. Analysis of relative gene expression data using real-time quantitative PCR and the 2 (-Delta Delta C (T)) method. Methods 2001;25:402–8. [DOI] [PubMed] [Google Scholar]
- [10].Du J, Yuan Z, Ma Z, et al. KEGG-PATH: Kyoto encyclopedia of genes and genomes-based pathway analysis using a path analysis model. Mol Biosyst 2014;10:2441–7. [DOI] [PubMed] [Google Scholar]
- [11].Chumbley JR, Friston KJ. False discovery rate revisited: FDR and topological inference using Gaussian random fields. Neuroimage 2009;44:62–70. [DOI] [PubMed] [Google Scholar]
- [12].Zanganeh S, Spitler R, Hutter G, et al. Tumor-associated macrophages, nanomedicine and imaging: the axis of success in the future of cancer immunotherapy. Immunotherapy 2017;9:819–35. [DOI] [PubMed] [Google Scholar]
- [13].Retel VP, Steuten LMG, Geukes Foppen MH, et al. Early cost-effectiveness of tumor infiltrating lymphocytes (TIL) for second line treatment in advanced melanoma: a model-based economic evaluation. BMC Cancer 2018;18:895. [DOI] [PMC free article] [PubMed] [Google Scholar]
- [14].Gandara DR, von Pawel J, Mazieres J, et al. Atezolizumab treatment beyond progression in advanced non-small cell lung cancer: results from the randomized, phase III OAK study. J Thorac Oncol 2018;13:1906–18. [DOI] [PubMed] [Google Scholar]
- [15].Sharon E, Streicher H, Goncalves P, et al. Immune checkpoint inhibitors in clinical trials. Chin J Cancer 2014;33:434–44. [DOI] [PMC free article] [PubMed] [Google Scholar]
- [16].La-Beck NM, Jean GW, Huynh C, et al. Immune checkpoint inhibitors: new insights and current place in cancer therapy. Pharmacotherapy 2015;35:963–76. [DOI] [PubMed] [Google Scholar]
- [17].Yoneda K, Imanishi N, Ichiki Y, et al. Immune checkpoint inhibitors (ICIs) in non-small cell lung cancer (NSCLC). J UOEH 2018;40:173–89. [DOI] [PubMed] [Google Scholar]
- [18].Carlino MS, Long GV, Schadendorf D, et al. Outcomes by line of therapy and programmed death ligand 1 expression in patients with advanced melanoma treated with pembrolizumab or ipilimumab in KEYNOTE-006: a randomised clinical trial. Eur J Cancer 2018;101:236–43. [DOI] [PubMed] [Google Scholar]
- [19].Swaika A, Hammond WA, Joseph RW. Current state of anti-PD-L1 and anti-PD-1 agents in cancer therapy. Mol Immunol 2015;67:4–17. [DOI] [PubMed] [Google Scholar]
- [20].Lu TL, Pugach O, Somerville R, et al. A rapid cell expansion process for production of engineered autologous CAR-T cell therapies. Hum Gene Ther Methods 2016;27:209–18. [DOI] [PMC free article] [PubMed] [Google Scholar]
- [21].Turtle CJ, Hanafi LA, Berger C, et al. CD19 CAR-T cells of defined CD4+:CD8+ composition in adult B cell ALL patients. J Clin Invest 2016;126:2123–38. [DOI] [PMC free article] [PubMed] [Google Scholar]
- [22].You F, Jiang L, Zhang B, et al. Phase 1 clinical trial demonstrated that MUC1 positive metastatic seminal vesicle cancer can be effectively eradicated by modified anti-MUC1 chimeric antigen receptor transduced T cells. Sci China Life Sci 2016;59:386–97. [DOI] [PubMed] [Google Scholar]
- [23].Papa S, van Schalkwyk M, Maher J. Clinical evaluation of ErbB-targeted CAR T-cells, following intracavity delivery in patients with ErbB-expressing solid tumors. Methods Mol Biol 2015;1317:365–82. [DOI] [PubMed] [Google Scholar]
- [24].Koneru M, O’Cearbhaill R, Pendharkar S, et al. A phase I clinical trial of adoptive T cell therapy using IL-12 secreting MUC-16 (ecto) directed chimeric antigen receptors for recurrent ovarian cancer. J Transl Med 2015;13:102. [DOI] [PMC free article] [PubMed] [Google Scholar]
- [25].Chomez P, De Backer O, Bertrand M, et al. An overview of the MAGE gene family with the identification of all human members of the family. Cancer Res 2001;61:5544–51. [PubMed] [Google Scholar]
- [26].Thongprasert S, Yang PC, Lee JS, et al. The prevalence of expression of MAGE-A3 and PRAME tumor antigens in East and South East Asian non-small cell lung cancer patients. Lung Cancer 2016;101:137–44. [DOI] [PubMed] [Google Scholar]
- [27].Rastgoosalami M, Memar B, Aledavood SA, et al. Evaluation of MAGE-1 cancer-testis antigen expression in invasive breast cancer and its correlation with prognostic factors. Iran J Cancer Prev 2016;9:e4404. [DOI] [PMC free article] [PubMed] [Google Scholar]
- [28].Sang M, Gu L, Liu F, et al. Prognostic significance of MAGE-A11 in esophageal squamous cell carcinoma and identification of related genes based on DNA microarray. Arch Med Res 2016;47:151–61. [DOI] [PubMed] [Google Scholar]
- [29].Lopez M, Ghidouche A, Rochas C, et al. Identification of a naturally processed HLA-A∗02:01-restricted CTL epitope from the human tumor-associated antigen nectin-4. Cancer Immunol Immunother 2016;65:1177–88. [DOI] [PMC free article] [PubMed] [Google Scholar]
- [30].Lu YC, Parker LL, Lu T, et al. Treatment of patients with metastatic cancer using a major histocompatibility complex class II-restricted T-cell receptor targeting the cancer germline antigen MAGE-A3. J Clin Oncol 2017;35:3322–9. [DOI] [PMC free article] [PubMed] [Google Scholar]
- [31].Wu ZY, Gao YF, Wu YH, et al. Identification of a novel CD8+ T cell epitope derived from cancer-testis antigen MAGE-4 in oesophageal carcinoma. Scand J Immunol 2011;74:561–7. [DOI] [PubMed] [Google Scholar]
- [32].Bujas T, Marusic Z, Peric Balja M, et al. MAGE-A3/4 and NY-ESO-1 antigens expression in metastatic esophageal squamous cell carcinoma. Eur J Histochem 2011;55:e7. [DOI] [PMC free article] [PubMed] [Google Scholar]
- [33].Li XZ, Han Y, Tian J, et al. Enhancement of dendritic cells with melanoma-associated antigen 3 for inducing cytotoxicity by cytotoxic T lymphocytes on bladder cancer BIU-87 cells. Genet Mol Res 2016;15:gmr.15039001(1-11). [DOI] [PubMed] [Google Scholar]
- [34].Junwei W, Xiumin Z, Jing Y, et al. In vivo enhancement of the MAGE-specific cellular immune response by a recombinant MAGE1-MAGE3-TBHSP70 tumor vaccine. Cancer Cell Int 2016;16:45. [DOI] [PMC free article] [PubMed] [Google Scholar]
- [35].Pujol JL, Vansteenkiste JF, De Pas TM, et al. Safety and immunogenicity of MAGE-A3 cancer immunotherapeutic with or without adjuvant chemotherapy in patients with resected stage IB to III MAGE-A3-positive non-small-cell lung cancer. J Thorac Oncol 2015;10:1458–67. [DOI] [PubMed] [Google Scholar]


