Abstract
This study aimed to establish a comprehensive prognostic system for osteosarcoma based on a large population database with high quality.
The Surveillance, Epidemiology, and End Results (SEER) Program database was used to identify patients with osteosarcoma from 1973 to 2015. Multivariate analysis was performed to screen statistically significant variables. A nomogram was constructed by R software to predict the 3-, 5- and 10-year survival rates. Predictive abilities were compared by C-indexes, calibration plots, integrated discrimination improvement (IDI), net reclassification improvement (NRI), as well as decision curve analysis (DCA).
In total, 4505 osteosarcoma patients were identified. They were divided into training (70%, n = 3153) and validating (30%, n = 1352) groups. Multivariate analyses identified independent predictors. Subsequently, the nomogram system of a new model was established, which comprised 7 variables as age, sex, site, decade of diagnosis (DOD), extent of disease (EOD), tumor size and patients undergoing tri-modality therapy (surgery, radiotherapy and chemotherapy). It provided better C-indexes than the model without therapies (0.727, 0.712 vs 0.705, 0.668) in the 2 cohort, respectively. As well, the new model had good performances in the calibration plots. Moreover, both IDI and NRI improved for 3-, 5- and 10-year follow-up of C-indexes. Finally, DCA demonstrated that the nomogram of new model was clinically meaningful.
We developed a reliable nomogram for prognostic determinants and treatment outcome analysis of osteosarcoma, thus helping better choose medical examinations and optimize therapeutic regimen under the cooperation among oncologists and surgeons.
Keywords: nomogram, osteosarcoma, SEER, survival
1. Introduction
Osteosarcoma is the most common primary osseous sarcoma.[1,2] Since the introduction of chemotherapeutic regimens in 1970s, neoadjuvant chemotherapy with successive surgical resection has been the standard of care for high-grade osteosarcoma.[3,4] As chemotherapeutic regimens intensified, survival improved for patients with high-grade osteosarcoma, with 5-year survival rates over 60% for patients with non-metastatic tumors.[1,2,5,6] However, metastasis at presentation consistently results in poorer prognosis.[1,5,7,8] About 30% patients will develop lung metastases within one year following diagnosis. The vast majority of patients eventually die due to lung metastases.[9]
Early identification of high-risk patients will improve the overall prognosis of osteosarcoma. However, the current limited American Joint Committee on Cancer (AJCC) staging and Enneking staging, can only roughly assess clinical risks of osteosarcoma based on initial clinical features, that is, tumor sizes, pathological grading, and metastasis. Given the clinical uniqueness of osteosarcoma, new prognostic tools are undoubtedly in urgent need for the accurate prediction of survival in osteosarcoma patients.
A nomogram is a convenient graphical representation of a mathematical model, in which various important factors are combined to predict a specific endpoint. It has become a reliable and convenient tool for quantifying risks, widely used for the prognosis of cancer. A well-developed nomogram is forceful in clinical decision-making, and predicting the outcome of individual patients, thus benefiting both clinicians and patients.[10]
Accordingly, in this study, we aimed to establish a comprehensive prognostic evaluation system. Osteosarcoma patients from SEER registries during 1973 to 2015 were screened and identified. We further analyzed the database and created a nomogram with significant variables which proved reliable for quantifying risks for osteosarcoma patients.
2. Methods
2.1. Data source and inclusion criteria
We queried the SEER program database for records of osteosarcoma from 1973 to 2015, covering approximately 30% of the U.S. population with cases from 18 population-based registries.[11] Informed patient consent was unnecessary for data from SEER program without personal identifying information.
We searched for osteosarcoma patients by using the following International Classification of Diseases for Oncology (ICD-O-3) histological subtype codes: “osteosarcoma, NOS” (9180/3), “chondroblastic osteosarcoma” (9181/3), “fibroblastic osteosarcoma” (9182/3), “telangiectatic osteosarcoma” (9183/3), “osteosarcoma in Paget disease” (9184/3), “small cell osteosarcoma” (9185/3), “central osteosarcoma” (9186/3), “intraosseous well-differentiated osteosarcoma” (9187/3), “Parosteal osteosarcoma” (9192/3), “periosteal osteosarcoma” (9193/3), and “high-grade surface osteosarcoma” (9194/3).
Patient demographic variables of interest included age at diagnosis, sex and race. Additionally, the primary site of osteosarcoma was categorized as “extremity” (long and short bones of the upper and lower extremity), “spine and pelvis”, “Skull, Face and Mandible”, “Rib, Sternum and Clavicle” and “other”. DOD was categorized as 1970s, 1980s, 1990s, 2000s and thereafter. EOD was categorized as confined, local invasion, metastasis and unknown.[12] Tumor Size was categorized as “≤50 mm” (small), “>50 to 100 mm” (intermediate), “>100 mm” (large) and “unknown”.[13] Composite socioeconomic status (SES) is the percentage of persons in the county living below the national poverty threshold in Census 2000.[14] It was divided into 3 levels using established cut-off values:[14,15] <10% (low-poverty), 10% to 19.99% (medium-poverty), and ≥20% (high-poverty). Treatment programs included surgery, radiotherapy and chemotherapy, categorized as “yes” and “no/unknown”. Patients were excluded with missing or unknown survival data.
2.2. Statistical analysis and nomogram construction
Normality was detected by Skewness/kurtosis test. Age at diagnosis was expressed as mean ± SD or median (25th–75th percentile) where appropriate in terms of distribution. Categorical variables were expressed as percentages. Survival plots were generated using the Kaplan-Meier method. Multivariable Cox proportional hazards regression models were used to determine factors associated with survival. On the basis of the predictive model with identified prognostic factors, a nomogram was constructed for predicting 3-, 5- and 10-year survival rates of osteosarcoma patients.
2.3. Nomogram validation and performance evaluating
Nomogram validation consisted of discrimination and calibration by using the validation set. Receiver-operator characteristic (ROC) curve analyses were generated to test the performance evaluating of constructed nomogram, by the areas under the ROC curves (AUC). The agreement between the predicted probability and the actual outcome was evaluated by calibration plotting. The nomogram was subjected to bootstrapping validation (1000 bootstrap resamples) to calculate a relatively corrected C-index. Also, improvement in the predictive accuracy of the models with and without tri-modality therapy programs, was estimated by calculating the relative IDI and the NRI.[16] Finally, we evaluated the clinical usefulness and net benefit of the new predictive models using DCA.[17]
Statistical analysis was conducted with SPSS version 24.0 (SPSS Inc., Chicago, IL) and R software (version 3.0.1; http://www.Rproject.org). P values < .05 were considered statistically significant; all tests were 2-sided.
3. Results
3.1. Demographic baseline characteristics
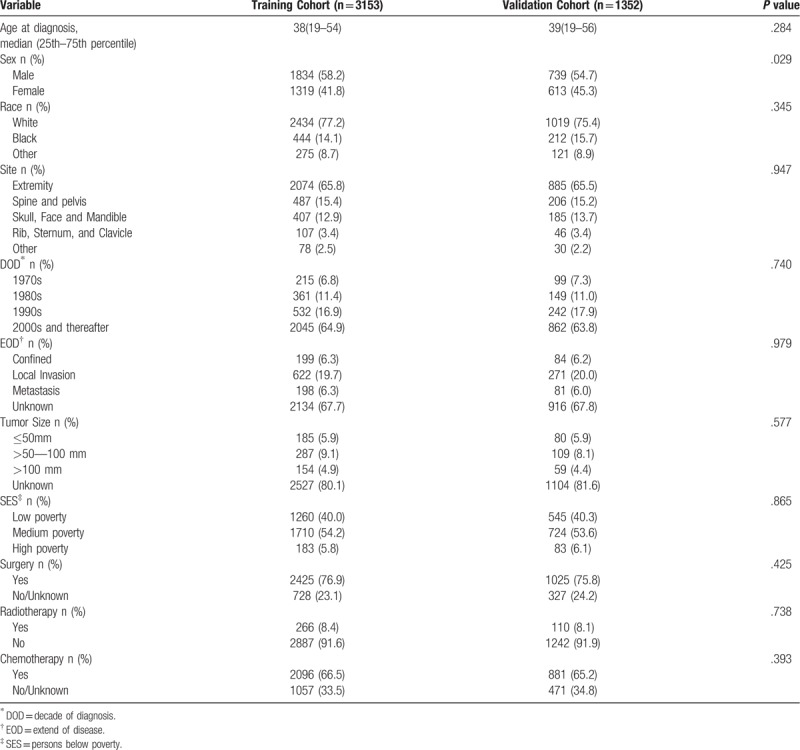
According to the determined inclusion and exclusion criteria, 4505 patients with osteosarcoma were included from SEER database. In this study, all patients’ survival months were available. For nomogram construction and validation, we randomly assigned patients to 2 cohorts in R software, 70% of the patients to the training cohort (n = 3153) and 30% to the validation cohort (n = 1352). The median age at the time of diagnosis was 38 years and 39 years in the training and validation cohorts, respectively. The majority of patients were White (77.2%, 75.4%), diagnosed in 2000s and thereafter (64.9%, 63.8%), undergone the therapies of surgery (76.9%, 75.8%) and Chemotherapy (66.5%, 65.2%), in the training and validation cohorts, respectively. Table 1 showed the clinicopathologic characteristics of all patients in the training and validation cohorts.
Table 1.
Patient characteristics.
3.2. Kaplan-Meier survival analysis and Multivariate logistic regression results
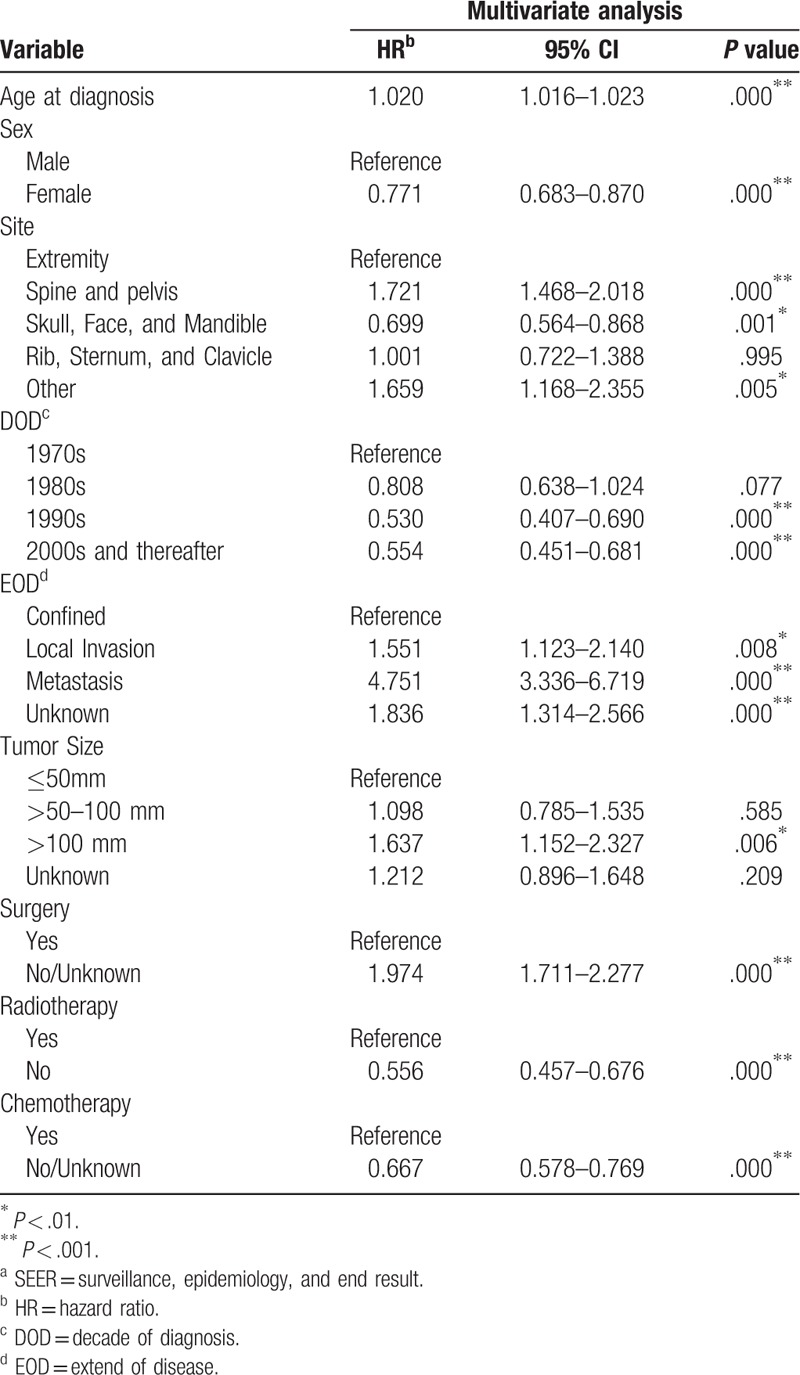
Descriptive epidemiological and survival statistics were calculated for all variables. Osteosarcoma specific survival curves were calculated using the Kaplan-Meier method (Fig. 1). Several multivariate models were developed in order to determine independent prognostic variables. Parameters were entered into the multivariable Cox regression analyses, including age at diagnosis, sex, site, DOD, EOD, tumor size and treatment programs “surgery, radiotherapy and chemotherapy”. Yet, race and SES scores had no significant impact on survival. The multivariate analyses identified 7 independent negative predictors of disease-specific survival (DSS), including age at diagnosis (HR, 1.020; 95%CI, 1.016 to 1.023; P < .001), the primary site of osteosarcoma in Spine and pelvis (HR, 1.721; 95%CI, 1.468 to 2.018; P < .001) and other site (HR, 1.659; 95%CI, 1.168 to 2.355; P < .01), local invasion (HR, 1.551; 95%CI, 1.123 to 2.140; P < .01), metastasis (HR, 4.751; 95%CI 3.336 to 6.719; P < .001), the unknown EOD (HR, 1.836; 95%CI 1.314 to 2.566; P < .001), tumor size >100 mm (HR, 1.637; 95%CI, 1.152 to 2.327; P < .01), non-surgical treatment (HR, 1.974; 95%CI, 1.711 to 2.277; P < .001). Moreover, 5 weak positive predictors of DSS were identified, including female (HR, 0.771; 95%CI, 0.683 to 0.870; P < .001), cases diagnosed in 1990s (HR, 0.530; 95%CI, 0.407 to 0.690; P < .001), 2000s and thereafter (HR, 0.554; 95%CI, 0.451 to 0.681; P < .001), non-radiotherapy (HR, 0.556; 95%CI, 0.457 to 0.676; P < .001), no/unknown chemotherapy (HR, 0.667; 95%CI, 0.578 to 0.769; P < .001), detailed data were shown in Table 2.
Figure 1.
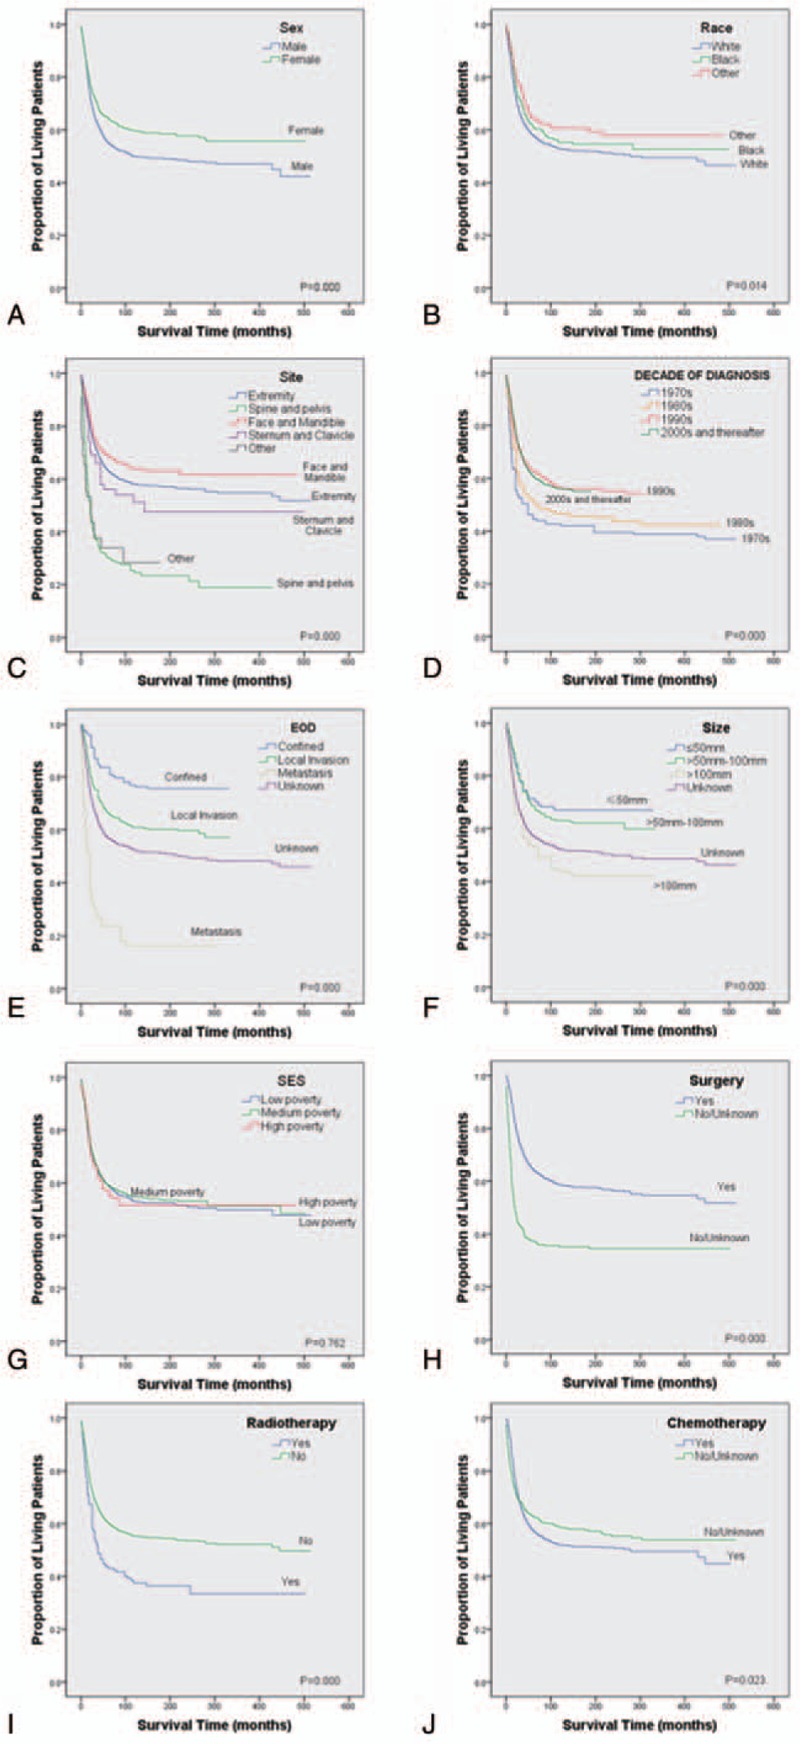
Kaplan-Meier estimated specific survival in patients with osteosarcoma stratified by sex (a), race (b), site (c), decade of diagnosis (d), EOD (e), size (f), SES (g), surgery (h), radiotherapy (i), and chemotherapy (j). EOD = extent of disease, SES = socioeconomic status.
Table 2.
Selected variables in the SEER by multivariate Cox regression analysis (Training Cohort).
3.3. Nomogram construction
A nomogram (Fig. 2) was constructed based on the data of the logistic regression model in Table 2. Given that age at diagnosis had the largest coefficient absolute value; it was set as reference scale ranging from 0 to 100. Each predictor had its factors with points and marks on its line according to the set scale. Total points of this nomogram would be summed and subsequently converted to the probability of 3-, 5- and 10-year survival. There were parallel lines below the figure with linear relationship scales with each other. The nomogram showed that the age at diagnosis and metastasis had the most highly risky contribution to prognosis, followed by the site of spine & pelvis, non-surgical treatment, DOD in 1970s, radiotherapy, size > 100 mm, chemotherapy and male.
Figure 2.
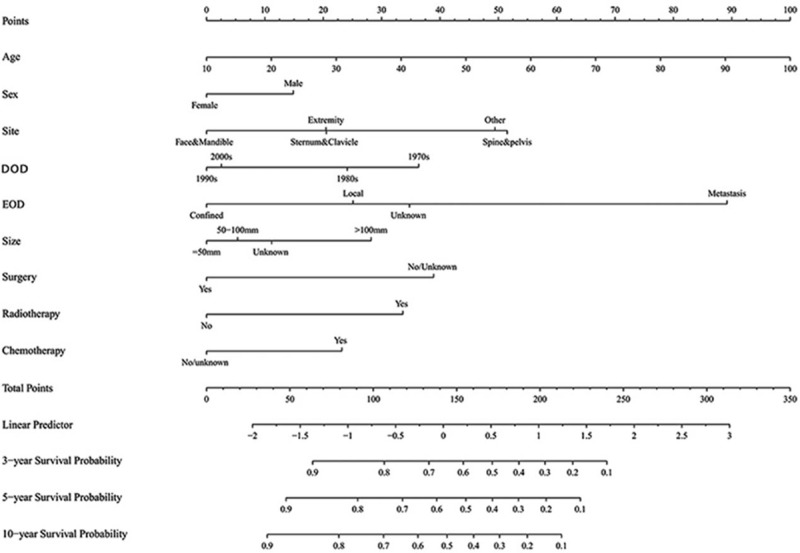
Nomogram predicting 3-, 5- and 10-year survival. DOD = decade of diagnosis, EOD = extent of disease.
3.4. Performance of the nomogram
Based on the C-index analysis of the SEER training cohort, the nomogram provided relatively high C-indexes for 3-, 5- and 10-year survival (0.776, 0.759, 0.751). Similarly, the C-indexes of the nomogram were also high (0.744, 0.752, 0.736) in the internal validation cohort, indicating good model discriminative ability (Fig. 3).
Figure 3.
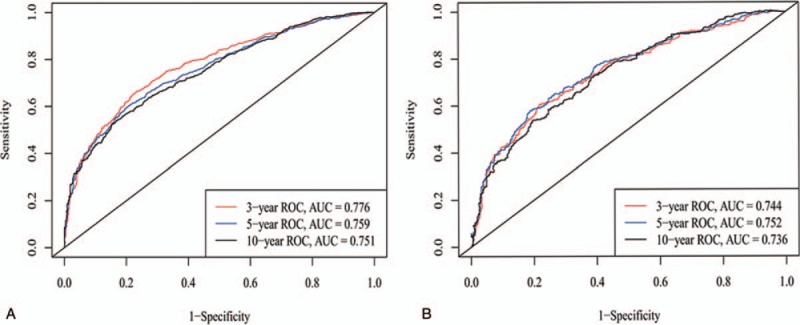
ROC curves. ROC curve analyses were generated to test the performance evaluating of the newly established nomogram, by the areas under the ROC curves (AUC), a came from the training set, and b came from the validation set.
3.5. Validation of the nomogram
Subsequently, the nomogram system of a new model was established, which contains age, sex, site, DOD, EOD, tumor size and patients undergoing tri-modality therapy (surgery, radiotherapy, and chemotherapy). The new model containing trimodality therapy provided better C-indexes (0.727, 0.712) than the model without therapies (0.705, 0.668), in the 2 cohorts respectively. Calibration curves depicted the calibration of each model in terms of the agreement between the predicted probabilities and observed outcomes for 3-, 5- and 10-year survival (Fig. 4).
Figure 4.
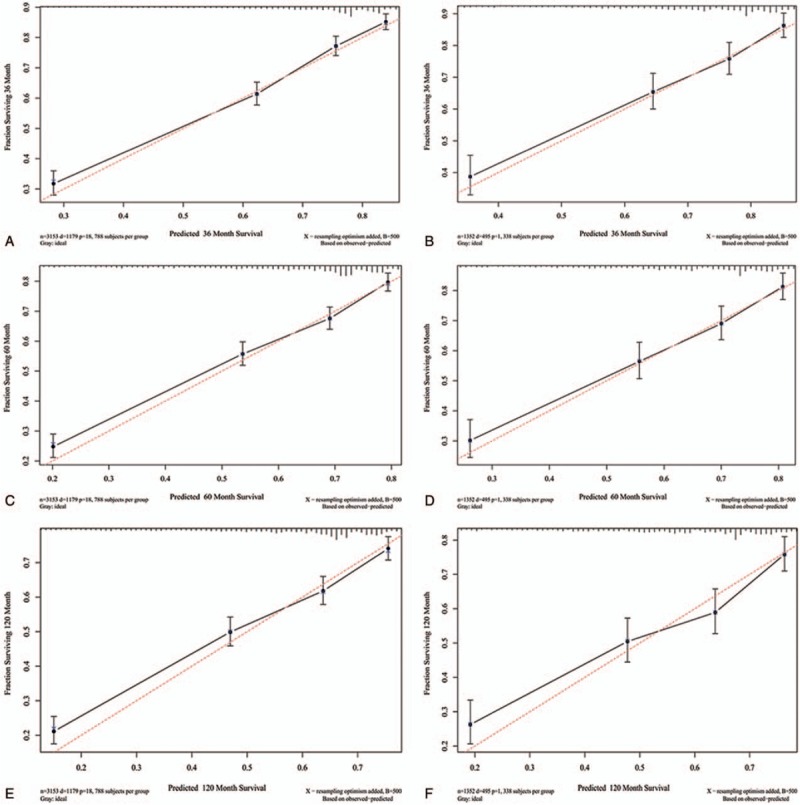
Calibration curves for 3-, 5- and 10-year survival. Calibration curves depict the calibration of each model in terms of the agreement between the predicted probabilities and observed outcomes of the training set (a, c, e) and validation set (b, d, f).
In the training set, the NRI was 0.229 (95%CI, 0.168 to 0.300) for 3-year of follow-up, 0.220 (95%CI, 0.152 to 0.273) for 5-year of follow-up, and 0.194 (95%CI, 0.128 to 0.272) for 10-year of follow-up. In the validation set, the NRIs of 3-, 5- and 10-year of follow-up were 0.356 (95%CI, 0.247 to 0.470), 0.358 (95%CI, 0.258 to 0.476) and 0.318 (95%CI, 0.177 to 0.420), respectively. These showed that the new model of cases undergoing tri-modality therapy (surgery, radiotherapy and chemotherapy), had a great improvement than the model without therapies in predicting performance. Similarly, in the training set, the IDI for 3-, 5- and 10-year of follow-up were 0.024 (P < .001), 0.025 (P < .001) and 0.025 (P < .001), respectively. In the validation set, the IDI for 3-, 5- and 10-year of follow-up were 0.033 (P < .001), 0.033 (P < .001) and 0.033 (P < .001), respectively.
3.6. Clinical application
DCA graphically showed ideal net benefits of the new models for 3-, 5- and 10-year survival (Fig. 5), that should justify their clinical use and impact on practical decision-making.
Figure 5.
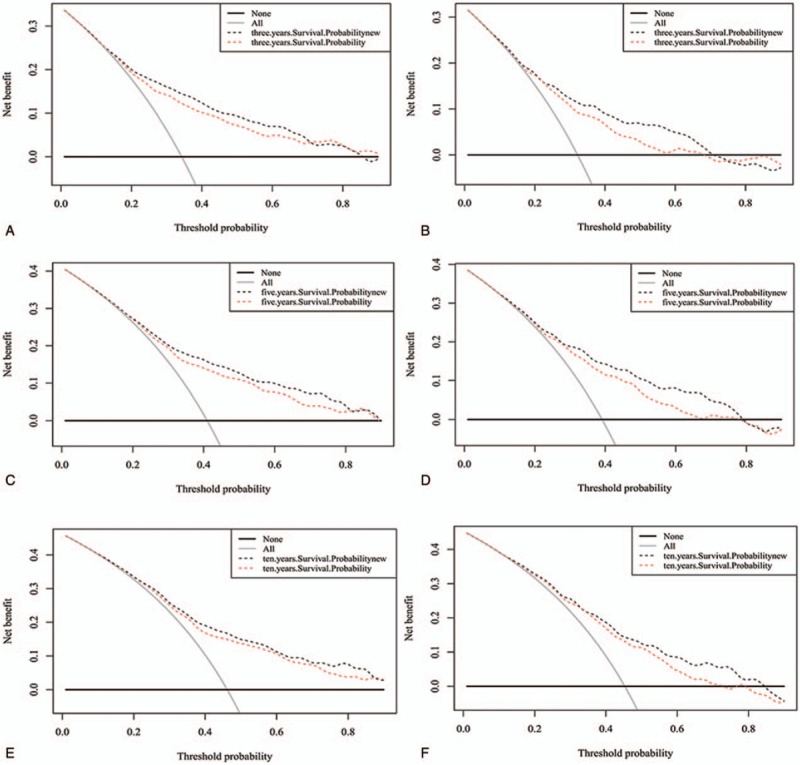
Decision curve analysis of the training set (a, c, e) and validation set (b, d, f) for 3-, 5- and 10-year survival. In the figure, the abscissa is the threshold probability, the ordinate is the net benefit rate. The horizontal one indicates that all samples are negative and all are not treated, with a net benefit of zero. The oblique one indicates that all samples are positive. The net benefit is a backslash with a negative slope.
4. Discussion
Osteosarcoma is the most common primary malignancy of bone, typically occurring among children and adolescents.[1,2] Since mid-1980s, the 5-year survival rate of patients has increased to 65%,[18] with the standardization of diagnosis and treatment and the application of neoadjuvant chemotherapy. However, about 30% of patients have lung metastases within 1 year following diagnosis. The vast majority of patients eventually die from lung metastases. Early identification of high-risk patients will help to further improve the overall prognosis of osteosarcoma. Clinical staging of osteosarcoma is often used for risk assessment.[19] Existing clinical staging systems for osteosarcoma, such as the AJCC staging and Enneking staging, can only roughly assess clinical risks of osteosarcoma based on initial clinical features, including tumor size, pathological grade, and presence or absence of metastasis. Therefore, we developed a more comprehensive predictive model, including not only the system demographics, but also therapies and other clinical parameters.
The SEER program initially started with 8 registries in 1973 with continually increasing participating sites with time. Currently, the database includes 18 geographically diverse areas, representing approximately 30% of the US population with efforts to reflect the racial, economic, and social diversity of the country as a whole.[2,14,20] In our study, 4505 patients with high-grade osteosarcoma were identified in the SEER Program database from 1973 to 2015. As with most studies,[13,14,21,22] multivariate COX regression in Table 2 showed that female was a protective factor compared with male, and also patient's age at diagnosis portended worse outcomes in DSS for osteosarcoma. The trend is reasonable given the aggressive therapies needed to treat such disease. It is well established[1] that patients with metastatic disease at initial presentation have a poorer prognosis than those with confined and localized disease (HR, 4.751; P < .001). Similarly, the multivariate analyses demonstrated that tumor size > 100 mm, primary site of spine & pelvis, non-surgical treatment were risk factors for survival. However, race and SES score were not identified as independent risk factors for survival following. DOD in 1990s (HR, 0.530; vs 1970s; P < .001), 2000s and thereafter (HR, 0.554; vs 1970s; P < .001), were protective factors for survival. Multivariate COX regression in Table 2 showed that the prognosis of osteosarcoma under radiotherapy and chemotherapy seems poor. We analyze the reasons for this result as that patients with osteosarcoma was extracted in SEER database from 1973 to 2015. Nevertheless, the new radiotherapy and chemotherapy regimen for osteosarcoma was introduced in the mid-late 1980s.[23] In addition, similar to other primary osseous tumors such as chondrosarcoma,[24] osteosarcoma has been shown to be relatively resistant to radiotherapy. Thus, radiotherapy for osteosarcoma is usually reserved for palliative therapy or for treating residual microscopic focal tissue following surgery.[25] These objective scenarios resulted in radiotherapy and chemotherapy as poor prognostic factors of osteosarcoma.
The nomogram is excellent for risk assessment.[11,26] It creates a simple graphical representation of statistical predictive model generating a numerical probability of clinical event. Our newly built nomogram model contains a wide range of clinical factors, such as age, sex, site, DOD, EOD, tumor size and trimodality therapy (surgery, radiotherapy and chemotherapy), that are easy available and routinely collected through historical records. To our knowledge, this study provides the first nomogram for predicting the 3-, 5- and 10-year survival rates of osteosarcoma patients, which predictive values were actualized by C-indexes, calibration plots, IDI, NRI, and DCA. Therefore, the nomogram is more sensitive and informative. In our study, ROC curve analyses were generated to test the performance evaluating of the newly established nomogram. The nomogram provided relatively high C-indexes for 3-, 5- and 10-year survival (0.776, 0.759, 0.751) in training cohort, and (0.744, 0.752, 0.736) in the internal validation cohort. This result meant that our nomogram model well fitted both the randomly assigned training and validating group. As previously reported,[16,27,28] we evaluated the performance of our survival model using calibration, IDI and NRI to further determine whether the newly built prognostic model performed better and whether should enter clinical practice. Calibration curves depict the calibration of each model in terms of the agreement between the predicted probabilities and observed outcomes.[16,27] As seen in Figure 4, plots that resemble a 45° line indicated that the nomogram predictions were well calibrated for the 3-, 5- and 10-year survival, both in the training and the verification set. In this study, we further applied IDI and NRI to verify the new model containing trimodality therapy and the model without therapy. The new model showed good discrimination and calibration, both IDI and NRI for 3-, 5- and 10-year of follow-up got improved C-index. As DCA was graphically shown in Figure 5, the abscissa is the threshold probability; the ordinate is the net benefit rate.[29–32] The new model showed ideal net benefits for 3-, 5- and 10-year survival, that should justify their clinical use and impact on practical decision-making.
In addition, we found that age at diagnosis, metastasis, and sites of spine & pelvic, non-operation cases and diagnosed in 1970s were important risk factors for the survival of osteosarcoma patients. The osteosarcoma prognosis nomogram can be valuable for clinicians and patients.
4.1. Limitations
Similar to other malignant bone tumors, osteosarcoma is a rare primary bone malignancy, so our analysis was extracted from the SEER database, which is based on retrospective data with unavoidable inherent bias. In addition, the predicted values calculated from the nomogram are for reference only by the clinician, rather than an absolutely accurate prognosis. In further research, how to develop a widely accepted osteosarcoma risk prediction tool remains an important task.
5. Conclusions
Nomogram is an important component of modern medical decision making. We develop and validate the osteosarcoma prognosis nomogram based on SEER database, which is highly accurate. All of parameters of the established nomogram show good performance, including the C-indexes, calibration plots, IDI, NRI, and DCA.
Author contributions
Data curation: Jin Yang, Xiaoni Yan, Jun Lyu.
Methodology: Zhenyu Pan, Chuanyu Hu, Yuanjie Li, Jun Lyu.
Software: Jin Yang, Jun Lyu.
Supervision: Jun Lyu.
Writing – original draft: Jun Zhang.
Writing – review & editing: Hai-Qiang Wang, Yuanjie Li, Jun Lyu.
Footnotes
Abbreviations: AJCC = American Joint Committee on Cancer, AUC = areas under the ROC curves, DCA = decision curve analysis, DOD = decade of diagnosis, DSS = disease-specific survival, EOD = extent of disease, IDI = integrated discrimination improvement, NRI = net reclassification improvement, ROC = receiver-operator characteristic, SEER = surveillance, epidemiology, and end results.
JZ, JY, and HQW contributed equally to this study.
This study was supported by the National Social Science Foundation of China (No. 16BGL183), the Research Fund of Health Bureau of Xi’an (No. QFO1330), and National Natural Science Foundation of China (Grant number: 81572182).
The authors have no conflicts of interest to disclose.
References
- [1].Jawad MU, Cheung MC, Clarke J, et al. Osteosarcoma: improvement in survival limited to high-grade patients only. J Cancer Res Clin Oncol 2011;137:597–607. [DOI] [PMC free article] [PubMed] [Google Scholar]
- [2].Mirabello L, Troisi RJ, Savage SA. Osteosarcoma incidence and survival rates from 1973 to 2004: data from the Surveillance, Epidemiology, and End Results Program. Cancer 2009;115:1531–43. [DOI] [PMC free article] [PubMed] [Google Scholar]
- [3].Cores EP, Holland JF, Wang JJ, et al. Doxorubicin in disseminated osteosarcoma. JAMA 1972;221:1132–8. [DOI] [PubMed] [Google Scholar]
- [4].Jaffe N, Paed D, Farber S, et al. Favorable response of metastatic osteogenic sarcoma to pulse high-dose methotrexate with citrovorum rescue and radiation therapy. Cancer 1973;31:1367–73. [DOI] [PubMed] [Google Scholar]
- [5].Bielack SS, Kempf-Bielack B, Delling G, et al. Prognostic factors in high-grade osteosarcoma of the extremities or trunk: an analysis of 1702 patients treated on neoadjuvant cooperative osteosarcoma study group protocols. J Clin Oncol 2002;20:776–90. [DOI] [PubMed] [Google Scholar]
- [6].Meyers PA, Heller G, Healey J, et al. Chemotherapy for nonmetastatic osteogenic sarcoma: the Memorial Sloan-Kettering experience. J Clin Oncol 1992;10:5–15. [DOI] [PubMed] [Google Scholar]
- [7].Bacci G, Briccoli A, Rocca M, et al. Neoadjuvant chemotherapy for osteosarcoma of the extremities with metastases at presentation: recent experience at the Rizzoli Institute in 57 patients treated with cisplatin, doxorubicin, and a high dose of methotrexate and ifosfamide. Ann Oncol 2003;14:1126–34. [DOI] [PubMed] [Google Scholar]
- [8].Mialou V, Philip T, Kalifa C, et al. Metastatic osteosarcoma at diagnosis: prognostic factors and long-term outcome--the French pediatric experience. Cancer 2005;104:1100–9. [DOI] [PubMed] [Google Scholar]
- [9].Aznab M, Hematti M. Evaluation of clinical process in osteosarcoma patients treated with chemotherapy including cisplatin, adriamycin, ifosfamide, and etoposide and determination of the treatment sequels in a long-term 11-year follow-up. J Cancer Res Ther 2017;13:291–6. [DOI] [PubMed] [Google Scholar]
- [10].Liu RZ, Zhao ZR, Ng CS. Statistical modelling for thoracic surgery using a nomogram based on logistic regression. J Thorac Dis 2016;8:E731–6. [DOI] [PMC free article] [PubMed] [Google Scholar]
- [11].Lin Z, Yan S, Zhang J, et al. A nomogram for distinction and potential prediction of liver metastasis in breast cancer patients. J Cancer 2018;9:2098–106. [DOI] [PMC free article] [PubMed] [Google Scholar]
- [12].Wang Z, Li S, Li Y, et al. Prognostic factors for survival among patients with primary bone sarcomas of small bones. Cancer Manag Res 2018;10:1191–9. [DOI] [PMC free article] [PubMed] [Google Scholar]
- [13].Duchman KR, Gao YN, Miller BJ. Prognostic factors for survival in patients with high-grade osteosarcoma using the Surveillance, Epidemiology, and End Results (SEER) Program database. Cancer Epidemiol 2015;39:593–9. [DOI] [PubMed] [Google Scholar]
- [14].Wu J, Sun H, Li J, et al. Increased survival of patients aged 0–29 years with osteosarcoma: A period analysis, 1984-2013. Cancer Med 2018;7:3652–61. [DOI] [PMC free article] [PubMed] [Google Scholar]
- [15].Ma H, Sun H, Sun X. Survival improvement by decade of patients aged 0–14 years with acute lymphoblastic leukemia: a SEER analysis. Sci Rep 2014;4:4227. [DOI] [PMC free article] [PubMed] [Google Scholar]
- [16].Cook NR. Comments on ’Evaluating the added predictive ability of a new marker: From area under the ROC curve to reclassification and beyond’ by M. J. Pencina et al., Statistics in Medicine (DOI: 10.1002/sim.2929). Stat Med 2008;27:191–5. [DOI] [PubMed] [Google Scholar]
- [17].Vickers AJ, Elkin EB. Decision curve analysis: a novel method for evaluating prediction models. Med Decis Making 2006;26:565–74. [DOI] [PMC free article] [PubMed] [Google Scholar]
- [18].Ritter J, Bielack SS. Osteosarcoma. Ann Oncol 2010;21Suppl 7:320–5. vii. [DOI] [PubMed] [Google Scholar]
- [19].Heck RK, Jr, Stacy GS, Flaherty MJ, et al. A comparison study of staging systems for bone sarcomas. Clin Orthop Relat Res 2003;64–71. [DOI] [PubMed] [Google Scholar]
- [20].Arshi A, Sharim J, Park DY, et al. Prognostic determinants and treatment outcomes analysis of osteosarcoma and Ewing sarcoma of the spine. Spine J 2017;17:645–55. [DOI] [PMC free article] [PubMed] [Google Scholar]
- [21].Miller BJ, Cram P, Lynch CF, et al. Risk factors for metastatic disease at presentation with osteosarcoma: an analysis of the SEER database. J Bone Joint Surg Am 2013;95:e89. [DOI] [PMC free article] [PubMed] [Google Scholar]
- [22].Miller BJ, Lynch CF, Buckwalter JA. Conditional survival is greater than overall survival at diagnosis in patients with osteosarcoma and Ewing's sarcoma. Clin Orthop Relat Res 2013;471:3398–404. [DOI] [PMC free article] [PubMed] [Google Scholar]
- [23].Li S, Ni XB, Xu C, et al. Oral sex and risk of oral cancer: a meta-analysis of observational studies. J Evid Based Med 2015;8:126–33. [DOI] [PubMed] [Google Scholar]
- [24].Holliday EB, Mitra HS, Somerson JS, et al. Postoperative proton therapy for chordomas and chondrosarcomas of the spine: adjuvant versus salvage radiation therapy. Spine (Phila Pa 1976) 2015;40:544–9. [DOI] [PubMed] [Google Scholar]
- [25].DeLaney TF, Park L, Goldberg SI, et al. Radiotherapy for local control of osteosarcoma. Int J Radiat Oncol Biol Phys 2005;61:492–8. [DOI] [PubMed] [Google Scholar]
- [26].Balachandran VP, Gonen M, Smith JJ, et al. Nomograms in oncology: more than meets the eye. Lancet Oncol 2015;16:e173–80. [DOI] [PMC free article] [PubMed] [Google Scholar]
- [27].Chen LD, Liang JY, Wu H, et al. Multiparametric radiomics improve prediction of lymph node metastasis of rectal cancer compared with conventional radiomics. Life Sci 2018;208:55–63. [DOI] [PubMed] [Google Scholar]
- [28].Tan X, Ma Z, Yan L, et al. Radiomics nomogram outperforms size criteria in discriminating lymph node metastasis in resectable esophageal squamous cell carcinoma. Eur Radiol 2019;29:392–400. [DOI] [PubMed] [Google Scholar]
- [29].Asuncion Esteve-Pastor M, Miguel Rivera-Caravaca J, Roldan V, et al. Long-term bleeding risk prediction in ’real world’ patients with atrial fibrillation: Comparison of the HAS-BLED and ABC-Bleeding risk scores. Thromb Haemost 2017;117:1848–58. [DOI] [PubMed] [Google Scholar]
- [30].Esteve-Pastor MA, Rivera-Caravaca JM, Roldan V, et al. Long-term bleeding risk prediction in ’real world’ patients with atrial fibrillation: Comparison of the HAS-BLED and ABC-Bleeding risk scores. The Murcia Atrial Fibrillation Project. Thromb Haemost 2017;117:1848–58. [DOI] [PubMed] [Google Scholar]
- [31].Garcia-Fernandez A, Roldan V, Rivera-Caravaca JM, et al. Does von Willebrand factor improve the predictive ability of current risk stratification scores in patients with atrial fibrillation? Sci Rep 2017;7:41565. [DOI] [PMC free article] [PubMed] [Google Scholar]
- [32].Rodrigues G, Gonzalez-Maldonado S, Bauman G, et al. A statistical comparison of prognostic index systems for brain metastases after stereotactic radiosurgery or fractionated stereotactic radiation therapy. Clin Oncol (R Coll Radiol) 2013;25:227–35. [DOI] [PubMed] [Google Scholar]


