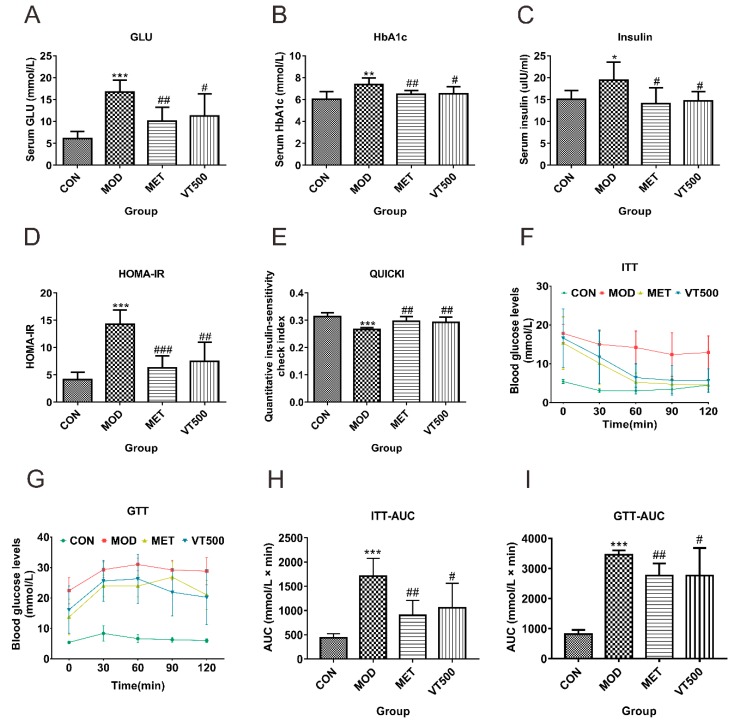
Figure 2.
Effect of VT on serum glucose (GLU), glycated hemoglobin A1c (HbA1c), insulin, glucose tolerance and insulin sensitivity in rats with T2D. Fasting serum glucose (A), HbA1c (B), and insulin (C) were measured at the end of 4 weeks of treatment with VT, and the homeostasis model assessment of insulin resistance (HOMA-IR, D) index and the quantitative insulin sensitivity check index (QUICKI, E) were calculated. Blood was collected from the tail vein, and glucose levels were determined 0, 30, 60, 90, and 120 min after either insulin administration in the insulin tolerance test (ITT, F) or 50% glucose administration in the glucose tolerance test (GTT, G). The insulin area under the curve (AUC, H) and glucose AUC (I) was calculated. The data shown as the mean ± SD. * p < 0.05, ** p < 0.01, *** p < 0.001 compared with the CON group; # p < 0.05, ## p < 0.01, ### p < 0.001 compared with the MOD group, n = 6.

