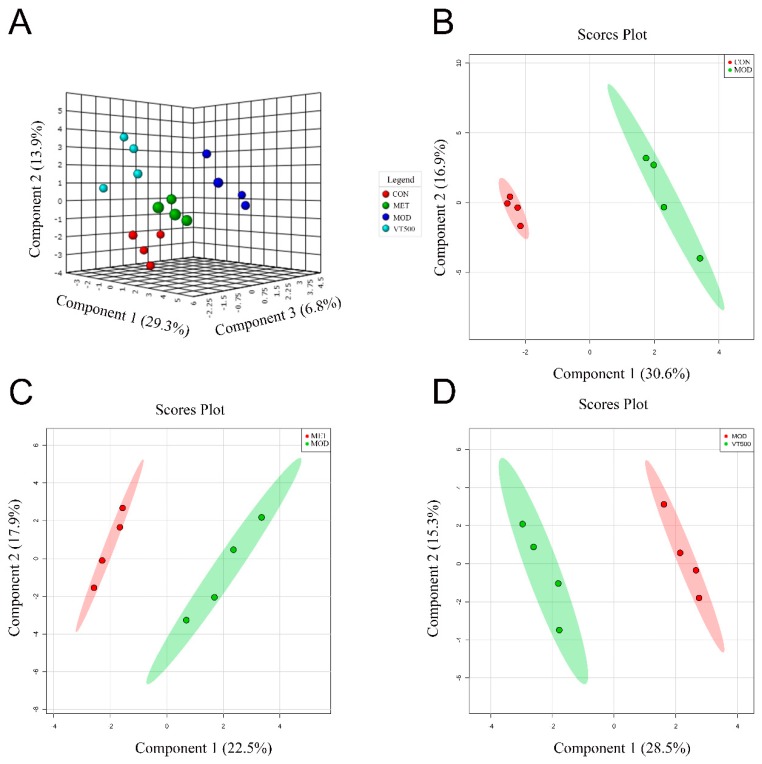
Figure 3.
Effect of VT on liver metabolism in rats. Three-dimensional sparse partial least squares-discriminant analysis (sPLS-DA) of the CON, MOD, VT500 and MET groups (A); sPLS-DA score plots of all groups (B); sPLS-DA score plots of the MOD and MET groups (C); sPLS-DA score plots of the MOD and VT500 groups (D), n = 4.

