Abstract
Background
Myeloid sarcoma (MS), also known as granulocytic sarcoma or chloroma, is a solid tumor of extramedullary localization composed of malignant primitive myeloid cells. The purpose of the study was to identify clinical and imaging features in a large patient sample.
Patients and methods
Overall, 71 cases (34 females (47.9%) and 37 males (52.1%) with a median age of 56 (± 16 years) of histopathologically confirmed myeloid sarcoma were included into this study. The underlying hematological disease, occurrence, localizations and clinical symptoms as well as imaging features on computed tomography and magnetic resonance imaging were investigated.
Results
In 4 cases (5.63%) the manifestation of MS preceded the systemic hematological disease by a mean value of 3.8 ± 2.1 months. In 13 cases, first presentation of MS occurred simultaneously with the initial diagnosis of leukemia, and 51 patients presented MS after the initial diagnosis of the underlying malignancy with a mean latency of 39.8 ± 44.9 SD months. The visceral soft tissue was affected in 26 cases, followed by the cutis/subcutis was affected in 21 cases. Further localizations were bones (n = 13), central nervous system (n = 9), lymph nodes (n = 4) and visceral organs (n = 9).
Conclusions
MS is a rare complication of several hematological malignancies, predominantly of acute myeloid leukemia, which can affect any part of the body. In most cases it occurs after the diagnosis of the underlying malignancy, and affects frequently the cutis and subcutis.
Key words: myeloid sarcoma, granulocytic sarcoma, chloroma, acute myeloid leukaemia
Introduction
Myeloid sarcoma (MS), also known as granulocytic sarcoma or chloroma, is a solid tumor of extramedullary localization composed of malignant primitive myeloid cells.1 A first mention of the pathology was found in 1811 by Burns and later called chloroma on account of its typical green appearance caused by the presence of the enzyme myeloperoxidase in the granules of the immature granulocytic precursors.2,3 Its occurrence is linked with leukemic diseases of the myeloid cell line, primarily in patients with acute myeloid leukemia (AML) and less commonly in those with its chronic form (CML), myelodysplastic syndrome (MDS) or other myeloproliferative disorders.4 It may develop concurrently with mentioned primary diseases or be the initial manifestation of relapse in an already treated case.4 Especially, after allogenic bone marrow transplantation an increased incidence has been described.5 Very rarely, MS can occur in the absence of a systemic disease and predate onset of an underlying hematologic malignancy by months to years.6 Treatment options, including radiation and chemotherapy are based upon an early and accurate diagnosis is crucial.7 However, particularly inapparent bulks pose a diagnostic challenge lacking indicatory laboratory findings. Moreover, MS can possibly involve any organ system.4,5,8 There are only a few systematic evaluations of radiologic findings with small patient populations, mainly limited to case reports.9,13
Therefore, the purpose of this study was to evaluate imaging characteristics of MS in a large patient sample and to establish possible correlations between imaging and clinical data, assess growth patterns and typically imaging features.
Patients and methods
Patients
The study was conducted in accordance with the Declaration of Helsinki and the protocol was approved by the Ethic Committee of the University of Leipzig. For this retrospective study, the Institutional Ethic Committee waived the need for informed consent (Committee of the University of Leipzig, Study codes Nr. 027/2002 and 162/2004). Patient records of the local oncology and hematology department from October 1992 to February 2016 were screened for myeloid sarcoma. Overall, 71 cases of histopathologically confirmed MS were identified and included into this study. There were 34 females (47.9%) and 37 males (52.1%) with a median age of 56 ± 16 years (range 14–85 years). For 43 (60.6%) patients, imaging studies were available for evaluation.
Clinical features
All patient records were reviewed by one of the authors. The underlying hematological disease was categorized in following subgroups: acute myeloid leukemia (AML), chronic myeloid leukemia (CML), myeloproliferative syndrome (MPS), myelodysplastic syndrome (MDS), myelofibrosis, biphenotypic leukemia and chronic myelomonocytic leukemia (CMML). Number and type of bone marrow transplantation (autologous vs. allogeneic related donor vs. allogeneic non-related donor) were obtained. The time between the initial diagnosis of the primary disease together with a potential treatment by use of bone marrow transplantation and appearance of the granulocytic sarcoma was calculated. Finally, the kind of the first clinical manifestation was identified and sorted as followed: neurological failures; incidental by imaging; pain; skin-related color changes or swelling; Organ-specific dysfunction. If there was a combination of symptoms, the leading one was determined.
Image analysis
Three and forty patients with myeloid sarcoma underwent imaging with computed tomography (CT) (n = 13; 30.2%); magnetic resonance imaging (MRI) (n = 27; 62.8%); CT and MRI (n = 1; 2.3%). Imaging protocols varied due to the different body region. Two radiologists (MB and AS) with 3 and 15 years of radiological experience, respectively, analyzed the images in consensus and in awareness of the pathologically proven diagnosis. Following features were noted: type of modality (CT, MRI), maximum size (largest diameter in mm), number of lesions, type of affected site (osseous; soft tissue; central nervous system; visceral organ; (sub-) cutis; lymph nodes); application of contrast agent, imaging appearance (hypodense/hypointense, isodense/isointense, hyperdense/hyperintense) and type of enhancement (no enhancement; homogenous or inhomogenous enhancement).
Statistical analysis
Collected data were analyzed by means of descriptive statistics (absolute and relative frequencies) with SPSS (SPSS 17.0, SPSS Inc., Chicago IL, USA). Continuous variables were expressed as means ± standard deviation (SD), and categorical variables as percentages.
Results
Clinical findings
Overall, 57 (80.3%) suffered from AML, 7 (9.9%) from CML, 3 (4.2%) from MDS, 2 (2.8%) from MPS (2.8%) and 2 (2.8%) from CMML.
In 4 cases (5.6%) the manifestation of MS preceded the systemic hematological disease by a mean value of 3.8 ± 2.1 months. In 13 (18.3%) cases first presentation of MS occurred simultaneously with the initial diagnosis of leukemia, and 51 (71.8%) patients presented MS after the initial diagnosis of the underlying malignancy with a mean latency of 39.8 ± 44.9 SD months.
Clinically, swelling (n = 30; 46.2%) was the most common finding, followed by pain (n = 14; 21.5%), neurological deficit (n = 11; 16.9%) and dysfunction of the affected organ (n = 8; 12.3%). In 8 patients (11.3%) the diagnosis was made incidentally by imaging.
Number, size, and localizations of MS
In 30 patients (42.3%) one MS lesion occurred, in 41 cases (57.7%) 2 or more lesions. The size of all localized tumors varied from 7 mm to 150 mm with a mean value of 44.9 ± 27.8 mm.
In 58 patients (77.5%) MS was limited to one localization, 10 patients (14.1%) showed two different localizations, and in 3 (4.2%) patients three or four several localizations of were identified.
Overall, the visceral soft tissue was affected in 26 cases (29.9%), followed by the cutis/subcutis was affected in 21 cases (24.1%). Further localizations were bones (n = 13; 14.9%), central nervous system (n = 9; 10.3%), lymph nodes (n = 4; 4.6%) and visceral organs (n = 9; 10.3%). Table 1 displays the affected localizations.
Table 1.
The affected body regions of the patients
| Region | N | % |
|---|---|---|
| Visceral soft tissue | 26 | 29.9 |
| Cutis | 21 | 24.1 |
| Bones | 13 | 14.9 |
| Central nervous system | 9 | 10.3 |
| Lymph nodes | 4 | 4.6 |
| Stomach | 3 | 3.4 |
| Pancreas | 3 | 3.4 |
| Heart | 2 | 2.3 |
| Enteric | 2 | 2.3 |
| Testis | 1 | 1.2 |
| Breast | 1 | 1.2 |
| Bladder | 1 | 1.2 |
| Kidney | 1 | 1.2 |
| All | 87 | 100 |
Imaging findings
CT
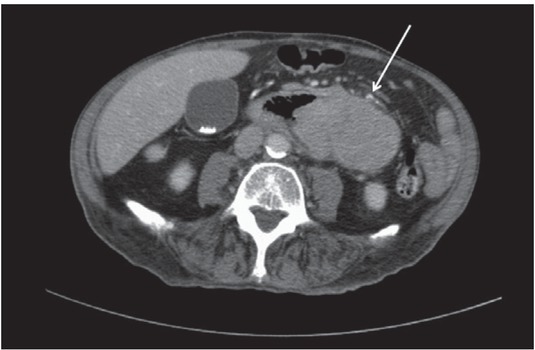
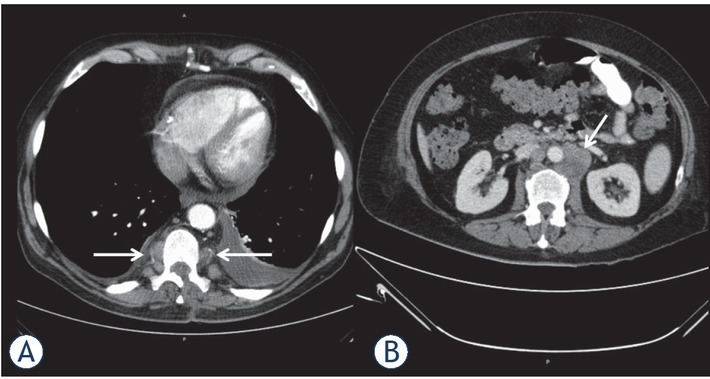
14 patients with 23 lesions were investigated with CT. All lesions were isodense compared to musculature (Figure 1). Every lesion showed a moderate enhancement of intravenous contrast medium. The enhancement was homogenous in 15 cases (65.2%), and inhomogenous in 8 cases (34.8%). Figure 2 and 4 display CT findings of two cases.
Figure 1.

Computed tomography in a 89-years old patient with chronic myeloid leukemia showing a large abdominal mass (arrow) affecting the small bowel. Histological examination (not shown) after surgical biopsy confirms an extramedullary relapse of the known leukemia.
Figure 2.

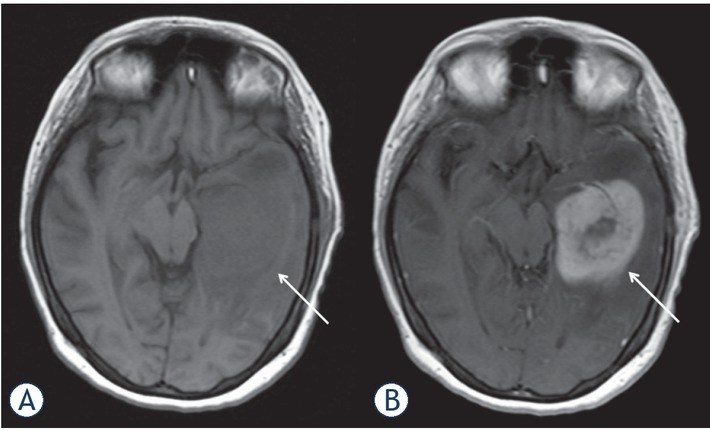
Magnetic resonance imaging findings in a 32-years old patient with known history of acute myeloid leukemia. Clinical presentation with headache. MRI documenting a large lesion in the left temporal lobe (arrows). On T1 weighted image it is slightly hypointense (A). After intravenous application of contrast medium, the lesion shows an inhomogenous enhancement (B). Histological examination (not shown) after surgical biopsy confirms an extramedullary relapse of the known leukemia.
Figure 4.

Computed tomography of the thorax (A) and abdomen in portal venous phase (B) in a 54-years old patient with acute myeloid leukemia documenting multiple paravertebral and retroperitoneal enhancing masses (arrows). Additionally, pleural and pericardial effusions are seen.
MRI
Overall, 28 patients were investigated by MRI. OnT2-weighted (T2w) images, in most cases (n = 23; 82.1%) MS was hyperintense, and in 5 cases (17.9%) isointense in comparison to the musculature. On T1-weighted (T1w) images, MS was hypointense in 11 cases (39.3%) and isointense in 17 cases (60.7%) (Figure 2).
In 22 cases (78.6%) intravenous contrast media was applied. In most cases (n = 21; 95.4%), a moderate homogenous enhancement was found and one lesion showed no enhancement (4.6%).
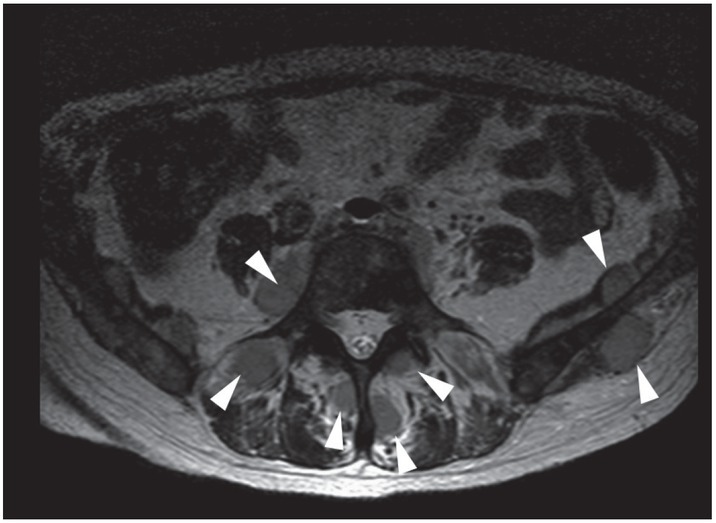
Diffusion weighted imaging (DWI) was available for 5 patients. The mean apparent diffusion coefficient (ADC) value was 0.57 x10⁻³ mm2/s ± 0.18, median 0.50 x10⁻³mm2/s, range 0.36–0.84 x10⁻³mm2/s. Figure 3 and 4 display typically findings.
Figure 3.

Axial T2 weighted image of the pelvis documenting multiple slightly hyperintense intramuscular lesions (arrows) in a 59-years old patient with known history of acute myeloid leukemia.
Discussion
The present study provides clinical and imaging findings of MS in a large patient sample. The diagnosis of MS might be challenging, even for the pathologist, and thus, typically clinical features are of importance for the radiologist and oncologist to establish the proper diagnosis. Furthermore, the occurrence of MS is associated with an overall poor survival with 15.9 months.6,8,14
According to the literature, the prevalence of MS varied from 2.5% to 9% in AML patients.9,15,16 However, due to its rare incidence, systemic data is still lacking to date. Additionally, the incidence of MS in myelodysplastic syndrome is even lower.16 Concordantly, only 2 patients with myelodysplastic syndrome and 2 patients with myeloproliferative disorders were identified in our patient sample.
As reported previously, MS can occur in three different situations. Firstly, it can occur prior to marrow/blood leukemia. In such cases systemic leukemia generally develops within one or two years after diagnosis of extramedullary relapse.6,8,9
Secondly, MS can occur in systemic disease, either at the time of diagnosis of leukemia or subsequent to diagnosis.6,8,9 Thirdly, MS can manifest itself as a relapse after therapy or stem cell transplantation.6,8,9 Most frequently, MS occurred in up to 50% after onset of AML, in 15–35% contemporaneous with the leukemic manifestation and, less frequently, before the diagnosis of the underlying malignancy.16
In the present study, in 71.30% of cases MS occurred with a mean of 40 months after the primary diagnosis. Overall, these results are in good agreement with the literature. Interestingly, the time between occurrence of MS and the initial onset of disease was longer than in a recent study by Kaur et al., in which it was only 8.8 months.6 Clearly, the diagnosis of MS is easier in cases with known AML. However, 18.3% of our patients developed MS simultaneous and even in 5.6% before the onset of a hematological disease. In these cases, the diagnosis may be very challenging to make due to several possible differential diagnoses. It has been reported that misdiagnosis rates in cases with MS varied from 25% to 47%.15 Frequently, Hodgkin-Lymphomas, MALT lymphoma, or Ewing’s sarcoma were diagnosed instead of MS.15 Furthermore, infectious diseases like abscesses have to be considered as a diagnosis because these occur very frequently in leukemic patients with immunosuppression, either due to chemotherapy or due to the malignancy itself.9
The clinical presentation largely depends on the affected site of MS, and, thus, MS can be presented with a lot of different symptoms.15 Regarding localizations, MS affects most frequently cutis, subcutis and visceral soft tissue.6,9 In an older study investigated 50 patients, 21 patients had a lesion in the soft tissue, 15 patients had lymph nodal lesions, and skin lesions in 13 patients.17 Only one patient had a brain lesion and 4 had gastrointestinal lesions.17 However, in a recent study analyzed 23 patients, skin and subcutaneous tissue was affected the most cases (69.5%).6 Furthermore, according to Neiman et al., in most cases, MS presented with one lesion, and 16% had two and more lesions.17
In the present study, MS was isolated to one body area in up to 80% of the cases. However, 42.3% of patients had more than 3 lesions, especially found in patients with subcutaneous involvement. This finding might be beneficial to rule out possible differential diagnosis like solid tumors, which only presents with a single lesion.
Concordantly to the literature, a preference for subcutaneous involvement was also identified, followed by osseous and affection of the central nervous system. Affection of visceral organs and lymph nodes were rarer in the present patient sample than in the previous studies.
Clearly, every unknown lesion no matter the localization in a patient with known AML, should be indicative for MS.
Clinically, myeloid sarcoma was apparent in half of the cases with swelling and skin discoloration, which underlines the importance of a good physical examination in oncologic patients. Furthermore, in 29.2% neurological and organ dysfunctions were found and in 21.5% pain was the main symptom. Notably, 11.3% of the MS cases were detected incidentally by imaging studies. For example, these included one patient with a cardiac manifestation. Due to increasing performance of imaging studies in oncologic patients, we hypothesize that the amount of incidentally detected MS will increase concordantly. Therefore, the radiologist and oncologist need to be aware of the entity of MS.
Shinagare et al. described MRI features of 25 patients with 41 different MS localizations.18 The authors identified lesions with a mean size of 5.6 cm (range 1–20 cm), which is good comparable with our data. Regarding signal intensities, 75.6% were isointense and 24.4% were hypointense on T1-weighted images. Moreover, on T2-weighted images, 95.1% were hyperintense and 4.9% were isointense.18 These results are also in good agreement with the present study, however, we detected more hypointense lesions on T1-weighted images, and more isointense lesions on T2-weighted images. Furthermore, Oii et al. investigated 11 patients with MS with similar imaging characteristics.13 MS lesions were concordantly isodense in the present study on CT. Regarding contrast media enhancement, every lesion showed a moderate contrast media enhancement with more lesions with a homogenous enhancement than heterogenous.
However, it should be acknowledged that neither the behavior of the signal intensity on MRI and CT nor the contrast enhancement is specific for MS lesions. For example, inflammatory lesions, such as abscess formations or other neoplastic lesions, such as lymphomas can show similar imaging findings.9
Chaundhry et al. reported a diffusion restriction in 96% of patients with cerebral myeloid sarcoma on diffusion weighted images (DWI).12 In our study, the appa rent diffusion coefficients of the lesions ranged from 0.36 to 0.84 mm2/s. This finding might be caused by high cellularity in these lesions as it was shown in several other malignancies.19 Our results are in good agreement with those of Chaundhry et al. Therefore, DWI might be a useful diagnostic tool for myeloid sarcoma evaluation. However, other cell rich tumors and tumor-like lesions, such as lymphomas, poorly differentiated carcinomas, and abscesses can also show restricted diffusion.
According to the literature, another beneficial imaging modality is PET/CT, which has better accuracy than CT alone in diagnosing MS.20 As reported, MS lesions show elevated FDG uptake and the uptake changes under therapy, which also correlates with clinical outcome.20
Our study has several limitations. First, it is a retrospective study with potential confounding factors. Second, the patient sample is relatively small, mainly caused by the rare incidence of myeloid sarcoma. However, the present study sample is one of the largest to date. Furthermore, prospective studies are lacking to this date due to low incidence. Third, some previously identified localizations like involvement of the lung was not identified in the present study sample.
Conclusions
Myeloid sarcoma is a rare occurrence of several hematological malignancies, predominantly of AML, which can affect any part of the body. In most cases it occurs after the diagnosis of the underlying malignancy, and affects frequently the cutis and subcutis. This study provides typical clinical and imaging findings in a large patient sample. However, the imaging findings are not specific for myeloid sarcoma and other differential diagnoses, such as inflammatory lesions or other neoplastic lesions have to be considered.
Disclosure
No potential conflicts of interest were disclosed.
References
- 1.Liu PI, Ishimaru T, McGregor DH, Okada H, Steer Al. Autopsy study of granulocytic sarcoma (chloroma) in patients with myelogenous leukemia, Hiroshima-Nagasaki 1949-1969. Cancer. 1973;31:948. doi: 10.1002/1097-0142(197304)31:4<948::aid-cncr2820310428>3.0.co;2-n. –. [DOI] [PubMed] [Google Scholar]
- 2.Burns A. Observations of surgical anatomy in head and neck. London: Royce; 1811. p. 364. [Google Scholar]
- 3.King A. A case of chloroma. Monthly J Med. 1853;17:17. [Google Scholar]
- 4.Campidelli C, Agostinelli C, Stitson R, Pileri SA. Myeloid sarcoma: extramedullary manifestation of myeloid disorders. Am J Clin Pathol. 2009;132:426. doi: 10.1309/AJCP1ZA7HYZKAZHS. –. [DOI] [PubMed] [Google Scholar]
- 5.Mortimer J, Blinder MA, Schulman S, Appelbaum FR, Buckner CD, Clift RA. Relapse of acute leukemia after marrow transplantation: natural history and results of subsequent therapy. J Clin Oncol. 1989;7:50. doi: 10.1200/JCO.1989.7.1.50. et al. –. [DOI] [PubMed] [Google Scholar]
- 6.Kaur V, Swami A, Alapat D, Abdallah AO, Motwani P, Hutchins LF. Clinical characteristics, molecular profile and outcomes of myeloid sarcoma: a single institution experience over 13 years. Hematology. 2017;23:17. doi: 10.1080/10245332.2017.1333275. et al. –. [DOI] [PubMed] [Google Scholar]
- 7.Fleming DR, Greenwood ME, Garrison J, Geil JD, Romond EH. Lymphocyte infusion for delayed extramedullary relapse of acute leukemia following bone marrow transplantation. Leuk Lymphoma. 1996;21:525. doi: 10.3109/10428199609093456. –. [DOI] [PubMed] [Google Scholar]
- 8.Pileri SA, Ascani S, Cox MC, Campidelli C, Bacci F, Piccioli M. Myeloid sarcoma: clinico-pathologic, phenotypic and cytogenetic analysis of 92 adult patients. Leukemia. 2007;21:340. doi: 10.1038/sj.leu.2404491. et al. –. [DOI] [PubMed] [Google Scholar]
- 9.Singh A, Kumar P, Chandrashekhara SH, Kumar A. Unravelling chloroma: review of imaging findings. Br J Radiol. 2017;90:20160710. doi: 10.1259/bjr.20160710. [DOI] [PMC free article] [PubMed] [Google Scholar]
- 10.Choi EK, Ha HK, Park SH, Lee SJ, Jung SE, Kim KW. Granulocytic sarcoma of bowel: CT findings. Radiology. 2007;243:752. doi: 10.1148/radiol.2433060747. et al. –. [DOI] [PubMed] [Google Scholar]
- 11.Seok JH, Park J, Kim SK, Choi JE, Kim CC. Granulocytic sarcoma of the spine: MRI and clinical review. AJR Am J Roentgenol. 2010;194:485. doi: 10.2214/AJR.09.3086. –. [DOI] [PubMed] [Google Scholar]
- 12.Chaudhry AA, Gul M, Chaudhry AA, Dunkin J. Qualitative assessment of diffusion weighted imaging and susceptibility weighted imaging of myeloid sarcoma involving the brain. J Comput Assist Tomogr. 2016;40:61. doi: 10.1097/RCT.0000000000000337. –. [DOI] [PubMed] [Google Scholar]
- 13.Ooi GC, Chim CS, Khong PL, Au WY, Lie AK, Tsang KW. Radiologic manifestations of granulocytic sarcoma in adult leukemia. AJR Am J Roentgenol. 2011;176:1427. doi: 10.2214/ajr.176.6.1761427. et al. –. [DOI] [PubMed] [Google Scholar]
- 14.Lazzarotto D, Candoni A, Filì C, Forghieri F, Pagano L, Busca A. Clinical outcome of myeloid sarcoma in adult patients and effect of allogeneic stem cell transplantation. Results from a multicenter survey. Leuk Res. 2017;53:74. doi: 10.1016/j.leukres.2016.12.003. et al. –. [DOI] [PubMed] [Google Scholar]
- 15.Almond LM, Charalampakis M, Ford SJ, Gourevitch D, Desai A. Myeloid sarcoma: presentation, diagnosis, and treatment. Clin Lymphoma Myeloma Leuk. 2017;17:263. doi: 10.1016/j.clml.2017.02.027. –. [DOI] [PubMed] [Google Scholar]
- 16.Avni B, Koren-Michowitz M. Myeloid sarcoma: current approach and therapeutic options. Ther Adv Hematol. 2011;2:309. doi: 10.1177/2040620711410774. –. [DOI] [PMC free article] [PubMed] [Google Scholar]
- 17.Neiman RS, Barcos M, Berard C, Bonner H, Mann R, Rydell RE. Granulocytic sarcoma: a clinicopathologic study of 61 biopsied cases. Cancer. 1981;48:1426. doi: 10.1002/1097-0142(19810915)48:6<1426::aid-cncr2820480626>3.0.co;2-g. et al. –. [DOI] [PubMed] [Google Scholar]
- 18.Shinagare AB, Krajewski KM, Hornick JL, Zukotynski K, Kurra V, Jagannathan JP. MRI for evaluation of myeloid sarcoma in adults: a single-institution 10-year experience. AJR Am J Roentgenol. 2012;199:1193. doi: 10.2214/AJR.12.9057. et al. –. [DOI] [PubMed] [Google Scholar]
- 19.Surov A, Meyer HJ, Wienke A. Correlation between apparent diffusion coefficient (ADC) and cellularity is different in several tumors: a meta-analysis. Oncotarget. 2017;8:59492. doi: 10.18632/oncotarget.17752. –. [DOI] [PMC free article] [PubMed] [Google Scholar]
- 20.Aschoff P, Häntschel M, Oksüz M, Werner MK, Lichy M, Vogel W. Integrated FDG-PET/CT for detection, therapy monitoring and follow-up of granulocytic sarcoma. Initial results. Nuklearmedizin. 2009;48:185. doi: 10.3413/nukmed-0236. et al. –. [DOI] [PubMed] [Google Scholar]


