

Abstract
Glutamate, the major excitatory neurotransmitter in the CNS, is also an excitatory neurotransmitter in the enteric nervous system (ENS). We tested the hypothesis that excessive exposure to glutamate, or related agonists, produces neurotoxicity in enteric neurons. Prolonged stimulation of enteric ganglia by glutamate caused necrosis and apoptosis in enteric neurons. Acute and delayed cell deaths were observed. Glutamate neurotoxicity was mimicked by NMDA and blocked by the NMDA antagonist d-2-amino-5-phosphonopentanoate. Excitotoxicity was more pronounced in cultured enteric ganglia than in intact preparations of bowel, presumably because of a reduction in glutamate uptake. Glutamate-immunoreactive neurons were found in cultured myenteric ganglia, and a subset of enteric neurons expressed NMDA (NR1, NR2A/B), AMPA (GluR1, GluR2/3), and kainate (GluR5/6/7) receptor subunits. Glutamate receptors were clustered on enteric neurites. Stimulation of cultured enteric neurons by kainic acid led to the swelling of somas and the growth of varicosities (“blebs”) on neurites. Blebs formed close to neurite intersections and were enriched in mitochondria, as revealed by rhodamine 123 staining. Kainic acid also produced a loss of mitochondrial membrane potential in cultured enteric neurons at sites where blebs tended to form. These observations demonstrate, for the first time, excitotoxicity in the ENS and suggest that overactivation of enteric glutamate receptors may contribute to the intestinal damage produced by anoxia, ischemia, and excitotoxins present in food.
Keywords: necrosis, apoptosis, NMDA, kainic acid, glutamate transporters, bleb formation, rhodamine 123
Excessive exposure to glutamate causes cell death (“excitotoxicity”) in CNS neurons (Choi, 1988,1995). Excitotoxicity consists of necrosis and apoptosis and is thought to occur via a breakdown in ionic homeostasis mediated by NMDA and non-NMDA glutamate receptor subtypes. Neurons can be protected from excitotoxicity by Ca2+ buffers (Tymianski et al., 1993); therefore, increases in [Ca2+]i are involved in causing excitotoxic cell death (Choi, 1988, 1992). Consistent with this idea, both NMDA and kainic acid increase [Ca2+]i in central neurons (MacDermott et al., 1986; Brorson et al., 1994). Moreover, excessive exposure to either glutamate receptor agonist produces neuronal cell loss (Choi et al., 1988). Increases in [Ca2+]iproduced by these excitotoxins occur at sites that are rich in mitochondria and produce a loss of mitochondrial membrane potential (Ankarcrona et al., 1995; Bindokas and Miller, 1995). Mitochondrial function seems to determine the mode of neuronal death in excitotoxicity. Early necrosis develops in neurons that lose mitochondrial membrane potential. Delayed apoptosis develops in neurons that recover mitochondrial potential and energy levels.
Substantial evidence suggests that glutamate is an excitatory neurotransmitter in the enteric nervous system (ENS). The bowel contains glutamate-immunoreactive neurons, enteric neurons express both NMDA and non-NMDA receptors, and high affinity glutamate transporters are present in enteric ganglia (Burns et al., 1994; Burns and Stephens, 1995; Liu et al., 1997). In addition, glutamate depolarizes enteric neurons and mediates fast synaptic transmission in the ENS (Liu et al., 1997). Pharmacological studies have also been consistent with the idea that neurogenic motile (Shannon and Sawyer, 1989; Wiley et al., 1991) or secretory (Rhoads et al., 1995) responses of the gut involve enteric glutamatergic receptors.
The abundance of subsets of glutamate receptors that increase [Ca2+]i (MacDermott et al., 1986;Hollmann et al., 1991) in the ENS may render enteric neurons vulnerable to glutamate-mediated neurotoxicity. The neurotoxic effects of glutamate in the ENS have not been examined; therefore, we determined whether excitotoxicity occurs in guinea pig enteric neurons. We determined (1) the type of cell death (necrosis or apoptosis) resulting from the exposure of enteric ganglia to glutamate, (2) the ability of subtype-specific agonists to mimic the neurotoxic effects of glutamate, and (3) whether excitotoxicity in enteric neurons is associated with morphological changes and/or disruptions in mitochondrial membrane potential. Our results demonstrate that excitotoxicity occurs in the ENS. Both necrosis and apoptosis were observed in a subset of submucosal and myenteric neurons after exposure to glutamate. The effects of glutamate were mimicked by NMDA and prevented by an NMDA antagonist. Kainate receptor immunoreactivity was demonstrated in enteric ganglia, and exposure to kainic acid caused somatic cell swelling and the formation of “blebs” on enteric neurites. Bleb formation seemed to be linked with a loss of mitochondrial membrane potential. Our results show that the process of excitotoxicity in the ENS is similar to that observed in the CNS.
MATERIALS AND METHODS
Preparation of whole mounts. Male guinea pigs (250–350 gm) were stunned and exsanguinated. This procedure has been approved by the Animal Use and Care Committee of Columbia University. A segment of ileum was excised and placed in oxygenated (95% O2/5% CO2) Krebs’ solution of the following composition (mm): NaCl (121.3), KCl (5.95), CaCl2 (2.5), NaHCO3 (14.3), NaH2PO4 (1.34), MgCl2 (1.2), and glucose (12.7). A 7.0 cm segment of ileum was cut open and pinned (mucosal surface up) in a dish coated with a silicone elastomer. Under microscopic control, the mucosa was gradually scraped away to reveal the submucosal and myenteric layers of the intestinal wall. The methods used to obtain whole mounts, containing either the submucosal or the myenteric plexus with adherent longitudinal muscle (LMMP), were similar to those described previously (Kirchgessner and Gershon, 1988). The Krebs’ solution contained nifedipine (1.0 μm) to block longitudinal muscle contractions while we dissected the tissue. The preparations were transferred to a recording chamber (volume, 1.0 ml) and secured with stainless steel hooks. Preparations were superfused (3.0 ml/min; 36°C) with oxygenated Krebs’ solution. Enteric ganglia were visualized on the stage of a Zeiss (Axiovert 100) inverted microscope at a magnification of 20 or 40×.
Preparation of isolated myenteric ganglia. Ganglia were isolated from the small intestine of adult guinea pigs according to the method of Yau et al. (1989). Briefly, sheets of LMMP were stripped from segments of gut, placed in Krebs’ solution (at 4°C), and minced with scissors. The tissue was incubated for 30 min (at 37°C) in Krebs’ solution containing bovine serum albumin (BSA; 0.1%; Sigma, St. Louis, MO), collagenase (type 1A; 0.25%; Sigma), protease (type XV; 0.2%; Sigma), and deoxyribonuclease (type I; 25 μg/ml; Sigma). The partially digested tissue was mechanically disrupted by suction of the tissue into a pipette (100 μl) to free the ganglia, and the suspension was placed on ice and allowed to settle. The pellet was resuspended in enzyme-free Krebs’ solution containing BSA and was allowed to settle again. The supernatant and aliquots of the pellet were placed in a plastic culture dish, and individual ganglia were visualized with a dissecting microscope (Olympus) and harvested by suction into a 20 μl pipette. Ganglia were placed in a culture dish containing maintenance medium (DMEM; GIBCO, Grand Island, NY) supplemented with 10% fetal bovine serum, penicillin (100 U/ml), and streptomycin (100 μg/ml).
Cell culture. Ganglia were plated, under microscopic control, onto sterile poly-l-lysine (100 μg/ml)- and laminin (10 μg/ml)-coated glass coverslips (22 mm2) in petri dishes 35 mm in diameter. Approximately 20 ganglia per coverslip were grown in maintenance medium in a humidified incubator in an atmosphere containing 5% CO2. The antimitotic agent cytosine arabinoside (10 μm; Sigma) was added to the cultures on day 3 to stop non-neuronal cell division. Ganglia were used between 5 and 7 d in culture.
Exposure conditions. Whole-mount preparations and cultures of myenteric ganglia were exposed to glutamate (3 mm), NMDA (100 μm), or kainic acid (300 μm), either alone or in the presence of an antagonist. These concentrations of agonist were chosen because they cause cell death in CNS neurons. Moreover, in preliminary studies, lower concentrations of these agonists did not affect the viability of enteric neurons in whole-mount preparations, using the protocol of this study. The NMDA antagonistd-2-amino-5-phosphonopentanoate (AP-5; 50 μm) was present 10 min before, during, and after exposure to agonist.
Whole-mount preparations of gut were exposed to glutamate or NMDA in Krebs’ solution (60 min). NMDA was prepared in Mg2+-free Krebs’ solution, because it is known that the NMDA receptor is blocked by magnesium. After exposure, the solution was washed out thoroughly, and the preparations were pinned down in silicone–elastomer-coated dishes and cultured for 24–48 hr in DMEM containing streptomycin and penicillin as described above.
Coverslips containing isolated myenteric ganglia were placed in a chamber (Adams and List Associates, Westbury, NY) and mounted on the stage of an inverted microscope. Ganglia were then incubated with agonist-containing media for 60 min (glutamate, NMDA, and kainic acid). Exposure to drugs was performed at room temperature in DMEM. After exposure, the solution was washed out thoroughly and replaced with tissue culture medium before the dishes were returned to the incubator. Little or no cell death [propidium iodide (PI) uptake or formation of apoptotic nuclei] occurred in control tissues if this protocol was used and glutamate was omitted.
Assessment of necrosis. Cell viability was determined (1) before exposure, (2) during exposure, and (3) 24 hr after exposure to drug. Preliminary studies showed that 1 d after exposure to glutamate (or agonist), the process of necrosis was primarily complete. Necrosis was assessed in all experiments by the fluorescent dye PI (Molecular Probes, Eugene, OR), which is excluded from live cells. Cell death in whole mounts of gut was determined using the combination of PI and SYTO-13 (Molecular Probes), a membrane-permeant dye that yields green fluorescent chromatin. Whole mounts of gut were incubated with SYTO-13 (0.5 μm) for 30 min at 37°C, placed on the stage of an inverted microscope, and exposed to glutamate (or NMDA) in the presence of PI (5 μg/ml) for 60 min. SYTO-13-labeled cells were visualized by vertical fluorescence microscopy with a FITC filter set (excitation, 480 ± 15 nm; dichroic, 505 nm; emission, 535 ± 20 nm; Chroma). PI fluorescence was visualized using a rhodamine filter set (excitation, 540 ± 12.5 nm; dichroic, 565 nm; emission, 605 ± 27.5 nm; Chroma). Switching between the two filter sets was done with a computer-controlled filter wheel (Sutter Instruments). An intensified CCD camera (VideoScope International) recorded the fluorescent images. All data acquisition and subsequent image processing were done on a Pentium 100-based computer (Dell) with Metamorph imaging software (Universal Imaging Corporation, West Chester, PA). Images were taken every 5 min for 60 min in the presence of a neutral density filter to minimize photobleaching and phototoxicity. For each image, eight frames were averaged for each of the two excitation wavelengths.
Necrosis and viability in cell cultures were assayed using the combination of PI and fluorescein diacetate (FDA; Molecular Probes). Cultures were incubated (for 30 min) with FDA (15 μg/ml) and exposed to glutamate or kainic acid (300 μm) in the presence of PI, as described above. PI exclusion and FDA uptake and metabolism were used to determine cell viability. Living cells labeled with FDA were visualized with the interference filter set for fluorescein, and nuclei of dead cells were stained with PI and revealed with the rhodamine filter.
PI labeling of glutamate (or agonist)-treated preparations was also determined 24 hr after exposure to drug. PI-labeled cells in glutamate-exposed enteric ganglia were photographed and compared with PI-labeled cells in control preparations. To quantify the amount of cell damage, we digitized the photographic slides of representative ganglia with a slide scanner (SprintScan; Polaroid), and the number of PI-labeled cells per ganglion was determined using Metamorph imaging software.
Assessment of apoptosis. After exposure to glutamate, NMDA, or Krebs’ solution (control), preparations were cultured for 48 hr and fixed with 4% paraformaldehyde (3 hr at room temperature). In both whole mounts of enteric ganglia and cell cultures, apoptosis was characterized by in situ fragmentation of DNA and was determined using a detection kit (ApopTag FITC Kit; Oncor) based on direct immunofluorescence detection of digoxigenin-labeled 3′-OH ends of genomic DNA fragments. The kit was used according to the manufacturer’s instructions. Nonspecific labeling was investigated by omitting terminal deoxynucleotidyl transferase during the first step of the labeling procedure. In some experiments, enteric neurons were first labeled by demonstrating the immunoreactivity of neuron-specific enolase (NSE; see below).
Labeling with rhodamine 123. Mitochondria were stained with rhodamine 123 (R123; 10 μg/ml; Molecular Probes) for 15 min. R123 stains mitochondria selectively by virtue of, and according to, their transmembrane potential (Duchen and Biscoe, 1992). The fluorescence of the dye has been shown to be stable within neurons for >10 hr (Bindokas and Miller, 1995). Images were obtained using standard rhodamine optics, as described above, before and during exposure to kainic acid. Fluorescence intensity was colorized to improve discrimination of intensity values.
Immunocytochemistry. Laminar preparations of gut or isolated myenteric ganglia were fixed for 3 hr with 4% formaldehyde (freshly prepared from paraformaldehyde) in 0.1 m sodium phosphate buffer, pH 7.4, at room temperature and washed 3 times with PBS. To locate proteins in the tissue by immunocytochemistry, we exposed the preparations to PBS containing 0.5% Triton X-100 and 4% horse serum for 30 min to permeabilize the tissue and reduce background staining. Immunoreactivity was then demonstrated by incubating the tissues with affinity-purified rabbit polyclonal antibodies (24–48 hr; 4°C) to GluR1 and GluR2/3 (0.5 μg/ml; Petralia and Wenthold, 1992), EAAC1 (0.06 μg/ml; Rothstein et al., 1993), GluR5/6/7 (Huntley et al., 1993), or NSE (1:3000; Polysciences, Warrington, PA); mouse monoclonal antibodies to calbindin (CBP; 1:100; Sigma) or nonphosphorylated neurofilament H (SMI-32; 1:500; Sternberger Monoclonals); or goat antibodies to calretinin (1:6000; Chemicon, Temecula, CA) (see Table 1). In most experiments, bound antibody was visualized by incubating tissues for 3 hr with indocarbocyanine (Cy3)-labeled or FITC-labeled species-specific secondary antibodies to IgG (diluted 1:4000; Jackson ImmunoResearch, West Grove, PA); however, SMI-32 immunoreactivity was demonstrated with the Elite kit (Vector Laboratories, Burlingame, CA) and visualized with diaminobenzidine (DAB substrate kit; Vector Laboratories). The tissues were washed with PBS and coverslipped with Vectashield (Vector Laboratories). DAB-stained cultures were mounted in glycerol and borate buffer. Control sections were incubated without primary antibody. Cy3 fluorescence was visualized using a Chroma Optical filter set (excitation, 540 ± 12.5 nm; dichroic, 565 nm; emission, 605 ± 27.5 nm).
Table 1.
Primary antisera used
| Antiserum | Host species | Dilution | Source | Demonstration of specificity citations |
|---|---|---|---|---|
| Glutamate | Rabbit | 1:500 | Chemicon, Temecula, CA | Marc et al., 1990; Kalloniatis and Fletcher, 1993 |
| GluR1 | Rabbit | 1.0 μg/ml | Gift of Dr. R. J. Wenthold, NIH | Petralia and Wenthold, 1992; Wenthold et al., 1992; Liu et al., 1997 |
| GluR2/3 | Rabbit | 0.5 μg/ml | Gift of Dr. R. J. Wenthold, NIH | Petralia and Wenthold, 1992; Wenthold et al., 1992;Liu et al., 1997; recognizes both subunit proteins |
| SMI-32 | Mouse | 1:500 | Sternberger Monoclonals Inc., Baltimore, MD | Reacts with a nonphosphorylated epitope in neurofilament H |
| NR1 | Rabbit | 1.0 μg/ml | Gift of Dr. R. J. Wenthold, NIH | Petralia et al., 1994b; directed against the C terminus of the rat NMDAR1 receptor and recognizes four of the eight receptor splice variants |
| NR2A/B | Rabbit | 1.0 μg/ml | Gift of Dr. R. J. Wenthold, NIH | Petralia et al., 1994a; recognizes the A and B subunits of the NMDAR2 receptor |
| EAAC1 | Rabbit | 0.06 μg/ml | Gift of Dr. J. D. Rothstein, Johns Hopkins University | Rothstein et al., 1993; Liu et al., 1997 |
| GluR5/6/7 | Rat | 4 μg/ml | Pharmingen, San Diego, CA | Recognizes common epitope to kainic acid receptor subunits GluR5-7; Chen et al., 1996 |
| Calretinin | Goat | 1:6000 | Chemicon, Temecula, CA | Jacobowitz and Winsky, 1991 |
| Calbindin | Mouse | 1:100 | Sigma, St. Louis, MO | Reacts specifically with calbindin-D (28 kDa) |
Glutamate-immunoreactive structures were identified by immunocytochemistry with rabbit antibodies to glutamate (Marc et al., 1990; Kalloniatis and Fletcher, 1993). Rabbit antisera raised against glutamate conjugated by glutaraldehyde to thyroglobulin were obtained from Chemicon. Tissues were fixed with paraformaldehyde (4.0%) and glutaraldehyde (0.5%) for 1 hr at room temperature. The antibody is specific for glutamate fixed to proteins by glutaraldehyde. Preparations were then placed in sodium cyanoborohydride (1.0% for 30 min), rinsed, and processed by immunocytochemistry as described above. The primary antibody (diluted 1:500–1000) was applied for 24–48 hr at 4°C. Double-label immunocytochemistry was used to examine the coexpression of glutamate and calbindin. It was made possible by using primary antibodies raised in different species. Immunoreactivity was visualized with species-specific secondary antibodies coupled to different fluorophores.
Confocal microscopy. Whole mounts were examined using an LSM 410 Laser Scanning Confocal Microscope (Zeiss, Thornwood, NY) equipped with a krypton/argon laser and attached to a Zeiss Axiovert 100 television microscope. Usually, 5–10 optical sections were taken at 0.5 μm intervals. Images of 512 × 512 pixels were obtained and processed using Adobe Photoshop 3.0 (Adobe Systems, Mountain View, CA) and printed using a Tektronix Phaser 440 printer.
Drugs. Compounds used included (1) glutamic acid from Sigma, (2) AP-5 and NMDA from Tocris Cookson (St. Louis, MO), and (3) kainic acid from Research Biochemicals (Natick, MA).
Statistics. All statistical comparisons were done by one-way ANOVA, followed by Dunnett’s t test (p < 0.05; Statview 4.5).
RESULTS
Glutamate induces necrosis in a subset of enteric neurons
Enteric cells loaded with the membrane-permeant chromatin dye SYTO-13 were exposed to glutamate in the presence of the membrane-impermeant chromatin dye PI, according to the method ofAnkarcrona et al. (1995). Although cells with intact membranes retained the green fluorescence of SYTO-13 and excluded PI, nuclei of cells with damaged membranes were progressively stained by PI and shifted to orange-red because PI gained entry into the nucleus (Fig.1A). Within 10 min of exposure to glutamate, 3.1 ± 0.2 cells in submucosal ganglia took up PI (Fig. 1A). PI-labeled nuclei were large and appeared to belong to neurons. The number of necrotic cells increased with time; however, no further increase occurred after 40 min of exposure to glutamate. At this time, 5.4 ± 0.3 cells/ganglion were stained by PI. In contrast to cells in submucosal ganglia, cells in myenteric ganglia retained the green SYTO-13 color and excluded PI (Fig. 1B). These results demonstrate that during glutamate exposure a subset of submucosal neurons died by necrosis; however, myenteric neurons remained healthy. PI did not stain cells within enteric ganglia in control preparations; however, PI-labeled nuclei were observed in the connective tissue surrounding ganglia (Fig.1A,B). These cells may have been damaged by the dissection.
Fig. 1.
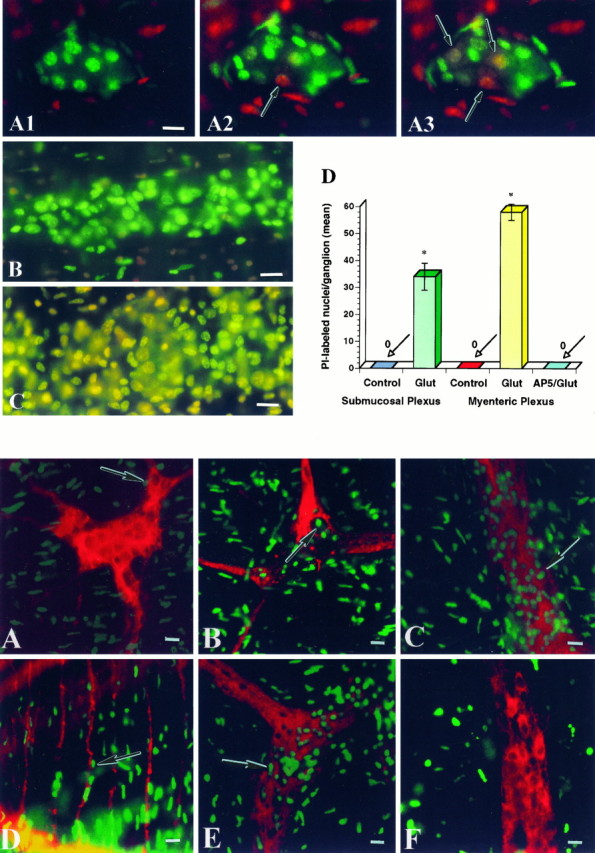
Top. Glutamate induces necrosis in enteric neurons. A, Whole mounts of submucosa were incubated with SYTO-13 to load enteric cells. Preparations were exposed to glutamate in the presence of PI for 60 min. Neurons that died by necrosis progressively exhibited a fluorescence shift fromgreen to yellow to redbecause PI gained entry into the nucleus 1, Control. SYTO-13-labeled nuclei (green) are present within a ganglion. 2, After a 10 min exposure to glutamate (3 mm). 3, After a 30 min exposure to glutamate (3 mm). Three neurons took up PI (arrows).B, Myenteric ganglion after a 30 min exposure to glutamate. Only SYTO-13-labeled cells are present within the ganglion; however, PI-labeled cells are present outside the ganglion.C, Myenteric ganglion exposed to glutamate (60 min) and subsequently reincubated in culture medium for 24 hr. Many SYTO-13-labeled nuclei within the ganglion have taken up PI (shift toward yellow fluorescence). D, Necrosis of enteric cells stimulated by glutamate. Whole mounts of enteric ganglia (n = 10) were exposed to glutamate (Glut; 60 min) and then incubated in culture medium for 24 hr. A significant number of cells underwent necrosis in both enteric plexuses. Necrotic cells include neurons and probably glia. The NMDA antagonist d-2-amino-5-phosphonopentanoate (AP-5) blocked glutamate-induced necrosis. *p < 0.001. Scale bars: A–C, 30 μm.
To investigate whether enteric neurons that survived the early phase of glutamate exposure underwent delayed cell death, we reincubated whole mounts of glutamate-exposed gut in normal medium for 24 hr. Within 24 hr of exposure to 3 mm glutamate, the majority of submucosal and myenteric neurons took up PI, resulting in the yellow fluorescence observed in Figure 1C. The yellow color was produced by the superimposition of the red and green dyes. Both large and small nuclei were double-labeled with SYTO-13 and PI. PI-labeled cells were not found in ganglia in control tissue (Fig.1D); however, nuclei in the serosa and longitudinal muscle were labeled (data not shown). Lower concentrations of glutamate (500 μm–1 mm) did not produce necrosis in submucosal or myenteric neurons using this protocol.
In the CNS, excitotoxicity is mediated, at least in part, by NMDA receptors (Choi et al., 1988). Enteric neurons express both NR1 and NR2A/B subunits and are depolarized by NMDA (Liu et al., 1997); therefore, we examined the ability of the NMDA antagonist AP-5 to antagonize glutamate-induced necrosis in enteric neurons. AP-5 (50 μm) was present before (10 min), during, and after (10 min) the exposure to glutamate (as described above). The preparations were then incubated for 24 hr in culture medium. Necrosis was determined by PI uptake. Treatment of preparations of gut with AP-5 prevented glutamate-induced necrosis (Fig. 1D); therefore, glutamate-mediated neurotoxicity in enteric neurons, as seen in central neurons, is also dependent on events linked to NMDA receptor activation.
Glutamate and NMDA induce apoptosis in enteric neurons
The next set of experiments was performed to determine whether enteric neurons exposed to glutamate underwent delayed cell death by apoptosis. Preparations of bowel were incubated with glutamate, as described above, followed by normal medium for 48 hr. The preparations were then fixed, permeabilized, and stained with the terminal deoxynucleotidyl transferase-mediated dUTP–biotin nick end labeling (TUNEL) method. After exposure to glutamate, cells in submucosal and myenteric ganglia had apoptotic nuclei (Fig.2B,C). Double labeling with antibodies to NSE was used to determine whether neurons were labeled by TUNEL. NSE-immunoreactive nerve cell bodies and fibers were detected in submucosal (Fig.2A,B) and myenteric ganglia (Fig.2C,E,F). A subset of apoptotic nuclei belonged to enteric neurons in both plexuses (Fig.2B,C). Apoptotic nuclei also belonged to non-neuronal cells, including muscle cells in the circular (Fig. 2D) and longitudinal muscle layers and, probably, enteric glia. Apoptotic nuclei of enteric neurons were significantly smaller than were the nuclei of necrotic or normal neurons (p < 0.05; n = 30). The number of apoptotic neurons within enteric ganglia was determined (Fig.3). On average, ∼50 cells were apoptotic in myenteric ganglia (n = 100). No apoptotic cells were detected in enteric ganglia exposed to Krebs’ solution alone. Apoptosis also occurred after exposure of enteric ganglia to NMDA (Figs. 2E, 3). The number of apoptotic cells per ganglion produced by exposure to NMDA was similar to that produced by exposure to glutamate. AP-5 significantly (p < 0.05) blocked NMDA-induced apoptosis (Figs. 2F, 3). AP-5 was present before, during, and after exposure to NMDA.
Fig. 2.
Bottom. Glutamate and NMDA induce apoptosis in enteric neurons. Preparations of gut were exposed to glutamate or NMDA (60 min) and subsequently reincubated in culture medium for 48 hr. A, Submucosal ganglion in a control preparation. NSE (red) immunoreactivity is present in a subset of cell bodies (arrow) and nerve fibers. B–D, Exposure to glutamate induces apoptosis (arrow; green) in submucosal (B) and myenteric (C) NSE-immunoreactive neurons and in cells in the circular muscle layer (D). E, NMDA produces apoptosis in myenteric neurons (arrow). F, The effect of NMDA is blocked by AP-5. Scale bars, 30 μm.
Fig. 3.

Apoptosis of enteric neurons stimulated by glutamate or NMDA. Neuronal apoptosis is produced by exposure to glutamate (or NMDA) in whole-mount preparations of LMMP (n = 10) and in cultured myenteric ganglia (n = 8). Apoptosis is attenuated by AP-5.
Myenteric ganglia in culture
Exposure of whole-mount preparations of gut to glutamate produced cell death in a subset of enteric neurons. Necrosis was observed in submucosal neurons both during and after the exposure to glutamate; however, only delayed death occurred in myenteric neurons. It is well known that excitotoxicity is more pronounced in cell culture (Choi et al., 1987). Many of the difficulties encountered in applying glutamate to intact systems are because of the presence of an avid glutamate transport system. The immunoreactivities of three high-affinity glutamate transporters have been detected in enteric ganglia (Liu et al., 1997). High concentrations of glutamate are required to depolarize enteric neurons, unless glutamate uptake is blocked (Liu et al., 1997). These results suggest that the problems of glutamate uptake may also pertain to whole mounts of the bowel; therefore, we studied the effects of glutamate on neurons from cultured myenteric ganglia.
An average of 11 of 20 myenteric ganglia became attached to the coverslip and began to extend neurites on day 3 in culture. Neurites grew progressively and eventually made contact with neurites from other ganglia. The presence of neuronal cell bodies and nerve fibers was confirmed by the demonstration of calretinin (Fig.4A,B) and calbindin (Fig. 4C) immunoreactivities. Calretinin- and calbindin-immunoreactive neurons were present in isolated ganglia. Calretinin-immunoreactive neurons were abundant (Fig.4A) and were characterized by short, stubby dendrites (Fig. 5B), a feature consistent with Dogiel type I morphology (Costa et al., 1996). A subset of calretinin-immunoreactive neurons migrated away from the ganglia and extended neurites into the periphery (Fig. 4A). Calbindin-immunoreactive neurons were only found within the core of ganglia. These neurons had smooth cell bodies, a feature consistent with Dogiel type II morphology (Furness et al., 1994). Calbindin-immunoreactive processes were rare. The number of calbindin-immunoreactive neurons within a ganglionic core was ∼15 neurons per ganglion (counts from five ganglia). This is less than the number of neurons in intact myenteric ganglia of guinea pig small intestine.
Fig. 4.
Characterization of cultured myenteric neurons.A, B, Calretinin-immunoreactive neurons are numerous in cultured myenteric ganglia. Neurons are characterized by short dendrites (B). C, Calbindin-immunoreactive neurons are also found in cultured myenteric ganglia; however, they have a relatively smooth appearance. Scale bars, 30 μm.
Fig. 5.

Glutamate-immunoreactive neurons are found in cultured myenteric ganglia. A–C, Glutamate immunoreactivity is found in a subset of cell somas and is abundant in varicose processes. Glutamate immunoreactivity appears to be present on spines (C; arrows). D,E, A subset of glutamate-immunoreactive neurons (D; arrow) contains calbindin immunoreactivity (E; arrow).F, A subset of cultured myenteric neurons expresses EAAC1 immunoreactivity. The majority of EAAC1-immunoreactive cells are smooth in shape; however, “star-shaped” EAAC1-immunoreactive cells are also observed (inset). Scale bars, 30 μm.
Cultured myenteric ganglia contain glutamatergic neurons and neurons that express EAAC1 immunoreactivity
If glutamate mediates neurotoxicity in the ENS, then as seen in other sites where excitotoxicity occurs, cultured myenteric ganglia would be expected to contain neurons that can be demonstrated with glutamate-selective antibodies (Marc et al., 1990; van den Pol, 1991). Glutamate-immunoreactive neurons were found in cultured myenteric ganglia (Fig.5A,B,D). All of the glutamate-immunoreactive neurons expressed choline acetyltransferase (ChAT) immunoreactivity (data not shown), and a subset also contained calbindin immunoreactivity (Fig.5D,E). All of the glutamate-immunoreactive neurons exhibited Dogiel type II morphology (Fig. 5A,B,D); nevertheless, only ∼10% of them costored calbindin, which is a marker associated with ∼70% of Dogiel type II myenteric neurons (Costa et al., 1996).
Glutamate-immunoreactive processes were abundant in culture. Processes were highly varicose both within and extending away from ganglia (Fig. 5A–D). Glutamate immunoreactivity was present at sites that appeared to look like spines (Fig. 5C) and at points of contact between neurites (Fig.5A,C). Glutamate immunoreactivity was also enriched in growth cones. Varicose axons occasionally formed baskets around neuronal cell bodies (Fig. 5B).
Cultured myenteric ganglia were immunostained with antibodies against a high affinity glutamate transporter to determine whether an inactivating mechanism is present to terminate the action of glutamate. Four high affinity glutamate transporters have been identified in rat and/or human CNS tissue, including the neuronal subtypes EAAC1 and EAAT4 (Rothstein et al., 1994; Kanai et al., 1995) and the astroglial subtypes GLT-1 and GLAST (Rothstein et al., 1994; Storm-Mathisen et al., 1995). Antibodies to the neuronal transporter EAAC1 (Rothstein et al., 1994) were used to test immunocytochemically the hypothesis that this molecule is present in cultured myenteric ganglia. A subset of enteric neurons was found to be EAAC1 immunoreactive (Fig.5F). These cells were predominantly Dogiel type II, the shape associated with glutamate-immunoreactive neurons (see above); however, smaller, EAAC1-immunoreactive cells were also present (Fig.5F, inset). EAAC1 immunoreactivity was punctate and was found within the cytoplasm and proximal processes of labeled cells. EAAC1-immunoreactive neurites were found within ganglia.
Ionotropic glutamate receptors are found within cultured myenteric ganglia
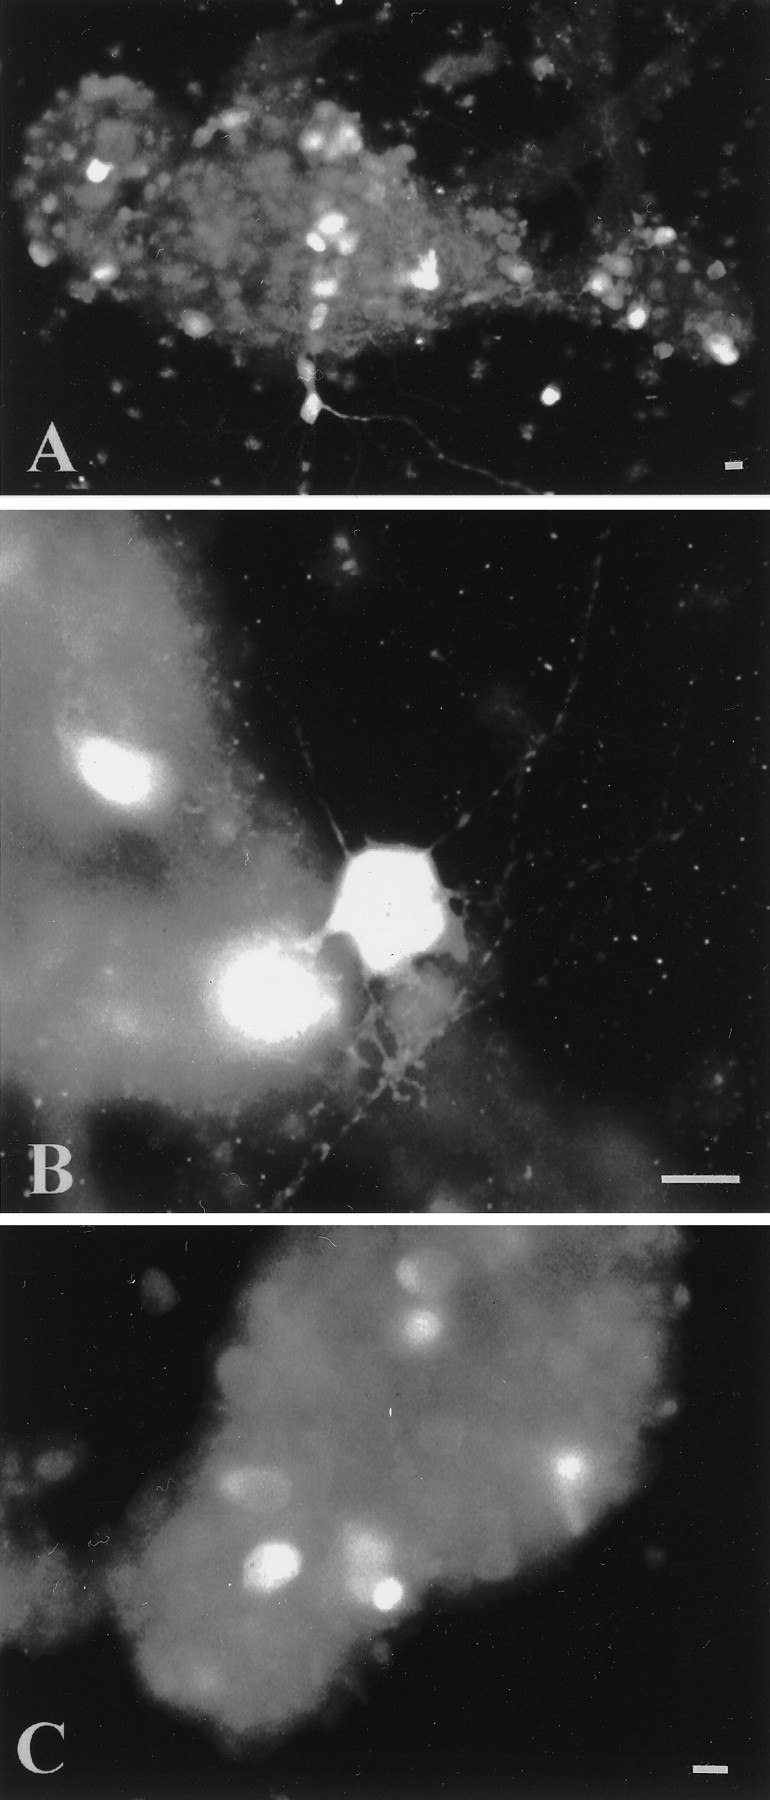
The distribution of NMDA (NR1 and NR2A/B) receptor subunits in isolated myenteric ganglia was examined using subunit specific antibodies (Table 1). NR1 and NR2A/B immunoreactivities were found in cultured ganglia (Fig.6A–C). Immunoreactivity was punctate and found in the soma of the majority of enteric neurons (Fig. 6C). NR1 immunoreactivity was also found in neurites that extended away from cultured ganglia (Fig.6A,B). “Hotspots” of immunoreactivity were present at the sites of intersection between neurites (Fig. 6B), and NR1 immunoreactivity was frequently enriched in growth cones (data not shown).
Fig. 6.

Ionotropic glutamate receptor immunoreactivity is found in cultured myenteric ganglia. A–C, A subset of cultured myenteric neurons express NR1 immunoreactivity. Punctate immunoreactivity is found in the cytoplasm. Moreover, clusters of NR1 immunoreactivity are found along neurites (A,B), near neurite intersections (B;arrow). D, A subset of cultured myenteric neurons express GluR1 immunoreactivity. E,F, A subset of cultured myenteric neurons express GluR2/3 immunoreactivity. Immunostaining is found in the soma and neurites. B, E, F, Confocal photomicrographs. Scale bars, 30 μm.
To compare the localization of other ionotropic glutamate receptor subunits with that of NR1 and NR2A/B, we used antibodies against the AMPA-selective glutamate receptor subunits GluR1 and GluR2/3 (Table 1). The majority of neurons were immunopositive for GluR1 (Fig.6D) and GluR2/3 (Fig.6E,F). GluR2/3-immunoreactive processes were also observed (Fig.6E,F).
Glutamate induces necrosis and apoptosis in cultured myenteric ganglia
In contrast to myenteric neurons in whole-mount preparations, cultured myenteric neurons were extremely sensitive to glutamate exposure. To examine the fate of cultured enteric neurons, we loaded cells with FDA according to the method of Jones and Senft (1985). This procedure is based on the hydrolysis of FDA to fluorescein by nonspecific esterases in the cells. The fluorescein is retained only in cells that have an intact cell membrane. FDA-labeled neurons were visualized with the interference filter set for fluorescein and exposed to glutamate (3 mm) in the presence of PI (for 1 hr).
Before the exposure to glutamate (or in control preparations), FDA-labeled neurons were abundant in cultured ganglia (Fig.7A). Some PI-labeled nuclei were also observed; however, these cells were never labeled with FDA and probably consisted of non-neuronal cells that were killed by cytosine arabinoside. During the exposure to glutamate, cells lost the green fluorescence of FDA, and nuclei of cells with damaged membranes were progressively stained by PI (Fig. 7B) and shifted to orange-red because PI gained entry into the nucleus (Fig.7C). Within 4 min of exposure to glutamate, 10.2 ± 0.4 FDA-labeled cells took up PI. The number of necrotic cells increased with time, and at 22 min, 44.8 ± 3.6 cells were labeled with PI. No further increase in PI-labeled cells was observed. Necrosis was characterized by swelling of the nucleus. In addition, red debris appeared in the culture dish from the cells that had undergone necrosis. In contrast to cells exposed to glutamate, cells incubated with Krebs’ solution retained the green FDA color and excluded PI (data not shown). AP-5 significantly blocked glutamate-induced necrosis in cultured enteric cells (p < 0.05); therefore, at least part of the neurotoxic effects of glutamate on cultured enteric cells is mediated by NMDA receptors.
Fig. 7.

Top. Glutamate induces necrosis in cultured myenteric neurons. Cultured myenteric ganglia were incubated with FDA to label viable enteric cells. Cultures were exposed to glutamate in the presence of PI. Neurons that died by necrosis progressively exhibited a fluorescence shift from green toyellow to red because PI gained entry into the nucleus. A, Control. Numerous FDA-labeled cells (green) are present within a ganglion.B, After a 10 min exposure to glutamate (3 mm). C, After a 30 min exposure to glutamate (3 mm). Many FDA-labeled nuclei within the ganglion have taken up PI (shift toward red fluorescence). Scale bars, 30 μm.
When glutamate-treated isolated ganglia were cultured for 24 hr, apoptotic nuclei were found (Fig. 3). Apoptotic nuclei could be seen among normal cells; therefore, only a subset of cells underwent apoptosis. Unlike excitotoxin-induced necrosis, cells undergoing apoptosis because of glutamate exposure remained adherent to the culture dish with their projections intact.
Kainate receptor subunit immunoreactivity is found in enteric ganglia
Necrosis and apoptosis of central neurons are also mediated by excessive activation of non-NMDA receptors (Choi, 1988). Prolonged stimulation of cultured cerebellar neurons with kainic acid results in swelling of somas and growth of varicosities or blebs, followed by degeneration (Bindokas and Miller, 1995). The hypothesis that kainic acid is an enteric excitotoxin requires that enteric neurons express kainate receptors. Immunocytochemistry was thus used to determine whether evidence of the expression of this receptor could be obtained. Antibodies to the C-terminal portions of kainate receptor subunits GluR5/6/7 were used to identify immunocytochemically the neurons on which these receptor subunits are located (Table 1).
Intense GluR5/6/7 immunoreactivity was present throughout the ENS in rats (Fig. 8A–C). In general, immunolabeling was cytoplasmic, filling the perikarya and, occasionally, the proximal dendrites of a subset of enteric neurons. In addition, the staining intensity of somata varied. Some were very intensely stained; others were more lightly stained. The cytoplasmic localization of kainate receptors in enteric neurons agrees with previous studies that have visualized these receptors in fixed and permeabilized central neurons, using C-terminal antibodies (Huntley et al., 1993). At least part of the internal labeling may represent receptor subunits in synthesis or in transport to and from the cell membrane, similar to the proposals for AMPA-selective glutamate receptor subunits (Wenthold et al., 1990). GluR5/6/7-immunoreactive neurons were only found in submucosal ganglia (Fig.8A,B); however, punctate immunoreactivity was found in both submucosal and myenteric ganglia (Fig. 8A–C). Rings of immunoreactivity were found to circle a subset of myenteric neurons (Fig. 8C). No immunostaining was observed in control preparations incubated without primary antibodies.
Fig. 8.
Middle. GluR5/6/7 immunoreactivity is found in enteric ganglia. A,B, GluR5/6/7-immunoreactive neurons are present in submucosal ganglia. C, GluR5/6/7-immunoreactive varicosities encircle an unlabeled myenteric neuron (★). Scale bars, 30 μm.
Exposure to kainic acid produces blebs on enteric neurites and uncouples mitochondrial membrane potential
The neurotoxic effects of kainic acid on cultured myenteric neurons were investigated to determine whether, as the immunocytochemical data outlined above suggest, these cells express functional kainate receptors. Cultured enteric ganglia were exposed (60 min) to kainic acid, fixed, and processed for the demonstration of SMI-32 immunoreactivity. Stimulation of enteric neurons with kainic acid resulted in the swelling of SMI-32-immunoreactive somas and the growth of varicosities (blebs) along neurites (Fig.9A–C). Blebs formed at various points along neurites that appeared to correspond to neurite intersections (Fig. 9C). Control cultures exposed to Krebs’ solution alone did not develop these morphological changes. SMI-32-immunoreactive neurites in control cultures had varicosities; however, they were uniform in size (Fig. 9D).
Fig. 9.
Bottom. Treatment of cultured myenteric neurons with kainic acid leads to cell swelling, growth of varicosities (blebs), and loss of mitochondrial membrane potential. A–C, Cultured myenteric neurons exposed to kainic acid and immunostained with antibodies to SMI-32. After kainic acid treatment, blebs are found (arrows) on SMI-32-immunoreactive neurites near neurite intersections (C; arrowheads). D, Control. Blebs are not found on SMI-32-immunoreactive neurites in cultures exposed to Krebs’ solution alone. E, Pseudocolored image of R123 intensity. Mitochondria stained with rhodamine 123 (R123) are clustered along neurites, often near neurite intersections (arrow). F–H, Pseudocolored images of R123 staining (arrows) in a neurite before (F), immediately after (G), and 5 min after (H) exposure to kainic acid. Kainic acid causes a collapse of mitochondrial membrane potential as indicated by an increase in fluorescence (G). There is also a more uniform distribution of the dye. Because depolarization is prolonged, there is an eventual loss of the dye (H). Staining intensity is colorized as indicated by the scale. Scale bars, 30 μm.
Mitochondrial function is a critical factor that determines the mode of neuronal death in excitotoxicity (Ankarcrona et al., 1995). Necrosis occurs in cultured CNS neurons in which exposure to glutamate or kainic acid produces a rapid collapse in mitochondrial membrane potential. Apoptosis occurs in neurons that recover energy levels and mitochondrial membrane potential (Ankarcrona et al., 1995; Bindokas and Miller, 1995). In cerebellar granule cells, collapse in mitochondrial membrane potential produced by kainic acid occurs at sites of bleb formation (Bindokas and Miller, 1995); therefore, we determined whether a similar association occurs in enteric neurons. Changes in mitochondrial membrane potential were monitored in individual enteric neurons by determining changes in the intensity of fluorescence of the dye R123. R123 stains mitochondria selectively in accordance with their Nernst potential (Duchen and Biscoe, 1992). Collapse of the mitochondrial potential leads to a release of the dye, an increase in fluorescence, and if stimulation continues, eventual loss of the dye. R123-labeled enteric neurons were exposed to kainic acid, as described above. Images were obtained using standard rhodamine optics, and changes in R123 intensity (mitochondrial membrane potential) were recorded using an intensified CCD camera.
R123-stained mitochondria were abundant in cultured enteric neurons. Mitochondria were enriched in cell somas (data not shown) and nonuniformly distributed along neurites (Fig.9E,F). R123-labeled mitochondria were concentrated at neurite intersections (Fig.9E). Application of kainic acid produced a rapid increase (within 15 sec) in R123 fluorescence, indicating a collapse of mitochondrial membrane potential (Figs.9F,G,10). A change from a punctate to a diffuse staining pattern within neurites was also observed (Fig.9G). R123 fluorescence intensity gradually decreased during the exposure to kainic acid and, within 5 min, returned to baseline values (Figs. 9H, 10). Changes in mitochondrial membrane potential were not observed in control cultures exposed to Krebs’ solution alone. When kainic acid exposed preparations were fixed and processed by immunohistochemistry, SMI-32-immunoreactive blebs were found at sites exhibiting intense R123 fluorescence (data not shown). These results are consistent with the idea that loss of mitochondrial function because of excessive stimulation of kainate receptors is linked with bleb formation in enteric neurons.
Fig. 10.

The results depicted in Figure9F–H are shown graphically. R123 intensity in six boutons (arrows in Fig. 9F) was quantified, background-subtracted, and plotted as a function of time. Application of kainic acid (KA) results in an immediate increase in R123 fluorescence, consistent with a loss of mitochondrial potential; however, as exposure to KA continues, R123 intensity decreases with eventual loss of the dye.
DISCUSSION
Glutamate neurotoxicity was observed in a subset of enteric neurons in both intact preparations of bowel and cultured myenteric ganglia. Both acute and delayed cell deaths were observed. Exposure of whole-mount preparations of submucosa to glutamate resulted, within minutes, in the death of a subset of neurons. Acute necrosis in enteric ganglia was not observed in LMMP preparations; however, exposure to glutamate resulted by the following day in widespread neuronal death in myenteric ganglia. A high concentration of glutamate was needed to produce excitotoxicity in whole-mount preparations of gut. Glutamate neurotoxicity is difficult to study in intact systems because of the presence of rapid glutamate uptake. Even in brain slice preparations, high concentrations of glutamate are required to achieve toxic extracellular concentrations (Garthwaite, 1985). It seems likely that the rapid uptake of glutamate in the bowel, mediated by high affinity glutamate transporters including the EAAC1 transporter, which is expressed not only by glutamatergic neurons but probably also by their follower cells (Liu et al., 1997), masks the actions of exogenous glutamate on enteric neurons, unless either a high concentration of glutamate is applied or the transporter is inhibited. Consistent with this idea, exposure to glutamate produced rapid and widespread neuronal cell loss in cultured myenteric ganglia (see below).
Delayed neuronal cell death in enteric ganglia was prevented by the selective NMDA antagonist AP-5. Furthermore, the neurotoxic effects of glutamate were mimicked by exposure to NMDA. These findings are consistent with the hypothesis that the late phase of neurotoxicity in the ENS is mostly mediated via the activation of the NMDA receptor. NMDA receptors are abundant in the ENS. Virtually all enteric neurons express both NR1 and NR2A/B subunit mRNA and protein (Burns et al., 1994; Burns and Stephens, 1995; Liu et al., 1997). NR1 subunits are required for the functional expression of NMDA receptor channels in CNS neurons; therefore, functional NMDA receptors may be expressed by nearly all types of enteric neuron. The expression of NR1 subunits by the majority of enteric neurons suggests that all types of enteric neuron are susceptible to NMDA excitotoxicity; however, excitotoxicity was observed in only a subset of enteric neurons. NMDA receptors with different physiological and pharmacological properties have been demonstrated; therefore, it is possible that some enteric neurons may express NMDA receptors with different functional properties (such as a low Ca2+ permeability) from other neurons. Inclusion of various NR2 subunits in the NMDA receptor composition is one mechanism for such diversity. Studies have shown that varying the particular NR2 subunit combined with NR1 yields NMDA receptor channels differing in glycine sensitivity and channel deactivation time (Monyer et al., 1992). A full knowledge of NMDA receptor composition in different classes of enteric neuron is needed to understand the vulnerability of certain neurons to NMDA toxicity.
Because excitotoxicity is dependent on calcium influx (Choi, 1995) and NMDA-activated channels are permeable to calcium (MacDermott et al., 1986; Mayer and Westbrook, 1987), it seems likely that activation of enteric NMDA receptors increases [Ca2+]i. Consistent with this idea, glutamate has been found to increase [Ca2+]i in enteric neurons (Kimball and Mulholland, 1995). Moreover, preliminary data indicate that the effects are mimicked by NMDA (Kirchgessner and Liu, 1996).
In addition to necrosis, glutamate exposure produced apoptosis is a subset of enteric neurons. Apoptotic nuclei were observed in both enteric plexuses and in the muscle layers 48 hr after glutamate exposure. Apoptotic nuclei were smaller than the nuclei of necrotic cells, and unlike necrotic neurons, apoptotic neurons expressed NSE immunoreactivity. Blockade of NMDA receptor channels by AP-5 protected neurons from apoptosis, suggesting that Ca2+ influx through these channels was the initial trigger for the delayed apoptotic cell death. The formation of apoptotic nuclei after the exposure to glutamate has been shown to be time and dose dependent (Ankarcrona et al., 1995). Hippocampal neurons undergo apoptosis ∼48 hr after exposure to glutamate (Nitatori et al., 1995). This corresponds well with the time course of development of apoptosis in enteric neurons. Under our conditions, a 60 min exposure to glutamate resulted in apoptosis after a 48 hr incubation in culture medium. At this time, ∼50% of myenteric neurons were apoptotic.
In contrast to whole-mount preparations of gut, cultures of myenteric neurons were shown to be highly susceptible to excitotoxic damage by glutamate. Cultures of myenteric ganglia contained glutamatergic neurons, as do myenteric ganglia in intact preparations of bowel (Liu et al., 1997). In addition, calbindin- and calretinin-immunoreactive neurons were observed, which represent putative sensory neurons and motor neurons, respectively (Furness et al., 1994; Costa et al., 1996). A large subset of myenteric neurons became necrotic during glutamate exposure. Cultured neurons that survived the early phase of excitotoxicity underwent apoptosis within 24 hr. Cells were identified as neurons because they expressed NSE immunoreactivity. It is likely that in cell culture, uptake mechanisms for removing glutamate from the extracellular space are reduced. In isolated retinal neurons, glutamate is 1000 times more potent than it is in slice preparations because it is not cleared by a transport system (Massey and Maguire, 1995). The immunoreactivities of three high affinity glutamate transporters have been detected in enteric ganglia (Liu et al., 1997); therefore, glutamate uptake may limit the effects of glutamate on enteric neurons.
Glutamate-induced necrosis and apoptosis in cultured enteric cells were mimicked by NMDA and blocked by an NMDA antagonist; therefore, in cultured enteric ganglia, glutamate toxicity is also attributed to the overstimulation of the NMDA subtype of receptor. Cultured myenteric neurons expressed both NMDA and non-NMDA receptor immunoreactivity. Immunohistochemical studies indicated a predominantly somatodendritic localization of NMDA- and AMPA-selective glutamate receptors, consistent with a postsynaptic function for receptors composed of these subunits. Enteric glutamate receptors were clustered along neurites. Recent reports have demonstrated that both voltage-sensitive Ca2+ channels and glutamate receptors are spatially clustered on cultured CNS neurons at sites that appear to correlate with the localization of synapses (Craig et al., 1993). In our cultures, clusters of glutamate receptor immunoreactivity were associated with neurite intersections, sites at which synapses are also likely to form.
In CNS neurons, excitotoxicity is also produced by prolonged stimulation of glutamate receptors with kainic acid, an agonist at AMPA and kainate receptors (Kato et al., 1991; Simonian et al., 1996). Like NMDA, kainic acid increases [Ca2+]i(Brorson et al., 1994). Moreover, rises in [Ca2+]i because of kainic acid exposure are associated with the growth of varicosities (blebs) along neurites and a loss of mitochondrial membrane potential (Bindokas and Miller, 1995). We determined whether exposure to kainic acid produces morphological changes and/or disruptions in mitochondrial membrane potential in enteric neurons.
We first determined whether kainate receptor immunoreactivity is found in the ENS using antibodies against kainate-selective subunits, GluR5/6/7. Punctate GluR5/6/7 receptor immunoreactivity was observed in the ENS. GluR5/6/7-immunoreactive neurons were only found in the submucosal plexus; however, GluR5/6/7-immunoreactive varicosities were present in both enteric plexuses. Exposure of cultured myenteric ganglia to kainic acid produced cell swelling and the formation of blebs along neurites. Blebs formed close to neurite intersections, sites that were enriched in mitochondria as revealed by R123 staining. As observed in cerebellar neurons (Bindokas and Miller, 1995), kainic acid produced a collapse in mitochondrial membrane potential in enteric neurons at sites of bleb formation. Whether the blebs were spatially related to points of Ca2+ entry, because of the stimulation of glutamate receptors, needs to be determined.
In summary, our data indicate that excitotoxicity occurs in the ENS. Excitotoxicity consists of necrosis and apoptosis in enteric neurons and seems to be primarily mediated by enteric NMDA receptors. In the CNS, excitotoxicity is involved in the injury produced by hypoxia and ischemia (Choi, 1988). Both conditions are associated with a buildup of extracellular glutamate, an increase in [Ca2+]i, and the generation of nitric oxide (Dawson et al., 1991; Izumi et al., 1992). Hypoxic and ischemic damage occur in peripheral tissues. Intestinal mucosal damage has been reported after intestinal hypoxia and ischemia (Matthews et al., 1995) and may similarly involve excessive activation of glutamate receptors. Excitotoxins are also present in food and may cause gastrointestinal dysfunction (Perl et al., 1990; Olney, 1994). The most dramatic example of acute excitotoxin poisoning is the toxic syndrome associated with the ingestion of domoic acid, a contaminant found in mussels. “Shellfish poisoning,” which is caused by the ingestion of mussels contaminated by domoic acid, a potent ionotropic non-NMDA receptor agonist, is characterized by severe gastrointestinal symptoms (nausea, vomiting, and diarrhea), profuse respiratory secretions, seizures, and ultimately death (Perl et al., 1990). The evidence described here suggests that glutamate may indeed have a functional role in the ENS; therefore, enteric glutamate receptors may have pharmacological importance as targets for drug actions.
Footnotes
This work was supported by National Institutes of Health Grants NS 01582 and NS 35951 (A.L.K.). We are especially grateful to Drs. J. D. Rothstein (Johns Hopkins University) and R. J. Wenthold (National Institutes of Health) for their generous contribution of antibodies. We thank Theresa Swayne for assistance with confocal microscopy.
Correspondence should be addressed to Dr. Annette Kirchgessner, Department of Anatomy and Cell Biology, Columbia University, College of Physicians and Surgeons, 630 West 168th Street, New York, NY 10032.
REFERENCES
- 1.Ankarcrona M, Dypbukt JM, Bonfoco E, Zhivotovsky B, Orrenius S, Lipton SA, Nicotera P. Glutamate-induced neuronal death: a succession of necrosis or apoptosis depending on mitochondrial function. Neuron. 1995;15:961–973. doi: 10.1016/0896-6273(95)90186-8. [DOI] [PubMed] [Google Scholar]
- 2.Bindokas PV, Miller RJ. Excitotoxic degeneration is initiated at non-random sites in cultured rat cerebellar neurons. J Neurosci. 1995;15:6999–7011. doi: 10.1523/JNEUROSCI.15-11-06999.1995. [DOI] [PMC free article] [PubMed] [Google Scholar]
- 3.Brorson JR, Manzolillo PA, Miller RJ. Ca2+ entry via AMPA/KA receptors and excitotoxicity in cultured cerebellar Purkinje cells. J Neurosci. 1994;14:187–197. doi: 10.1523/JNEUROSCI.14-01-00187.1994. [DOI] [PMC free article] [PubMed] [Google Scholar]
- 4.Burns GA, Stephens KE. Expression of mRNA for the N-methyl-d-aspartate (NMDAR1) receptor and vasoactive intestinal polypeptide (VIP) co-exist in enteric neurons of the rat. J Auton Nerv Syst. 1995;55:207–210. doi: 10.1016/0165-1838(95)00043-w. [DOI] [PubMed] [Google Scholar]
- 5.Burns GA, Stephens KE, Benson JA. Expression of mRNA for the N-methyl-d-aspartate (NMDAR1) receptor by the enteric neurons of the rat. Neurosci Lett. 1994;170:87–90. doi: 10.1016/0304-3940(94)90245-3. [DOI] [PubMed] [Google Scholar]
- 6.Chen Q, Veenman CL, Reiner A. Cellular expression of ionotropic glutamate receptor subunits on specific striatal neuron types and its implication for striatal vulnerability in glutamate receptor-mediated excitotoxicity. Neuroscience. 1996;73:715–731. doi: 10.1016/0306-4522(96)00011-5. [DOI] [PubMed] [Google Scholar]
- 7.Choi DW. Glutamate neurotoxicity and diseases of the nervous system. Neuron. 1988;1:623–634. doi: 10.1016/0896-6273(88)90162-6. [DOI] [PubMed] [Google Scholar]
- 8.Choi DW. Excitotoxic cell death. J Neurobiol. 1992;23:1261–1276. doi: 10.1002/neu.480230915. [DOI] [PubMed] [Google Scholar]
- 9.Choi DW. Calcium: still center-stage in hypoxic-ischemic neuronal cell death. Trends Neurosci. 1995;18:58–60. [PubMed] [Google Scholar]
- 10.Choi DW, Maulucci-Gedde MA, Kriegstein AR. Glutamate neurotoxicity in cortical cell culture. J Neurosci. 1987;7:357–368. doi: 10.1523/JNEUROSCI.07-02-00357.1987. [DOI] [PMC free article] [PubMed] [Google Scholar]
- 11.Choi DW, Koh J-Y, Peters S. Pharmacology of glutamate neurotoxicity in cortical cell culture: attenuation by NMDA antagonists. J Neurosci. 1988;8:185–196. doi: 10.1523/JNEUROSCI.08-01-00185.1988. [DOI] [PMC free article] [PubMed] [Google Scholar]
- 12.Costa M, Brookes SJH, Steele PA, Gibbins I, Burcher E, Kandiah CJ. Neurochemical classification of myenteric neurons in the guinea-pig ileum. Neuroscience. 1996;75:949–967. doi: 10.1016/0306-4522(96)00275-8. [DOI] [PubMed] [Google Scholar]
- 13.Craig AM, Blackstone CD, Huganir RL, Banker G. The distribution of glutamate receptors in cultured rat hippocampal neurons: postsynaptic clustering of AMPA-selective subunits. Neuron. 1993;10:1055–1068. doi: 10.1016/0896-6273(93)90054-u. [DOI] [PubMed] [Google Scholar]
- 14.Dawson VL, Dawson TM, London ED, Bredt DS, Snyder S. Nitric oxide mediates glutamate neurotoxicity in primary cortical cultures. Proc Natl Acad Sci USA. 1991;88:6368–6371. doi: 10.1073/pnas.88.14.6368. [DOI] [PMC free article] [PubMed] [Google Scholar]
- 15.Duchen MR, Biscoe TJ. Relative mitochondrial membrane potential and [Ca2+]i in type I cells isolated from the rabbit carotid body. J Physiol (Lond) 1992;450:33–61. doi: 10.1113/jphysiol.1992.sp019115. [DOI] [PMC free article] [PubMed] [Google Scholar]
- 16.Furness JB, Bornstein JC, Pompolo S, Young HM, Kunze WAA, Kelly H. The circuitry of the enteric nervous system. Neurogastroenterol Motil. 1994;6:241–253. [Google Scholar]
- 17.Garthwaite J. Cellular uptake disguises action of l-glutamate on N-methyl-d-aspartate receptors. With an appendix: diffusion of transported amino acids into brain slices. Br J Pharmacol. 1985;85:297–307. doi: 10.1111/j.1476-5381.1985.tb08860.x. [DOI] [PMC free article] [PubMed] [Google Scholar]
- 18.Hollmann M, Hartley M, Heinemann S. Ca2+ permeability of KA-AMPA-gated glutamate receptor channels depends on subunit composition. Science. 1991;252:851–854. doi: 10.1126/science.1709304. [DOI] [PubMed] [Google Scholar]
- 19.Huntley GW, Rogers SW, Moran T, Janssen W, Archin N, Vickers JC, Cauley K, Heinemann SF, Morrison JH. Selective distribution of kainate receptor subunit immunoreactivity in monkey neocortex revealed by a monoclonal antibody that recognizes glutamate receptor subunits GluR5/6/7. J Neurosci. 1993;13:2965–2981. doi: 10.1523/JNEUROSCI.13-07-02965.1993. [DOI] [PMC free article] [PubMed] [Google Scholar]
- 20.Izumi Y, Benz AM, Clifford DB, Zorumski CF. Nitric oxide inhibitors attenuate N-methyl-d-aspartate excitotoxicity in rat hippocampal slices. Neurosci Lett. 1992;135:227–230. doi: 10.1016/0304-3940(92)90442-a. [DOI] [PubMed] [Google Scholar]
- 21.Jacobowitz DM, Winsky L. Immunocytochemical localization of calretinin in the forebrain of the rat. J Comp Neurol. 1991;304:198–218. doi: 10.1002/cne.903040205. [DOI] [PubMed] [Google Scholar]
- 22.Jones KH, Senft JA. An improved method to determine cell viability by simultaneous staining with fluorescein diacetate-propidium iodide. J Histochem Cytochem. 1985;33:77–79. doi: 10.1177/33.1.2578146. [DOI] [PubMed] [Google Scholar]
- 23.Kalloniatis M, Fletcher EL. Immunocytochemical localization of the amino acid neurotransmitters in the chicken retina. J Comp Neurol. 1993;336:174–193. doi: 10.1002/cne.903360203. [DOI] [PubMed] [Google Scholar]
- 24.Kanai Y, Bhide PG, DiFiglia M, Hediger MA. Neuronal high affinity glutamate transport in the rat central nervous system. NeuroReport. 1995;6:2357–2362. doi: 10.1097/00001756-199511270-00020. [DOI] [PubMed] [Google Scholar]
- 25.Kato K, Puttfarcken P, Lyons W, Coyle J. The developmental time course and ionic dependence of kainate mediated toxicity in rat cerebellar granule cell cultures. J Pharmacol Exp Ther. 1991;256:402–411. [PubMed] [Google Scholar]
- 26.Kimball BC, Mulholland MW. Neuroligands evoke calcium signalling in cultured myenteric neurons. Surgery. 1995;118:162–169. doi: 10.1016/s0039-6060(05)80319-8. [DOI] [PubMed] [Google Scholar]
- 27.Kirchgessner AL, Gershon MD. Projections of submucosal neurons to the myenteric plexus of the guinea pig intestine: in vitro tracing of microcircuits by retrograde and anterograde transport. J Comp Neurol. 1988;277:487–498. doi: 10.1002/cne.902770403. [DOI] [PubMed] [Google Scholar]
- 28.Kirchgessner AL, Liu M-T. Glutamatergic neurotransmission in the enteric nervous system. Gastroenterology. 1996;110:A695. [Google Scholar]
- 29.Liu M-T, Rothstein JD, Gershon MD, Kirchgessner AL. Glutamatergic enteric neurons. J Neurosci. 1997;17:4764–4784. doi: 10.1523/JNEUROSCI.17-12-04764.1997. [DOI] [PMC free article] [PubMed] [Google Scholar]
- 30.MacDermott AB, Mayer ML, Westbrook GL, Smith SJ, Barker JL. NMDA-receptor activation increases cytoplasmic calcium concentration in cultured spinal neurones. Nature. 1986;321:519–522. doi: 10.1038/321519a0. [DOI] [PubMed] [Google Scholar]
- 31.Marc RE, Liu W-L, Kalloniatis M, Raiguel SF, Haesendock E. Patterns of glutamate immunoreactivity in the goldfish retina. J Neurosci. 1990;10:4006–4034. doi: 10.1523/JNEUROSCI.10-12-04006.1990. [DOI] [PMC free article] [PubMed] [Google Scholar]
- 32.Massey SC, Maguire G. The role of glutamate in retinal circuitry. In: Wheal H, Thomson A, editors. Excitatory amino acids and synaptic transmission. Academic; New York: 1995. pp. 201–221. [Google Scholar]
- 33.Matthews JB, Tally KJ, Smith JA, Zeind AJ, Hrnjez BJ. Activation of Cl secretion during chemical hypoxia by endogenous release of adenosine in intestinal epithelial monolayers. J Clin Invest. 1995;96:117–125. doi: 10.1172/JCI118010. [DOI] [PMC free article] [PubMed] [Google Scholar]
- 34.Mayer ML, Westbrook GL. The physiology of excitatory amino acids in the vertebrate central nervous system. Prog Neurobiol. 1987;28:197–276. doi: 10.1016/0301-0082(87)90011-6. [DOI] [PubMed] [Google Scholar]
- 35.Monyer H, Sprengel R, Schoepfer R, Herb A, Higuchi M, Lomeli H, Burnashev N, Sakmann B, Seeburg PH. Heteromeric NMDA receptors: molecular and functional distinction of subtypes. Science. 1992;256:1217–1221. doi: 10.1126/science.256.5060.1217. [DOI] [PubMed] [Google Scholar]
- 36.Nitatori T, Sato N, Waguri S, Karasawa Y, Araki H, Shibanai K, Kominami E, Uchiyama Y. Delayed neuronal death in the CA1 pyramidal cell layer of the gerbil hippocampus following transient ischemia is apoptosis. J Neurosci. 1995;15:1001–1011. doi: 10.1523/JNEUROSCI.15-02-01001.1995. [DOI] [PMC free article] [PubMed] [Google Scholar]
- 37.Olney JW. Excitotoxins in foods. Neurotoxicology. 1994;15:535–544. [PubMed] [Google Scholar]
- 38.Olney JW. Excitotoxins in foods. Neurotoxicology. 1994;15:535–544. [PubMed] [Google Scholar]
- 39.Perl TM, Bedard L, Kosatsky T, Hockin JC, Todd ECD, Remis RSN. An outbreak of toxic encephalopathy caused by eating mussels contaminated with domoic acid. N Eng J Med. 1990;322:1775–1780. doi: 10.1056/NEJM199006213222504. [DOI] [PubMed] [Google Scholar]
- 40.Petralia RS, Wenthold RJ. Light and electron immunocytochemical localization of AMPA-selective glutamate receptors in the rat brain. J Comp Neurol. 1992;318:329–354. doi: 10.1002/cne.903180309. [DOI] [PubMed] [Google Scholar]
- 41.Petralia RS, Yokotani N, Wenthold RJ. Light and electron microscopic distribution of the NMDA receptor subunit NMDAR1 in the rat nervous system using a selective anti-peptide antibody. J Neurosci. 1994a;14:667–696. doi: 10.1523/JNEUROSCI.14-02-00667.1994. [DOI] [PMC free article] [PubMed] [Google Scholar]
- 42.Petralia RS, Wang Y-X, Wenthold RJ. The NMDA receptor subunits NR2A and NR2B show histological and ultrastructural localization patterns similar to those of NR1. J Neurosci. 1994b;14:6102–6120. doi: 10.1523/JNEUROSCI.14-10-06102.1994. [DOI] [PMC free article] [PubMed] [Google Scholar]
- 43.Rhoads JM, Argenzio RA, Chen W, Gomez GG. Asparagine stimulates piglet intestinal Cl− secretion by a mechanism requiring a submucosal glutamate receptor and nitric oxide. J Pharmacol Exp Ther. 1995;274:404–412. [PubMed] [Google Scholar]
- 44.Rothstein JD, Martin L, Levey AI, Dykes-Hoberg M, Jin L, Wu D, Nash N, Kuncl RW. Localization of neuronal and glial glutamate transporters. Neuron. 1993;13:713–725. doi: 10.1016/0896-6273(94)90038-8. [DOI] [PubMed] [Google Scholar]
- 45.Rothstein JD, Martin L, Levey AI, Dykes-Hoberg M, Jin L, Wu D, Nash N, Kuncl RW. Localization of neuronal and glial glutamate transporters. Neuron. 1994;13:713–725. doi: 10.1016/0896-6273(94)90038-8. [DOI] [PubMed] [Google Scholar]
- 46.Shannon HE, Sawyer BD. Glutamate receptors of the N-methyl-d-aspartate subtype in the myenteric plexus of the guinea pig ileum. J Pharmacol Exp Ther. 1989;251:518–523. [PubMed] [Google Scholar]
- 47.Simonian NA, Getz RL, Leveque JC, Konradi C, Coyle JT. Kainate induces apoptosis in neurons. Neuroscience. 1996;74:675–683. doi: 10.1016/0306-4522(96)00141-8. [DOI] [PubMed] [Google Scholar]
- 48.Storm-Mathisen J, Danbolt NC, Ottersen OP. Localization of glutamate and its membrane transport proteins. In: Stone TW, editor. CNS neurotransmitters and neuromodulators: glutamate. CRC; New York: 1995. pp. 1–18. [Google Scholar]
- 49.Tymianski M, Wallace MC, Spigelman I, Uno M, Carlen PL, Tator CH, Charlton MP. Cell-permeant Ca2+ chelators reduce early excitotoxic and ischemic neuronal injury in vitro and in vivo. Neuron. 1993;11:221–235. doi: 10.1016/0896-6273(93)90180-y. [DOI] [PubMed] [Google Scholar]
- 50.van den Pol AN. Glutamate and aspartate immunoreactivity in hypothalamic presynaptic axons. J Neurosci. 1991;11:2087–2101. doi: 10.1523/JNEUROSCI.11-07-02087.1991. [DOI] [PMC free article] [PubMed] [Google Scholar]
- 51.Wenthold RJ, Altschuler RA, Hampson DR. Immunocytochemistry of neurotransmitter receptors. J Electron Microsc Tech. 1990;15:81–96. doi: 10.1002/jemt.1060150108. [DOI] [PubMed] [Google Scholar]
- 52.Wenthold RJ, Yokotani N, Doi K, Wada K. Immunohistochemical characterization of the non-NMDA glutamate receptor using subunit-specific antibodies. Evidence for a hetero-oligomeric structure in rat brain. J Biol Chem. 1992;267:501–507. [PubMed] [Google Scholar]
- 53.Wiley JW, Lu Y, Owyang C. Evidence for a glutamatergic neural pathway in the myenteric plexus. Am J Physiol. 1991;261:G693–G700. doi: 10.1152/ajpgi.1991.261.4.G693. [DOI] [PubMed] [Google Scholar]
- 54.Yau WM, Dorsett JA, Parr EL. Characterization of acetylcholine release from enzyme-dissociated myenteric ganglia. Am J Physiol. 1989;256:G233–G239. doi: 10.1152/ajpgi.1989.256.1.G233. [DOI] [PubMed] [Google Scholar]