Abstract
Hair cells of inner ear organs sensitive to frequencies above 10 Hz adapt to maintained hair bundle deflections at rates that reduce their responses to lower frequencies. Mammalian vestibular organs detect head movements at frequencies well below 10 Hz. We asked whether hair cells of the mouse utricle adapt, and if so, whether the adaptation was similar to that in higher frequency organs such as the frog saccule.
Whole-cell transduction currents were recorded from hair cells in the epithelium of the mouse utricle. Hair bundles were deflected by a fluid jet or a stiff probe. The transduction currents evoked by step deflections adapted over 10–100 msec. The mean operating range was 1.5 μm (deflection of the tip of the bundle), approximately threefold larger than in frog saccule. Taller and more compact bundles of the mouse utricle account for this difference. As in frog saccular hair cells, adaptation shifted the current–deflection (I(X)) relation along the deflection axis. These adaptive shifts had time constants of 10–20 msec and reached 60–80% of stimulus amplitude. The adaptive shift and voltage-dependent bundle movement are consistent with the motor model of adaptation. When the fluid jet was used, adaptation also broadened the I(X) relation and reduced the maximum current.
Adaptation attenuated the transduction currents evoked by sinusoidal bundle deflections below 5 Hz, within the frequency range of the utricle, but because it was incomplete, substantial responses remained. Moreover, the adaptive shift mechanism preserves sensitivity even in the presence of large stimuli that would otherwise saturate transduction.
Keywords: hair cell, utricle, mechanoelectrical transduction, adaptation, inner ear, vestibular
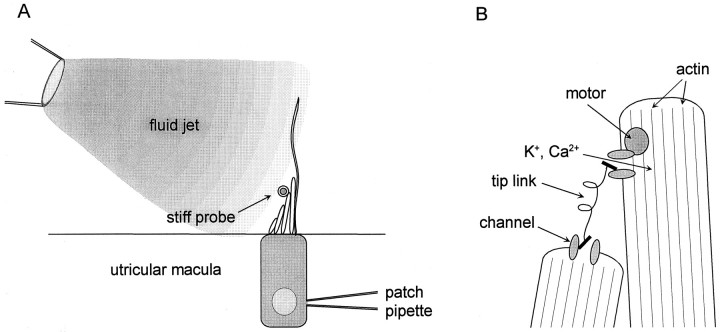
In sensory hair cells of the vertebrate inner ear (Fig. 1), deflection of the hair bundle modulates current flow through mechanoelectrical transduction channels, generating a receptor potential. Bundle deflection is believed to gate the transduction channels by changing the tension in tip links, which connect adjacent stereocilia (Fig.1B). With a maintained deflection, the response in many types of hair cell adapts: the transduction current decays with a time constant of tens of milliseconds (Eatock et al., 1987; Kimitsuki and Ohmori, 1992; Kros et al., 1992).
Fig. 1.
Schematic diagrams of experimental configuration and model of transduction. A, Mouse utricular hair cells were recorded from in the intact epithelium. Hair bundles comprise several rows of stereocilia and a single kinocilium. On average, bundles were 13 μm tall at the tip of the tallest stereocilia. The kinocilia were often 20–30 μm long and lacked a kinociliary bulb. There were ∼60 stereocilia per bundle. The fluid jet was positioned ∼50 μm from the hair bundle. For some experiments a stiff glass probe, positioned near the tip of the stereocilia on the tapered side, was used to deflect the bundle. In this view the stiff glass probe is aligned perpendicular to the plane of the image. B, Expanded view of the tips of two stereocilia showing the transduction elements as envisioned in the motor model of adaptation. This model is based on work from other types of hair cells (for review, see Corey and Assad, 1992; Hudspeth and Gillespie, 1994).
Experiments in frog saccular hair cells have suggested an adaptation mechanism in which an active motor element in the stereocilium moves the upper attachment point of the tip link to adjust its tension (Fig. 1B) (Howard and Hudspeth, 1987). The motor slips if tension is too great or climbs if tension is relaxed. Calcium that enters the stereocilia via transduction channels affects the adaptation rate and the resting tension by changing the climbing and slipping rates of the motor (Assad and Corey, 1992). Experiments in the turtle cochlea led to a different model of hair cell adaptation in which calcium entering through transduction channels binds to an intracellular site to stabilize a closed state of the channel (Crawford et al., 1991). In both models the change in intrastereociliary Ca2+ during a deflection mediates adaptation. Both models predict a shift of the current–deflection (I(X)) relation of the hair cell in the direction of the conditioning stimulus, but the model of Crawford et al. (1991) predicts that adaptation will change the steepness of theI(X) relation.
The adaptive shift restores sensitivity in the presence of large low-frequency stimuli, but at the cost of attenuating responses below ∼10 Hz. The natural frequency ranges of both the turtle cochlea and the frog saccule, a vibration detector, are above 10 Hz (Crawford and Fettiplace, 1980; Koyama et al., 1982). We asked whether adaptation occurs at the same rate in vestibular organs that detect steady head position and head movements at frequencies well below 10 Hz (Wilson and Melvill Jones, 1979).
We used an excised preparation of the mouse utricle (Rüsch and Eatock, 1996b), an organ sensitive to low-frequency linear accelerations and head tilt (Fernandez and Goldberg, 1976a,b; Goldberg et al., 1990). Whole-cell recordings were taken from type II and neonatal hair cells in the epithelium. Bundles were deflected by a fluid jet or a stiff probe. In contrast to a recent study on a similar preparation (Géléoc et al., 1997), we saw robust adaptation at rates like those in the frog saccule and turtle cochlea. When the stiff probe was used, the adaptation matched the predictions of the motor model. Fluid-jet stimuli evoked additional effects, suggesting that adaptation is more complex when the bundle is not constrained by a stiff probe. Recordings of transduction currents and receptor potentials in response to sinusoidal stimuli confirmed that adaptation attenuated responses in the effective frequency range for the utricle, but showed that the residual response was substantial.
MATERIALS AND METHODS
Tissue preparation. As described by Rüsch and Eatock (1996b), utricles were excised from young mice [postnatal day (P) 1–10; birth = P0; CDR outbred strain; timed pregnant females obtained from Charles River, Wilmington, MA]. The animals were killed by cervical dislocation and decapitated. Dissection of the utricles was performed in our standard external solution containing (in mm): 144 NaCl, 0.7 NaH2PO4, 5.8 KCl, 1.3 CaCl2, 0.9 MgCl2, 5.6 d-glucose, 10 HEPES-NaOH, vitamins and amino acids as in Eagle’s MEM, at pH 7.4, and 320 mmol kg−1. The otic capsule was opened medially, and the endolymphatic compartment of the utricle was cut open. The tissue was bathed for 20 min in standard external solution to which protease XXVII (Sigma, St. Louis, MO) had been added (100 μg/ml, 22–25°C). The otolithic membrane was then removed, the utricle was excised, and the nerve fibers were trimmed close to the epithelium. The epithelium was mounted in an experimental chamber on the stage of a fixed-stage upright microscope (Axioskop FS; Zeiss, Oberkochen, Germany) and viewed with either a 40× or a 100× water-immersion objective with differential interference contrast (DIC) optics.
Recording. The experimental chamber contained the standard extracellular solution. Recording pipettes contained (in mm): 140 KCl, 0.1 CaCl2, 5 EGTA-KOH, 3.5 MgCl2, 2.5 MgATP, 5 HEPES-KOH, at pH 7.4, and 290 mmol kg−1. Pipette resistance was 3–5 MΩ. Approximately 50 μm from the hair cell of interest, the pipette was lowered into the epithelium down to the nuclear layer and advanced toward the hair cell while positive pressure was maintained (Fig.1A). After the pipette contacted the hair cell, positive pressure was released, and a seal formed. Recordings were done in the ruptured-patch configuration of the whole-cell technique, in voltage-clamp or current-clamp mode (Hamill et al., 1981), using an Axopatch 200A patch-clamp amplifier (Axon Instruments, Foster City, CA). Currents were filtered with an eight-pole Bessel filter (Model 902, Frequency Devices, Haverhill, MA), digitized at ≥2× the corresponding filter frequency using a 12-bit acquisition board (Digidata 1200) and pClamp 6.0 software (Axon Instruments) and stored on disk. Recordings were obtained at room temperature (22–25°C) from hair cells in various regions of the epithelium. Voltages have been corrected for a liquid junction potential of −4 mV. Analysis and fits were performed with the program “Origin” (Microcal Software, Northampton, MA), which uses a Levenberg–Marquardt least-squares fitting algorithm. Results are presented as means ± SEM.
Stimulation. Most experiments were performed with a fluid-jet stimulus (Fig. 1A) controlled by a fast pressure-clamp system (Denk and Webb, 1992; McBride and Hamill, 1995). Stimulus pipettes were pulled to a tip diameter of ∼10 μm, filled with the standard extracellular solution, and mounted in a pipette holder. The input port on the holder was connected to a chamber fed by pressure and vacuum lines via piezoelectric valves that were driven by an electronic controller. A pressure transducer in the mixing chamber provided feedback to the controller. The gain of the controller was adjusted to provide the fastest step response possible without ringing. The mean rise time was 2.6 ± 0.2 msec (n = 10). Stimuli were steps and sinusoidal bursts, originating in pClamp 6.0 software, converted to an analog signal by the Digidata 1200 and fed to the electronic controller of the pressure clamp. During whole-cell recordings, the output of the pressure transducer in the pressure/suction mixing chamber was stored in one channel. Control experiments confirmed that the pressure-clamp stimulus was well behaved. Each of the pressure stimulus protocols used to deflect hair bundles was tested on a flexible glass fiber. Motion of the fiber was monitored by projecting its image onto the edge of a photodiode. Over the range of stimulus levels used in these experiments, the output of the photodiode was a linear function of pressure or suction (r = 0.996) and closely followed the pressure waveform with a 1–2 msec delay.
In some experiments, the stimulus was effected by a stiff glass probe mounted on a one-dimensional piezoelectric bimorph element (Corey and Hudspeth, 1980). The probe was brought into contact with the hair bundle, near the tip of the tallest row of stereocilia (Fig.1A). In these experiments the analog voltage output of the Digidata 1200 was low-pass-filtered at 400 Hz (eight-pole Bessel filter) and fed directly to the piezoelectric element. We did not correct for creep in the bimorph (Corey and Hudspeth, 1980), but using a photodiode monitor we found it to be <4% of the stimulus amplitude.
For both kinds of stimulus, the motion was approximately aligned with the hair bundle’s orientation axis, defined as the axis of maximum sensitivity (Shotwell et al., 1981). Positive motion indicates deflection toward the kinocilium. The correct stimulus alignment was achieved by rotating the microscope stage or the coverglass on which the preparation was mounted.
Hair bundle deflections were monitored with a Newvicon video camera (Model NC-65; Dage-MTI, Michigan City, IN) and recorded on S-VHS videotape. Deflections were measured offline directly from the video image (at 5000×) or by computer using Metamorph software (Universal Imaging, West Chester, PA). We found bundle position to be constant during a 500 msec pressure step. However, because our temporal resolution was limited to video frame rates (one image/33 msec), we could not resolve rapid changes in bundle position, such as the relaxation associated with adaptation reported by Howard and Hudspeth (1987). The relaxation they observed results from a decrease in bundle stiffness. To test for stimulus-induced changes in bundle stiffness we used a two-step protocol: the bundle was first deflected by a 500 msec positive-pressure step, and then an identical step was superimposed. The deflection evoked by the second step was identical to the deflection evoked by the first step, showing that the first step did not induce a significant change in bundle stiffness.
Over the range of pressure steps that we used, the relation between the output of the pressure transducer and bundle deflection was linear. For each cell, the slope of this relation was measured and then used to calibrate the output of the pressure monitor for the entire recording. The stimulus traces shown are the output of the pressure monitor calibrated by this method. For cells stimulated by a stiff probe, bundle position was assumed to be the same as the probe position measured from the video image.
Cell identification. Isolated mature vestibular hair cells can be identified morphologically in the light microscope as type I or II by the presence or absence, respectively, of a constriction (neck) below the cuticular plate (Wersäll, 1956; Correia et al., 1989). In the intact epithelial preparation used here, however, the direction of view is parallel to the long axis of the cells, so that a neck is difficult to recognize. Therefore, hair cells from which recordings were obtained were classified according to whether they expressed a delayed rectifier K+ conductance,gK,L, which activates at unusually negative voltages (Rüsch and Eatock, 1996b).gK,L was identified as a conductance that was active at the holding potential of −64 mV, had a reversal potential near the potassium equilibrium potential, and deactivated with hyperpolarization. In mature vestibular organs, including the mouse utricle, hair cells with gK,L are type I cells, and hair cells without gK,L are type II cells (Correia and Lang, 1990; Ricci et al., 1996; Rüsch and Eatock, 1996b). gK,L is acquired by type I cells in the mouse utricle between P3 and P7 (A. Rüsch, A. Lysakowski, and R. A. Eatock, unpublished observations). Before P3, no cells express it, and by P7, ∼60% of hair cells express it, an incidence that remains stable to maturity. For the present study, cells were classified as type II hair cells if they lackedgK,L and were from animals P7 or older. In younger organs, cells that lacked gK,L could not be classified, because they may have been either type II cells or immature type I cells that had not yet acquiredgK,L. The data presented here are from 58 cells that lacked gK,L: 17 type II cells (P ≥ 7) and 41 cells that were not classified (P1–P6). The transduction data from the two groups were indistinguishable and have been pooled. No data from mature type I cells are presented.
RESULTS
General features of transduction
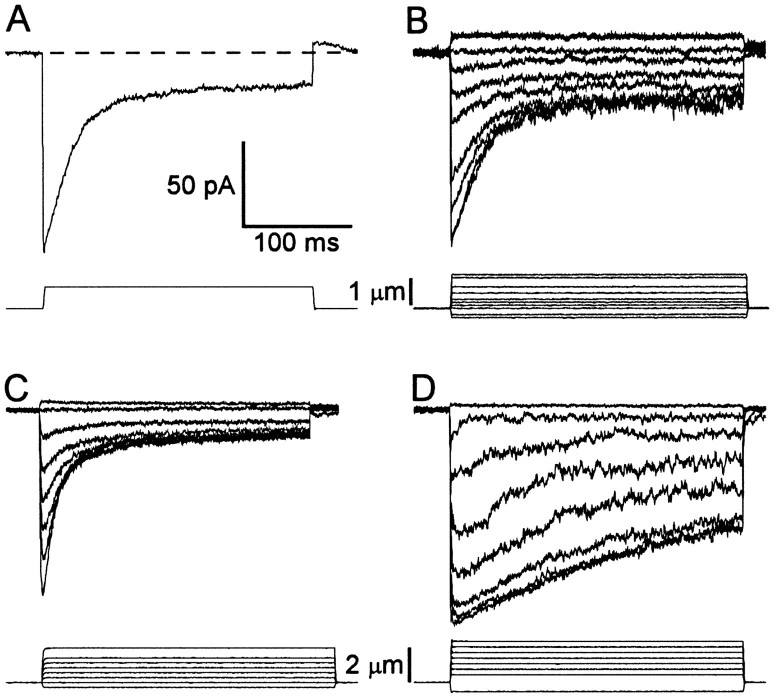
Figure 2 shows transduction currents recorded from four different cells. Bundles were deflected by fluid jet under pressure-clamp control. For step deflections toward the kinocilium, all cells showed rapid onset of inward transduction currents, a subsequent decay of the current (adaptation) to a steady-state level and a rapid decline of the inward current to its resting value or less (rebound) at the termination of the step. The single current trace in Figure 2A, recorded in response to a +0.9 μm bundle deflection, illustrates these features.
Fig. 2.
General features of transduction in mouse utricular hair cells. Data are from four different cells. Bundles were deflected by a fluid jet under pressure-clamp control. Traces are averages of 6–20 records. Scale bars apply to all data sets.A, Single trace evoked by a 0.9 μm bundle deflection. The dashed line shows the current on at the resting position of the bundle. Cell B970404, P4, unclassified.B, Family of currents evoked by the step stimuli shown in the bottom set of traces. These data are most representative in terms of the rate and extent of adaptation, maximum current (Imax), and the current on at rest (Irest) as a percentage ofImax. Cell A961127, P7, type II.C, Family of transduction currents chosen to illustrate the fastest adaptation we observed. Cell C961209, P8, type II.D, Family of currents with the slowest adaptation in our sample. Cell D970404, P4, unclassified.
Variation among cells in both the rate and extent of adaptation was observed. Figure 2B shows a family of currents representative of those most commonly encountered. Like the single trace in Figure 2A, each inward current trace in the family displayed rapid onset, adaptation, and a rapid return at the end of the step. Note that negative bundle deflection reduced the inward current. This reflected closing of transduction channels that were open at the resting position of the bundle. Figure 2C,D shows families of currents that represent the fast and slow extremes of adaptation rate. Also notice that the steady-state extent of adaptation varied among cells. We observed no correlation between rate or extent of adaptation and postnatal day.
I(X) relationships
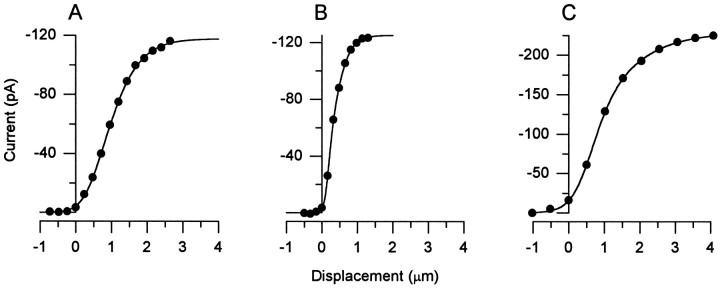
I(X) relationships were generated for 12 cells by plotting peak transduction currents from families like those in Figure 2 versus hair bundle deflection. TheseI(X) relations have the asymmetric sigmoidal shape described for other hair cells. The relations were best fit by a second-order Boltzmann equation derived from a three-state scheme for channel gating, with two closed states and one open state (Corey and Hudspeth, 1983):
| Equation 1 |
where I is the transduction current, X is bundle deflection measured near the tip of the tallest row of stereocilia, Imax is the maximum transduction current, A1 and A2 are constants that determine the steepness of the function, andP1 and P2 are constants that set the position of the function along the x-axis. For the 12 cells, the open probability (Irest/Imax) at the resting position of the bundle (zero deflection) varied between 0.5% and 12%, with a mean of 4.2 ± 0.8%. We obtained the same value (4.2 ± 0.7%) by measuring Irestjust before positioning the fluid-jet pipette near the bundle. Thus, on average, there did not appear to be a bias of the resting position of the bundle caused by tonic pressure or suction from the fluid-jet pipette.
The mean amplitude of the maximum current was −155 ± 15 pA, which corresponds to a conductance of 2.4 nS [assuming a reversal potential of −2 mV (Corey and Hudspeth, 1979)]. If single-channel conductance is 110 pS, as reported by Géléoc et al. (1997), then these cells have 22 functional channels on average. The maximum conductance we recorded was 4.7 nS, corresponding to 43 channels. Denk et al. (1995) have shown that channels can be at either end, and possibly both ends, of tip links. The mean number of stereocilia in our cells was 55 ± 1.2 (n = 4). Thus, as in other preparations, fewer than the maximum possible number of channels were operational.
We define the operating range of theI(X) relation as the net deflection required to evoke from 10 to 90% of the maximum current. Figure3A is representative of the most common I(X) curves. The mean operating range was 1.5 ± 0.17 μm. Figure 3B,C isI(X) curves from the cells with the most extreme operating ranges: 0.7 μm and 2.3 μm, respectively. The mean operating range for these cells is several times broader than that of frog saccular hair cells (0.2–0.5 μm) (Shepherd and Corey, 1994). The operating range is expressed in terms of the displacement of the bundle parallel to the plane of the epithelium at the height of the tallest stereocilia. To compare the operating ranges of the transduction apparatus (tip link and channel) in frog and mouse vestibular hair cells, we estimated a geometrical gain, or γ factor; multiplying the measured displacements by γ gives the approximate extension of the tip links (Jacobs and Hudspeth, 1990). Gamma can be estimated from bundle height (h) and interstereocilia distance (s, measured at the base of the stereocilia along the orientation axis) according to γ ≈ s/h.
Fig. 3.
Current–deflection (I(X)) relations obtained with the fluid-jet stimulus. Peaks from current families like those of Figure 2B–D are plotted versus bundle deflection. The curves through the data are best fits of a second-order Boltzmann function (Eq. 1). Data are from three different cells.A, Of the 12 cells from which we obtainedI(X) relations, these data are most representative of the mean. The 10–90% operating range (OR) for this cell was 1.7 μm. Maximum current (Imax) was −118 pA, and the current on at rest (Irest) was 3.7% ofImax. Fit parameters wereP1, 0.37;P2, 0.88;A1, 3.07;A2, 2.07. Cell A970117, P9, type II.B, Data from the cell with the narrowestI(X) relation. OR, 0.68 μm; Imax, −125 pA;Irest, 3.0% ofImax. Fit parameters wereP1, 0.17;P2, 0.28;A1, 13.8;A2, 4.47. Cell F970114, P6, unclassified. C, Data from the cell with the broadestI(X) relation. OR, 2.3 μm; Imax, 229 pA;Irest, 7.0% ofImax. Fit parameters wereP1, 0.78;P2, 0.38;A1, 2.63;A2, 1.06. Cell C970404, P4, unclassified.
We measured the height of the tallest row of stereocilia from DIC images of hair cells viewed on their sides. The mean height was 13.2 ± 1.7 μm (n = 59 hair bundles; P2). Interstereocilia distance was measured using confocal microscopy of phalloidin-stained stereocilia, viewed from above in the epithelium. Mean interstereocilia distance at the base of the bundle was 0.66 ± 0.13 μm (n = 27). Thus, for mouse utricle cells, γ is 0.047, approximately three times smaller than for frog saccular cells (0.14) (Jacobs and Hudspeth, 1990). This difference can account for the approximately threefold broader operating range of the mouse utricle cells.
Adaptation and the I(X) relation
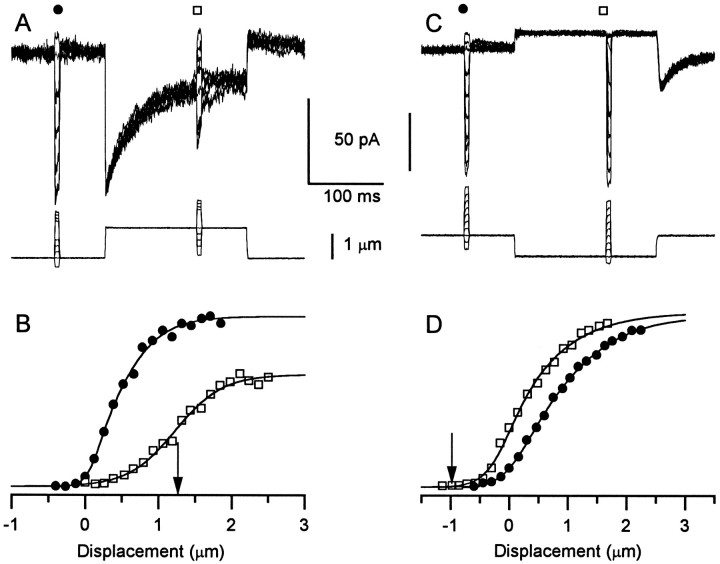
To assess the effects of adaptation on theI(X) relation, we delivered two series of 10 msec test steps, one before and one 125 msec after the onset of a conditioning deflection. The +1.3 μm conditioning deflection evoked a large adapting current (Fig.4A), and the test steps provided the I(X) curve in its nonadapted and adapted states (Fig. 4B). The operating range of the nonadapted I(X) relation was 1.0 μm, with a midpoint at 0.42 μm. The conditioning step had several effects on the I(X) relation: (1) The midpoint of the adapted I(X) relation was shifted by +0.8 μm; (2) the operating range of the adaptedI(X) relation was 1.4 μm, 40% broader; and (3) the maximum current was reduced by 34%.
Fig. 4.
Effects of adaptation on theI(X) relation obtained with fluid-jet stimuli. A, Two series of 10 msec test steps were delivered, one before and one 125 msec after the onset of a +1.3 μm conditioning step. The peak currents evoked by each series are plotted in B versus deflection. Traces are averages of five records. Cell A961127, P7, type II. B,I(X) curves generated from the data shown in A and additional traces not shown inA. The arrow indicates the size of the conditioning step. Parameters for the nonadaptedI(X) relation (circles) were OR, 1.0 μm;Imax, −97 pA;Irest, 5.9% ofImax;P1, 0.16;P2, 0.38;A1, 8.71;A2, 3.16. Parameters for the adaptedI(X) relation (squares) were OR, 1.4 μm;Imax, −64 pA;P1, 8.75;P2, 0.14;A1, 0.43;A2, 2.69. C, Protocol was identical to that of Fig. A except that the conditioning step was −0.9 μm. Peak currents are plotted inD versus deflection. Average of nine records. Cell C961209, P8, type II. D,I(X) curves generated from data of C. The arrow indicates the size of the conditioning step. Parameters for the nonadaptedI(X) relation (circles) were OR, 2.1 μm;Imax, −141 pA;Irest, 11%;P1, 0.72;P2, 1.19;A1, 3.61;A2, 1.57. Parameters for the adaptedI(X) relation (squares) were OR, 1.8 μm;Imax, −144 pA;P1, 7.4;P2, 10.8;A1, 1.14;A2, 0.29.
Figure 4C,D shows the effects of a −0.9 μm conditioning step. Although no adaptation was visible during the conditioning step, the large rebound current at the end of the step revealed that an adaptive shift did occur. This is also apparent in theI(X) curves shown in Figure4D. The midpoint of the adaptedI(X) curve was shifted by −0.47 μm relative to the nonadapted I(X) curve. In this case, the operating range of the adaptedI(X) curve was 12% narrower than that of the nonadapted I(X) curve.
These observations were not well fitted by either the motor model (Howard and Hudspeth, 1987; Assad and Corey, 1992), which predicts a pure shift of the I(X) relation, or the model of Crawford et al. (1991), which predicts a shifted but steeperI(X) curve after adaptation to a positive step and a shifted but broader curve after negative steps.
Stiff-probe stimulation
Both the motor model and the model of Crawford et al. (1991) were based on data collected from hair cells stimulated by a coupled, stiff glass probe. To address the possibility that the differences between our data and those of the previous studies resulted from the difference in stimulus delivery, we deflected bundles with stiff glass probes mounted on piezoelectric bimorph elements. In experiments on frog saccular hair cells, such probes stick to the bundle, but with the mouse utricular bundles, the probes often became detached during the large deflections required to saturate transduction. Instead, we pushed the bundles in the positive direction by positioning the probe near the tip on the tapered side of the bundle (Fig. 1A). The data of Figures 5 and6 were recorded in response to stiff-probe stimulation.
Fig. 5.
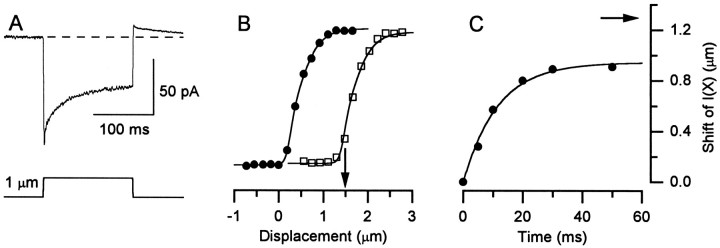
Currents andI(X) relations recorded in response to stiff-probe stimulation. A, The trace is an average of 20 current records evoked by a +1.0 μm step. The rapid onset, adaptation, and rebound are qualitatively similar to that of Figure 2A. The dashed line shows the resting transduction current. Cell D970212, P7, type II.B, I(X) relations generated by a protocol similar to that in Fig.4A,B. The arrow indicates the size of the conditioning step. Current scale bar of A also applies to B. The nonadaptedI(X) curve (circles) was fit with a second-order Boltzmann function (Eq. 1) and had the following parameters: OR, 0.75 μm;Imax, −94 pA;Irest, 0.7% ofImax;P1, 0.25;P2, 0.39;A1, 14.5;A2, 4.05. The Boltzmann curve through the adapted I(X) relation (squares) was identical to the one used to fit the nonadapted I(X) relation except that it was shifted +1.2 μm along the deflection axis. Cell D970206, P1, unclassified. C, Rate of shift of theI(X) relation. TheI(X) relation was sampled at 5, 10, 20, 30, and 50 msec after onset of a conditioning step of +1.3 μm (arrow). Data points reflect the shift of the midpoint of each I(X) curve relative to the midpoint of the nonadaptedI(X) curve. A single-exponential function with a τ of 11.5 msec provided the best fit to the data. Cell D970212, P7, type II.
Fig. 6.
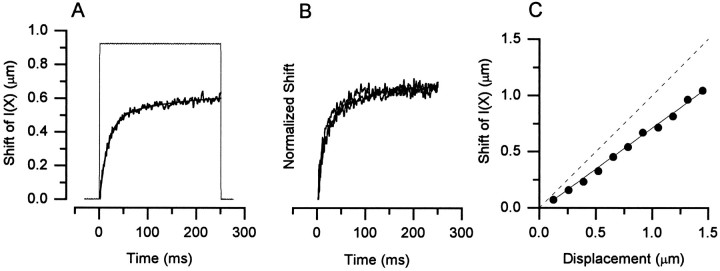
Rate and extent of adaptation as measured by the inferred shift of the I(X) relation. Stiff-probe stimuli. Same cell throughout. Cell A970212, P7, type II. A, The shift required to align the nonadaptedI(X) relation with each data point of the current record is plotted versus time. The stimulus waveform is shown for comparison. B, Inferred shifts such as those in A are shown for step stimuli of 0.78, 1.05, and 1.31 μm. The data have been normalized to step size.C, Inferred shifts were calculated for a family of transduction currents. The steady-state inferred shift (measured at 250 msec) was plotted against deflection (circles). A linear regression was fit to the data with a slope of 0.73 (r = 0.98; solid line). Thedashed line indicates a slope of 1, i.e., a complete adaptive shift.
Figure 5A shows a representative current trace evoked by a +1.0 μm step deflection. As with the fluid-jet stimuli (Fig.2A), the deflection by a stiff probe evoked a current with a rapid onset that adapted over the following 150 msec. At the offset of the step there was a transient rebound. Nonadapted and adapted I(X) curves were generated as described for fluid-jet stimulation (Fig. 4). An example from a different cell, for a +1.5 μm conditioning step, is shown in Figure5B. The I(X) curve from the nonadapted state (circles) was well fitted with Equation 1. The operating range for this cell was 0.75 μm, which fell within the range of values observed with the fluid-jet stimulation. The mean value for the cells stimulated by stiff probes was 1.1 ± 0.2 μm (range, 0.75 to 1.7 μm). The adaptedI(X) relation (squares) had the same steepness and amplitude as the nonadapted relation but was shifted +1.2 μm along the deflection axis. The curve through these data is a Boltzmann function with the same parameters as those from the fit to the nonadapted I(X) curve, but shifted. Similar pure shifts were observed in all four cells that we tested. This result accords nicely with the motor model of adaptation and suggests that the broadening and reduced Imaxapparent in Figure 4A,B are phenomena associated with fluid-jet stimulation, rather than a difference between frog saccular and mouse utricular hair cells.
The rate of the adaptive shift of the I(X) relation was investigated by sampling its position at 5, 10, 20, 30, and 50 msec after the onset of a +1.3 μm step. The midpoints of those curves relative to that of the nonadaptedI(X) relation are plotted in Figure5C. The data were fit with a single exponential function with a τ of 11.5 msec and an amplitude of 0.94 μm. This is similar to that reported by Assad et al. (1989) for the rate of the adaptive shift in frog saccular hair cells.
Inferred shift of the I(X) relation
If for stiff-probe stimuli the only effect of adaptation is to shift the I(X) relation in the direction of the applied stimulus, we can infer the adaptive shift from the current record evoked by a conditioning step without using superimposed test steps (Shepherd and Corey, 1994). This more expedient method requires that the nonadapted I(X) relation be sampled only once. The inferred shift is taken as the shift of the nonadapted I(X) curve required to align it with each data point of the current record. Figure 6Ashows the inferred shift plotted versus time with the stimulus waveform superimposed. The data were fitted with a double exponential function with time constants of 16 and 96 msec and amplitudes of 0.47 and 0.17, respectively. To investigate whether the rate of the inferred shift depends on stimulus amplitude, we measured the shift induced by step stimuli of +0.78, +1.05, and +1.31 μm (Fig. 6B). The data have been normalized to stimulus amplitude and superimpose so well that they are difficult to distinguish. Thus, the time course of the adaptive shift was independent of stimulus amplitude, as in frog saccular hair cells. Furthermore, a plot of the steady-state inferred shift of the I(X) curve versus deflection (Fig. 6C) was linear, showing that the magnitude of the adaptive shift was proportional to the stimulus amplitude. The slope of the line fit through these data gives the extent of adaptation for this cell: 73%. The mean extent of adaptation for these cells was 65 ± 3% (range, 51–82%). The residual 35% may be critical for providing information about low-frequency head movements and head position.
Calcium dependence of adaptation
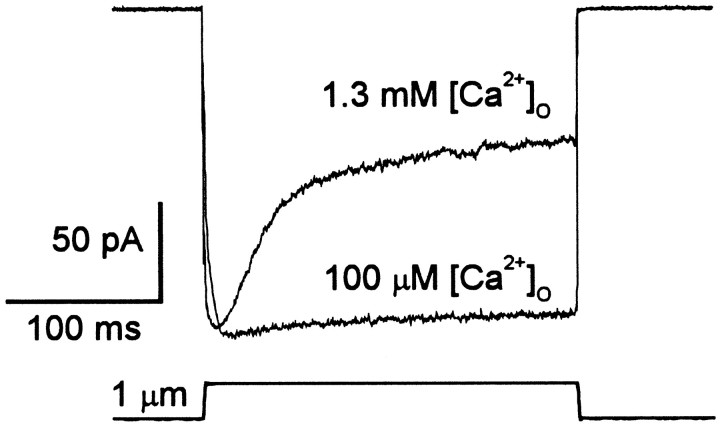
In other hair cells, adaptation depends on the calcium concentration inside the tips of the stereocilia (Eatock et al., 1987;Assad et al., 1989; Crawford et al., 1991; Kimitsuki and Ohmori, 1992;Ricci and Fettiplace, 1997). [Ca2+] inside the stereocilium can be affected by buffering intracellular [Ca2+], by changing extracellular [Ca2+], or by changing the membrane potential and thus the Ca2+ driving force (because transduction channels have significant Ca2+ permeability) (Corey and Hudspeth, 1979). Figure 7 shows the effects of reducing extracellular Ca2+ on the response to a +1 μm step. The rate and extent of adaptation in 100 μm Ca2+ were greatly reduced relative to their values in 1.3 mm Ca2+.
Fig. 7.
Calcium dependence of adaptation. A +1.0 μm deflection evoked by a fluid jet. The hair cell was superfused with an external solution containing 100 μmCa2+, released by a wide-mouth pipette positioned ∼100 μm from the hair cell. The positive deflection was superimposed on a steady negative deflection of ∼500 nm, which closed all the transduction channels. The low Ca2+ solution nearly abolished adaptation. The videotaped images of bundle motion showed no effect of the superfusate on the fluid-jet stimulus. The return to 1.3 mm external Ca2+ restored adaptation. Cell A970403, P1, unclassified.
Active bundle movement
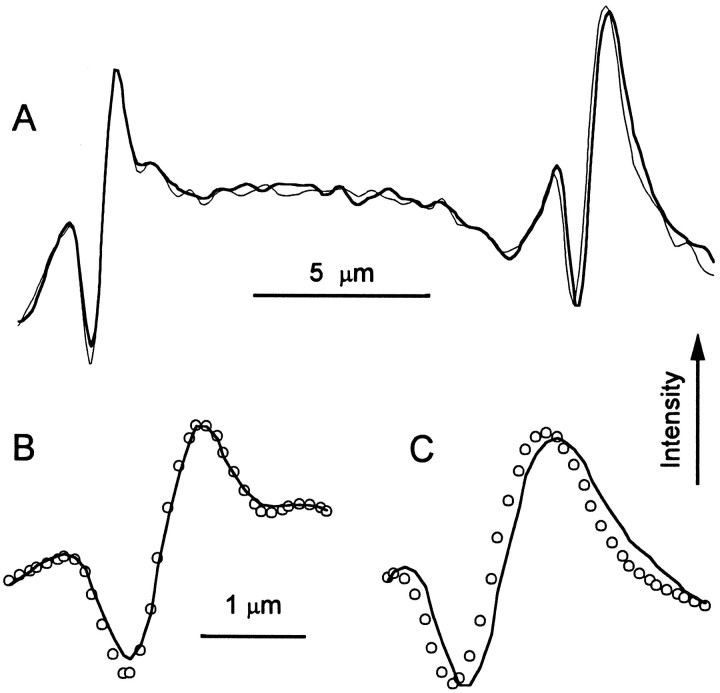
The motor model of hair cell adaptation predicts that the position of a freestanding hair bundle depends on intracellular calcium ([Ca2+]i) (Assad and Corey, 1992). Briefly, the model proposes that an increase in the Ca2+ concentration inside the stereocilia promotes slippage of the transduction apparatus relative to the actin core, reducing tension on the tip links and allowing the bundle to relax in the positive direction. Conversely, a decrease in [Ca2+]i promotes climbing of the transduction apparatus up the actin core, which will pull the tips of the stereocilia in the negative direction. Assad and Corey (1992)manipulated [Ca2+]i by changing membrane voltage between −80 mV, at which the driving force is large, and +80 mV, near the equilibrium potential for Ca2+. In these experiments, the bundle tilted in the negative direction by 50 nm, on average, as voltage was stepped from −80 to +80 mV. Figure8 shows that equivalent results were obtained with mouse utricular hair cells. Voltage was stepped between −80 and +80 mV. Bundles were viewed from above in the intact epithelium and images at the two potentials were stored on disk for offline analysis. Figure 8A is a plot of image intensity versus position for a line scan across the image of two neighboring hair bundles. The peaks on the left are from a control bundle, and the peaks on the right are from a test bundle that was voltage-clamped. The peaks have been expanded in Figure8B,C. The intensity profile of the test bundle at +80 mV (thin line) was shifted to the left (away from the kinocilium) by 110 nm relative to the profile at −80 mV (thick line), whereas no shift was apparent for the control bundle. The average movement for three bundles was −132 ± 17 nm.
Fig. 8.
Voltage-dependent bundle movement. A hair cell was held at −80 mV and stepped to +80 mV for 500 msec. Images focused near the tip of the bundle were recorded at each potential.A, A line scan across two bundles plots image intensity versus position. The peaks on the right are from the bundle of the voltage-clamped hair cell. The peaks on theleft (control) are from a nearby hair bundle in a cell that was not voltage-clamped. The thick line was recorded at −80 mV, and the thin line was recorded at +80 mV. Cell C970318, P8, type II. B, C, Expanded views of the control bundle (B) and the test bundle (C). The line is at −80 mV, and the symbols are at +80 mV.
Sinusoidal stimulation
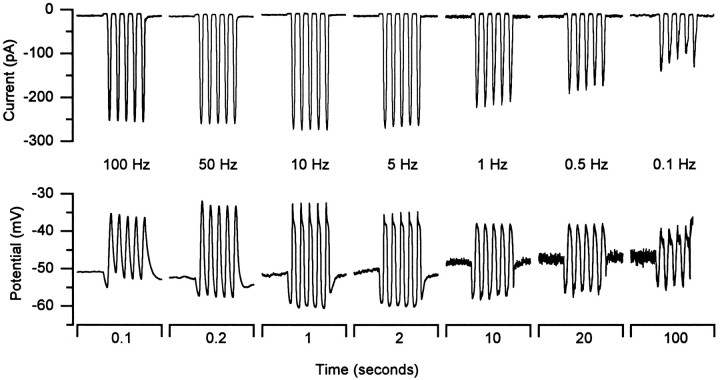
Adaptation rates in the range we have recorded will reduce sensitivity to low frequency stimuli. To examine this directly we stimulated the bundles with sinusoidal deflections at various frequencies and recorded both transduction currents and receptor potentials. One such set of recordings is shown in Figure9. The top row of traces shows transduction currents evoked by sinusoids (2.5 μm peak–peak) that range in frequency from 100 to 0.1 Hz. Below 5 Hz the peak currents declined as a result of adaptation. For this cell adaptation evoked by a +1.25 μm step deflection was fitted with a double exponential with a fast τ of 22 msec, corresponding to a corner frequency (1/2πτ) of 7 Hz. When the steady-state component is subtracted from the current records in Figure 9, the peak–peak amplitude of the remaining component declines 10-fold per decade of frequency below 5 Hz. Thus, the step and sinusoidal data are in reasonable agreement. The slight decline of the successive peaks in the bursts at 1.0, 0.5, and 0.1 Hz may reflect asymmetric rates of adaptation; in the frog saccule, climbing of the adaptation motor is slower than slipping (Eatock et al., 1987; Assad and Corey, 1992).
Fig. 9.
Transduction currents and receptor potentials evoked by sinusoidal stimuli. The top row of traces shows transduction currents evoked by 2.5 μm peak–peak sinusoidal stimuli. The frequency of stimulation is shown below. The bottom row of traces shows receptor potentials recorded in current-clamp mode in response to the same series of stimuli. Traces are averages of 2–16 records. Cell C970404 P4, unclassified.
Receptor potentials recorded from the same cell in current-clamp mode are shown in the bottom row of traces. The roll-off at low frequencies, seen in the current records, is also visible in the receptor potential records. In addition to the reduction caused by adaptation of the transduction current, activation of voltage-dependent K+ conductances is expected to reduce the amplitude. This is likely to be responsible for the sag in the peaks of the responses at frequencies below 50 Hz. The reduction in the receptor potential amplitude at the high frequency end is likely to result from the low-pass-filter characteristics of the cell membrane. For this cell the input resistance was 1 GΩ. If we use the average cell capacitance of 5 pF, we obtain a membrane time constant of 5 msec and a corner frequency of 32 Hz. Thus, the cell is predicted to act as a band-pass filter tuned to frequencies between 7 and 32 Hz. Consistent with this prediction, the receptor potential amplitude peaked at 10 Hz. Similar results were obtained in five other cells.
DISCUSSION
Comparison with adaptation of other hair cells
Hair cells of the mouse utricle do adapt. The time course and extent of the adaptation vary among cells but are comparable to data from hair cells of other organs and species (Crawford et al., 1991;Kimitsuki and Ohmori, 1992; Kros et al., 1992; Shepherd and Corey, 1994). The quantitative similarities between our data and those obtained from bullfrog saccular hair cells suggest that they share a common adaptation mechanism. Howard and Hudspeth (1987) postulated that an active motor process provides feedback to the channel by adjusting tip link tension (Fig. 1B). Our strongest evidence that a similar force-generating process exists in mouse utricular cells is the voltage-dependent movement of the freestanding bundle. At +80 mV, the tips of the bundles moved in the negative direction by an average of 132 nm. This is almost threefold larger than the 50 nm movement observed in frog saccular hair cells (Assad and Corey, 1992), but the difference can be accounted for by the different geometries of the two bundles, because γ also differs by a factor of ∼3. This suggests that the insertion points of the tip links climbed the same amount with depolarization.
The voltage-dependent movement that we saw is not predicted by the model of Crawford et al. (1991). According to that model, the decrease in calcium associated with depolarization would tend to allow channels to open. If we assume that channel opening relieves tension in the tip link (Howard and Hudspeth, 1988), the bundle would move in the positive direction by an amount proportional to the swing of the channel’s gate. Based on a gate swing of 2 nm, channels at each end of the tip link (Denk et al., 1995), and γ for our cells, the largest movement predicted would be approximately +40 nm. The movement we observed was in the opposite direction.
Further evidence that the motor model applies to adaptation in mouse utricular cells is provided by the simple shift of theI(X) relation when bundles were deflected by a stiff probe. Although the data collected with the fluid jet did show a change in steepness of the I(X) curve, it was in the direction opposite to that predicted by the model of Crawford et al. (1991).
Analysis of transduction currents by the inferred shift method (Shepherd and Corey, 1994) revealed that like frog saccular hair cells, mouse utricular cells had a limited extent of adaptation. For stiff-probe stimulation, both the extent and rate of the adaptive shift were independent of stimulus amplitude. On average, the extent of adaptation was 65% of the stimulus amplitude, somewhat smaller than the mean value in the frog saccule (80%).
The broad operating range of the mouse cells was easily reconciled with the narrower range of frog saccular cells (Shepherd and Corey, 1994) by considering the differences in bundle geometry. The difference in γ for the two cell types suggests that the operating ranges of the transduction channels themselves are likely to be of a similar magnitude.
Our results differ in several respects from results obtained recently in hair cells of mouse saccules and utricles byGéléoc et al. (1997). The cells that they studied with scanning electron microscopy had shorter bundles (9.3 vs 13.2 μm), which may reflect shrinkage during fixation, and fewer stereocilia (38 vs ∼60) than we found. More significantly, the cells that they studied had substantially narrower operating ranges, and their currents did not adapt. The operating range may have been underestimated because they did not obtain saturating responses. Adaptation has been shown to be labile in hair cells from other organs (Eatock et al., 1987). Although their sample of seven cells may not be representative, it is also possible that there are genuine differences both in sensitivity and adaptation between subsets of hair cells from mammalian otolith organs. Some of the data of Géléoc et al. (1997) were from saccule, and all were from cultured neonatal organs in which it was not possible to distinguish type I and type II hair cells. Differences in sensitivity and adaptation rates between subpopulations of hair cells were observed in receptor potential recordings from the bullfrog utricle (Baird, 1994).
Fluid-jet versus stiff-probe stimulation
The adapted I(X) relation evoked by positive fluid-jet deflections was broader and had a decreased maximum current relative to the nonadapted I(X) curves (Fig. 4B). These effects were consistently seen and did not depend on the orientation of the fluid-jet pipette (i.e., either pressure or suction could serve as a positive stimulus). These effects were not seen with the stiff-probe stimulus. The motor model of adaptation, updated by Shepherd and Corey (1994) to include an extent spring and a negative limit, does not reproduce these effects when force-clamp conditions are simulated. The linear relation between pressure and deflections of either flexible glass probes or hair bundles rules out the fluid jet as a source of artifact (see Materials and Methods). The time course and magnitude of the broadening of theI(X) relation, the reduction inImax, and the adaptive shift were similar (data not shown), suggesting that they are closely related. We have no clear understanding of the broadening and reduction inImax and can only speculate as to their source. Nonlinearity of the bundle motion, at times shorter than we were able to resolve (<33 msec), may account for these effects, but seems unlikely because at longer times the bundle motion was linear with pressure. Alternatively, mechanisms that decrease the single channel conductance (g) or the open probability (PO) without appreciably affecting bundle position may be responsible. Even though the fluid-jet pipette is filled with the bath solution, it is conceivable that the fluid jet alters the ionic conditions (such as calcium concentration) surrounding the hair bundle to cause a decrease in g. A decrease inPO could result from a decrease in the number of transducing units or an inactivation mechanism. In any case, these observations raise the possibility that more than one adaptation mechanism operates in vivo.
Functional significance of adaptation in the mouse utricle
In hair cells of the frog saccule, electrical resonance arising from the voltage- and Ca2+-gated conductances in the basolateral membrane sharply tunes the receptor potential (Hudspeth and Lewis, 1988). There is no evidence for sharp electrical resonance in the mouse utricle (Rüsch and Eatock, 1996a). In mouse hair cells, the receptor potential as a function of stimulus frequency had a band-pass filter characteristic with a broad peak between 1 and 50 Hz (Fig. 9). The low-pass characteristic was set by passive membrane properties, and the high-pass characteristic was set by the adaptation process. The extent of the adaptive shift we measured was on average 65% of the stimulus amplitude. Thus, even for frequencies far below the corner frequency, a substantial fraction of the current remains, enough to generate receptor potentials of 10–20 mV (Fig. 9).
The receptor potential data in Figure 9 can be compared with in vivo data from the rodent utricle on the responses of primary afferents to sinusoidal head movements (Goldberg et al., 1990). The afferents are grouped into regular and irregular classes according to their spontaneous discharge patterns. At stimulus frequencies ≤2 Hz, the upper limit of the available data, irregular afferents are high-pass, like the hair cell in Figure 9. The flat filter characteristic of regular afferents below 2 Hz is consistent with input from nonadapting hair cells, which were not seen in this study (but seeGéléoc et al., 1997, discussed above), or from cells with a high rate of adaptation, so that responses below 2 Hz reflected the residual component.
Several possible differences between in vivo and ourin vitro conditions may affect the rate of adaptationin vivo. The low Ca2+ concentration (∼100 μm) in the solution that bathes the hair bundlesin vivo (endolymph) will slow the rate of adaptation (Fig.7). However, the stereocilia may have lower concentrations of Ca2+ buffer in vivo than in our whole-cell conditions, which would increase the rate of adaptation (Ricci and Fettiplace, 1997). Our experiments were performed at 22–25°C; adaptation at mammalian temperatures is likely to be two to three times faster. Even if adaptation rates in vivo differ from the in vitro rates that we have measured, the limited extent of adaptation will allow cells to signal low frequencies.
In summary, the effect of adaptation on hair cell responses depends on the stimulus frequency. At high frequencies (>10 Hz), adaptation is too slow to affect the response. At lower frequencies (≤5 Hz) the response is attenuated but not eliminated. The limited extent of adaptation preserves about one-third of the response to slow stimuli. Moreover, adaptation preserves responsiveness in the presence of large slow or steady stimuli, such as gravity, by shifting theI(X) curve. Because the adaptive shift is limited to ∼65% in this organ, it extends the operating range by approximately threefold (Shepherd and Corey, 1994).
Conservation of transduction elements
Identification of transduction elements such as the tip link, the transduction channel, and the adaptation motor has proven difficult. The remarkable similarity of transduction and adaptation in hair cells of the mouse utricle and the frog saccule suggests that the molecular identities of the transduction elements are conserved. We propose that the mouse utricle is likely to be a suitable preparation for genetic and molecular biological approaches to identifying the components of the transduction apparatus. Recent cloning of several genes implicated in hearing and vestibular disorders and expressed in mouse hair cells (Avraham et al., 1995; Gibson et al., 1995) lends support to this suggestion.
Footnotes
This work was supported by National Institutes of Health Grants DC02290 (R.A.E.) and DC00304 (D.P.C.), by a Caroline Wiess Law Award (R.A.E.), and by the Howard Hughes Medical Institute (D.P.C., J.R.H.). D.P.C. is an Investigator of the Howard Hughes Medical Institute. We thank J. Garcia for help with confocal microscopy, and J. Assad, J. Garcia, D. Himes, K. Hurley, and M. Vollrath for comments on this manuscript.
Correspondence should be addressed to Ruth Anne Eatock, Department of Otolaryngology, Baylor College of Medicine, One Baylor Plaza, Houston, TX 77030.
REFERENCES
- 1.Assad JA, Corey DP. An active motor model for adaptation by vertebrate hair cells. J Neurosci. 1992;12:3291–3309. doi: 10.1523/JNEUROSCI.12-09-03291.1992. [DOI] [PMC free article] [PubMed] [Google Scholar]
- 2.Assad JA, Hacohen N, Corey DP. Voltage dependence of adaptation and active bundle movement in bullfrog saccular hair cells. Proc Natl Acad Sci USA. 1989;86:2918–2922. doi: 10.1073/pnas.86.8.2918. [DOI] [PMC free article] [PubMed] [Google Scholar]
- 3.Avraham KB, Hasson T, Steel KP, Kingsley DM, Russell LB, Mooseker MS, Copeland NG, Jenkins NA. The mouse Snell’s waltzer deafness gene encodes an unconventional myosin required for structural integrity of inner ear hair cells. Nat Genet. 1995;11:369–375. doi: 10.1038/ng1295-369. [DOI] [PubMed] [Google Scholar]
- 4.Baird RA. Comparative transduction mechanisms of hair cells in the bullfrog utriculus. II. Sensitivity and response dynamics to hair bundle displacement. J Neurophysiol. 1994;71:685–705. doi: 10.1152/jn.1994.71.2.685. [DOI] [PubMed] [Google Scholar]
- 5.Corey DP, Hudspeth AJ. Ionic basis of the receptor potential in a vertebrate hair cell. Nature. 1979;281:675–677. doi: 10.1038/281675a0. [DOI] [PubMed] [Google Scholar]
- 6.Corey DP, Hudspeth AJ. Mechanical stimulation and micromanipulation with piezoelectric bimorph elements. J Neurosci Methods. 1980;3:183–202. doi: 10.1016/0165-0270(80)90025-4. [DOI] [PubMed] [Google Scholar]
- 7.Corey DP, Hudspeth AJ. Kinetics of the receptor current in bullfrog saccular hair cells. J Neurosci. 1983;3:962–976. doi: 10.1523/JNEUROSCI.03-05-00962.1983. [DOI] [PMC free article] [PubMed] [Google Scholar]
- 8.Corey DP, Assad JA. Transduction and adaptation in vertebrate hair cells: correlating structure with function. In: Corey DP, Roper SD, editors. Sensory transduction. Rockefeller University; New York: 1992. pp. 326–342. [PubMed] [Google Scholar]
- 9.Correia MJ, Lang DG. An electrophysiological comparison of solitary type I and type II vestibular hair cells. Neurosci Lett. 1990;116:106–111. doi: 10.1016/0304-3940(90)90394-o. [DOI] [PubMed] [Google Scholar]
- 10.Correia MJ, Christensen BN, Moore LE, Lang DG. Studies of solitary semicircular canal hair cells in the adult pigeon. I. Frequency- and time-domain analysis of active and passive membrane properties. J Neurophysiol. 1989;62:924–945. doi: 10.1152/jn.1989.62.4.924. [DOI] [PubMed] [Google Scholar]
- 11.Crawford AC, Fettiplace R. The frequency selectivity of auditory nerve fibers and hair cells in the cochlea of the turtle. J Physiol (Lond) 1980;306:79–125. doi: 10.1113/jphysiol.1980.sp013387. [DOI] [PMC free article] [PubMed] [Google Scholar]
- 12.Crawford AC, Evans MG, Fettiplace R. The actions of calcium on the mechano-electrical transducer current of turtle hair cells. J Physiol (Lond) 1991;434:369–398. doi: 10.1113/jphysiol.1991.sp018475. [DOI] [PMC free article] [PubMed] [Google Scholar]
- 13.Denk W, Webb WW. Forward and reverse transduction at the limit of sensitivity studied by correlating electrical and mechanical fluctuations in frog saccular hair cells. Hear Res. 1992;60:89–102. doi: 10.1016/0378-5955(92)90062-r. [DOI] [PubMed] [Google Scholar]
- 14.Denk W, Holt JR, Shepherd GMG, Corey DP. Calcium imaging of single stereocilia in hair cells: localization of transduction channels at both ends of tip links. Neuron. 1995;15:1311–1321. doi: 10.1016/0896-6273(95)90010-1. [DOI] [PubMed] [Google Scholar]
- 15.Eatock RA, Corey DP, Hudspeth AJ. Adaptation of mechanoelectrical transduction in hair cells of the bullfrog’s sacculus. J Neurosci. 1987;7:2821–2836. doi: 10.1523/JNEUROSCI.07-09-02821.1987. [DOI] [PMC free article] [PubMed] [Google Scholar]
- 16.Fernandez C, Goldberg JM. Physiology of peripheral neurons innervating otolith organs of the squirrel monkey. I. Response to static tilts and to long-duration centrifugal force. J Neurophysiol. 1976a;39:970–984. doi: 10.1152/jn.1976.39.5.970. [DOI] [PubMed] [Google Scholar]
- 17.Fernandez C, Goldberg JM. Physiology of peripheral neurons innervating otolith organs of the squirrel monkey. III. Response dynamics. J Neurophysiol. 1976b;39:996–1008. doi: 10.1152/jn.1976.39.5.996. [DOI] [PubMed] [Google Scholar]
- 18.Géléoc G, Lennan GWT, Richardson GP, Kros CJ. A quantitative comparison of mechanoelectrical transduction in vestibular and auditory hair cells of neonatal mice. Proc R Soc Lond [Biol] 1997;264:611–621. doi: 10.1098/rspb.1997.0087. [DOI] [PMC free article] [PubMed] [Google Scholar]
- 19.Gibson F, Walsh J, Mburu P, Varela A, Brown KA, Antonio M, Beisel KW, Steel KP, Brown SD. A type VII myosin encoded by the mouse deafness gene shaker-1. Nature. 1995;374:62–64. doi: 10.1038/374062a0. [DOI] [PubMed] [Google Scholar]
- 20.Goldberg JM, Desmadryl G, Baird RA, Fernandez C. The vestibular nerve of the chinchilla. IV. Discharge properties of utricular afferents. J Neurophysiol. 1990;63:781–790. doi: 10.1152/jn.1990.63.4.781. [DOI] [PubMed] [Google Scholar]
- 21.Hamill OP, Marty A, Neher E, Sakmann B, Sigworth FJ. Improved patch-clamp techniques for high-resolution current recording from cells and cell-free membrane patches. Pflügers Arch. 1981;391:85–100. doi: 10.1007/BF00656997. [DOI] [PubMed] [Google Scholar]
- 22.Howard J, Hudspeth AJ. Mechanical relaxation of the hair bundle mediates adaptation in mechanoelectrical transduction by the bullfrog’s saccular hair cell. Proc Natl Acad Sci USA. 1987;84:3064–3068. doi: 10.1073/pnas.84.9.3064. [DOI] [PMC free article] [PubMed] [Google Scholar]
- 23.Howard J, Hudspeth AJ. Compliance of the hair bundle associated with gating of mechanoelectrical transduction channels in the bullfrog’s saccular hair cell. Neuron. 1988;1:189–199. doi: 10.1016/0896-6273(88)90139-0. [DOI] [PubMed] [Google Scholar]
- 24.Hudspeth AJ, Lewis RS. A model for electrical resonance and frequency tuning in saccular hair cells of the bull-frog, Rana catesbeiana. J Physiol (Lond) 1988;400:275–297. doi: 10.1113/jphysiol.1988.sp017120. [DOI] [PMC free article] [PubMed] [Google Scholar]
- 25.Hudspeth AJ, Gillespie PG. Pulling springs to tune transduction: adaptation by hair cells. Neuron. 1994;12:1–9. doi: 10.1016/0896-6273(94)90147-3. [DOI] [PubMed] [Google Scholar]
- 26.Jacobs RA, Hudspeth AJ. Ultrastructural correlates of mechanoelectrical transduction in hair cells of the bullfrog’s internal ear. Cold Spring Harbor Symp Quant Biol. 1990;LV:547–561. doi: 10.1101/sqb.1990.055.01.053. [DOI] [PubMed] [Google Scholar]
- 27.Kimitsuki T, Ohmori H. The effect of caged calcium release on the adaptation of the transduction current in chick hair cells. J Physiol (Lond) 1992;458:27–40. doi: 10.1113/jphysiol.1992.sp019404. [DOI] [PMC free article] [PubMed] [Google Scholar]
- 28.Koyama H, Lewis ER, Leverenz EL, Baird RA. Acute seismic sensitivity in the bullfrog ear. Brain Res. 1982;250:168–172. doi: 10.1016/0006-8993(82)90964-7. [DOI] [PubMed] [Google Scholar]
- 29.Kros CJ, Rüsch A, Richardson GP. Mechano-electrical transducer currents in hair cells of the cultured neonatal mouse cochlea. Proc R Soc Lond [Biol] 1992;249:185–193. doi: 10.1098/rspb.1992.0102. [DOI] [PubMed] [Google Scholar]
- 30.McBride DW, Hamill OP. A fast pressure-clamp technique for studying mechanogated channels. In: Sakmann B, Neher E, editors. Single-channel recording. Plenum; New York: 1995. pp. 329–340. [Google Scholar]
- 31.Ricci AJ, Fettiplace R. The effects of calcium buffering and cyclic AMP on mechanoelectrical transduction in turtle auditory hair cells. J Physiol (Lond) 1997;501:111–124. doi: 10.1111/j.1469-7793.1997.111bo.x. [DOI] [PMC free article] [PubMed] [Google Scholar]
- 32.Ricci AJ, Rennie KJ, Correia MJ. The delayed rectifier, IKI, is the major conductance in type I vestibular hair cells across vestibular end organs. Pflügers Arch. 1996;432:34–42. doi: 10.1007/s004240050102. [DOI] [PubMed] [Google Scholar]
- 33.Rüsch A, Eatock RA. Voltage responses of mouse utricular hair cells to injected currents. Ann NY Acad Sci. 1996a;781:71–84. doi: 10.1111/j.1749-6632.1996.tb15694.x. [DOI] [PubMed] [Google Scholar]
- 34.Rüsch A, Eatock RA. A delayed rectifier conductance in type I hair cells of the mouse utricle. J Neurophysiol. 1996b;76:995–1004. doi: 10.1152/jn.1996.76.2.995. [DOI] [PubMed] [Google Scholar]
- 35.Shepherd GM, Corey DP. The extent of adaptation in bullfrog saccular hair cells. J Neurosci. 1994;14:6217–6229. doi: 10.1523/JNEUROSCI.14-10-06217.1994. [DOI] [PMC free article] [PubMed] [Google Scholar]
- 36.Shotwell SL, Jacobs R, Hudspeth AJ. Directional sensitivity of individual vertebrate hair cells to controlled deflection of their hair bundles. Ann NY Acad Sci. 1981;374:1–10. doi: 10.1111/j.1749-6632.1981.tb30854.x. [DOI] [PubMed] [Google Scholar]
- 37.Wersäll J. Studies on the structure and innervation of the sensory epithelium of the crista ampullares in the guinea pig. Acta Otolaryngol [Suppl] 1956;126:1–85. [PubMed] [Google Scholar]
- 38.Wilson VJ, Melvill Jones G. Mammalian vestibular physiology. Plenum; New York: 1979. [Google Scholar]


