

Abstract
The basic electrical rhythmicity of the olivocerebellar system was investigated in vivo using multiple electrode recordings of Purkinje cell (PC) complex spike (CS) activity. CSs demonstrate a 10 Hz rhythmicity, thought to result from the interaction of Ca2+ and Ca2+-dependent K+conductances present in inferior olivary (IO) neurons. To assess the roles of different K+ channels in generating this rhythmicity, intraolivary microinjections of charybdotoxin (CTX) and apamin were used. Both K+ channel blockers increased average CS spike-firing rates. However, apamin produced a tonic increase in firing with a decrement in the CS rhythmicity. In contrast, after CTX administration, highly rhythmic CS discharges were interleaved with silent periods, suggesting that apamin- and CTX-sensitive K+ channels have distinct rhythmogenic roles in IO neurons. CTX-sensitive channels seem to be functionally coupled to low threshold Ca2+ channels, whereas the apamin-sensitive channels relate to high threshold Ca2+channels.
Blocking intraolivary GABAA receptors increases IO excitability and the spatial distribution of synchronized CS activity while disrupting its rostrocaudal banding pattern (Lang et al., 1996). The present experiments show that K+ channel blockers increase IO excitability without causing widespread synchronization of CS activity. Thus, changes in the IO excitability have relatively little effect in determining the spatial organization of CS synchrony. In contrast, the degree of CS rhythmicity seemed to influence the patterns of CS synchrony. Thus, after CTX, increased CS rhythmicity was associated with increased intraband synchrony and decreased interband synchrony, whereas apamin had the opposite effects on intra- and interband synchronization.
Keywords: inferior olive, multiple electrode recording, oscillations, complex spikes, calcium-dependent potassium conductance, synchrony
Increasingly, evidence is being obtained in vivo that cerebellar functions are mediated by ensembles of neurons, the activity of which is synchronized (Welsh et al., 1995). In the olivocerebellar system, this synchronization is achieved by electrotonic coupling between inferior olivary (IO) neurons (Llinás et al., 1974; Llinás and Yarom, 1981a) and is controlled by GABAergic synapses adjacent to the gap junctions within the IO glomeruli (Llinás and Sasaki, 1989; Lang et al., 1996). Whereas after cerebellar nuclear lesions synchronous activity can occur in this system in the absence of rhythmic activity (Lang et al., 1996), in most instances the two phenomena are correlated. Further, in other brain regions, highly synchronized discharges generally occur in the presence of an underlying oscillatory process. Thus, the intrinsic tendency for neuronal systems to generate oscillatory activity seems to be a mechanism that is often exploited to achieve or maintain synchronized neuronal ensembles (Llinás, 1988).
The olivocerebellar system has been demonstrated to generate rhythmic activity not only in anesthetized preparations (Armstrong et al., 1968;Crill, 1970; Bell and Kawasaki, 1972; Sasaki et al., 1989) but also during voluntary rhythmic movements in awake animals (Welsh et al., 1995). This approximately 10 Hz activity is thought to result from the interaction of intrinsic membrane conductances of IO neurons (Llinás and Yarom, 1981a,b). In particular, IO neurons have a high threshold Ca2+ conductance located in the dendrites, which generates a large depolarizing shoulder that interrupts the action potential repolarization, and is terminated by the increasing activation of voltage- and Ca2+-dependent K+[K(Ca)] conductances. These K+ conductances [particularly K(Ca)] produce an approximately 100 msec afterhyperpolarization (AHP), which in turn allows deinactivation of a somatic low threshold Ca2+ conductance. After termination of the AHP, this low threshold Ca2+ conductance can generate a rebound response, which if large enough can trigger Na+ spikes that are conducted down the axon and can, in addition, reinitiate the entire cycle (Llinás and Yarom, 1981a,b). If Na+ spikes are triggered, the oscillatory activity results in rhythmic complex spike (CS) activity at the cerebellar cortical level. Given the typical average CS firing rate of approximately 1 Hz, for any one olivary cell, intrinsic oscillations can only trigger Na+ spikes about 10% of the time under these conditions.
Autoradiographic studies have shown moderate levels of binding of both apamin and charybdotoxin (CTX) within the IO (Gehlert and Gackenheimer, 1993), suggesting the presence of K(Ca)conductances mediated by both small (SK; Blatz and Magleby, 1986) and large (BK; Marty, 1981; Pallota et al., 1981) K(Ca)channels. However, the relative importance of each of these conductances in the generation of oscillatory activity in the olivocerebellar system has yet to be investigated. We have used multiple electrode recordings of cerebellar Purkinje cell (PC) CS activity to investigate this issue in an in vivopreparation. Our results suggest that apamin- and CTX-sensitive channels have distinct roles in the generation of oscillatory activity. Some of these results have been published in preliminary form (Lang et al., 1995).
MATERIALS AND METHODS
Surgery
Extracellular recordings of CS activity were obtained from 16 female Sprague Dawley rats (250–300 gm). The rats were initially anesthetized with ketamine (100 mg/kg, i.p.), xylazine (8 mg/kg, i.p.), and atropine (0.4 mg/kg, i.p.). Supplemental doses (7 mg/kg, i.v.) of ketamine were given every 30 min starting 3 hr after the initial dose or as needed to maintain a deep level of anesthesia, as determined by monitoring of the heart rate. The rectal temperature was maintained at 36–37°C by an electric heating pad. The multiple electrode technique used in the present experiments has been described in detail previously (Sasaki et al., 1989; Sugihara et al., 1993). In brief, after anesthetization, the animal was placed in a stereotaxic apparatus and the occipital bone and the dura were removed to expose the dorsal surface of the cerebellum and medulla. A silicon rubber platform was then cemented in place over crus 2a. Each microelectrode was individually inserted, using a piezoelectric micromanipulator (Burleigh, NY), through the platform into the molecular layer of the cerebellum until CS activity could be recorded. The electrode was then released from the manipulator and held in place by the platform. Successive electrodes were inserted until a rectangular array of 8–10 rostrocaudal columns and 4–6 mediolateral rows, with an interelectrode distance of 250 μm, was completed. After electrode implantation, the threshold for each recording channel was individually set to detect the CS activity. CS activity was recorded simultaneously from 16 to 47 PCs (33.0 ± 2.4, mean ± SE) in the different experiments.
Recording and injection procedure
CSs were recorded extracellularly using glass microelectrodes with a tip diameter of 2–5 μm (5 MΩ) containing a 1:1 solution of glycerol and saline. Each session began by obtaining an approximately 10–15 min baseline recording of spontaneous CS activity. After this, in experiments where microinjections into the IO were made, an injection pipette was inserted stereotactically into the IO from the dorsal surface of the medulla while the electrical signal from the pipette tip was monitored. The presence of typical 8–12 Hz rhythmic activity, correlated with the CS activity, was used for the final determination of the pipette position. A second control period was then recorded. Pressure injections of the drug solutions (1 μl at 0.20 μl/min) were made using an air-filled syringe connected to the injection pipette via polyethylene tubing (Lang et al., 1996). All drugs were dissolved in 0.9% saline. CTX was used at a concentration of 1 μm; apamin at 60 μm.
Histology
After completion of the recording sessions, alcian blue solution (0.3 μl of 10 mg/ml in saline) was injected to mark the tip position. The animal was then perfused intracardially with saline, followed by 10% formalin. The dissected brain was immersed in 10% formalin overnight, followed by 30% sucrose formalin for 2 d. Parasagittal or coronal 60 μm sections were cut with a freezing microtome and counterstained with cresyl violet.
Multichannel recording system
The multichannel recording system has been described previously (Sasaki et al., 1989; Sugihara et al., 1993). Briefly, CS signals from all recording channels were converted to transistor–transistor–logic (TTL) pulses, stored on VCR tape, and directly transferred onto a 386-based personal computer with a 1 msec intersampling period. The data file was then transferred to a minicomputer (MicroVAX 3100, Digital Equipment) for data analysis.
Data analysis
Synchrony calculation. The degree of synchronous CS activity was determined by calculating the zero-time cross-correlation coefficient between all cell pairs, as described in detail previously (Sasaki et al., 1989; Sugihara et al., 1993; Lang et al., 1996). A time bin of 1 msec was used in this study to define synchrony. Here the terms “synchrony” or “degree of synchrony” will be used to define the level of synchronous firing, whereas the term “synchronicity” is used to refer to the spatial distribution of such synchronous activity. Whereas the cross-correlation coefficients are small in absolute terms (on the order of 0.01–0.10), these values have robust statistical significance because they are 1–2 orders of magnitude greater than expected by chance and have a nonrandom spatial distribution (Sugihara et al., 1993). Further, the possibility of spurious correlations because of the rhythmic nature of CS activity and the finiteness of our data set is unlikely because calculation of cross-correlation coefficients between cell pairs, where the interspike intervals from one of the spike trains has been randomized, yields correlations 1–2 orders of magnitude smaller (Lang et al., 1996).
Analysis of oscillation rhythm. Autocorrelation histograms were constructed for CS spike trains of single PCs with time bins of 5 or 10 msec. The oscillation frequency was taken as the reciprocal of the latency of the first peak in the autocorrelogram, whereas the strength of the oscillation was quantified with a rhythm index (RI), calculated in a similar manner to the one used by Sugihara et al. (1995). First, the baseline level of the autocorrelogram was obtained: baseline level = (total number of spikes)2/[(recording time)/(bin width)]
The SD of activity about the baseline was measured at time lags of 2000–2500 msec where oscillatory activity was largely absent and random fluctuations dominated the autocorrelograms. To be recognized, peaks and valleys in the autocorrelogram had to be greater than ± 2× SD from the baseline or the difference between a successive peak and valley had to exceed 2× SD. Further, each successive peak had to occur at a latency equal to the latency of the first peak ± 10 msec from the previous peak, whereas valleys had to occur at an interval equal to half this latency ± 10 msec. The RI was then defined by the following formula:
in which ai (i= 1,2,… ) is the absolute value of the difference between the height of the ith peak and baseline level in the autocorrelogram,bi (i = 1,2,… ) is the absolute value of the difference between the depth of theith valley and baseline level, and z was the difference between the height of the zero-time bin, which indicated the total number of spikes, and the baseline level. Note that the terms in the RI equation are equal to the absolute value of the autocorrelation coefficients at the corresponding time lags (Sugihara et al., 1995). The greater the RI, the tighter or stronger was the oscillatory activity. In the autocorrelograms that had no recognizable peaks and valleys, a value of zero was given to the RI. In these cases, or when the RI was less than 0.01, the autocorrelation was regarded as nonoscillatory, and the oscillation frequency was not determined.
RESULTS
Simultaneous extracellular recordings of CS activity were obtained from 462 crus 2a PCs. Of these, 228 were recorded before and after microinjection of either apamin or CTX into the IO. The remaining 234 were used to form a control database for characterization of CS rhythmicity. Consistent with previous descriptions (Brooks and Thach, 1981; Sasaki et al., 1989), CSs had multiphasic waveforms and were usually isolated ∼100 μm below the cerebellar surface.
Apamin and CTX increase average CS firing rate
The average CS firing rate of cells in the control database was 1.42 ± 0.05 Hz (mean ± SE, n = 234). A similar, but slightly lower, average firing rate of 1.23 ± 0.06 Hz (n = 150) was found for the control period in experiments where pipettes were inserted into the IO (Fig.1C). Injection of either apamin or CTX into the IO led to significant increases (p < 0.001) in the average firing rates from control values (Fig. 1C). Ratemeters demonstrate the changes produced by apamin (Fig.1A) and CTX (Fig. 1B) injections for two representative cells for each drug. These increases in firing rate are not a result of a nonspecific effect of the injection because, as reported previously (Lang et al., 1996), control injections of Ringer solution do not alter CS firing rates.
Fig. 1.

Apamin and CTX increase average CS firing rate. Ratemeters showing CS firing rates for two cells before and after injection of apamin (A) and for two cells before and after injection of CTX (B) into the IO. Bin widths are 10 sec. C, Average CS firing rates in control (n = 150 cells), after injection of CTX (n = 104), and after injection of apamin (n = 46). Error bars indicate ±1 SEM.
The increase in average CS firing rate by CTX and apamin was accompanied by distinct changes in the firing patterns (Fig.2). The average firing rates produced by apamin injections reflected mostly a tonic increase in activity (Fig.2A). In contrast, the increased activity after intraolivary injection of CTX resulted primarily from the appearance of 1–2 sec periods of rhythmic discharges at frequencies around 10–17 Hz, which were interleaved with silent periods (Fig.2B). Note that the CS activity from different PCs was not affected equally by the injection. Those most affected were located within the same region of the recording array. One rhythmic period is shown at an expanded scale for six strongly affected PCs in Figure3. The CS activity was synchronized across these PCs and was extremely regular, with a cycle to cycle variability on the order of only 2–4 msec. Only toward the end of the burst did more significant phase shifts start to occur. Note that no PC fired a CS during every cycle, but that even if 3–4 cycles were missed the CS of the following cycle occurred in phase.
Fig. 2.
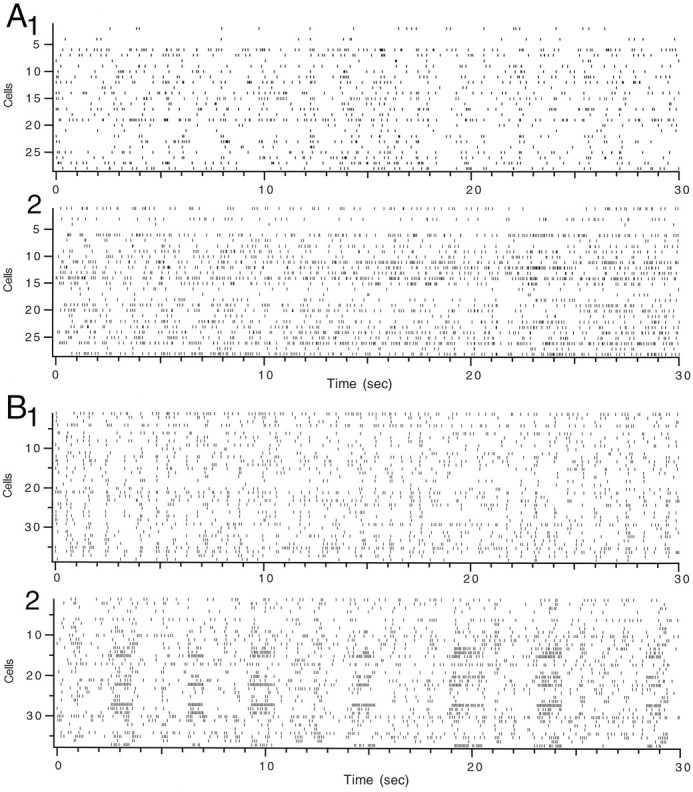
Apamin and CTX produce different patterns of CS activity. A, Rasters showing CS activity from 30 sec periods before (1) and after (2) intraolivary injection of apamin. Each horizontal rowof tick marks represents the activity from a single PC.B, Rasters of CS before (1) and after (2) a CTX injection. Note bursts of rhythmic activity separated by silent periods in some cells.
Fig. 3.

CS activity remains phase-locked during rhythmic periods. Raster from six PCs, the CS activity of which was strongly affected by CTX. The data are from the burst shown at 20 sec in Figure2B2 at a more compressed time scale.Dotted lines indicate 60 msec intervals corresponding to a 16.6 Hz oscillation frequency.
Complex spikes in crus 2a PCs display rhythmic activity
To describe more quantitatively the rhythmic tendency of CSs, autocorrelograms of CS activity from 234 PCs (n = 7 experiments) were constructed and the number of significant peaks (see Materials and Methods for definition) and the rhythm index (RI) of each was calculated. Autocorrelograms containing 1, 2, 3, and 4 significant peaks are shown in Figures 4Aa,Ab, Ac, and Ad, respectively. The RIs for these four autocorrelograms are 0.033, 0.056, 0.042, and 0.106, respectively, and span the typical range of rhythmic behavior displayed by CS activity. Histograms show the distribution of peaks (Fig.4B) and RIs (Fig. 4C) found for CS activity. On average, the autocorrelograms displayed 2.40 ± 0.08 (n = 234) peaks and had an RI of 0.042 ± 0.002 (n = 234). Note that relatively few (<2%) crus 2a PCs had nonrhythmic CS activity.
Fig. 4.

Rhythmicity of spontaneous CS activity.A, Autocorrelograms from four representative cells. These autocorrelograms had 1–4 significant peaks (a–d, respectively) and had RIs of 0.0327 (a), 0.0556 (b), 0.0417 (c), and 0.1057 (d). B, Distribution of significant peaks in autocorrelograms obtained from seven experiments (n = 234 cells) in which no intraolivary injections were made. C, RI distribution for the same cells as inB. Inset shows distribution with a narrower bin width.
Intraolivary injection of apamin decreases CS rhythmicity
Despite increasing the average CS firing rate, intraolivary injections of apamin (n = 4 experiments) consistently decreased the rhythmicity of CS activity (Fig.5). Autocorrelograms of CS activity from two PCs before (Fig. 5Aa,Ab) and after (Fig.5Ac,Ad) injection of apamin demonstrate this effect. The cell shown on the left (Fig.5Aa,Ac) had two significant peaks and an RI of 0.058 in control, but after the injection it had only one peak and its RI dropped to 0.032. Similarly the peaks dropped from three to one and the RI from 0.067 to 0.014 for the cell the autocorrelograms of which are shown on the right side of the figure.
Fig. 5.

Intraolivary injection of apamin decreases CS rhythmicity. A, Autocorrelograms of CS activity before and after intraolivary injection of apamin for two cells. The RI of the autocorrelograms for the first cell (a,c) decreased from 0.0582 (a) to 0.0319 (c), whereas for the second cell (b,d) the RI fell from 0.0669 (b) to 0.0138 (d). B, Distribution of peaks in the autocorrelograms in control (Ba) and after injection of apamin (Bb). C, Distribution of RI before (Ca) and after (Cb) injection of apamin.Insets show distribution with a finer bin width.
The autocorrelograms were normalized to equal time periods; thus, the higher baseline activity after apamin is reflective of the increased overall activity induced by the injection. Note that this relatively higher baseline and the loss of the second minor peak account for the decreased RI for the first cell (compare Fig. 5Aa and 5Ac). In the second cell, however, apamin had a much more pronounced effect, nearly abolishing even the primary peak (Fig.5Ab,Ad).
The decrease in rhythmicity induced by apamin is reflected in the leftward shifts of the population distributions of autocorrelogram peaks (Fig. 5Ba vs Bb) and RIs (Fig.5Ca vs Cb). The shift in the mean number of peaks (2.12 ± 0.16 to 1.68 ± 0.20; n = 50) was significant (p < 0.05, paired ttest), as was the decrease in the RI (0.0375 ± 0.0027 to 0.0258 ± 0.0031; n = 50; p < 0.001, paired t test). Further, the percentage of nonrhythmic cells rose from 5–6% to nearly 20% after injection of apamin (Fig. 5Ca,Cb, insets).
Intraolivary injection of CTX increases CS rhythmicity
In contrast with apamin, CTX (n = 3 experiments) greatly enhanced the rhythmicity of CS activity. Autocorrelograms before (Fig.6Aa,Ab) and after (Fig. 6Ac,Ad) an intraolivary injection of CTX demonstrate this enhancement for two cells showing the range of the effect. For the cell the autocorrelograms of which are shown on the left side of Figure 6A (Aa,Ac), CTX increased the number of peaks from one to four and the RI 6.5-fold from 0.0265 to 0.1730. In some cells, CTX had a much greater effect as demonstrated by the autocorrelograms shown on the right side of Figure6A. In control, the autocorrelogram of this cell had 2 peaks and an RI of 0.0716 (Fig. 6Ab), whereas after injection of CTX, the autocorrelogram had 16 peaks and an RI of 1.216, a 17-fold increase in the RI (Fig. 6Ad).
Fig. 6.

Intraolivary injection of CTX increases CS rhythmicity. A, Autocorrelograms from the CS activity of two cells before (a, b) and after (c, d) the injection of CTX. The RI of the first cell rose from 0.0265 to 0.173, whereas the RI of the second cell rose from 0.0716 to 1.2158. B, Distribution of number of peaks in the autocorrelograms before (Ba) and after (Bb) intraolivary injection of CTX.C, Distribution of RI before (Ca) and after (Cb) injection of CTX. Note the relatively large percentage of the population with RI > 0.5 after injection of CTX (Cb, inset).
Histograms of the peak number (Fig. 6B) and RI (Fig. 6C) distributions show the effect of CTX, as well as the variation in the extent of its effect to increase CS rhythmicity. In control (Fig. 6Ba), the mean number of peaks was 1.70 ± 0.12, whereas after intraolivary injection of CTX (Fig.6Bb), the distribution shifted to the right leading to a mean of 5.2 ± 0.54 peaks, a significant increase from the control (p < 0.001, n = 80; paired t test). A similarly pronounced effect was found for the RI, which increased from 0.0220 ± 0.0018 to 0.2680 ± 0.0502 (p < 0.001, n = 80; paired t test). In particular, whereas no autocorrelogram had an RI greater than 0.1 in control (Fig. 6Ca,inset), after CTX a significant percentage of the population had RIs greater than 0.1, including about 15% that had RIs above 0.5 (Fig. 6Cb, inset).
The spatial distribution of the effect of CTX on CS rhythmicity was not random; rather, the cells that exhibited the greatest increases tended to be clustered together (Fig. 7) and to form an ensemble the activity of which was highly synchronized (n = 3 experiments). It was not clear whether this variation in responsiveness to CTX represented true physiological variation among IO neurons or was simply an artifact resulting from some IO neurons being closer to the injection site and experiencing a higher concentration of CTX.
Fig. 7.

Spatial distribution of RI increase after CTX.A, Distribution of RI in control for an experiment in which CS activity from 47 crus 2a PCs was recorded simultaneously.B, After intraolivary injection of CTX, there is an increase in the RI throughout the array; however, it is most pronounced for PCs located on the right of the array.
Effects of CTX and apamin on the banding pattern of CS synchrony
The effect of CTX and apamin on the spatial distribution of CS synchrony was used to investigate the importance that the overall excitability and rhythmicity of IO neurons had in determining these patterns of synchrony. The basic rostrocaudal distribution of synchronized CS activity was not altered by the CTX (n= 3 experiments, 119 cells). The results of one experiment are shown in Figure 8, where the spatial distribution of synchronous CS activity of a given master cell, “M,” is plotted before (Fig.8A1) and after (Fig. 8A2) injection of CTX to the IO. This is further shown in Figure 8B, where the average zero-time cross-correlation values for the cell M are plotted as a function of mediolateral separation distance between cell M and the other cells. In both conditions, the band of high synchrony is 250 μm wide. However, injection of CTX did approximately double the intraband (<500 μm mediolateral separation) synchrony (Fig.8B) and more than halve the interband synchrony (Fig.8B, inset). Similar results were found when comparing the average zero-time cross-correlation values for all possible cell pairs (n = 903) in this experiment (Fig.8C).
Fig. 8.

Spatial distribution of CS synchrony after CTX.A, Spatial distribution of CS synchrony with respect to cell M in control (A1) and after intraolivary injection of CTX (A2). B, Cross-correlation value averaged across all cell pairs containing cell M and plotted as a function of the mediolateral distance between cell M and the second cell of the pair for control condition (open circles) and after injection of CTX (filled circles). C, Cross-correlation value averaged across all possible cell pairs and plotted as a function of the mediolateral distance between the cells for control condition and after injection of CTX. Insets in B andC show average synchrony values for mediolateral separation distances ≥500 μm with an expanded scale.D, Plot of average oscillation frequency for each of the five rostrocaudal groups of cells defined in A2.E, Plot of the SD of the mean oscillation frequency for each of the cell groups defined in A2.
Each experimental cell pair was grouped according to the mediolateral separation of the cells. If the cells were separated by ≤500 μm, the pair was considered intraband; if >500 μm, the pair was classified as interband. The average cross-correlation value for these two groups was calculated for the control condition and after CTX injection. In all experiments (n = 3), in both conditions the intraband group synchrony (control 0.0071 ± 0.0003,n = 1077 cell pairs; CTX 0.0148 ± 0.0009,n = 956 cell pairs) was significantly higher (p < 0.001) than the interband synchrony (control 0.0021 ± 0.0001, n = 1268; CTX 0.0017 ± 0.0001, n = 1109). Further, the intra-/interband synchrony ratio of 3.38 in control more than doubled after CTX to 8.71, a significant increase (p < 0.05, paired t test, n = 3 experiments). Similar increases in the intra-/interband ratio were also observed after intraolivary TEA injections (n = 3 experiments, 140 cells).
Despite increasing the excitability of IO neurons to the extent produced by CTX (as measured by the increases in average CS firing rates), apamin did not enhance the difference between intra- and interband levels of synchrony (n = 4 experiments, 109 cells). On average, the intraband synchrony was similar in control (0.0090 ± 0.0005; n = 767 cell pairs) and after apamin (0.0084 ± 0.0004, n = 506) as was interband synchrony (0.0042 ± 0.0003, n = 702 and 0.0046 ± 0.0002, n = 479). Results from a representative experiment (Fig. 9) show that apamin produced little change in the overall distribution of CS synchrony, and a slight increase in interband synchrony (Fig. 9C,arrows). Whereas overall there was little change in synchrony induced by apamin, a tendency for the intra-/interband synchrony ratio to decrease was observed for the cells where a larger change was seen (Fig. 9A,B). For example, in the cell shown in Figure9A,B, intraolivary injection of apamin degraded the banding structure.
Fig. 9.

Spatial distribution of CS synchrony after apamin. A, Spatial distribution of CS synchrony with respect to cell M in control (A1) and after intraolivary injection of apamin (A2). The area of each circle represents the degree of synchrony between the activity of the cell at that location and cell M. Interelectrode spacing is 250 μm. B, Cross-correlation value averaged across all cell pairs containing cell M and plotted as a function of the mediolateral distance between cell M and the second cell of the pair for control condition (open circles) and after injection of apamin (filled circles).C, Cross-correlation value averaged across all possible cell pairs and plotted as a function of the mediolateral distance between the cells for control condition and after injection of apamin.Arrows indicate higher synchrony after apamin at relatively larger mediolateral separation distances. D, Plot of average oscillation frequency for each of the three rostrocaudal groups of cells defined in A2.E, Plot of the SD of the mean oscillation frequency for each of the cell groups defined in A2.
Effect of apamin and CTX on variation in oscillation frequency
Previous work has demonstrated that the oscillation frequency of CS activity from PCs within the same parasagittal zone is nearly identical and different from the frequencies of neighboring zones after harmaline (Sasaki et al., 1989). Similarly, under control conditions we observed that the preferred oscillation frequency (determined from the primary peak of the autocorrelograms) for CS spike activity shifted across crus 2a with a tendency for higher frequencies to occur in more medially situated cells, as is shown in Figures 8Dand 9D where the cells were grouped into rostrocaudally oriented bands indicated by the bracketed numbers in Figures8A and 9A. However, typically there was considerable interband variability in the average oscillation frequency, which obscured this general trend. Nevertheless, when the bands were divided into medial and lateral groups, the average oscillation frequency of the medial group was greater in all experiments (1.00 ± 0.30 Hz difference; p < 0.05 paired t test, n = 6 experiments). As a further comparison, the SD of the mean frequency was calculated for each rostrocaudal column and mediolateral row of cells. On average the SD for the columns (0.96 ± 0.018, n = 50) was significantly (p < 0.001) smaller than for the rows (1.57 ± 0.048 n = 30). Thus, the oscillation frequencies are relatively more similar within a rostrocaudal band than across a similar extent of cerebellar cortex in the mediolateral direction. Injections of either apamin or CTX did not change this general tendency. However, CTX reduced the SD of the mean frequency at each point (Fig. 8E), whereas apamin generally increased the SD (Fig. 9E). Thus, for PCs located within the same rostrocaudal band, an increased degree of synchrony was associated with an increase in the strength of their rhythmicity and an increased similarity of their oscillation frequencies.
DISCUSSION
In the present investigation, intraolivary injections of apamin and CTX were combined with multiple electrode recordings of CS activity to investigate the role of different K(Ca) conductances in determining the rhythmicity of IO neurons in vivo. We demonstrated that both apamin- and CTX-sensitive channels are important factors in determining the excitability and rhythmicity of the olivocerebellar system. However, these two types of K+channels play distinct roles because intraolivary injection of apamin led to a decrease in CS rhythmicity, whereas that of CTX (or TEA; data not shown) resulted in an increase. Further, our results show that increases in rhythmicity may sharpen the banding pattern of synchronous CS activity but that the basic rostrocaudal organization is not altered by changes in the rhythmicity or overall excitability of IO neurons.
Distinct roles for different K(Ca) conductances
K(Ca) conductances can be sorted into several major classes based on their pharmacology, voltage dependence, and single channel conductance. Apamin-sensitive K(Ca) conductances, mediated by small conductance K(Ca) channels (Blatz and Magleby 1986), have been shown to contribute to the medium or intermediate AHP after an action potential in a number of different neurons, and to play a major role in determining their instantaneous firing rates (Pennefather et al., 1985; Zhang and Krnjevic, 1987;Schwindt et al., 1988; Lang and Ritchie, 1990; Viana et al., 1993). On the other hand, CTX- and TEA-sensitive K(Ca) conductances, mediated by large conductance K(Ca) channels (Marty, 1981;Pallota et al., 1981; Adams et al., 1982; Miller et al., 1985), are typically involved in action potential repolarization and contribute to the fast AHP immediately after a spike (Lang and Ritchie, 1990; Pineda et al., 1992; Sah and McLachlan, 1992; Viana et al., 1993).
K(Ca) conductances are also known to underlie rhythmic spiking in a variety of neurons (Llinás, 1988), including IO cells (Llinás and Yarom, 1981a,b) where the interaction between Ca2+ and K(Ca) conductances also underlies subthreshold membrane oscillations (Llinás and Yarom, 1986). Both apamin and CTX have binding sites within the IO (Gehlert and Gackenheimer, 1993); however, each has profoundly different effects on IO oscillatory activity, as judged by their effects on CS rhythmicity. Similarly divergent effects were obtained in nucleus reticularis thalami neurons where TEA enhanced the oscillatory behavior of these neurons, while apamin abolished it (Avanzini et al., 1989). In this case, enhancement of the rhythmicity by TEA was attributed to a facilitation of the apamin-sensitive AHP because of increased Ca2+ entry during the broadened spike, whereas loss of the oscillation after apamin was attributed to abolishment of the AHP and a resulting failure to deinactivate the channels underlying the low threshold spike (Avanzini et al., 1989).
Our results suggest that apamin acted in a similar manner to reduce the oscillatory activity of IO neurons. Thus, the reduction of CS rhythmicity by apamin was most likely a result of blockage of the K(Ca)-mediated AHP of IO neurons and a resulting failure to deinactivate the low threshold Ca2+ conductance. A decreased AHP would also increase the responsiveness of IO neurons to afferent activity, thereby increasing their overall excitability and leading to increased CS activity without the usual preferred 8–12 Hz rhythm, as was observed.
CTX enhanced CS rhythmicity; however, its effect probably was not mediated by broadening of the IO action potential because this significantly slows the frequency of the oscillation (Llinás and Yarom, 1986), whereas CTX produced relatively small changes in oscillation frequency that tended to be toward faster frequencies in the most affected cells. Instead, we propose that, in IO neurons, the CTX-sensitive conductance is active during the low threshold Ca2+ spike and acts by preventing it from bringing the membrane potential to threshold for axonic Na+ spikes, and preventing transmission of IO rhythmicity to the cerebellar cortex. Because CTX also blocks some voltage-dependent K+ channels (Dreyer, 1990), its effect might not necessarily be mediated by blockage of large conductance K(Ca) channels; nevertheless, because the low threshold Ca2+ spike does activate a K(Ca) conductance, the action of CTX is probably at least in part a result of block of this conductance.
Even during periods of sustained highly rhythmic CS discharges, transmission failures occurred (see Fig. 3). This may, in part, explain the typical 1 Hz average CS firing rate seen under normal conditions despite the underlying 8–12 Hz subthreshold oscillation present in IO neurons. Alternatively, IO neurons are known to be resettable in vitro (Llinás and Yarom, 1986) and may jump between distinct activity modes, some oscillatory, some not (Llinás and Yarom, 1986), even under in vivo conditions (Lang and Llinás, unpublished results). The factors regulating these transitions and the transmission of IO oscillatory activity to the cerebellum require further study.
Subcellular compartmentalization of K(Ca)channel subtypes
Given the spatial and temporal limits on intracellular Ca2+ diffusion, and that apamin and CTX had such divergent effects on CS rhythmicity, it is likely that these two classes of K+ channels are functionally linked to distinct Ca2+ channel populations. The effects on CS rhythmicity suggest that in IO neurons apamin-sensitive K(Ca) channels are colocalized in the dendrites with the channels mediating the high threshold Ca2+ conductance, whereas the CTX-sensitive K(Ca) channels are colocalized at the soma with the channels underlying the low threshold Ca2+ conductance. Such a pairing of distinct Ca2+ and K(Ca)conductances has been demonstrated in variety of neurons (Hounsgaard and Mintz, 1988; Gola and Crest, 1993; Robitaille et al., 1993; Sah, 1995). Moreover, in hypoglossal neurons the apamin-sensitive AHP was shown to depend on Ca2+ entry through a high threshold Ca2+ conductance (Viana et al., 1993).
The involvement of more than one K(Ca) conductance in the oscillatory cycle of IO neurons raises the possibility of multiple levels of control. Unfortunately there is currently little direct evidence concerning neurotransmitter modulation of apamin- and CTX-sensitive channels. However, several neurotransmitters are known to affect subthreshold membrane oscillations of IO neurons in vitro (Llinás and Yarom, 1986) and olivocerebellar rhythmicity in vivo (Headley et al., 1976; Sugihara et al., 1995), and it is possible that some of their effects are mediated by regulation of K(Ca) conductances.
Rhythmic CS activity alternates with periods of silence
In the present, and in a previous study (Lang et al., 1996), highly rhythmic CSs tended to occur in bursts of activity separated by silent periods. This cycling between activity and silence apparently is not related to GABAergic release because it occurred in the presence of picrotoxin (Lang et al., 1996). Nor is it simply related to overall IO activity levels because it did not occur with increases of CS activity after cerebellar nuclear lesions (Lang et al., 1996) or intraolivary apamin injections. Rather, it seems to be most closely associated with the generation of oscillatory activity. One possibility is that the resting membrane potential of IO neurons may shift to more depolarized levels during the course of rhythmic activity, possibly because of activation of an inward current, such as Ih. As the depolarization increases, less deinactivation of the low threshold Ca2+ conductance would occur and, at a point, rhythmic activity would cease. Alternatively intracellular Ca2+accumulation may produce increases in the resting K(Ca)conductance. Whatever the mechanism, it seems to happen synchronously across the network, reinforcing the proposal that IO oscillatory activity is an ensemble property (Llinás and Yarom, 1986).
Spatial organization of synchronous CS activity is not determined by excitability of IO neurons
Previous investigations have shown that synchronized CS activity tends to occur among PCs aligned into rostrocaudally oriented bands (Llinás and Sasaki, 1989; Sasaki et al., 1989; Sugihara et al., 1993; Lang et al., 1996), but that intraolivary injection of GABAA antagonists disrupts this banding pattern and leads to widespread synchronization of CS activity (Lang et al., 1996). The action of GABA is probably mediated mainly by its action at the intraglomerular synapses where it is could produce a short circuiting of the gap junction-mediated electrotonic coupling between olivary neurons (Llinás, 1974). However, because there are significant numbers of extraglomerular GABAergic synapses (Sotelo et al., 1986; de Zeeuw et al., 1989; Fredette and Mugnaini, 1991), which would primarily control the excitability of given olivary neurons but not specifically their electrotonic coupling to other neurons, and because in some systems the level of neuronal excitability may influence the degree of synchronization (Spira and Bennett, 1972), it is possible that part of the increased synchronization observed after loss or blockade of GABA (Lang et al., 1996) is a result of an increased excitability of IO neurons. The present results, however, indicate that changes in excitability of IO neurons, as reflected by the higher average CS firing rates after both apamin and CTX injections, do not have a major influence on the rostrocaudal organization of CS synchrony. Thus, they provide further, though indirect, evidence that GABA release within the olivary glomeruli is the major determinant of spatial distribution of CS synchrony.
CS synchronization may be modulated by olivary rhythmicity
Whereas increased IO excitability did not have a significant effect on CS synchrony, modification of IO rhythmicity did have a secondary influence. Thus, strengthening the rhythm of IO neurons increased the synchronization among cells the activity of which was already coupled to a certain extent, and further decreased synchronization among poorly synchronized cells. This effect seemed to result in part from the increased similarity of the oscillation frequencies among coupled cells, and is consistent with a previous finding that systemic injection of harmaline, which enhances IO rhythmicity (de Montigny and Lamarre, 1973; Llinás and Volkind, 1973), also enhances the banding pattern of CS synchrony (Sasaki et al., 1989).
Rhythmic synchronized activity of neuronal ensembles has been proposed to underlie the motor coordination functions of the olivocerebellar system (Llinás, 1991), and recent experiments have provided evidence that synchronized CS activity is related to the generation of movements (Lang et al., 1991; Welsh et al., 1995). Moreover, the importance of subthreshold oscillations in the synchronization of inputs to the IO has been demonstrated (Lampl and Yarom, 1993). By identifying the roles of different K(Ca) conductances in this oscillatory activity, we further our understanding of the processes underlying the generation of synchronized olivocerebellar outputs for motor control.
Footnotes
This work was supported by Office of Naval Research Grant N00014-93-1-0225 and National Institutes of Health Grant NS-13742.
Correspondence should be addressed to Dr. E. J. Lang or Dr. R. Llinás, Department of Physiology and Neuroscience, School of Medicine, New York University, 550 First Avenue, New York, NY 10016.
Dr. Sugihara’s present address: Department of Physiology, Tokyo Medical and Dental University, School of Medicine, 1-5-45 Yushima, Bunkyo-ku, Tokyo 113, Japan.
REFERENCES
- 1.Adams PR, Constanti A, Brown DA. Intracellular Ca2+ activates a fast voltage-sensitive K+ current in vertebrate sympathetic neurones. Nature. 1982;296:746–749. doi: 10.1038/296746a0. [DOI] [PubMed] [Google Scholar]
- 2.Armstrong DM, Eccles JC, Harvey RJ, Matthews PBC. Responses in the dorsal accessory olive of the cat to stimulation of hindlimb afferents. J Physiol (Lond) 1968;194:125–145. doi: 10.1113/jphysiol.1968.sp008398. [DOI] [PMC free article] [PubMed] [Google Scholar]
- 3.Avanzini G, de Curtis M, Panzica F, Spreafico R. Intrinsic properties of nucleus reticularis thalami neurones of the rat studied in vitro. J Physiol (Lond) 1989;416:111–122. doi: 10.1113/jphysiol.1989.sp017752. [DOI] [PMC free article] [PubMed] [Google Scholar]
- 4.Bell CC, Kawasaki T. Relations among climbing fiber responses of nearby Purkinje cells. J Neurophysiol. 1972;35:155–169. doi: 10.1152/jn.1972.35.2.155. [DOI] [PubMed] [Google Scholar]
- 5.Brooks VB, Thach WT. Cerebellar control of posture and movement. In: Brookhart JM, Mountcastle VB, editors. Handbook of physiology, Sec I, The nervous system, Vol II, Motor control. American Physiological Society; Bethesda, MD: 1981. pp. 877–946. [Google Scholar]
- 6.Blatz AL, Magleby KL. Single apamin-blocked Ca-activated K+ channels of small conductance in cultured rat skeletal muscle. Nature. 1986;323:718–720. doi: 10.1038/323718a0. [DOI] [PubMed] [Google Scholar]
- 7.Crill WE. Unitary multiple-spiked responses in cat inferior olive nucleus. J Neurophysiol. 1970;33:199–209. doi: 10.1152/jn.1970.33.2.199. [DOI] [PubMed] [Google Scholar]
- 8.de Montigny C, Lamarre Y. Rhythmic activity induced by harmaline in the olivo–cerebello–bulbar system of the cat. Brain Res. 1973;53:81–95. doi: 10.1016/0006-8993(73)90768-3. [DOI] [PubMed] [Google Scholar]
- 9.de Zeeuw CI, Holstege JC, Ruigrok TJH, Voogd J. Ultrastructural study of the GABAergic, cerebellar, and mesodiencephalic innervation of the cat medial accessory olive: anterograde tracing combined with immunocytochemistry. J Comp Neurol. 1989;284:12–35. doi: 10.1002/cne.902840103. [DOI] [PubMed] [Google Scholar]
- 10.Dreyer F. Peptide toxins and potassium channels. Rev Physiol Biochem Pharmacol. 1990;115:93–136. [PubMed] [Google Scholar]
- 11.Fredette BJ, Mugnaini E. The GABAergic cerebello–olivary projection in the rat. Anat Embryol. 1991;184:225–243. doi: 10.1007/BF01673258. [DOI] [PubMed] [Google Scholar]
- 12.Gehlert DR, Gackenheimer SL. Comparison of the distribution of binding sites for the potassium channels ligands [125I]apamin, [125I]charybdotoxin and [125I]iodoglyburide in the rat brain. Neuroscience. 1993;52:191–205. doi: 10.1016/0306-4522(93)90192-i. [DOI] [PubMed] [Google Scholar]
- 13.Gola M, Crest M. Colocalization of active KCa channels and Ca2+ channels within Ca2+ domains in helix neurons. Neuron. 1993;10:689–699. doi: 10.1016/0896-6273(93)90170-v. [DOI] [PubMed] [Google Scholar]
- 14.Headley PM, Lodge D, Duggan AW. Drug-induced rhythmical activity in the inferior olivary complex of the rat. Brain Res. 1976;101:461–478. doi: 10.1016/0006-8993(76)90471-6. [DOI] [PubMed] [Google Scholar]
- 15.Hounsgaard J, Mintz I. Calcium conductance and firing properties of spinal motoneurones in the turtle. J Physiol (Lond) 1988;398:591–603. doi: 10.1113/jphysiol.1988.sp017059. [DOI] [PMC free article] [PubMed] [Google Scholar]
- 16.Lampl I, Yarom Y. Subthreshold oscillations of the membrane potential: a functional synchronizing and timing device. J Neurophysiol. 1993;70:2181–2186. doi: 10.1152/jn.1993.70.5.2181. [DOI] [PubMed] [Google Scholar]
- 17.Lang DG, Ritchie AK. Tetraethylammonium blockade of apamin-sensitive and insensitive Ca2+-activated K+ channels in a pituitary cell line. J Physiol (Lond) 1990;425:117–132. doi: 10.1113/jphysiol.1990.sp018095. [DOI] [PMC free article] [PubMed] [Google Scholar]
- 18.Lang EJ, Sugihara I, Welsh JP, Llinás R. Multielectrode recordings of complex spike activity and their relationship to spontaneous and cortically evoked vibrissal movements in the rat. Soc Neurosci Abstr. 1991;17:920. [Google Scholar]
- 19.Lang EJ, Sugihara I, Llinás R. Differential modulation of olivary rhythmicity by the K-channel blockers apamin, charybdotoxin and TEA. Soc Neurosci Abstr. 1995;21:271. [Google Scholar]
- 20.Lang EJ, Sugihara I, Llinás R. GABAergic modulation of complex spike activity by the cerebellar nucleoolivary pathway in rat. J Neurophysiol. 1996;76:255–275. doi: 10.1152/jn.1996.76.1.255. [DOI] [PubMed] [Google Scholar]
- 21.Llinás R. Eighteenth Bowditch Lecture. Motor aspects of cerebellar control. Physiologist. 1974;17:19–46. [PubMed] [Google Scholar]
- 22.Llinás R. The intrinsic electrophysiological properties of mammalian neurons: insights into central nervous system function. Science. 1988;242:1654–1664. doi: 10.1126/science.3059497. [DOI] [PubMed] [Google Scholar]
- 23.Llinás R. The noncontinuous nature of movement execution. In: Humphrey DR, Freund H, editors. Motor control: concepts and issues. Wiley; New York: 1991. pp. 223–242. [Google Scholar]
- 24.Llinás R, Sasaki K. The functional organization of the olivo-cerebellar system as examined by multiple Purkinje cell recordings. Eur J Neurosci. 1989;1:587–602. doi: 10.1111/j.1460-9568.1989.tb00365.x. [DOI] [PubMed] [Google Scholar]
- 25.Llinás R, Volkind RA. The olivo–cerebellar system: functional properties as revealed by harmaline-induced tremor. Exp Brain Res. 1973;18:69–87. doi: 10.1007/BF00236557. [DOI] [PubMed] [Google Scholar]
- 26.Llinás R, Yarom Y. Electrophysiology of mammalian inferior olivary neurones in vitro. Different types of voltage-dependent ionic conductances. J Physiol (Lond) 1981a;315:549–567. doi: 10.1113/jphysiol.1981.sp013763. [DOI] [PMC free article] [PubMed] [Google Scholar]
- 27.Llinás R, Yarom Y. Properties and distribution of ionic conductances generating electroresponsiveness of mammalian inferior olivary neurones in vitro. J Physiol (Lond) 1981b;315:569–584. doi: 10.1113/jphysiol.1981.sp013764. [DOI] [PMC free article] [PubMed] [Google Scholar]
- 28.Llinás R, Yarom Y. Oscillatory properties of guinea pig inferior olivary neurones and their pharmacological modulation: an in vitro study. J Physiol (Lond) 1986;376:163–182. doi: 10.1113/jphysiol.1986.sp016147. [DOI] [PMC free article] [PubMed] [Google Scholar]
- 29.Llinás R, Baker R, Sotelo C. Electrotonic coupling between neurons in cat inferior olive. J Neurophysiol. 1974;37:560–571. doi: 10.1152/jn.1974.37.3.560. [DOI] [PubMed] [Google Scholar]
- 30.Marty A. Ca-dependent K channels with large unitary conductance in chromaffin cell membranes. Nature. 1981;291:497–500. doi: 10.1038/291497a0. [DOI] [PubMed] [Google Scholar]
- 31.Miller C, Moczydlowski E, Latorre R, Phillips M. Charybdotoxin, a protein inhibitor of single Ca2+-activated K+ channels from mammalian skeletal muscle. Nature. 1985;313:316–318. doi: 10.1038/313316a0. [DOI] [PubMed] [Google Scholar]
- 32.Pallota BS, Magleby KL, Barrett JN. Single channel recordings of Ca2+-activated K+ currents in rat muscle cell culture. Nature. 1981;293:471–474. doi: 10.1038/293471a0. [DOI] [PubMed] [Google Scholar]
- 33.Pennefather P, Lancaster B, Adams PR, Nicoll RA. Two distinct Ca-dependent K currents in bullfrog sympathetic ganglion cells. Proc Natl Acad Sci USA. 1985;82:3040–3044. doi: 10.1073/pnas.82.9.3040. [DOI] [PMC free article] [PubMed] [Google Scholar]
- 34.Pineda JC, Galarraga E, Bargas J, Cristancho M, Aceves J. Charybdotoxin and apamin sensitivity of the calcium-dependent repolarization and the afterhyperpolarization in neostriatal neurons. J Neurophysiol. 1992;68:287–294. doi: 10.1152/jn.1992.68.1.287. [DOI] [PubMed] [Google Scholar]
- 35.Robitaille R, Garcia ML, Kaczorowski GJ, Charlton MP. Functional colocalization of calcium and calcium-gated potassium channels in control of transmitter release. Neuron. 1993;11:645–655. doi: 10.1016/0896-6273(93)90076-4. [DOI] [PubMed] [Google Scholar]
- 36.Sah P. Different calcium channels are coupled to potassium channels with distinct physiological roles in vagal neurons. Proc R Soc Lond [Biol] 1995;260:105–111. doi: 10.1098/rspb.1995.0066. [DOI] [PubMed] [Google Scholar]
- 37.Sah P, McLachlan EM. Potassium currents contributing to action potential repolarization and the afterhyperpolarization in rat vagal motoneurons. J Neurophysiol. 1992;68:1834–1841. doi: 10.1152/jn.1992.68.5.1834. [DOI] [PubMed] [Google Scholar]
- 38.Sasaki K, Bower JM, Llinás R. Multiple Purkinje cell recording in rodent cerebellar cortex. Eur J Neurosci. 1989;1:572–586. doi: 10.1111/j.1460-9568.1989.tb00364.x. [DOI] [PubMed] [Google Scholar]
- 39.Schwindt PC, Spain WJ, Foehring RC, Stafstrom CE, Chubb MC, Crill WE. Multiple potassium conductances and their functions in neurons from cat sensorimotor cortex in vitro. J Neurophysiol. 1988;59:424–449. doi: 10.1152/jn.1988.59.2.424. [DOI] [PubMed] [Google Scholar]
- 40.Sotelo C, Gotow T, Wassef M. Localization of glutamic-acid decarboxylase immunoreactive axon terminals in the inferior olive of the rat, with special emphasis on anatomical relations between GABAergic synapses and dendrodendritic gap junctions. J Comp Neurol. 1986;252:32–50. doi: 10.1002/cne.902520103. [DOI] [PubMed] [Google Scholar]
- 41.Spira ME, Bennett MVL. Synaptic control of electrotonic coupling neurons. Brain Res. 1972;37:294–300. doi: 10.1016/0006-8993(72)90674-9. [DOI] [PubMed] [Google Scholar]
- 42.Sugihara I, Lang EJ, Llinás R. Uniform olivocerebellar conduction time underlies Purkinje cell complex spike synchronicity in the rat cerebellum. J Physiol (Lond) 1993;470:243–271. doi: 10.1113/jphysiol.1993.sp019857. [DOI] [PMC free article] [PubMed] [Google Scholar]
- 43.Sugihara I, Lang EJ, Llinás R. Serotonin modulation of inferior olivary oscillations and synchronicity: a multiple-electrode study in the rat cerebellum. Eur J Neurosci. 1995;7:521–534. doi: 10.1111/j.1460-9568.1995.tb00657.x. [DOI] [PubMed] [Google Scholar]
- 44.Viana F, Bayliss DA, Berger AJ. Multiple potassium conductances and their role in action potential repolarization and repetitive firing behavior of neonatal rat hypoglossal motoneurons. J Neurophysiol. 1993;69:2150–2163. doi: 10.1152/jn.1993.69.6.2150. [DOI] [PubMed] [Google Scholar]
- 45.Welsh JP, Lang EJ, Sugihara I, Llinás R. Dynamic organization of motor control within the olivocerebellar system. Nature. 1995;374:453–457. doi: 10.1038/374453a0. [DOI] [PubMed] [Google Scholar]
- 46.Zhang L, Krnjevic K. Apamin depresses selectively the after-hyperpolarization of cat spinal motoneurons. Neurosci Lett. 1987;74:58–62. doi: 10.1016/0304-3940(87)90051-6. [DOI] [PubMed] [Google Scholar]