

Abstract
Several subtypes of Ca2+ channel support the release of glutamate at excitatory synapses. We investigated the pattern of colocalization of these subtypes on presynaptic terminals in hippocampal cultures. N-type (conotoxin GVIA-sensitive) or P/Q-type (agatoxin IVA-sensitive) Ca2+ channels were blocked selectively, and the reduction in transmitter release probability (Pr) was measured with MK-801. The antagonists completely blocked release at some terminals, reducedPr at others, and failed to affect the remainder. In contrast, nonselective reduction of presynaptic Ca2+ influx by adding Cd2+ or lowering external Ca2+ reduced Pr uniformly at all terminals. We conclude from these results that the mixture of N-type and P/Q-type channels varies markedly between terminals on the same afferent. The distribution of Ca2+ channel subtypes was the same for high and low Pr terminals. Given that Ca2+ channel subtypes are affected differentially by neuromodulators, these findings lead to the possibility of terminal-specific modulation of synaptic function.
Keywords: calcium channel, MK-801, NMDA, quantal analysis, release probability, synaptic transmission
A key step in synaptic transmission is the entry of calcium into the presynaptic terminal via voltage-activated Ca2+ channels. Several different types of presynaptic Ca2+ channel are involved, among them the ω-conotoxin GVIA-sensitive (N-type) and the ω-agatoxin IVA-sensitive (P- or Q-type) Ca2+ channels (Dunlap et al., 1995; Tareilus and Breer, 1995; Tsien et al., 1995). Both N-type and P/Q-types of Ca2+ channel support the release of glutamate at excitatory synapses in the hippocampus (Luebke et al., 1993; Wheeler et al., 1994a; Wu and Saggau, 1994b; Scholz and Miller, 1995) and in the cerebellum (Mintz et al., 1995; Regehr and Mintz, 1994). Several lines of evidence suggest that a mixed population of Ca2+ channel subtypes coexists at individual synaptic terminals and cooperate to support neurotransmitter release (Takahashi and Momiyama, 1993;Castillo et al., 1994; Regehr and Mintz, 1994; Wheeler et al., 1994a,1996; Wu and Saggau, 1994b; Mintz et al., 1995; Reuter, 1995). The mix of subtypes may not be the same at all terminals, and it has been suggested that N-type Ca2+ channels are solely responsible for neurotransmitter release at a subset of terminals [Reuter (1995)but see Wheeler et al. (1996)]. Both N-type and P/Q-types of Ca2+ channels can be modulated differentially (Mogul et al., 1993; Wu and Saggau, 1994b; Glaum and Miller, 1995; Wu and Saggau, 1995). Thus, a nonuniform distribution of Ca2+ channel subtypes could permit selective alteration of transmitter release at groups of terminals on a single afferent, which would have important ramifications for synaptic modulation and plasticity.
We measured the distribution of the probability of glutamate release, Pr, across the presynaptic terminals on an individual axon by analyzing the progressive block of the NMDA receptor-mediated EPSC with the irreversible open-channel blocker MK-801 (Hessler et al., 1993; Rosenmund et al., 1993). The terminals had a wide range of Pr values and could be grouped into high and low Pr classes, consistent with previous observations (Hessler et al., 1993; Rosenmund et al., 1993). Pr was unaffected at a subset of terminals after selective blockade of presynaptic Ca2+channels by ω-conotoxin GVIA (ω-CTx GVIA) or ω-agatoxin IVA (ω-Aga). We conclude that the mixture of N-type and P/Q-type Ca2+ channel subtypes varies markedly from terminal to terminal, and both high and low Pr terminals have a similar mix of subtypes.
MATERIALS AND METHODS
Cell Culture. Single isolated hippocampal neurons were grown on “microdots” as previously described (Segal and Furshpan, 1990; Bekkers and Stevens, 1991). Cells were used after 11–14 d in culture.
Electrophysiology. Whole-cell patch-clamp recordings were obtained from isolated excitatory neurons, which formed autaptic synapses with abundant terminals. Patch electrodes contained (in mm): KMeSO4 125, KCl 5, EGTA 10, HEPES 10, Na2ATP 2, MgCl2 2, and GTP 0.4, pH 7.3, with osmolarity adjusted to 290 mOsm with sorbitol. The usual bath solution contained (in mm): NaCl 135, KCl 5, CaCl2 3, glucose 10, HEPES 10, and glycine 0.01, pH 7.3, with osmolarity adjusted to 310 mOsm with sorbitol. NMDA-mediated currents were isolated by adding 10 μm6-cyano-7-nitroquinoxaline-2–3-dione (CNQX; Research Biochemicals, Natick, MA) to all bath solutions. Ultra-pure NaCl and KCl salts (Johnson Matthey, Karlsruhe, Germany) were used for bath solutions to reduce possible Mg contamination; all other salts were obtained from Sigma (St. Louis, MO).
Currents were recorded by a patch-clamp amplifier (Axon Instruments, Foster City, CA), low-pass-filtered at 0.5 kHz, and digitally sampled at 1 kHz. Patch electrodes had resistances ranging from 2.0–3.5 MΩ. Series resistance was < 10 MΩ, and compensation was set at 80–90%. Neurons were voltage-clamped at −60 mV, and a 2–3 msec (ms) voltage step to 0 mV was applied at 10 s intervals, evoking an NMDA-mediated autaptic EPSC. Solutions were applied via a series of glass flow pipes, the internal diameters of which (500 μm) were larger than the diameters of the microdots; this ensured a uniform drug concentration at all autaptic contacts. Solution exchanges were made by quickly moving the flow pipes, through which solutions flowed continuously at ∼0.1 ml/min, between autaptic stimuli. To improve the signal-to-noise ratio, we usually measured NMDA EPSC currents by averaging the amplitude over a 280-msec-long window starting 20 msec after the stimulus (Rosenmund et al., 1993). Residual non-NMDA current, measured in the same way in the presence of 100 μmd-2-amino-5-phosphonovaleric acid (d-APV) at the end of each experiment, was subtracted from all EPSC measurements. In the paired-pulse experiments, 10 sweeps were averaged in each condition (with or without the second pulse), and EPSC amplitudes were measured by averaging over the range 20–40 msec after the stimulus. The amplitude of the second EPSC was found by subtracting the averaged trace without the second stimulus from that with the second stimulus. Block by toxin after 30 stimuli in MK-801 was measured by fitting exponential curves to the progressive block time courses before and after the addition of toxin and finding the difference between these fitted curves extrapolated to the point at which toxin was first added. ω-CTx GVIA was obtained from Alomone Labs (Jerusalem, Israel), and ω-Aga was a gift from Pfizer Central Research (Groton, CT). ω-Aga experiments were done in bath solutions containing cytochrome-C (Sigma) at 1 mg/ml to reduce nonspecific binding of the toxin. Control experiments showed that cytochrome-C alone had no effect. MK-801 was obtained from Research Biochemicals. All experiments were performed at room temperature (20–24°C).
Analysis. All analysis was done with Axograph (Axon Instruments). The progressive block in the presence of MK-801 was fit with a double exponential curve, using a simplex fitting algorithm to minimize χ2. Statistical comparisons were made with the Student’s t test.
Modeling. The distribution of Ca2+ channel subtypes across autaptic terminals was modeled with a number of simplifying assumptions. Terminals were divided into three classes: those with only P/Q-type channels (QQ), those with only N-type channels (NN), and those with both classes (NQ) (see Fig. 6). Each class was divided further into two subclasses with high Pror low Pr. The relative numbers of terminals in these six classes and the behavior of each class in the presence of toxin (see Discussion) could be used to predict four key experimental results (Table 1). Two experimental observations constrained the distribution of terminal classes: the percentage of high and low Pr terminals measured under control conditions (see Fig. 4) and the finding that Ca2+ channel subtypes were distributed similarly on high and lowPr terminals (see Fig. 5). These constraints meant that the model had only two free parameters: the fraction of NN terminals and the fraction of QQ terminals. The two free parameters were adjusted systematically to give the best fit between the model predictions and the corresponding experimental values (Table 1). A Monte Carlo simulation was performed to examine the sensitivity of the model predictions to errors in the exponential fits to the progressive block data. This was done by drawing random samples from a set of Gaussian distributions with the same means and SDs as each of the experimental parameters (high and low Pr; percentage of terminals with high Pr before and after ω-CTx GVIA or ω-Aga block; amplitude reduction after ω-CTx GVIA and ω-Aga block). The two free parameters in the model (fraction of NN and QQ terminals) were optimized for each set of sampled parameters. One thousand sample sets were drawn, and the means and SDs of the optimum parameters were calculated.
Fig. 6.

A simple model of a nonuniform distribution of presynaptic Ca2+ channel subtypes accounts for our data. Presynaptic terminals are assumed to be either highPr or low Pr and to contain only P/Q-type Ca2+ channels (QQ), only N-type (NN), or a mixture of the two (NQ) in the same relative proportions for both high and low Pr sites. When N-type channels are blocked by adding ω-CTx GVIA, NN-type terminals are blocked completely, QQ-type terminals are unaltered, andNQ-type terminals have theirPr either reduced or unaffected, depending on the initial Pr. A similar argument applies to the block of P/Q-type channels by ω-Aga. For further details, see Discussion. The percentages shownabove the control terminals are the estimated relative number of terminals in each category when the model was optimized to fit our data (Table 1). The pie graphs give the percentages of functional high and low Prterminals in each condition.
Table 1.
Comparison of predicted and experimental data for the model illustrated in Figure 6
| Predicted (%) | Observed (%) | |
|---|---|---|
| Amount of ω-CTx GVIA block | 37.7 | 41.2 ± 4.7 |
| Amount of ω-Aga block | 76.4 | 81.2 ± 3.2 |
| Percentage of high Pr after ω-CTx GVIA | 18.3 | 19.2 ± 4.7 |
| Percentage of highPr after ω-Aga | 5.4 | 8.4 ± 2.4 |
The percentage of terminals in each category of terminal in Figure 6 was estimated as described in Materials and Methods, and the optimal values are shown in Figure 6 for the control condition, after rounding each value by 1–2%. The unrounded optimal values were used to calculate the predicted values in the table.
Fig. 4.

Summary of the progressive block experiments shown in Figures 1, 2, 3. Error bars represent mean ± SEM;stars indicate a statistically significant difference from control (one star, p < 0.05;two stars, p < 0.02). The progressive block time constants are increased by Cd2+ but are unaffected by the toxins (A, B). The percentage of high Pr terminals is unaffected by Cd2+ but is reduced by the toxins (C), implying that the toxins cause a population shift from high Pr to lowPr terminals.
Fig. 5.
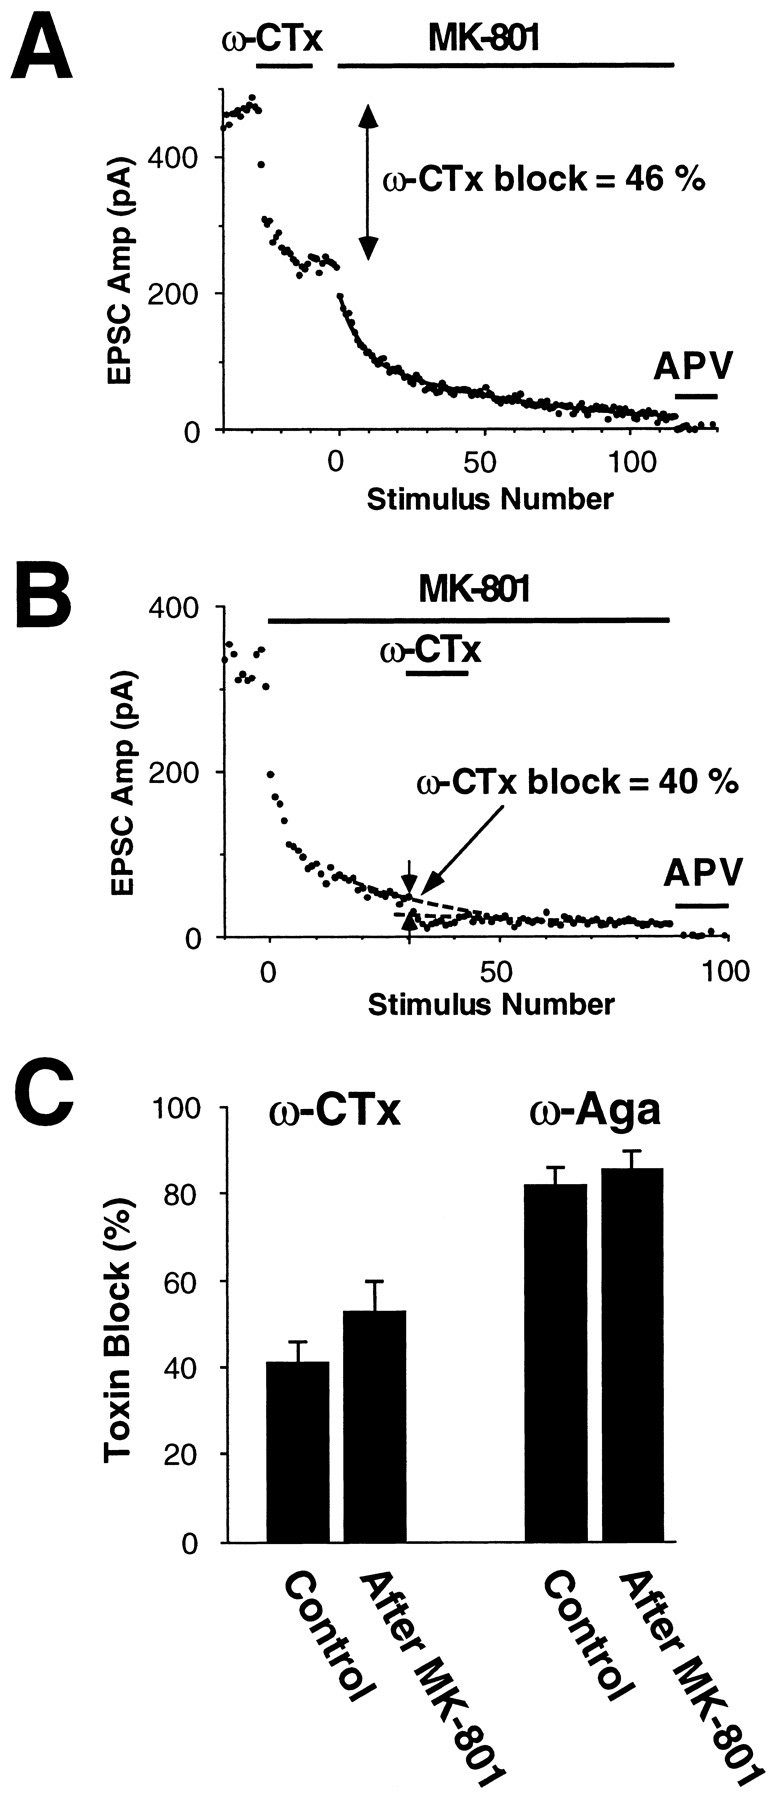
Block of NMDA EPSCs by toxin is similar in control cells (i.e., with both high and low Prterminals contributing; A) or after 30 stimuli in 2 μm MK-801 (i.e., after most highPr terminals have been masked;B). This suggests that both highPr and low Prterminals contain, on average, the same mix of presynaptic Ca2+ channel subtypes. A, B, The above experiment was performed by using 1 μm ω-CTx GVIA (ω-CTx). Each panel was obtained from a different cell. A similar protocol was used for 0.5 μm ω-Aga. C, Summary of experiments of the type shown in A andB. Error bars represent mean ± SEM. The amount of block by each toxin is not significantly different in control or after 30 stimuli in 2 μm MK-801.
RESULTS
Progressive block of NMDA EPSCs by MK-801 yieldsPr
MK-801 is an open-channel blocker of NMDA channels that is irreversible under the conditions of our experiments (Huettner and Bean, 1988). When autaptic NMDA EPSCs were evoked repeatedly at 0.1 Hz in solution lacking MK-801, their amplitudes were stable (Fig.1A, triangles; n = 3 cells). When 2 μm MK-801 was added to the external solution, stimulation at 0.1 Hz caused a progressive reduction in the amplitudes of the EPSCs (Fig. 1A, filled circles;n = 9). Examples of individual NMDA EPSCs at different time points in a typical experiment are shown in Figure1B (normalized amplitudes on the right). If the MK-801 was removed after 30 stimuli, the EPSC amplitudes were stable (Fig. 1A, open circles; n = 4), confirming the irreversibility of the block. The rate of the progressive block in MK-801 is proportional to transmitter release probability, Pr, because whenPr is high, synaptic terminals will be more likely to release glutamate and open postsynaptic NMDA channels, which, therefore, will be blocked more quickly. The utility of this technique already has been established (Hessler et al., 1993; Rosenmund et al., 1993; Manabe and Nicoll, 1994; Weisskopf and Nicoll, 1995).
Fig. 1.

Progressive block of NMDA EPSCs by the use-dependent open channel blocker MK-801 can be used to estimate the probability of glutamate release, Pr.A, Averaged normalized NMDA EPSC amplitudes plotted against stimulus number for three different kinds of experiments, shown by different symbols. Each point is the ensemble average (± SEM) across different cells. Triangles, EPSC amplitude time course in normal bath solution without MK-801, showing the stability of the EPSCs over the duration of a typical experiment (n = 3 cells). Filled circles, EPSC amplitude time course in bath solution containing 2 μmMK-801, applied at stimulus 0 and maintained until the end of the recording (n = 9). Thesuperimposed solid line is a double exponential fit, suggesting the existence of at least two groups of terminals, one with a high Pr and the other with a lowPr. Open circles, EPSC amplitude time course after the removal of MK-801 at 30 stimuli, showing that the MK-801 block is irreversible under our conditions (n = 4). B, Left, Representative NMDA EPSCs recorded from one cell in control solution (trace labeled Con) and at 1,10, and 30 stimuli after 2 μm MK-801 has been added. Stimulus artifacts have been blanked. Right, The same EPSCs normalized at their peaks, showing that their decay is faster in the presence of MK-801 and does not change with stimulus number. This confirms that a homogeneous population of NMDA channels is being activated.
The time course of the progressive block of the evoked NMDA EPSC by MK-801 is well fit by a sum of two exponentials (Fig.1A), suggesting that the population of synaptic terminals can be divided into two classes, one with a highPr and the other with a lowPr (Hessler et al., 1993; Rosenmund et al., 1993). It is likely that terminals have a continuous range ofPr values, and the criterion we used to divide them into high and low Pr categories is somewhat arbitrary. However, our general conclusions are not dependent on this classification scheme, and the double exponential fit provides a useful estimate of the range and distribution of Prvalues. The time constants of progressive block in 2 μmMK-801 were τfast = 8.9 ± 1.1 stimuli and τslow = 56.3 ± 5.1 stimuli (mean ± SEM;n = 9). Assuming a standard kinetic model for the NMDA channel (Rosenmund et al., 1993), these correspond toPr (high) = 0.32 ± 0.06 andPr (low) = 0.05 ± 0.01 (n= 6), similar to values reported elsewhere (Hessler et al., 1993;Rosenmund et al., 1993). The areas under the two fitted exponentials give the relative number of terminals in the high and lowPr categories (Hessler et al., 1993; Rosenmund et al., 1993). In control conditions high Prterminals constituted 36.1 ± 6.2% of the total (n = 9).
Three lines of evidence confirm that the progressive block of NMDA EPSCs by MK-801 measures Pr. (1) Adding Cd2+ (3.5 μm) to the bath reduced NMDA EPSC amplitudes by 52 ± 2.4% (n = 8), presumably by nonselectively blocking presynaptic voltage-activated Ca2+channels (Fig. 2A, left) (Sather et al., 1993; Zhang et al., 1993), although there is also a small postsynaptic blocking effect on the NMDA channel (∼7%; Mayer et al., 1989). Progressive block rates in MK-801 were slowed approximately twofold by Cd2+: τfast = 19.1 ± 2.7 and τslow = 96.5 ± 12.4 (n = 8) (Fig.2A, right). This corresponds to a reduction ofPr by 53 and 42% at high and lowPr terminals, respectively. The percentage of high Pr terminals was unchanged at 34.9 ± 6.0% (compare with 36.1% in control). (2) Reducing the external calcium concentration to 1.5 mm reduced NMDA EPSC amplitudes by 38 ± 3% (n = 5) and slowed the progressive block rates: τfast = 14.9 ± 1.0 and τslow = 77.2 ± 10.0 (n = 5). This corresponds to a reduction of Pr by 40 and 28% at high and low Pr terminals, respectively. The percentage of high Pr terminals was unchanged at 37.2 ± 3.7% (compare with 36.1% in control). These data confirm previous results (Rosenmund et al., 1993; Manabe and Nicoll, 1994). (3) A standard way to detect a modulation of averagePr is to measure a change in paired-pulse facilitation or depression (Martin, 1977). After 30 stimuli in MK-801 most high Pr terminals should be masked (Fig.1A), thereby reducing the Praveraged across all terminals contributing to the EPSC. Paired-pulse depression (70 ms interstimulus interval) was measured in drug-free external solution after 30 stimuli had been applied in MK-801 and was reduced by 31.3 ± 7.5% as compared with control (p < 0.05; n = 7) (Fig.2B). This confirms the expected reduction in averagePr.
Fig. 2.

Control experiments confirm that MK-801 block measures Pr. A, Nonselective partial blockade of presynaptic Ca2+ currents by Cd2+ uniformly reduces Pr at both high and low Pr terminals.Left, Representative time course plot for one experiment, showing the block caused by Cd2+ (3.5 μm) and MK-801 (2 μm). Periods of drug application are indicated by horizontal bars. At the end of the experiment 100 μmd-APV was added, completely blocking the current and confirming that these were pure NMDA EPSCs. Right, Normalized progressive block plots averaged as in Figure 1A (n = 8 cells). The superimposed solid line is a double exponential fit with time constants shown in the inset; the dashed line is the control fit from Figure1A. Both block time constants are twice the corresponding control values (Fig. 1A), indicating a uniform halving of Pr by this concentration of Cd2+. B, Paired-pulse depression, which reflects Pr averaged across functioning terminals, is reduced after most highPr terminals have been masked by applying 30 stimuli in 2 μm MK-801. All traces are averages of 10 sweeps and were obtained from the same cell in drug-free external solution before (left) and after (right) the stimuli in MK-801. The interstimulus interval was 70 msec. Stimulus artifacts were not blanked.
ω CTx GVIA and ω-Aga affectPr nonuniformly
Having shown that nonspecific reduction of Ca2+currents uniformly decreased Pr, we next explored the effect of selective blockade of calcium channel subtypes by ω-CTx GVIA or ω-Aga. When N-type calcium channels were irreversibly blocked by ω-CTx GVIA (1 μm) (Williams et al., 1992; Fujita et al., 1993), the NMDA EPSC amplitude was reduced by 41.2 ± 4.7% (Fig. 3A, left;n = 9), but there was no change in the time constants for the progressive block in 2 μm MK-801: τfast = 7.3 ± 1.3 and τslow = 50.1 ± 4.9 (Fig. 3A, right; n = 8). A postsynaptic effect of ω-CTx GVIA on NMDA receptors was excluded, because both NMDA- and AMPA-mediated EPSCs were reduced by the same amount on application of the toxin (n = 3; data not shown). Also, a presynaptic effect of ω-CTx GVIA on the action potential has been ruled out by Wheeler et al. (1995). Because τfast was unchanged by ω-CTx GVIA, some functional highPr terminals remained after ω-CTx GVIA block. However, the percentage of these terminals was reduced to 19.2 ± 4.7% (compare with 36.1% in control), suggesting that some were shifted from the high to low Pr class.
Fig. 3.

Selective blockade of different Ca2+channel subtypes by ω-CTx GVIA (ω-CTx; A) orω-Aga (B) has little effect on progressive block time constants but reduces the proportion of highPr terminals. Left panels, Representative time course plots for individual experiments.Horizontal bars show the periods of application of ω-CTx GVIA (1 μm), ω-Aga (0.5 μm), MK-801 (2 μm), and d-APV (100 μm). The progressive block in B(left) is shown expanded in the inset.Right panels, Normalized progressive block plots averaged as in Figure 1A (n = 8 in A; n = 4 in B). The superimposed solid line in each panel is a double exponential fit with time constants shown in the inset; the dashed line is the control fit from Figure1A. The fitted time constants are similar to control, but the area under the fast component, which gives the proportion of high Pr terminals, is reduced.
Can this shift from high to low Pr terminals explain the 41.2% average amplitude reduction in ω-CTx GVIA? The mean EPSC amplitude, IEPSC, that is produced by a fraction, fH, of terminals with highPr (Pr,H) and a fraction,fL (= 1 − fH), of terminals with low Pr(Pr,L) is given by IEPSC=Ni(fHPr,H+ fLPr,L), in whichN is the total number of functional terminals andi is the unitary current. If N and iare unaffected by ω-CTx GVIA, then substitution of the values forPr,H, Pr,L,fH, and fL measured before and after ω-CTx GVIA predicts an amplitude reduction by the toxin of only 30%. Because ω-CTx GVIA does not have a postsynaptic effect on i, the additional 10% of block must be attributable to a reduction in N. Thus, a shift from the high to low Pr class alone cannot account for the observed amplitude reduction, and ω-CTx GVIA must block transmitter release completely from some terminals.
ω-Aga at higher concentrations (>100 nm) is thought to block both P- and Q-type Ca2+ channels in the hippocampus (Wheeler et al., 1994a, 1996; Scholz and Miller, 1995). We used the toxin at 0.5 μm and therefore refer to ω-Aga-sensitive channels as P/Q-type channels. In our autaptic culture preparation the block by ω-Aga was reversible, so the toxin had to be present throughout the experiment (Fig. 3B, left). ω-Aga (0.5 μm) blocked the NMDA EPSC amplitude by 81.2 ± 3.2% (n = 5) with no significant change in the progressive block time constants in 2 μm MK-801: τfast= 5.2 ± 1.6 and τslow = 63.2 ± 15.8 (n = 4; Fig. 3B, right). Again, this suggests that release probability was unaltered at some terminals. The percentage of high Pr terminals was reduced by ω-Aga to 8.4 ± 2.4% (compare with 36.1% in control). This reduction predicts a block by ω-Aga of ∼50%, compared with the observed 81% block. So, by the same argument as was used for ω-CTx GVIA, transmitter release from some terminals must be blocked completely by ω-Aga.
ω-CTx GVIA (1 μm) added together with ω-Aga (0.5 μm) blocked NMDA EPSCs by 98.6 ± 0.4% (n = 5), suggesting that N-, P-, and Q-type Ca2+ channels predominantly mediate excitatory synaptic transmission in hippocampal cultures (see also Wheeler et al., 1994a,1996).
Results for selective and nonselective Ca2+ channel blockers are summarized and compared in Figure 4. Nonselective block by Cd2+ reduced release probability at all terminals (Fig. 4A,B) but did not alter the fraction of high and low Pr terminals (Fig.4C). In contrast, selective block by ω-CTx GVIA or ω-Aga did not alter release probability at some terminals (Fig.4A,B) but reduced the percentage of highPr terminals (Fig. 4C). These results suggest that the selective toxins completely blocked release from some terminals, converted some terminals from the high to lowPr class, and left the remainder unaffected. This implies a nonuniform distribution of N- and P/Q-type channels across presynaptic terminals.
Paired-pulse depression gives an average measure ofPr
Paired-pulse facilitation and depression reflect the averagePr of all terminals contributing to an EPSC (Martin, 1977), in contrast to the finer detail aboutPr at subclasses of terminals provided by the MK-801 technique. Cd2+ (3.5 μm) reduced paired-pulse depression by 30.0 ± 5.1% as compared with control (n = 10), whereas ω-CTx reduced it by 26.0 ± 7.0% (n = 5; data not shown). Thus, the average measure of Pr provided by paired-pulse depression was similar for both Cd2+ and ω-CTx GVIA, consistent with their similar reduction of EPSC amplitude (52 and 41%, respectively). In contrast, the MK-801 technique revealed very different effects of Cd2+ and ω-CTx GVIA on high and lowPr terminals (Fig. 4).
High Pr and low Prterminals do not correlate with Ca2+ channel subtypes
After 30 stimuli in 2 μm MK-801, ∼97% of highPr terminals are masked (Fig.1A), leaving a residual EPSC generated by an almost pure population of low Pr terminals. If transmitter releases at these low Pr terminals were mediated preferentially by N-type Ca2+ channels, the residual EPSC would be more sensitive to block by ω-CTx GVIA than the control EPSC. The converse would be true if N-type channels were found preferentially on high Pr terminals. A similar argument applies for P/Q-type Ca2+ channels. After 30 stimuli in MK-801, the amount of block was not significantly different from control for both ω-CTx GVIA (53.1 ± 6.5%,n = 6; compare with 41.2 ± 4.7% for control,n = 9) and ω-Aga (85.5 ± 4%, n= 6; compare with 81.2 ± 3.2% for control, n = 5) (Fig. 5). Thus, Ca2+ channel subtypes are distributed similarly on both high and low Prterminals.
DISCUSSION
We have used the MK-801 technique to examine the probability of release of glutamate from synaptic terminals after inhibiting presynaptic Ca2+ influx in one of two different ways: (1) nonselectively, by lowering the extracellular Ca2+concentration or adding Cd2+, and (2) selectively, by adding ω-CTx GVIA to block N-type Ca2+ channels or ω-Aga to block P/Q-type Ca2+ channels. Cd2+and low Ca2+ uniformly reduced Pr at all terminals while not affecting the proportions of high and lowPr sites (Fig. 4). In contrast, the selective toxins had a highly nonuniform effect on Pr. They had no effect on a subset of terminals, converted some from high to low Pr, and completely blocked the remainder (Fig. 4). These results demonstrate that Ca2+ channel subtypes are not distributed uniformly across presynaptic terminals, even those that originate from the same axon. The amount of block by ω-CTx GVIA and ω-Aga was unaltered after most of the highPr sites were masked by MK-801, suggesting that the pattern of colocalization of Ca2+ channel subtypes is similar for high and low Pr terminals. Thus, the functional distinction between high and low Prterminals cannot be explained by the nonuniform distribution of Ca2+ channel subtypes and instead may have a structural or biochemical basis (Greengard et al., 1993; Harris and Sultan, 1995). In future experiments it will be important to confirm these conclusions for in situ hippocampal tissue.
Modeling the effect of toxins on Pr
How is it possible to maintain Pr in a proportion of synaptic terminals after blocking a subset of Ca2+ channels with either ω-CTx GVIA or ω-Aga? One mechanism is that each terminal contains only N- or only P/Q-type channels. In this case application of a toxin would remove selected terminals completely, reducing EPSC amplitude but not alteringPr for the terminals that remain. This can be ruled out because of supra-additivity of blockade of neurotransmission by ω-CTx GVIA and ω-Aga. The amplitude reduction produced by each toxin sums to 122% (see Results), consistent with previous observations (Mintz et al., 1995; Wheeler et al., 1996) and suggesting that at some terminals N-type and P/Q-type channels cooperate to support transmitter release. To account for both supra-additivity and the maintenance of Pr in the presence of toxins, some terminals must contain mixtures of Ca2+ channel subtypes, but others must contain only one or the other subtype. This model is shown schematically in Figure 6. The fraction of terminals in each class was estimated from the experimental results (see Materials and Methods; also see below).
The model is based on three assumptions. (1) When ω-CTx GVIA is applied, pure N-type terminals in both the highPr and low Pr categories will be blocked completely because no Ca2+ can enter. Similarly, pure P/Q-type terminals will be blocked completely by ω-Aga. (2) When ω-CTx GVIA is applied, highPr terminals that contain both N- and P/Q-type channels will be shifted to the low Pr class, because blockade of N-type channels will reduce the net presynaptic Ca2+ influx. A similar situation applies for ω-Aga. (3) Low Pr terminals that contain both N- and P/Q-type channels will not be blocked completely by either toxin but will remain in the low Pr class, although perhaps with reduced Pr. No reduction inPr was detected at low Prterminals, but a small shift may have been obscured by the highPr terminals that switched to the lowPr class after toxin block. Our analytical approach estimates the average Pr for each class and lacks the resolution to detect an altered distribution within the low Pr class.
The model incorporating the above three assumptions (Fig. 6) gives an accurate quantitative description of all aspects of the data. A simplex fit of the model to the data (see Materials and Methods) gave the following values for the fractions of different terminal types (mean ± SD): 8.2 ± 3.6% (NN), 46.9 ± 6.2% (QQ), and 44.8 ± 8.6% (QN). The model explains the amount of block produced by ω-Aga and ω-CTx GVIA and their supra-additivity (Table1). It also explains how the toxins reduce the percentage of highPr sites while leaving release probabilities unaltered (Table 1). Together these results suggest that ∼10% of terminals contain only functional N-type channels, ∼45% only functional P/Q-type channels, and the remaining 45% a mixture of both types. N-, P-, and Q-type channels dominate neurotransmission in our system (see Results; see also Wheeler et al., 1994b; Scholz and Miller, 1995), and L-type channels are known not to be involved (Wheeler et al., 1996). It is possible that another Ca2+ channel subtype is present and is responsible for the residual 1.4% of the EPSC in ω-Aga plus ω-CTx GVIA (see Results; Wu and Saggau, 1994b;Mintz et al., 1995); however, the functional importance of this channel may be minor (Wheeler et al., 1996). The model could be made more realistic by postulating a continuum of Prvalues and Ca2+ channel ratios and a graded effect of toxin blockade on each terminal. However, this would not greatly improve the fit to the data, would introduce excessive free parameters, and would reduce conceptual clarity. The simple model in Figure 6 predicts the details of a nonuniform distribution that is consistent with all of the data.
Other evidence for a nonuniform distribution of Ca2+ channels
Reuter (1995) has shown that the distribution of presynaptic N-type channels is nonuniform in culture by using the dye FM1–43 to monitor exocytosis. At some terminals exocytosis was blocked entirely by ω-CTx GVIA, whereas at others it was blocked only partially. ω-Aga did not show this heterogeneity, partially blocking all terminals to a small extent. These results qualitatively agree with ours for ω-CTx GVIA but not for ω-Aga. There are two possible explanations for the discrepancy. (1) Reuter (1995) used a lower concentration of ω-Aga (80 nm), which completely blocks P-type channels (Mintz et al., 1992) but is much less effective at blocking the Q-type channel (Wheeler et al., 1994a; Scholz and Miller, 1995). We used ω-Aga at 500 nm, which blocks both P- and Q-type channels effectively. It is possible that the altered progressive block we observe in ω-Aga is attributable primarily to Q-type channels, which Reuter would not have observed. (2) Reuter’s experiments gave no information about possible differences between inhibitory and excitatory terminals, whereas our autapse experiments ensured that a pure population of excitatory terminals was studied.
Wheeler et al. (1996) have taken a different approach to this question. When presynaptic Ca2+ influx was increased by prolonging the action potential with 4-aminopyridine (4-AP), they found that block of synaptic transmission by ω-CTx GVIA was reduced from 46% in control to 9% in 4-AP. From this they concluded that a significant fraction of terminals cannot rely solely on N-type channels for neurotransmitter release. Although they did not set quantitative limits on this statement, their conclusion is in general agreement with our result, which suggests that there are ∼10% pure N-type terminals (Fig. 6). Presumably this 10% of terminals is involved in the residual 9% block by ω-CTx GVIA in 4-AP (Wheeler et al., 1996). Interestingly, Wheeler et al. (1996) found that 4-AP was much less effective at reducing the block of transmission by ω-Aga (from 95 to 74%). Although they did not discuss this result, it is consistent with our suggestion that there are many more pure P/Q-type than pure N-type terminals. The results of Wheeler et al. (1996) show that manipulations to vary presynaptic Ca2+ influx affect the sensitivity of synaptic transmission to toxin block. Our toxin experiments were all done at one Ca2+ concentration (3 mm). It would be important to explore the role of presynaptic Ca2+ influx by repeating them at other concentrations.
Functional implications of a nonuniform distribution of Ca2+ channels
N-type and P/Q-type Ca2+ channels presumably are synthesized in the cell body, transported along the axon to presynaptic terminals, and then inserted into the membrane close to vesicle release sites. If this process is random and there are many Ca2+channels per terminal, then all terminals should have both channel subtypes. The existence of terminals in which only one type of Ca2+ channel is functional may be explained in two ways. The first possibility is that Ca2+ channel subtypes are targeted to specific terminals, either by directed transport along the axon or by selective insertion at the terminal. The second possibility is that all terminals are nonselective and that Ca2+channel subtypes are inserted randomly, but only a few Ca2+channels are functional at a given terminal (Stanley, 1993). The resultant binomial distribution of channels automatically would produce some terminals with exclusively N-type or P/Q-type channels.
Excitatory synaptic terminals arising from a single axon have a nonuniform distribution of Ca2+ channel subtypes. In addition, their size, structure, and release probability vary markedly from terminal to terminal (Hessler et al., 1993; Rosenmund et al., 1993; Sorra and Harris, 1993). What could be the physiological importance of this heterogeneity? A definitive answer to this question will depend on the mechanisms underlying the heterogeneity. However, one possibility might be to enable terminal-specific modulation. Neuromodulators can affect specific Ca2+ channel subtypes differently (Mogul et al., 1993; Wu and Saggau, 1994a; Tsien et al., 1995; Scholz and Miller, 1996). Thus, modulators that are diffusely present in the brain could acquire specificity because of the nonuniform distribution of the channels they modulate. A neuroprotective role also may be postulated. In the presence of toxins or other insults, a subset of terminals with a fortuitous combination of properties may continue to function normally. Thus, the heterogeneity of presynaptic terminals may make synaptic transmission more robust while creating rich possibilities for neuromodulation.
Footnotes
This work was supported by a grant from the Clive and Vera Ramaciotti Foundations (J.M.B.) and by a Queen Elizabeth II Fellowship from the Australian Research Council (J.D.C.). C.A.R. was supported by a PhD scholarship from the John Curtin School of Medical Research. We thank Steve Redman, Pankaj Sah, and Greg Stuart for helpful discussions and comments on this manuscript. We are grateful to Pfizer Central Research for its generous gift of ω-agatoxin IVA.
Correspondence should be addressed to Dr. John M. Bekkers, Division of Neuroscience, John Curtin School of Medical Research, GPO Box 334, Canberra, ACT 2601, Australia.
REFERENCES
- 1.Bekkers JM, Stevens CF. Excitatory and inhibitory autaptic currents in isolated hippocampal neurons maintained in cell culture. Proc Natl Acad Sci USA. 1991;88:7834–7838. doi: 10.1073/pnas.88.17.7834. [DOI] [PMC free article] [PubMed] [Google Scholar]
- 2.Castillo PE, Weisskopf MG, Nicoll RA. The role of Ca2+ channels in hippocampal mossy fiber synaptic transmission and long-term potentiation. Neuron. 1994;12:261–269. doi: 10.1016/0896-6273(94)90269-0. [DOI] [PubMed] [Google Scholar]
- 3.Dunlap K, Luebke JI, Turner TJ. Exocytotic Ca2+ channels in mammalian central neurons. Trends Neurosci. 1995;18:89–98. [PubMed] [Google Scholar]
- 4.Fujita Y, Mynlieff M, Dirksen RT, Kim MS, Niidome T, Nakai J, Friedrich T, Iwabe N, Miyata T, Furuichi T, Furutama D, Mikoshiba K, Mori Y, Beam KG. Primary structure and functional expression of the omega-conotoxin-sensitive N-type calcium channel from rabbit brain. Neuron. 1993;10:585–598. doi: 10.1016/0896-6273(93)90162-k. [DOI] [PubMed] [Google Scholar]
- 5.Glaum SR, Miller RJ. Presynaptic metabotropic glutamate receptors modulate omega-conotoxin-GVIA-insensitive calcium channels in the rat medulla. Neuropharmacology. 1995;34:953–964. doi: 10.1016/0028-3908(95)00076-i. [DOI] [PubMed] [Google Scholar]
- 6.Greengard P, Valtorta F, Czernik AJ, Benfenati F. Synaptic vesicle phosphoproteins and regulation of synaptic function. Science. 1993;259:780–785. doi: 10.1126/science.8430330. [DOI] [PubMed] [Google Scholar]
- 7.Harris KM, Sultan P. Variation in the number, location, and size of synaptic vesicles provides an anatomical basis for the nonuniform probability of release at hippocampal CA1 synapses. Neuropharmacology. 1995;34:1387–1395. doi: 10.1016/0028-3908(95)00142-s. [DOI] [PubMed] [Google Scholar]
- 8.Hessler NA, Shirke AM, Malinow R. The probability of transmitter release at a mammalian central synapse. Nature. 1993;366:569–572. doi: 10.1038/366569a0. [DOI] [PubMed] [Google Scholar]
- 9.Huettner JE, Bean BP. Block of N-methyl-d-aspartate-activated current by the anticonvulsant MK-801: selective binding to open channels. Proc Natl Acad Sci USA. 1988;85:1307–1311. doi: 10.1073/pnas.85.4.1307. [DOI] [PMC free article] [PubMed] [Google Scholar]
- 10.Luebke JI, Dunlap K, Turner TJ. Multiple calcium channel types control glutamatergic synaptic transmission in the hippocampus. Neuron. 1993;11:895–902. doi: 10.1016/0896-6273(93)90119-c. [DOI] [PubMed] [Google Scholar]
- 11.Manabe T, Nicoll RA. Long-term potentiation: evidence against an increase in transmitter release probability in the CA1 region of the hippocampus. Science. 1994;265:1888–1892. doi: 10.1126/science.7916483. [DOI] [PubMed] [Google Scholar]
- 12.Martin AR. Junctional transmission. II. Presynaptic mechanisms. In: Kandel ER, editor. Handbook of physiology, Sec 1, The nervous system. American Physiological Society; Bethesda, MD: 1977. pp. 329–355. [Google Scholar]
- 13.Mayer ML, Vyklicky JL, Westbrook GL. Modulation of excitatory amino acid receptors by group IIB metal cations in cultured mouse hippocampal neurones. J Physiol (Lond) 1989;415:329–350. doi: 10.1113/jphysiol.1989.sp017724. [DOI] [PMC free article] [PubMed] [Google Scholar]
- 14.Mintz IM, Venema VJ, Swiderek KM, Lee TD, Bean BP, Adams ME. P-type calcium channels blocked by the spider toxin omega-Aga-IVA. Nature. 1992;355:827–829. doi: 10.1038/355827a0. [DOI] [PubMed] [Google Scholar]
- 15.Mintz IM, Sabatini BL, Regehr WG. Calcium control of transmitter release at a cerebellar synapse. Neuron. 1995;15:675–688. doi: 10.1016/0896-6273(95)90155-8. [DOI] [PubMed] [Google Scholar]
- 16.Mogul DJ, Adams ME, Fox AP. Differential activation of adenosine receptors decreases N-type but potentiates P-type Ca2+ current in hippocampal CA3 neurons. Neuron. 1993;10:327–334. doi: 10.1016/0896-6273(93)90322-i. [DOI] [PubMed] [Google Scholar]
- 17.Regehr WG, Mintz IM. Participation of multiple calcium channel types in transmission at single climbing fiber to Purkinje cell synapses. Neuron. 1994;12:605–613. doi: 10.1016/0896-6273(94)90216-x. [DOI] [PubMed] [Google Scholar]
- 18.Reuter H. Measurements of exocytosis from single presynaptic nerve terminals reveal heterogeneous inhibition by Ca2+ channel blockers. Neuron. 1995;14:773–779. doi: 10.1016/0896-6273(95)90221-x. [DOI] [PubMed] [Google Scholar]
- 19.Rosenmund C, Clements JD, Westbrook GL. Nonuniform probability of glutamate release at a hippocampal synapse. Science. 1993;262:754–757. doi: 10.1126/science.7901909. [DOI] [PubMed] [Google Scholar]
- 20.Sather WA, Tanabe T, Zhang JF, Mori Y, Adams ME, Tsien RW. Distinctive biophysical and pharmacological properties of class A (BI) calcium channel alpha 1 subunits. Neuron. 1993;11:291–303. doi: 10.1016/0896-6273(93)90185-t. [DOI] [PubMed] [Google Scholar]
- 21.Scholz KP, Miller RJ. Developmental changes in presynaptic calcium channels coupled to glutamate release in cultured rat hippocampal neurons. J Neurosci. 1995;15:4612–4617. doi: 10.1523/JNEUROSCI.15-06-04612.1995. [DOI] [PMC free article] [PubMed] [Google Scholar]
- 22.Scholz KP, Miller RJ. Presynaptic inhibition at excitatory hippocampal synapses: development and role of presynaptic Ca2+ channels. J Neurophysiol. 1996;76:39–46. doi: 10.1152/jn.1996.76.1.39. [DOI] [PubMed] [Google Scholar]
- 23.Segal MM, Furshpan EJ. Epileptiform activity in microcultures containing small numbers of hippocampal neurons. J Neurophysiol. 1990;64:1390–1399. doi: 10.1152/jn.1990.64.5.1390. [DOI] [PubMed] [Google Scholar]
- 24.Sorra KE, Harris KM. Occurrence and three-dimensional structure of multiple synapses between individual radiatum axons and their target pyramidal cells in hippocampal area CA1. J Neurosci. 1993;13:3736–3748. doi: 10.1523/JNEUROSCI.13-09-03736.1993. [DOI] [PMC free article] [PubMed] [Google Scholar]
- 25.Stanley EF. Single calcium channels and acetylcholine release at a presynaptic nerve terminal. Neuron. 1993;11:1007–1011. doi: 10.1016/0896-6273(93)90214-c. [DOI] [PubMed] [Google Scholar]
- 26.Takahashi T, Momiyama A. Different types of calcium channels mediate central synaptic transmission. Nature. 1993;366:156–158. doi: 10.1038/366156a0. [DOI] [PubMed] [Google Scholar]
- 27.Tareilus E, Breer H. Presynaptic calcium channels: pharmacology and regulation. Neurochem Int. 1995;26:539–558. doi: 10.1016/0197-0186(94)00149-o. [DOI] [PubMed] [Google Scholar]
- 28.Tsien RW, Lipscombe D, Madison D, Bley K, Fox A. Reflections on Ca2+ channel diversity, 1988-1994. Trends Neurosci. 1995;18:52–54. [PubMed] [Google Scholar]
- 29.Weisskopf MG, Nicoll RA. Presynaptic changes during mossy fibre LTP revealed by NMDA receptor-mediated synaptic responses. Nature. 1995;376:256–259. doi: 10.1038/376256a0. [DOI] [PubMed] [Google Scholar]
- 30.Wheeler DB, Randall A, Tsien RW. Roles of N-type and Q-type Ca2+ channels in supporting hippocampal synaptic transmission. Science. 1994a;264:107–111. doi: 10.1126/science.7832825. [DOI] [PubMed] [Google Scholar]
- 31.Wheeler DB, Sather WA, Randall A, Tsien RW. Distinctive properties of a neuronal calcium channel and its contribution to excitatory synaptic transmission in the central nervous system. Adv Second Messenger Phosphoprotein Res. 1994b;29:155–171. doi: 10.1016/s1040-7952(06)80014-5. [DOI] [PubMed] [Google Scholar]
- 32.Wheeler DB, Randall A, Tsien RW. Changes in action potential duration alter reliance of excitatory synaptic transmission on multiple types of Ca2+ channels in rat hippocampus. J Neurosci. 1996;16:2226–2237. doi: 10.1523/JNEUROSCI.16-07-02226.1996. [DOI] [PMC free article] [PubMed] [Google Scholar]
- 33.Williams ME, Brust PF, Feldman DH, Patthi S, Simerson S, Maroufi A, McCue AF, Velicelebi G, Ellis SB, Harpold MM. Structure and functional expression of an omega-conotoxin-sensitive human N-type calcium channel. Science. 1992;257:389–395. doi: 10.1126/science.1321501. [DOI] [PubMed] [Google Scholar]
- 34.Wu LG, Saggau P. Adenosine inhibits evoked synaptic transmission primarily by reducing presynaptic calcium influx in area CA1 of hippocampus. Neuron. 1994a;12:1139–1148. doi: 10.1016/0896-6273(94)90321-2. [DOI] [PubMed] [Google Scholar]
- 35.Wu LG, Saggau P. Pharmacological identification of two types of presynaptic voltage-dependent calcium channels at CA3–CA1 synapses of the hippocampus. J Neurosci. 1994b;14:5613–5622. doi: 10.1523/JNEUROSCI.14-09-05613.1994. [DOI] [PMC free article] [PubMed] [Google Scholar]
- 36.Wu LG, Saggau P. GABAB receptor-mediated presynaptic inhibition in guinea-pig hippocampus is caused by reduction of presynaptic Ca2+ influx. J Physiol (Lond) 1995;485:649–657. doi: 10.1113/jphysiol.1995.sp020759. [DOI] [PMC free article] [PubMed] [Google Scholar]
- 37.Zhang J-F, Randall AD, Ellinor PT, Horne WA, Sather WA, Tanabe T, Schwarz TL, Tsien RW. Distinctive pharmacology and kinetics of cloned neuronal Ca2+ channels and their possible counterparts in mammalian CNS neurons. Neuropharmacology. 1993;32:1075–1088. doi: 10.1016/0028-3908(93)90003-l. [DOI] [PubMed] [Google Scholar]