

Abstract
Thalamocortical neuronal oscillations underlie various field potentials that are expressed in the neocortex, including sleep spindles and high voltage spike-and-wave patterns (HVSs). The mechanism of extracellular current generation in the neocortex was studied in the anesthetized and awake rat. Field potentials and unit activity were recorded simultaneously along trajectories perpendicular to the cortical layers at spatial intervals of 100 μm by multiple-site recording silicon probes. Current source density (CSD) analysis revealed that the spatial positions of sinks in layers IV, V–VI, and II–III and of the accompanying sources were similar during sleep spindles, HVSs, and thalamic-evoked responses, although their relative strengths and timings differed. The magnitude and relative timing of the multiple pairs of sinks and sources determined the amplitude variability of HVSs and sleep spindles. The presence of temporally shifted dipoles was also supported by the time distribution of unit discharges in different layers. Putative interneurons discharged with repetitive bursts of 300–500 Hz. The spike component of HVSs was associated with fast field oscillations (400–600 Hz “ripples”). Discharges of pyramidal cells were phase-locked to the ripples. These findings indicate that the major extracellular currents underlying sleep spindles, HVSs, and evoked responses result from activation of intracortical circuitries. We hypothesize that the fast field ripples reflect summed IPSPs in pyramidal cells resulting from the high frequency barrage of interneurons.
Keywords: oscillation, petit mal epilepsy, interneurons, field potential, EEG, membrane currents, thalamocortical system
Two conspicuous low-frequency (<15 Hz) rhythms, sleep spindles and spike-and-wave discharges, are associated with the thalamocortical system (Steriade et al., 1993). It is widely accepted that the source of rhythm generation for both patterns is the interplay between the GABAergic reticular nucleus and the corticopetal nuclei of the thalamus (Steriade et al., 1985;Buzsáki et al., 1988). It is less clear, however, whether synaptic currents of the thalamocortical afferents can fully account for these rhythms or whether intracortical circuitries are significantly involved in the generation of extracellular currents underlying sleep spindles and spike-and-wave rhythms (Jasper and Stefanis, 1965). These issues have typically been approached by studying the plasticity of thalamocortical responses in anesthetized animals. Initially, the “recruiting” response, evoked by repetitive stimulation of intralaminar thalamic nuclei, was thought to be the evoked equivalent of spontaneous spindle waves and spike-and-wave patterns (Demsey and Morison, 1942; Morison and Demsey, 1942; Jasper and Drooglever-Fortuyn, 1947; Clare and Bishop, 1956; Ralston and Ajmone-Marsan, 1956). Other studies, however, have suggested that spindle waves are more similar to the “augmenting” response, a pattern evoked by repetitive simulation of sensorimotor thalamic nuclei (Spencer and Brookhart, 1961a,b; Morin and Steriade, 1981). This distinction may be critical because the recruiting and augmenting responses have different voltage-versus-depth profiles in the cortex. Topical or systemic application of GABA receptor agonists and antagonists has also been used to investigate spontaneous spindles and spike-and-wave rhythms (Andersen and Andersson, 1968; Fisher and Prince, 1977; Kostopoulos et al., 1981; Steriade and Llinás, 1988).
To investigate the cellular–synaptic generation of physiologically relevant cortical potentials, it is necessary to localize precisely the current sinks and sources in the awake, drug-free animal. However, studying the laminar distribution of spontaneous electrical rhythms with a single electrode is difficult because of the significant variability of the rhythms in amplitude, frequency, and location during successive events. Multiple-site recordings with equally spaced electrodes (Bragin et al., 1995; Ylinen et al., 1995) may alleviate this difficulty. In the studies reported below, we used high-resolution multiple-site silicon probes for the continuous analysis of current source density (CSD) and unit activity to reveal the contribution of various factors that may be responsible for the cellular–synaptic generation of sleep spindles and spike-and-wave patterns. For the investigation of spike-and-wave patterns, rat strains with a high incidence of these patterns were used. Generalized neocortical high voltage spike-and-wave spindles (HVSs) in rodents form a widely accepted animal model of the electrogenesis, pharmacological profile, and inheritance of human idiopathic, generalized spike-and-wave (absence or petit mal) epilepsy (Noebels, 1984; Gloor and Fariello, 1988; Buzsáki et al., 1990; Peeters et al., 1990; Marescaux et al., 1992; Jandó et al., 1995; Vadász et al., 1995). Interpretation of the extracellular field and unit observations was aided further by comparing the spontaneous rhythms with evoked potentials in response to stimulation of various thalamic nuclei.
MATERIALS AND METHODS
Subjects and surgery. Sixty-six male and female rats of the WAG/Rij strain (Harlan Sprague Dawley) and eight rats of the F1 cross of Fischer 344 and Brown Norway strains (Harlan Sprague Dawley, Indianapolis, IN) were used. Previous studies have shown an exceptionally high incidence of HVSs in these strains (Peeters et al., 1990; Jandó et al., 1995). The rats were anesthetized with a mixture (4 ml/kg) of ketamine (25 mg/ml), xylazine (1.3 mg/ml), and acepromazine (0.25 mg/ml).
For the simultaneous recording of field potentials and unit activity in different locations and cortical layers, two types of recording electrodes were used: tungsten wire electrodes and multiple-site recording silicon probes. Wire electrodes (three 50 or 20 μm tungsten wires, “triodes”) were inserted into fused silica tubes (150 μm outer diameter) with ∼2.5 mm of wire protruding. The wires had a vertical tip separation of 50–250 μm and a lateral separation of 150 μm. Silicon probes were micromachined with thin film technology (Ylinen et al., 1995). The 16 recording sites in the silicon probe were 100 μm from each other in the vertical plane (80 μm wide at the base, narrowing to 15 μm at the tip). A 2 × 1-mm slot was drilled into the skull above the somatosensory cortex. Special care was taken to avoid damaging the dura or heating the neocortex during the drilling procedure. The dura was pierced under a surgical microscope, and the wire electrodes or the silicon probe were inserted through this small dura slit. The wire triodes and the 16 site silicon probes were attached to a small movable microdrive that was fixed to the skull of the rat. The microdrive allowed gradual movement of the electrodes to the desired position during the experiment. The most shallow electrode of the wire triodes was placed on the surface of the brain. The silicon probe was lowered such that eight recording sites were in the brain (i.e., 800 μm below the surface) at the time of surgery. In addition to the movable electrodes, two stainless steel epidural screw electrodes (0.5 mm in diameter), inserted into the bone bilaterally (anteroposterior, 0.0 mm; lateral, ±4.5 mm; anteroposterior, 2.5 mm; lateral, ±2.5 mm), were used to record cortical field potentials. In all rats, two additional stainless steel screw electrodes were driven into the bone covering the cerebellum and served as ground and indifferent electrodes. All electrodes were attached to male pins that were secured in a rectangular six-by-four array and fixed with dental acrylic.
Stimulating electrodes, fabricated from an array of two to six 60 μm tungsten wires, were inserted into one or more of the following thalamic structures, ipsilateral to the recording electrodes: nucleus (n.) ventralis posterolateralis (VPL; anteroposterior, −2.8 mm; lateral, ±2.5 mm; and ventral, 6–8 mm); n. ventralis lateralis (VL; anteroposterior, −2.8 mm; lateral, ±1.5 mm; and ventral, 5.8 mm); and n. centralis medialis (CeM; anteroposterior, 2.8 mm; lateral, ±0.5 mm; and ventral, 5.0 mm). In some cases, the stimulating electrodes were implanted bilaterally.
Recording and stimulation. Five four-channel MOSFET input operational amplifiers, mounted in the female connector, served to eliminate cable movement artifacts (Buzsáki et al., 1989). Physiological data were typically recorded as wide band (1 Hz–5 kHz for units and field) or as filtered (1–500 Hz) potentials after amplification (24 channel Grass model 12). The analog signals were sampled at 10 or 1 kHz/channel, respectively, with 12 bit precision. The data were stored on optical disks. All analysis was performed off-line on a 486/66 MHz PC and/or IBM RS 6000 computer. Unit activity and field activity were separated by 120 dB digital filters (0.5–5 kHz and 1–500 Hz, respectively). The various aspects of the field potentials (e.g., positive or negative peaks) were detected by a peak-searching algorithm, and the derived pulses served as reference signals for the construction of averages and cross-correlograms. Unit activity was detected by a window discriminator program. In many cases, large amplitude single units could be discriminated, determined by the refractory periods in the spike autocorrelograms. However, in most cases, unit histograms were constructed from several neighboring neurons, corresponding to extracellular action potentials with amplitudes greater than twice the background noise. Cortical-evoked potentials were induced by single 0.1-msec-wide pulses delivered to various thalamic nuclei.
CSD analysis. Large amplitude field potentials can be recorded from all layers of the cortex. Part of these voltage traces is often attributable to volume conduction from distant current generators. Thus, voltage traces are not always reliable for tracing the structural sources of the field events. CSD analysis provides a more precise localization for the origin of extracellular currents (Freeman and Nicholson, 1975; Mitzdorf, 1985). The current that flows into the cells across an increased membrane conductance (an active inward current or sink) will exit at adjacent, inactive parts of the membrane (passive outward current or source) to return to the site of current entry by way of diverse paths through the extracellular medium. Conversely, active outward currents, generated by decreased membrane conductance, will create inward currents at the inactive parts of the membrane (passive sinks) by way of the extracellular return current. When extracellular potentials are measured simultaneously at various depths, the CSD derivatives of the voltage traces allow for the continuous monitoring of the exact anatomical locations of sinks and sources. For the construction of CSD plots (CSD vs time), electroencephalogram (EEG) patterns (spike-and-wave complexes and sleep spindles) were averaged (n = 10–200). Isotropy of the extracellular space in the neocortex was assumed (cf. Mitzdorf, 1985), although some resistivity differences may be present in the different cortical layers. These inhomogeneities may modify the magnitude but not the depth location of the current generators. The results are presented as the unscaled second derivative of potential as a function of depth (Bragin et al., 1995; Ylinen et al., 1995). Although the arbitrary values of the sink–source magnitude are consistent across the various patterns in the same figure, they may differ in the various experiments. The exact anatomical layers corresponding to the vertical scale of the CSD maps were reconstructed with the aid of the histologically identified recording tracks and thalamic-evoked potentials. Sinks and sources of the currents associated with the activation of the thalamocortical afferents provided precise landmarks for the identification of the recording sites (Castro-Alamancos and Connors, 1996a).
Histological procedures. Once testing was completed, the animals were perfused with the microelectrodes still in place. The rats were deeply anesthetized with Nembutal (60 mg/kg) and perfused through the heart first with physiological saline and then with 4% paraformaldehyde. Brains were removed, post-fixed in paraformaldehyde, sectioned at 60 μm on a vibratome, and stained with cresyl violet or the Gallyas method (Gallyas et al., 1993) to verify the location of the recording and stimulating electrodes. In some experiments, lesions were made via the stimulating electrodes by passing 20 μA positive current for 20 sec. The rat was killed 2 d later.
RESULTS
Thalamic-evoked responses
Stimulation of the various thalamic nuclei served two purposes. First, the thalamic-evoked responses provided a precise “on-line” depth calibration of the recording electrodes. Second, the depth profiles of the various components of the evoked potentials could be compared with those of the HVSs and sleep spindles for assessing the similarities and differences between the evoked and spontaneous patterns (Figs. 1,2).
Fig. 1.
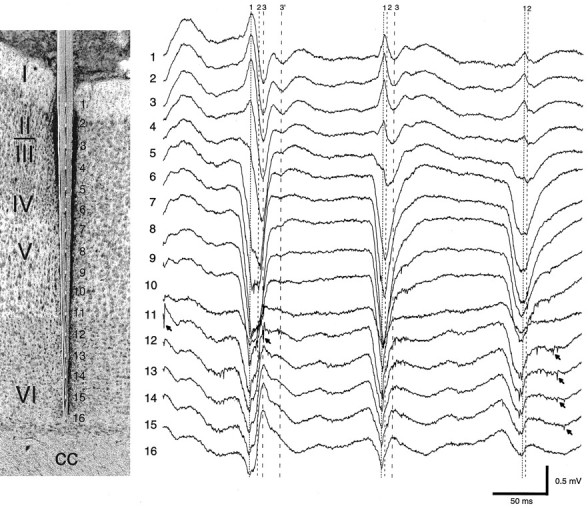
Multiple-site recording of field and unit activity in the awake rat. Histological section, The in situ location of the silicon probe and the recording sites in relation to the different cortical layers of the somatosensory area.Traces 1–16 (1 Hz–5 kHz), Three cycles of an HVS episode. Vertical lines indicate the presence of three putative dipoles contributing to the spike component of the HVS: dipole1, early surface-positive component; dipole 2, maximum negative potential in layer IV; and dipole 3, delayed surface-negative component. Dipole 3′ was occasionally observed as a separate event. Note both temporal and amplitude variation of the dipoles during successive spike-and-wave events. Arrows denote unit activity. cc, Corpus callosum.
Fig. 2.
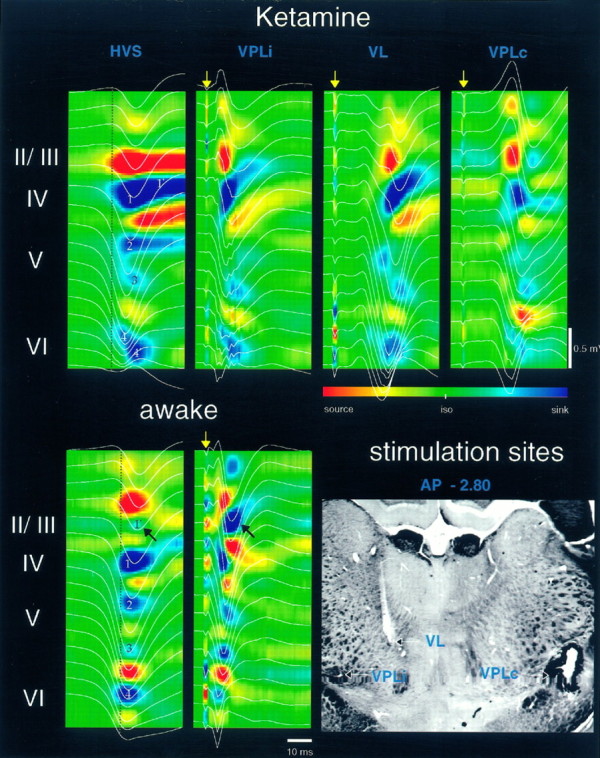
Voltage versus depth profiles superimposed onto CSD maps of HVSs and thalamic-evoked responses in rats under ketamine anesthesia and in the awake rat. The 16-site recording probe was located in the somatosensory area. The approximate positions of the different layers are indicated left of the CSD maps. Note the overall similarity of the major sinks and sources of the averaged HVSs (n = 50) and evoked responses (n = 8). Major sinks are numbered (1–4 in HVSs). Vertical dashed lineshelp identify the earliest sinks and sources. VPLi, Primary response; VL and VPLc, augmenting responses 200 msec after the primary response (data not shown). InVL, weak early sinks can be identified in layers VI and V, followed by major sinks at locations similar to those of sinks in the other CSD maps. Delayed sinks in layers II and III are marked byblack arrows. Stimulating sites are shown in thehistological section (arrows). The tip of the ipsilateral VPL (VPLi) was two sections (120 μm) posterior to the VL site. An electrolytic lesion was produced at the contralateral VPL (VPLc) stimulating site. Voltage and current calibrations are identical in all panels.iso, Baseline isopotential. Yellow arrows, Thalamic stimulus.
Several distinct components of the evoked potentials could be distinguished in response to stimulation of the various thalamic nuclei. The individual components showed different amplitude versus depth profiles, suggesting that these components were generated by different synapses and in different layers. The latency of the earliest component in the somatosensory cortex in response to VPL stimulation varied from 1.0 to 1.6 msec. Simultaneous unit recordings with field potentials revealed no relationship between cell discharges and this earliest component in deep layers of the neocortex, suggesting that this spike-like potential corresponded to synchronous discharge of the presynaptic thalamocortical fibers. The presynaptic fiber response was followed by several postsynaptic components (Spencer and Brookhart, 1961a; Morin and Steriade, 1981). At strong stimulation intensities, these components tended to blend into a relatively smoothly rising response. Nevertheless, the multiple-component nature of the postsynaptic response was evident even in the averaged potentials (Fig.2). The amplitude of evoked potential to VPL stimulation was largest in layer IV, but its latency was slightly shorter in layers V–VI (Fig.3). During the peak of the large negative potential in layer IV, the polarity of the response was positive in layer VI. Multiple-site recording and CSD analysis revealed sinks in both layer IV and layers V and VI, in agreement with a previous study in the rat (Castro-Alamancos and Connors, 1996a). The sinks in layers V–VI occurred simultaneously or even slightly earlier than the sink in layer IV in both the anesthetized and awake animal (Fig. 2,VPLi). Shortly after the onset, the sink in layer IV shifted toward layer III. Current sources of various magnitude were associated with the sinks. The largest source was present in layers II–III, and the latency of this source was often shorter than that of the sink in the neighboring layer IV. This observation suggested that at least part of the source current in layers II–III reflected an active inward (presumably inhibitory) current, in addition to the passive return current associated with the layer IV sink.
Fig. 3.

Localization of amplitude maxima of HVSs and evoked potentials. A, Traces1–3 are averages of HVSs (n = 100) and evoked potentials in response to VPL and CeM stimulation (n = 8). B, The histological section indicates the tips of the recording electrodes 1–3 (20 μm tungsten wires). The amplitude maxima of both HVSs and VPL-evoked potentials were found in layer IV. Note that at these depth levels (1, 2, and 3) the CeM-evoked response was already fully reversed in phase, suggesting that current generators responsible for this response are more superficial to the VPL-induced potential.
Double pulse stimulation (50–200 msec) delivered to various thalamic sites resulted in augmentation of the evoked responses. Augmentation of the second response was also present in the absence of the presynaptic fiber potential. Differences in latency as well as in voltage-versus-depth profiles were consistently observed for the early part of the primary responses evoked from the various thalamic sites (Castro-Alamancos and Connors, 1996a). However, the distribution of sinks and sources in the main part of the primary response and the augmented response was remarkably similar, independent of whether the responses were evoked from the VL, VPL, CeM, centralis lateralis (CL), or even the contralateral VL or VPL (Fig. 2). In the absence of known contralateral projection of thalamocortical cells, evoked potentials to contralateral thalamic stimulation should reflect disynaptic activation of the callosal projections. The similarity of the major sinks and sources during the primary response and those responses evoked by polysynaptic activation indicated that a large portion of both the primary and augmented responses is caused by intracortical activity rather than simply reflecting the concerted firing of the thalamocortical afferents.
Single stimuli often induced a late potential (>100 msec; Fig.4) with a depth profile that was identical to that of the augmented response (data not shown; seeCastro-Alamancos and Connors, 1996b). Augmentation of the evoked response by a second stimulus was observed only before this late potential, as reported in the anesthetized cat previously (Morin and Steriade, 1981). When the second stimulus coincided with the onset of the late potential, the evoked response could be completely blocked. The peak latency of the late potential (300–400 msec in the anesthetized rat) was always longer than the average interval between the spike components of spontaneously occurring HVSs (see below). In the awake immobile animal, the duration of the late response was shorter (200 msec at the peak). Often an even earlier response was present at 100 msec. Observation of individual responses indicated that the two late responses (100 msec vs 200 msec) competed with each other. A large early response (100 msec) blocked the later potential. Conversely, large later potentials (200 msec) occurred when the 100 msec component was small or absent. The average interval between the spike components of HVSs in the awake rat was longer than the late response of 100 msec but shorter than the late response of 200 msec (Fig. 4B).
Fig. 4.
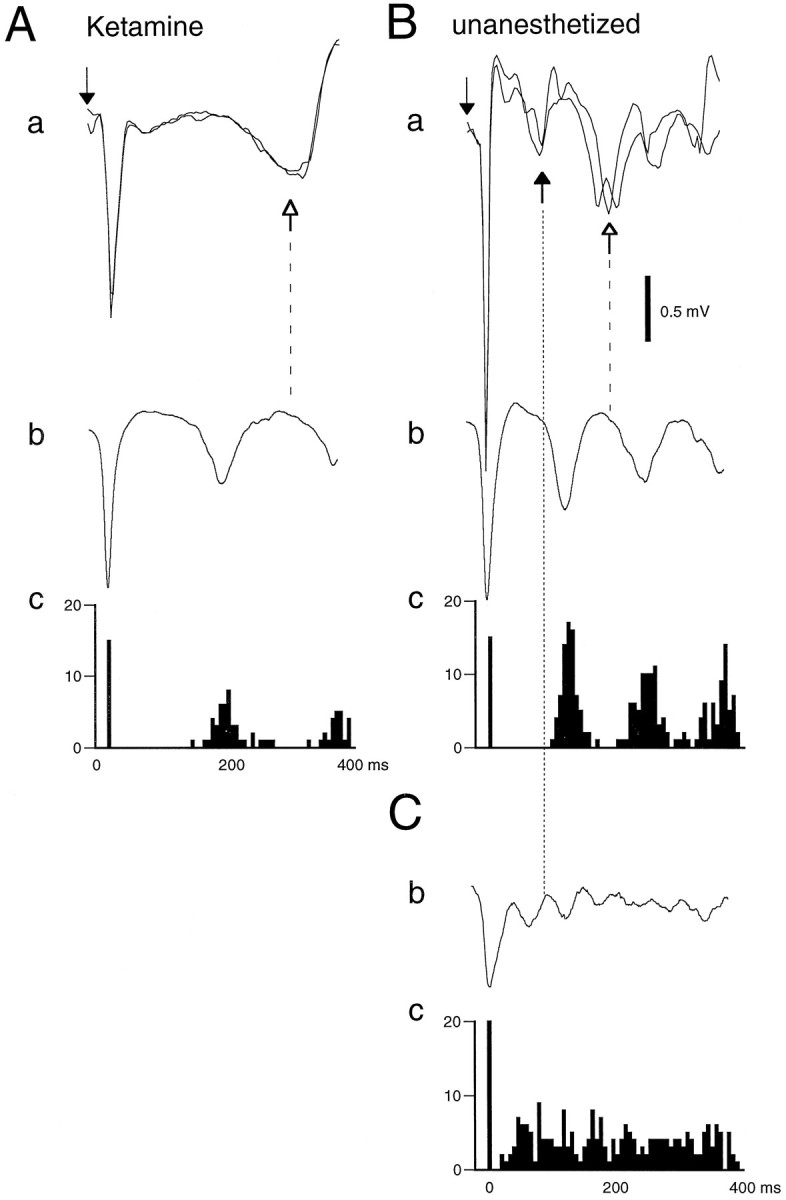
Relationship between thalamic stimulation-induced late potential and HVSs and sleep spindles in the anesthetized (Ketamine) and awake rat. A,a, Two superimposed averages (n = 8) of VPL-evoked responses. Open arrow with dashed line, late potential. b, Averaged HVSs (n = 50). c, Interval histogram of the spike components of HVSs. Note that the average interspike interval is shorter than the latency of peak negativity of the late potential.B, a–c, Same rat used inA analyzed under the same conditions in the unanesthetized state. a, Black andopen arrows with dotted and dashed lines; Late potentials at ∼ 100 and 200 msec, respectively. Note that in the unanesthetized animal both the interspike interval and the latency of the late potential (200 msec) were shorter. C, Averaged sleep spindle (b) and interpeak interval histogram (c) of the sleep spindles. Note that the interpeak interval is shorter than the latency of the first late potential (100 msec). Downward arrows, Thalamic stimulus.
Relationship between thalamic-evoked responses and HVSs
HVSs consisted of a rhythmic series of spike and wave components in the EEG. In agreement with previous reports, HVSs occurred in the immobile or sleeping rat (Jandó et al., 1995). They were never present during active movement and very rarely during deep stages of sleep. The intraepisodic frequency of HVSs in the awake immobile rat varied from 6.5–9.5 Hz and was significantly faster than the frequency of HVSs in the anesthetized animal (2–6 Hz), which decreased with increasing levels of narcosis.
Rats implanted with wire triode electrodes were used to find the precise location of the phase reversal and/or amplitude maximum of the evoked responses and HVSs. The triode was moved stepwise into the cortex with 100 μm increments, and at each depth evoked responses and spontaneously occurring HVSs were recorded. Once the amplitude maximum or phase reversal of the response was located by the deepest electrode, the triode was lowered further so that the middle or the shallow electrode was positioned at the depth of the maximum negativity or the polarity reversal zone of the evoked response or the spike component of the HVS. The rat’s brain was perfused with the electrodes in situ, and the exact locations of the electrode tips were reconstructed from serial sections of the stained brain (Fig. 3). These experiments indicated that the amplitude maxima of the VPL-evoked responses and the spike component of the HVS were located in layer IV (n = 17 rats). The polarity reversal of both the evoked response and the spike portion of the HVS occurred 100–300 μm below the maximum negativity of the potential.
Chronically implanted multiple-site recording silicon probes allowed us to compare the depth distribution of spontaneous and evoked voltage traces repeatedly in the same animal and to relate the field potentials to simultaneously recorded unit activity (n = 12 rats). The depth distribution of the pairs of sinks and sources associated with the HVSs was remarkably similar to the patterns of the augmented evoked responses (Fig. 2). During HVSs, the strongest sink was observed in layer IV (Fig. 2, sink 1), but other sinks were present in layers V (sinks 2 and 3) and VI (sink 4). In the anesthetized rat, the sink in layer IV moved upward (sink 1′), within 10 msec of its initial onset, whereas the sink in layer VI moved downward (sink 4′). The sink in layer VI (sink 4) drew its current from above and below. The positions of sink–source pairs in layers II–IV and VI during HVSs were quite similar to those of the evoked responses. Even the relative intensities of the sinks and sources were somewhat similar. The major difference between the spontaneous and evoked events was the location and intensity of sinks in layer V. For example, the sinks in layer V (sinks 2 and 3) were either not pronounced or were at a slightly different location during the evoked response. Even when both sinks were present, their relative timing differed from that observed during HVSs. As seen in the evoked responses, a strong and early source was present in layers II–III with an onset latency similar to that of the earliest sink in layer VI. The distributions of sink–source pairs of both HVSs and evoked responses were similar in the anesthetized and awake rat. A major difference was the emergence of a spatially separate sink in layers II–III (Fig. 2, arrow in awake) 5–10 msec after the sink in layer IV. This additional, delayed sink in the awake rat was also apparent in the evoked responses (Fig. 2, sink 1′ inawake).
Intracortical generators of HVSs
Although the average waveforms of HVSs were similar across different animals, the depth profiles of individual events varied even within the same HVS episode. Visual inspection of the successive events revealed subtypes of HVSs. In the first type, the spike component was initially positive on the surface (Fig. 1, dipole 1; Fig.5, ppHVS, pHVS), whereas the second type had an initial surface-negative component (Fig.5, nnHVS, nHVS). When the surface-positive component was present, it was always the earliest change in the development of the spike component of the HVS. The short duration, positive potential in layers I–III was associated with an early negative potential peak in layers V–VI (Fig. 1, dipole 1; Fig. 5,ppHVS). These voltage changes were reflected by the earliest sink in layers V–VI and a source in layers II–III. The relative amplitude of these components and the corresponding magnitude of the sinks and sources varied within these two broad types of HVSs. In the simplest case, a negative wave with an amplitude maximum in layer IV was present without a clear-cut polarity reversal (Fig. 5,nHVS). Such HVS episodes were poorly expressed in the superficial layers of the cortex. The CSD plot revealed a single major sink in layer IV coupled with a source in layers II–III.
Fig. 5.
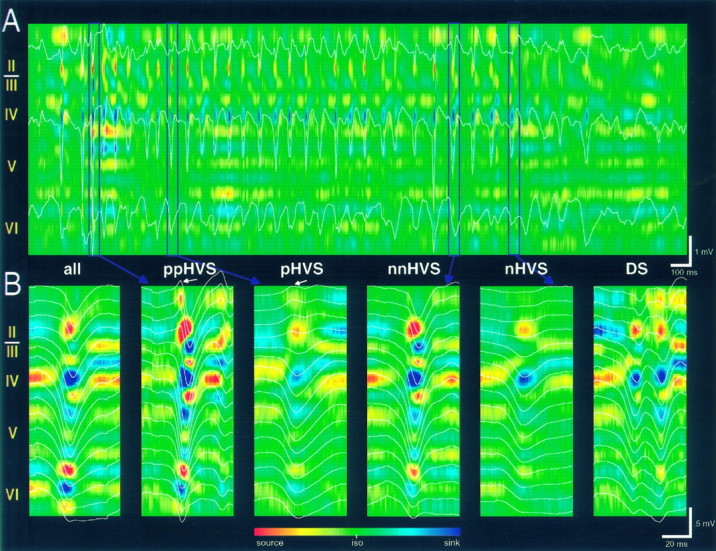
Variations in the voltage-versus-depth profiles and CSD maps of HVSs in the awake rat. A, CSD map of a single HVS episode (3 sec sweep). The superimposed field traces were recorded from layers II, IV, and VI, respectively. Note the consistent presence of the layer IV sink but the large variability of sinks and sources at other depth locations. B, Selected averages of HVS traces and corresponding CSD maps. all, Averages of 200 successive events; ppHVS, average HVS with prominent surface-positive spike component; pHVS, average HVS with less pronounced surface-positive component;nnHVS, average HVS with dominant surface-negative spike component and large sink in layers II–III; nHVS, average HVS with negative spike component in layer IV; andDS, average HVS with double spike components at short interspike intervals. Note a prominent delayed sink in layers II–III in ppHVS and nnHVS. Averages from 40 to 50 traces were selected from a 5 min recording session. Representative single events of the averages are indicated by vertical lines in A. iso, Baseline isopotential.
A third spike-associated component (Fig. 1, dipole 3) occurred within 5–10 msec after the sink in layer IV and was characterized by a surface-negative potential that reversed in deeper layers. This delayed potential most often blended smoothly with the main negative component associated with layer IV, making their separation difficult. The negative peak of the delayed potential coincided with the center of a distinct sink in layer III (Fig. 5, ppHVS). The presence or absence of this delayed dipole depended mostly on the magnitude of the sink in layers IV and V–VI (compare CSD plots nHVS andpHVS vs nnHVS and ppHVS). The coexistence of these dipoles could be revealed within a single EEG spike event, and the dominance of the various dipoles often varied within an HVS episode (Fig. 1). Occasionally, a superficial dipole associated with a sink in the upper part of layer II (e.g., see Fig. 1, dipole 3′) and/or a deep dipole associated with a sink in deep layer VI could be isolated after the main spike event (Fig. 2, sink 4′). In most cases, however, the multiple dipoles blended into a sharp field event, and the contributing dipoles could only be revealed by the CSD analysis. Large amplitude field spike events typically contained several strong sinks and sources (Fig. 5).
In summary, the spike component of HVSs consisted of several time-shifted dipoles. In the simplest case, only layer IV possessed a significant sink (Fig. 1, dipole 2). This sink could be preceded by a slightly earlier sink in layers V–VI coupled to a strong source in layers II–III (dipole 1). A delayed dipole was represented by the sink in layers II–III (dipole 3). This latter sink was observable only when the sink in either layers IV or V–VI was strong. The combination of these dipoles was responsible for the amplitude variation, duration, and different depth profiles of successive spike components of HVSs.
The hypothesis that the spike component of HVSs was a combination of several phase-shifted dipoles was also supported by simultaneous recording of extracellular unit activity in different layers of the cortex. In the awake rat with high frequency HVSs and short duration spike components, single and multiple-unit activity occurred rather synchronously in all layers. However, a sequential activation of unit activity in the various layers could occasionally be observed, especially when the frequency of HVS rhythm decreased. Such sequential patterns were easier to detect in the anesthetized rat because the frequency of HVSs was substantially slower in the anesthetized rat than in the awake animal. As illustrated in Figure6, neurons in all layers discharged preferentially during the spike component of HVSs. Unit discharges most often began in the middle deep layers (IV and V) and spread to more shallow and deeper layers. Less frequently, unit discharges were initiated in layer VI followed by layer IV. The sequential nature of unit recruitment was especially obvious when “split” spike components were observed in the field record (Fig. 6). In these cases, unit discharges in layers II–III coincided with the late field component of the spike (i.e., dipole 3).
Fig. 6.

Vertical spread of unit recruitment during HVS. Simultaneous recording of unit activity from 12 recording sites (5–16) during two field spike events (Aand B) of an HVS episode. Ketamine anesthesia. Field activity was recorded from layers II–III (site 4). Recruitment of neurons in different layers could occur virtually simultaneously (A) or recruitment of neurons in superficial and deep layers can be delayed (B).Arrows, Onset of multiple-unit discharge. The late discharge of neurons in layers II–III corresponded to the late surface-negative potential in the field (Fig. 1, dipole3).
Sleep spindles and HVSs
Sleep spindles are 10–15 Hz field oscillations in the neocortex that wax and wane over a period of 1–3 sec (Andersen and Andersson, 1968; Steriade et al., 1993). They share many of the cellular mechanisms responsible for HVSs (Steriade, 1989; Bal et al., 1994). In particular, damage to the reticular nucleus of the thalamus leads to a permanent disappearance of both sleep spindles and HVSs in the ipsilateral neocortex (Steriade et al., 1985; Buzsáki et al., 1988). However, they display differences in amplitude, waveform, and spatial synchrony. HVSs typically occur synchronously and coherently over the entire neocortex and in the two hemispheres (Gloor and Fariello, 1988; Buzsáki et al., 1990). In contrast, sleep spindles are more restricted spatially and can occur in isolation in various cortical areas. Finally, the duration of sleep spindles is typically short (1–3 sec), whereas HVSs may last for tens of seconds during immobility (Jandó et al., 1995).
In addition to their distinct frequency bands, HVSs and sleep spindles differed markedly in form. During HVS episodes, spike and wave components could be distinguished. In contrast to this asymmetric pattern, individual waves in sleep spindles were more sinusoidal in shape, although the surface-negative portion was often sharper (Fig.7). On the basis of CSD profiles and the association of HSVs with unit discharges, the spike component of HVSs seemed analogous to the surface-negative component of the sleep spindle. Conversely, the wave component of HVSs and the surface-positive portion of the sleep spindle were also similar. As expected from their low field amplitude, the magnitude of the sinks and sources of sleep spindles was smaller compared with the magnitude of the sinks and sources of HVSs. Nevertheless, the depth distribution of the dipoles associated with the spike component of the HVS and the surface-negative component of the sleep spindle was similar, although the relative magnitudes of the sinks and sources were somewhat different (Fig. 7C). The dipoles corresponding to the wave component of HVSs were similar to those observed during the surface-positive component of sleep spindles.
Fig. 7.

Averages of simultaneously recorded HVSs (A) and sleep spindles (B) in different layers at the same electrode position. C, One-dimensional CSD depth profiles of the spike and wave components of HVSs and corresponding surface-negative and surface-positive components of sleep spindles (continuous and dashed lines, respectively). Note the similar position but different magnitude of sinks and sources during the two different patterns.a1, a2, Spike and wave components of HVSs, respectively;b1, b2, surface-negative and surface-positive components of sleep spindle, respectively.
It should be emphasized, however, that individual spindle episodes could deviate from the above-described average pattern. Sleep spindles confined to more superficial layers with more pronounced surface-positive components were also observed. Occasionally, such a shift to the superficial layers could be recognized within a single sleep spindle episode. These “superficial” oscillatory patterns resembled type 1 spindles described in barbiturate-anesthetized cats (Spencer and Brookhart, 1961b). Conversely, the more typical sleep spindles in the rat shared several features with the type 2 barbiturate spindles.
Cellular discharge correlates of HVSs and sleep spindles were also comparable (Fig. 8). Cross-correlograms between the surface-negative component of sleep spindles and cell discharges, however, were much wider than unit histograms associated with the spike component of HVSs. It should be emphasized that very little unit activity occurred during the wave component of HVSs in any layer. Compared with the unit activity of pre-HVS episodes, unit activity during the wave component was significantly less; that is, cellular activity was actively suppressed. Although such suppression of “background” unit activity was also present during the surface-positive component of sleep spindles, its magnitude was much less. The depth modulation of unit firing (ratio of maximum to minimum discharge) during sleep spindles was rarely larger than 3.0 in the multiple-unit histograms, whereas these values were an order of magnitude larger during HVSs. On the basis of the cellular correlates of field oscillations, it may be suggested that sinks during the wave component of HVSs and the surface-positive component of sleep spindles likely represent passive return currents because no excitatory activity was observed during these periods.
Fig. 8.

Relationship between field and simultaneously recorded unit activity in different layers during HVSs (A) and sleep spindles (B). Field responses are from layer IV. Note the stronger recruitment of neurons during HVSs compared with sleep spindles and the virtually complete suppression of unit discharges during the wave component of HVSs. Note also the relatively weaker modulation of cell discharges in deeper layers during sleep spindles.
Although our analysis focused on the population activity of neurons, large amplitude single unit discharges were also discriminated (Fig.9). The “single” neuron nature of the isolated units was inferred from the refractory periods of the spike autocorrelograms (n = 62 units). In addition to irregularly discharging cells, some fast-spiking and short duration (<0.8-msec-wide band) single neurons could be isolated in several animals. These latter units were tentatively classified as interneurons (Steriade, 1974; McCormick et al., 1985; Amstrong-James et al., 1993;Kawaguchi, 1995; Freund and Buzsáki, 1996; Thomson et al., 1996), with the acknowledgment that a consensus regarding the extracellular properties of pyramidal cells and interneurons in the neocortex has yet to emerge. The putative interneurons discharged maximally, and often exclusively, during the spike component of the HVS and on the surface-negative component of the sleep spindle. The frequency of the discharge within such repetitive bursts could exceed 500 Hz (Fig.9B).
Fig. 9.

Sleep spindle-associated entrainment of network activity may be spatially limited. A1,A2, Two epochs of spatially circumscribed sleep spindle oscillations. Electrode ch2 was 300 μm deeper (layer V) than electrode ch1 (layer IV). The bottom trace is a high-passed (0.5–5 kHz) derivative of trace ch2. B, A larger putative pyramidal cell (pyr) and a smaller putative interneuron (int) were recorded simultaneously. Note a well developed sleep spindle in layer IV in A1(vertical dashed line). Note, however, that rhythmicity in layer V neurons is better expressed after rather than during the layer IV spindle (arrows). Rhythmicity of the interneuron was more often overt than was the rhythmicity of the field potentials (e.g., A2). The pyramidal neuron occasionally discharged action potentials of decreasing amplitude (complex spike burst in B, pyr). The interneuron fired rhythmic bursts (arrows), often with a 300–500 Hz intraburst frequency (B). C, Fields ch1 and ch2 are spike-triggered averages by the interneuron. D, The autocorrelograms of the interneuron (int) and pyramidal cell (pyr) and cross-correlogram between the interneuron and pyramidal cell (pyr vs int). Note the better phase correlation of the interneuron with the local spindlech2 than with activity recorded from ch1. Note also that the discharge of the interneuron (arrowin pyr vs int) precedes the firing of the pyramidal cell (time 0). Insets, Wide-band (1 Hz–5 kHz) averages of the putative interneuron and pyramidal cell, respectively. Note the short duration action potential of the interneuron.
Depth profiles of individual sleep spindle episodes were quite variable. Quite often, spindle waves in the depth of the cortex were not at all detected by the epidural recording electrode or by recording sites in more superficial layers. In other cases, field spindles were pronounced in the superficial layers but absent at deep recording sites, indicating the variable degree of recruitment of the cortical circuitry. An example of the limited recruitment of the cortical network into population oscillations during sleep spindles is shown in Figure 9. In this experiment, a fast-firing cell in layer V could be clearly distinguished from an isolated pyramidal unit. The fast-firing cell (a putative interneuron) displayed rhythmic bursts at sleep spindle frequency and was able to entrain the locally recorded layer V pyramidal cell, but these local rhythmic events were not always reflected in the far field potentials. The restricted field expression of neuronal synchrony can be explained by the limited degree of common drive and/or weak interneuronal cooperativity in different layers (Steriade and Yossif, 1974). Such a localized synchrony can be contrasted with the highly coherent field patterns observed during HVSs.
HVS-associated fast field oscillations (400–600 Hz ripples)
Visual inspection of long trains of HVSs recorded at multiple sites within the depth of the cortex revealed the presence of very fast, small amplitude field oscillations associated with the spike components of HVSs. Filtering of these fast events (200–800 Hz) showed that the power of the filtered signal clearly increased with nearly every spike component, and the frequency of the oscillation depended on the amplitude of the spike event. Averages of the fast oscillation events showed a polarity reversal in layer V, 100–200 μm below layer IV (Fig. 10). Importantly, when the fast ripple waves were cross-correlated with simultaneously recorded unit activity, the cell discharges recorded from virtually all layers were phase-locked to the negative peaks of the ripple waves recorded from layer V. However, the presence of unit activity was not a prerequisite for the occurrence of field ripples. Electrodes that yielded no units still exhibited ripples. In addition, units did not discharge with every spike component of HVSs. These findings exclude the possibility that the fast HVS-associated ripples (400–600 Hz) were an artifact of filtering. Instead, the ripples represent a fast transient event by which action potentials of different neurons can be synchronized with a high temporal precision.
Fig. 10.

HVS-induced fast field oscillations (400–500 Hz ripple). A, Averaged HVS and associated unit firing histograms from layers IV–VI. B, Wide-band (a and a′; 1 Hz–5 kHz), filtered field (b and b′; 200–800 Hz), and filtered unit (c and c′; 0.5–5 kHz) traces from layers IV and V, respectively. C, Averaged fast waves and corresponding unit histograms. The field ripples are filtered (200–800 Hz) derivatives of the wide-band signals recorded from 16 sites. Note the sudden phase-reversal of the oscillating waves (arrows) but the in-phase locking of unit discharges (dashed lines).
Modulation of the fast field events by sleep spindles was more difficult to quantify. Although the amplitude of the filtered waves often changed as a function of the sleep spindle cycle in individual records, averages of these filtered events did not provide robust averages, mostly because of the time jitter associated with the more variable frequency and location of sleep spindles.
Thalamic stimulation, on the other hand, reliably induced fast field oscillations. Although such oscillations were not evident in the filtered derivatives of the primary response, they were consistently present in the augmenting response (Fig.11). The frequency of the evoked field ripples depended on the strength of stimulation. The reversal of the fast oscillatory waves occurred at the same depth, irrespective whether they were induced by spontaneously occurring HVSs or by stimulation of various thalamic nuclei. These findings suggest that a strong excitatory drive within the cortical network is capable of inducing a short-lived fast oscillation of the driven neurons and of affecting the timing of action potentials.
Fig. 11.
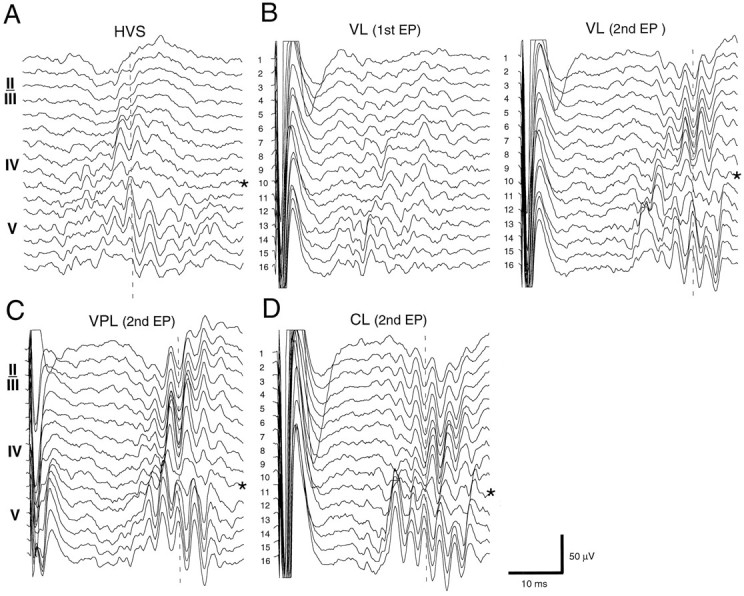
HVS and thalamic stimulation-induced fast field oscillations. A, Filtered trace (200–800 Hz) of a single spike event of an HVS. B–D, Averages of filtered (200–800 Hz; n = 8) evoked responses to double pulse stimulation of VL, VPL, and CLnuclei of the thalamus (100 msec intervals). In C andD, only the second, augmented responses are shown. Note the sudden phase-reversal of the oscillation in both HVSs and evoked responses (EP) (vertical dashed lines) at recording site 11 (asterisks).
DISCUSSION
The principal finding of the present experiments is that the major extracellular currents underlying sleep spindles, HVSs, and evoked responses consist of a combination of several dipoles. We submit that the major part of the excitatory drive is of intracortical origin, and the multiple pairs of sinks and sources reflect the activity of intracortical synaptic activity with only a limited contribution of thalamocortical synapses.
HVSs, sleep spindles, and evoked responses are generated by multiple dipoles
A striking finding of the present experiments was the general similarity between the spontaneous (HVSs and sleep spindles) and evoked (augmenting and late responses) field events. Depth profile and CSD analysis as well as unit studies revealed, however, that all these events were quite complex and that at least three dipoles were involved in their generation. The most consistent dipole was characterized by a major sink in layer IV (dipole 2). When a surface-positive field component was present, it was associated with a major sink in layers V–VI and a source in layers II–III (dipole 1). The third, delayed dipole was represented by a surface-negative spike component and a corresponding sink in layers II–III (dipole 3). The relative strength of these respective sinks varied within single episodes of HVSs. The multiple-dipole nature of sleep spindles and thalamic-evoked responses was also evident.
Single fibers of thalamocortical neurons provide input mainly to layer IV but also give off collaterals to layers V and VI (Bode-Greuel et al., 1987; Jensen and Killackey, 1987). If cortical field potentials were exclusively attributable to the activity of the thalamocortical afferents, then one might expect that the relative strengths of sinks in layers IV and V–VI would be constant and that the patterns within HVS trains would vary only in intensity but not in form. This was not the case. Although the density of thalamocortical inputs is highest in layer IV, they comprise only 20% of synapses in this layer (White, 1979). Most synapses within the neocortex are of intracortical origin (Douglas et al., 1995). Neurons in layers II–III, V, and VI tend to have fairly wide, horizontally extended connections. Associational fibers terminate in layer IV, to a lesser extent in layers II–III, but also in other layers (Szentágothai, 1978; Jones, 1985; Coogan and Burkhalter, 1990, 1993; Sefton and Dreher, 1995). Because neurons were activated during HVSs and sleep spindles in all layers, it follows that a large part of the neocortical network is involved in the generation of these patterns. Our findings suggest that, although thalamocortical synapses do contribute to the extracellular currents underlying these patterns, the major current flow derives from the activity of the intracortical circuitry. The neocortex, in essence, functions as a powerful amplifier during these oscillatory events. The cortical network is in a metastable state during reduced activity of the brainstem and basal forebrain (Steriade and Buzsáki, 1990;McCormick, 1992), and a weak input, ineffective in the aroused brain, is now capable of recruiting a large population of neurons. In this scheme, the triggering input may even remain undetectable in the field, and the spread of activity reflects primarily the connectivity and excitability characteristics of the cortical area rather than the nature of the initiating input. This hypothesis could explain the general similarity of the CSD patterns during HVSs, sleep spindles, augmenting response, and the late response evoked by stimulating various thalamic nuclei.
The delayed sink in layers II–III (dipole 3) was observable only when the sink in either layers IV or V–VI was strong. It was much stronger in the awake rat than in a rat under anesthesia. The difference may be explained by the hypothesis that recruitment of layer II–III cells by layer IV and deeper neurons is mediated mostly by NMDA-receptors, which were attenuated by the noncompetitive NMDA-blocker ketamine. In support of this hypothesis, Amstrong-James et al. (1993) described that short latency (<8 msec) units generated by principal whisker stimulation were almost entirely mediated through non-NMDA receptors and that most of these short latency units were restricted to cells in layer IV. In contrast, NMDA receptor action was required for longer latency units (>10 msec) in layers II–III. The anatomical basis of this suggestion is the observation that the majority of synapses in these superficial layers originate from neurons in layer IV (White, 1979).
High-frequency discharge of putative interneurons (Steriade, 1974) during the spike component of HVSs suggests that concerted inhibition may also contribute to the extracellular current flow. Although the reversal potential of the GABAA-mediated response is typically close to the resting membrane potential in pyramidal cells (Connors et al., 1988), inhibitory currents may significantly contribute to extracellular current sources during strong depolarization of the neurons, associated with the spike component of HVSs (Pollen, 1964; Giaretta et al., 1987). A clear indication of the active nature of some sources was their early onset and large magnitude in layers II–III. Approximately 15% of neocortical cells are GABAergic inhibitory interneurons (Ribak, 1978; Chmielowska et al., 1986). Many of these interneurons are activated by thalamocortical afferents and intracortical inputs in a feed-forward manner (Amstrong-James et al., 1993). Their perisomatic inhibition of pyramidal cells, particularly in layers II and III (van Brederode and Spain, 1995), may therefore significantly contribute to the observed current sources.
Previous studies have suggested that spontaneously occurring cortical rhythms share common features with thalamic-evoked responses. Both recruiting and augmenting responses have been suggested as the evoked equivalents of spontaneous spindle waves and spike-and-wave patterns (Demsey and Morison, 1942; Jasper and Drooglever-Fortuyn, 1947; Clare and Bishop, 1956; Ralston and Ajmone-Marsan, 1956; Spencer and Brookhart, 1961a). It has been tacitly assumed that both types of incremental responses consist of a single dipole, even though Spencer and Brookhart (1961b) have suggested previously that “the frequent occurrence of variant ’mixed responses’ . . . indicated the predominance of one system over the other.” The multiple dipoles present in the spontaneous oscillatory patterns and evoked responses may clarify this controversy. Identical current sinks and sources were present in the spontaneous rhythms and in both the evoked primary and augmenting responses, although the magnitude, dominance, and timing of the individual dipoles varied substantially across the different patterns and within epochs of HVSs and sleep spindles. Thus, although the type of afferents and their synchrony may influence the initial part of the pattern, it is probably the intracortical circuitry and its state of excitability that will determine the overall response.
Suppression of cellular discharges during sleep spindles and HVSs
Neocortical neurons, including putative interneurons, discharged almost exclusively during the spike component of HVSs, and we did not find cells that fired preferentially during the wave component, supporting previous observations (Pollen, 1964; Steriade and Yossif, 1974; Kostopoulos et al., 1981; Buzsáki et al., 1988). The short time-constant of the GABAA receptor-mediated inhibition (Connors et al., 1988) makes it unlikely that spike suppression throughout the wave component is mediated by this receptor type. Thalamocortical neurons also discharge preferentially during the spike component of HVSs (Buzsáki, 1991); therefore, thalamic disfacilitation may also contribute to the decreased firing (Timofeev et al., 1996). GABAB receptor-mediated postsynaptic inhibition (Connors et al., 1988) from the fast-discharging interneurons during the spike component is a candidate mechanism for the generation of the wave component, especially because pharmacological studies suggest that GABAB receptor blockers can abolish HVSs (Hosford et al., 1992; Snead, 1992). Burst-induced afterhyperpolarization (IAHP) in individual cells may also contribute to both the wave component of HVSs and the suppression of cell discharge. Both mechanisms may activate the hyperpolarization-activated cation current (Ihr) and deinactivate the low-threshold calcium current (IT) in some layer V pyramidal cells (Castro-Alamancos and Connors, 1996c) and thereby increase the responsivity of these neurons to intracortical afferents. The length of the augmented responsive state is determined by the magnitude and duration of the hyperpolarization, and its end is heralded by the extracellularly observed late potential (Castro-Alamancos and Connors, 1996b,c). We have observed late potentials at 100 msec and 200 msec in the awake rat and at 300–400 msec in the anesthetized animal. We hypothesize that these respective augmented periods are reflected by the sleep spindles (10–15 Hz) and by the HSVs in awake (7–9 Hz) and anesthetized (2–6 Hz) preparations. Arousal-related availability of subcortical neurotransmitters may determine these intervals, because these substances are known to affect intrinsic membrane currents (McCormick, 1992). In addition, alterations in some of the subcortical neurotransmitter systems may be causally related to the dominance of HVSs in petit mal epilepsy (Noebels, 1984;Buzsáki et al., 1990; Jandó et al., 1995).
Fast field oscillation (ripple) associated with HVSs
The fast field oscillation associated with HVSs and evoked augmenting responses is reminiscent of field ripples that occur during hippocampal sharp waves (Buzsáki et al., 1992; Ylinen et al., 1995; Chrobak and Buzsáki, 1996). The maximum amplitude of the field oscillation occurred in layer V, and the ripple waves reversed in phase in the upper part of layer V. When pyramidal cells discharged during HVSs, they were phase-locked to the ripples. At least some of the putative interneurons in this layer discharged at ripple frequency. We suggest that during HVSs two antagonistic polarizations compete with each other: dendritic excitation by thalamic and intracortical afferents and perisomatic inhibition by basket and chandelier neurons (Somogyi et al., 1983; Kawaguchi, 1995). The excitatory afferent barrage results in a transient depolarization and fast discharge of these interneurons. Coherent firing of interneurons and rhythmic hyperpolarization of their pyramidal cell targets are hypothesized to be a significant source of the extracellularly recorded fast field oscillation and the cause of the ripple-related timing of the action potentials. The physiological significance of the fast network oscillation has yet to be clarified. It may be suggested that the fast oscillation of the interneurons during a strong network drive provides a dissipative mechanism to decelerate and limit population synchrony of pyramidal cells and to prevent the all-or-none discharge of the activated pyramidal cells by protracting the recruitment process and limiting the number of participating neurons.
Footnotes
This work was supported by National Institute of Neurological Diseases and Stroke Grants NS34994 and 1P41RR09754, the National Science Foundation, and the Whitehall Foundation. We thank K. Wise and J. Hetke for manufacturing the silicon probes for us and M. Steriade, R. D. Traub, and J. Zackheim for their comments on this manuscript.
Correspondence should be addressed to Dr. György Buzsáki, Center for Molecular and Behavioral Neuroscience, Rutgers University, 197 University Avenue, Newark, NJ 07102.
REFERENCES
- 1.Amstrong-James M, Welker E, Callahan CA. The contribution of NMDA and non-NMDA receptors to fast and slow transmission of sensory information in the rat SI barrel cortex. J Neurosci. 1993;13:2149–2160. doi: 10.1523/JNEUROSCI.13-05-02149.1993. [DOI] [PMC free article] [PubMed] [Google Scholar]
- 2.Andersen P, Andersson SA. Physiological basis of the alpha rhythm (Towe A, ed). Appleton-Century-Crofts; New York: 1968. [Google Scholar]
- 3.Bal T, von Krosigk M, McCormick DA. From cellular to network mechanisms of a thalamic synchronized oscillation. In: Buzsáki G, Llinás R, Singer W, Berthoz A, Christen Y, editors. Temporal coding in the brain. Springer; Berlin: 1994. pp. 129–143. [Google Scholar]
- 4.Bode-Greuel KM, Singer W, Aldenhoff JB. A current source density analysis of field potentials evoked in slices of visual cortex. Exp Brain Res. 1987;69:213–219. doi: 10.1007/BF00247044. [DOI] [PubMed] [Google Scholar]
- 5.Bragin A, Jandó G, Nádasdy Z, Hetke J, Wise K, Buzsáki G. Gamma (40–100 Hz) oscillation in the hippocampus of the behaving rat. J Neurosci. 1995;15:47–60. doi: 10.1523/JNEUROSCI.15-01-00047.1995. [DOI] [PMC free article] [PubMed] [Google Scholar]
- 6.Buzsáki G. The thalamic clock: emergent network properties. Neuroscience. 1991;41:351–364. doi: 10.1016/0306-4522(91)90332-i. [DOI] [PubMed] [Google Scholar]
- 7.Buzsáki G, Bickford RG, Ponomareff G, Thal L, Mandel R, Gage FH. Nucleus basalis and thalamic control of neocortical activity in the freely moving rat. J Neurosci. 1988;8:4007–4026. doi: 10.1523/JNEUROSCI.08-11-04007.1988. [DOI] [PMC free article] [PubMed] [Google Scholar]
- 8.Buzsáki G, Bickford RG, Ryan LJ, Young S, Prohaska O, Mandel RJ, Gage FH. Multisite recording of brain field potentials and unit activity in freely moving rats. J Neurosci Methods. 1989;28:209–217. doi: 10.1016/0165-0270(89)90038-1. [DOI] [PubMed] [Google Scholar]
- 9.Buzsáki G, Smith A, Berger S, Fisher LJ, Gage FH. Petit mal epilepsy and Parkinsonian tremor: hypothesis of a common pacemaker. Neuroscience. 1990;36:1–14. doi: 10.1016/0306-4522(90)90345-5. [DOI] [PubMed] [Google Scholar]
- 10.Buzsáki G, Horvath Z, Urioste R, Hetke J, Wise K. High frequency network oscillation in the hippocampus. Science. 1992;256:1025–1027. doi: 10.1126/science.1589772. [DOI] [PubMed] [Google Scholar]
- 11.Castro-Alamancos MA, Connors BW. Spatiotemporal properties of short-term plasticity in sensorimotor thalamocortical pathway in the rat. J Neurosci. 1996a;16:2767–2779. doi: 10.1523/JNEUROSCI.16-08-02767.1996. [DOI] [PMC free article] [PubMed] [Google Scholar]
- 12.Castro-Alamancos MA, Connors BW. Short-term plasticity of a thalamocortical pathway dynamically modulated by behavioral state. Science. 1996b;272:274–277. doi: 10.1126/science.272.5259.274. [DOI] [PubMed] [Google Scholar]
- 13.Castro-Alamancos MA, Connors BW. Cellular mechanisms of the augmenting response: short-term plasticity in a thalamocortical pathway. J Neurosci. 1996c;16:7742–7756. doi: 10.1523/JNEUROSCI.16-23-07742.1996. [DOI] [PMC free article] [PubMed] [Google Scholar]
- 14.Chmielowska J, Stewart MG, Bourne RC, Hamori J. Gamma-aminobutyric acid immunoreactivity in mouse barrel field: a light microscopical study. Brain Res. 1986;368:371–374. doi: 10.1016/0006-8993(86)90584-6. [DOI] [PubMed] [Google Scholar]
- 15.Chrobak JJ, Buzsáki G. High-frequency oscillations in the output networks of the hippocampal-entorhinal axis of the freely behaving rat. J Neurosci. 1996;16:3056–3066. doi: 10.1523/JNEUROSCI.16-09-03056.1996. [DOI] [PMC free article] [PubMed] [Google Scholar]
- 16.Clare HM, Bishop GH. Potential wave mechanism in cat cortex. Electroencephalogr Clin Neurophysiol. 1956;8:583–602. doi: 10.1016/0013-4694(56)90083-9. [DOI] [PubMed] [Google Scholar]
- 17.Connors BW, Malenka RC, Silva LR. Two inhibitory postsynaptic potentials, and GABAA and GABAB receptor-mediated responses in neocortex of rat and cat. J Physiol (Lond) 1988;406:443–468. doi: 10.1113/jphysiol.1988.sp017390. [DOI] [PMC free article] [PubMed] [Google Scholar]
- 18.Coogan TA, Burkhalter A. Conserved patterns of cortico-cortical connections define areal hierarchy in rat visual cortex. Exp Brain Res. 1990;80:49–53. doi: 10.1007/BF00228846. [DOI] [PubMed] [Google Scholar]
- 19.Coogan TA, Burkhalter A. Hierarchical organization of areas in rat visual cortex. J Neurosci. 1993;13:3749–3772. doi: 10.1523/JNEUROSCI.13-09-03749.1993. [DOI] [PMC free article] [PubMed] [Google Scholar]
- 20.Demsey EW, Morison RS. The mechanism of thalamo-cortical augmentation and repetition. Am J Physiol. 1942;138:297–308. [Google Scholar]
- 21.Douglas RJ, Koch C, Mahowald M, Martin KAC, Suarez HH. Recurrent excitation in neocortical circuits. Science. 1995;269:981–985. doi: 10.1126/science.7638624. [DOI] [PubMed] [Google Scholar]
- 22.Fisher RS, Prince DA. Spike-wave rhythms in cat cortex induced by parental penicillin. I. Electroencephalographic features. Electroencephalogr Clin Neurophysiol. 1977;42:608–624. doi: 10.1016/0013-4694(77)90279-6. [DOI] [PubMed] [Google Scholar]
- 23.Freeman JA, Nicholson C. Experimental optimization of current source-density technique for anuran cerebellum. J Neurophysiol. 1975;38:369–382. doi: 10.1152/jn.1975.38.2.369. [DOI] [PubMed] [Google Scholar]
- 24.Freund TF, Buzsáki G. Interneurons of the hippocampus. Hippocampus. 1996;6:347–470. doi: 10.1002/(SICI)1098-1063(1996)6:4<347::AID-HIPO1>3.0.CO;2-I. [DOI] [PubMed] [Google Scholar]
- 25.Gallyas F, Hsu M, Buzsáki G. Four modified silver methods for thick sections of formaldehyde-fixed mammalian central nervous tissue: dark neurons, perikarya of all neurons, microglial cells and capillaries. J Neurosci Methods. 1993;50:159–164. doi: 10.1016/0165-0270(93)90004-b. [DOI] [PubMed] [Google Scholar]
- 26.Giaretta D, Avoli M, Gloor P. Intracellular recordings in pericruciate neurons during spike and wave discharges of feline generalized penicillin epilepsy. Brain Res. 1987;405:68–79. doi: 10.1016/0006-8993(87)90990-5. [DOI] [PubMed] [Google Scholar]
- 27.Gloor P, Fariello RG. Generalized epilepsy: some of its cellular mechanisms differ from those of focal epilepsy. Trends Neurosci. 1988;11:63–68. doi: 10.1016/0166-2236(88)90166-x. [DOI] [PubMed] [Google Scholar]
- 28.Hosford DA, Clark S, Cao Z, Wilson WA, Lin F-H, Morrisett RA, Huin A. The role of GABAB receptor activation in absence seizures of lethargic (lh/lh) mice. Science. 1992;257:398–401. doi: 10.1126/science.1321503. [DOI] [PubMed] [Google Scholar]
- 29.Jandó G, Carpi D, Kandel A, Urioste R, Horvöth Z, Pierre E, Vadi D, Fleischer A, Buzsáki G. Spike-and-wave epilepsy in rats: sex differences and inheritance of physiological traits. Neuroscience. 1995;64:301–317. doi: 10.1016/0306-4522(94)00329-4. [DOI] [PubMed] [Google Scholar]
- 30.Jasper HH, Drooglever-Fortuyn J. Experimental studies on the functional anatomy of petit mal epilepsy. Res Publ Ass Res Nerv Ment Dis. 1947;26:272–298. [Google Scholar]
- 31.Jasper H, Stefanis C. Intracellular oscillatory rhythms in pyramidal tract neurons in the cat. Electroencephalogr Clin Neurophysiol. 1965;18:541–553. doi: 10.1016/0013-4694(65)90072-6. [DOI] [PubMed] [Google Scholar]
- 32.Jensen KF, Killackey HP. Terminal arbors of axons projecting to the somatosensory cortex of the adult rat. II. The altered morphology of thalamocortical afferents following neonatal infraorbital nerve cut. J Neurosci. 1987;7:3544–3553. doi: 10.1523/JNEUROSCI.07-11-03544.1987. [DOI] [PMC free article] [PubMed] [Google Scholar]
- 33.Jones EG. The thalamus. Plenum; New York: 1985. [Google Scholar]
- 34.Kawaguchi Y. Physiological subgroups of nonpyramidal cells with specific morphological characteristics in layer II/III of rat frontal cortex. J Neurosci. 1995;15:2638–2655. doi: 10.1523/JNEUROSCI.15-04-02638.1995. [DOI] [PMC free article] [PubMed] [Google Scholar]
- 35.Kostopoulos G, Gloor P, Pellegrini A, Gotman J. A study of the transition from spindles to spike and wave discharge in feline generalized penicillin epilepsy: microphysiological features. Exp Neurol. 1981;73:55–77. doi: 10.1016/0014-4886(81)90045-5. [DOI] [PubMed] [Google Scholar]
- 36.Marescaux C, Vergnes M, Depaulis A. Genetic absence epilepsy in rats from Strasbourg—a review. J Neural Transm. 1992;35:S37–S69. doi: 10.1007/978-3-7091-9206-1_4. [DOI] [PubMed] [Google Scholar]
- 37.McCormick DA. Neurotransmitter actions in the thalamus and cerebral cortex and their role in neuromodulation of thalamocortical activity. Prog Neurobiol. 1992;39:337–388. doi: 10.1016/0301-0082(92)90012-4. [DOI] [PubMed] [Google Scholar]
- 38.McCormick DA, Connors BW, Lighthall JW, Prince DA. Comparative electrophysiology of pyramidal and sparsely spiny stellate neurons of the neocortex. J Neurophysiol. 1985;54:782–806. doi: 10.1152/jn.1985.54.4.782. [DOI] [PubMed] [Google Scholar]
- 39.Mitzdorf U. Current source-density method and application in cat cerebral cortex: investigation of evoked potentials and EEG phenomena. Physiol Rev. 1985;65:37–100. doi: 10.1152/physrev.1985.65.1.37. [DOI] [PubMed] [Google Scholar]
- 40.Morin D, Steriade M. Development from primary to augmenting responses in the somatosensory system. Brain Res. 1981;205:49–66. doi: 10.1016/0006-8993(81)90719-8. [DOI] [PubMed] [Google Scholar]
- 41.Morison RS, Demsey EW. A study of thalamo-cortical relations. Am J Physiol. 1942;135:281–292. [Google Scholar]
- 42.Noebels JL. Isolating single genes of the inherited epilepsies. Ann Neurol. 1984;16:S18–S21. doi: 10.1002/ana.410160705. [DOI] [PubMed] [Google Scholar]
- 43.Peeters BWMM, Kerbusch JML, Van Luijtelaar ELJM, Vossen JMH, Coenen AML. Genetics of absence epilepsy in rats. Behav Genet. 1990;20:453–460. doi: 10.1007/BF01065569. [DOI] [PubMed] [Google Scholar]
- 44.Pollen DA. Intracellular studies of cortical neurons during thalamic induced wave and spike. Electroencephalogr Clin Neurophysiol. 1964;17:398–404. doi: 10.1016/0013-4694(64)90163-4. [DOI] [PubMed] [Google Scholar]
- 45.Ralston B, Ajmone-Marsan C. Thalamic control of certain normal and abnormal cortical rhythms. Electroencephalogr Clin Neurophysiol. 1956;8:559–583. doi: 10.1016/0013-4694(56)90082-7. [DOI] [PubMed] [Google Scholar]
- 46.Ribak CE. Aspinous and sparsely spinous stellate neurons in the visual cortex of rats contain glutamic acid decarboxylase. J Neurocytol. 1978;7:461–478. doi: 10.1007/BF01173991. [DOI] [PubMed] [Google Scholar]
- 47.Sefton JS, Dreher B. Visual system. In: Paxinos G, editor. The rat nervous system, 2nd ed. Academic; San Diego: 1995. pp. 833–898. [Google Scholar]
- 48.Snead OC. Evidence for GABAB-mediated mechanisms in experimental generalized absence seizures. Eur J Pharmacol. 1992;213:343–349. doi: 10.1016/0014-2999(92)90623-c. [DOI] [PubMed] [Google Scholar]
- 49.Somogyi P, Freund TF, Cowey A. The axo-axonic interneuron in the cerebral cortex of the rat, cat and monkey. Neuroscience. 1983;7:2577–2607. doi: 10.1016/0306-4522(82)90086-0. [DOI] [PubMed] [Google Scholar]
- 50.Spencer WA, Brookhart JM. Electrical patterns of augmenting and recruiting waves in depth of sensorimotor cortex of cat. J Neurophysiol. 1961a;24:26–49. [Google Scholar]
- 51.Spencer WA, Brookhart JM. A study of spontaneous spindle waves in sensorimotor cortex of cat. J Neurophysiol. 1961b;24:50–65. [Google Scholar]
- 52.Steriade M. Interneuronal epileptic discharges related to spike-and-wave cortical seizures in behaving monkeys. Electroencephalogr Clin Neurophysiol. 1974;37:247–263. doi: 10.1016/0013-4694(74)90028-5. [DOI] [PubMed] [Google Scholar]
- 53.Steriade M. Spindling, incremental thalamocortical responses, and spike-wave epilepsy. In: Avoli M, Gloor P, Kostopoulos G, Naquet R, editors. Generalized epilepsy. Birkhäuser; Boston: 1989. [Google Scholar]
- 54.Steriade M, Buzsáki G. Parallel activation of thalamic and cortical neurons by brainstem and basal forebrain cholinergic systems. In: Steriade M, Biesold D, editors. Brain cholinergic systems. Oxford UP; New York: 1990. pp. 3–62. [Google Scholar]
- 55.Steriade M, Llinás RR. The functional states of the thalamus and the associated neuronal interplay. Physiol Rev. 1988;68:649–742. doi: 10.1152/physrev.1988.68.3.649. [DOI] [PubMed] [Google Scholar]
- 56.Steriade M, Yossif G. Spike-and-wave afterdischarges in cortical somatosensory neurons of cat. Electroencephalogr Clin Neurophysiol. 1974;37:633–648. doi: 10.1016/0013-4694(74)90076-5. [DOI] [PubMed] [Google Scholar]
- 57.Steriade M, Deschénes M, Domich L, Mulle C (1985) Abolition of spindle oscillation in thalamic neurons disconnected from nucleus reticularis thalami. J Neurophysiol 54[6]:1473–1497. [DOI] [PubMed]
- 58.Steriade M, McCormick DA, Sejnowski TJ. Thalamocortical oscillations in the sleeping and aroused brain. Science. 1993;262:679–685. doi: 10.1126/science.8235588. [DOI] [PubMed] [Google Scholar]
- 59.Szentágothai J. The local neuronal apparatus of the cerebral cortex. In: Buser P, Rougeul-Buser A, editors. Cerebral correlates of conscious experience. Elsevier; 1978. [Google Scholar]
- 60.Thomson AM, West DC, Hahn J, Deuchars J. Single axon IPSPs elicited in pyramidal cells by three classes of interneurones in slices of rat neocortex. J Physiol (Lond) 1996;496:81–102. doi: 10.1113/jphysiol.1996.sp021667. [DOI] [PMC free article] [PubMed] [Google Scholar]
- 61.Timofeev I, Contreras D, Steriade M. Synaptic responsiveness of cortical and thalamic neurones during various phases of slow sleep oscillation in cat. J Physiol (Lond) 1996;494:265–278. doi: 10.1113/jphysiol.1996.sp021489. [DOI] [PMC free article] [PubMed] [Google Scholar]
- 62.Vadász C, Carpi D, Jandó G, Kandel A, Urioste R, Horvath Z, Pierre E, Vadi D, Fleischer A, Buzsáki G. Genetic threshold model of rodent spike-and-wave epilepsy. Am J Med Genet. 1995;60:55–63. doi: 10.1002/ajmg.1320600111. [DOI] [PubMed] [Google Scholar]
- 63.van Brederode JFM, Spain WJ. Differences in inhibitory synaptic input between layer II–III and layer V neurons of the cat neocortex. J Neurophysiol. 1995;74:1149–1166. doi: 10.1152/jn.1995.74.3.1149. [DOI] [PubMed] [Google Scholar]
- 64.White EL. Thalamocortical synaptic relations. A review with emphasis on the projection of specific thalamic nuclei to the primary sensory areas of the neocortex. Brain Res. 1979;80:275–311. doi: 10.1016/0165-0173(79)90008-0. [DOI] [PubMed] [Google Scholar]
- 65.Ylinen A, Bragin A, Nádasdy Z, Jandó G, Szabo˙ I, Sik A, Buzsáki G. Sharp wave associated high frequency oscillation (200 Hz) in the intact hippocampus: network and intracellular mechanisms. J Neurosci. 1995;15:30–46. doi: 10.1523/JNEUROSCI.15-01-00030.1995. [DOI] [PMC free article] [PubMed] [Google Scholar]