

Abstract
Different Shaker family α-subunit genes generate distinct voltage-dependent K+ currents when expressed in heterologous expression systems. Thus it generally is believed that diverse neuronal K+ current phenotypes arise, in part, from differences in Shaker family gene expression among neurons. It is difficult to evaluate the extent to which differential Shaker family gene expression contributes to endogenous K+ current diversity, because the specific Shaker family gene or genes responsible for a given K+ current are still unknown for nearly all adult neurons. In this paper we explore the role of differential Shaker family gene expression in creating transient K+ current (IA) diversity in the 14-neuron pyloric network of the spiny lobster,Panulirus interruptus. We used two-electrode voltage clamp to characterize the somatic IA in each of the six different cell types of the pyloric network. The size, voltage-dependent properties, and kinetic properties of the somaticIA vary significantly among pyloric neurons such that the somatic IA is unique in each pyloric cell type. Comparing these currents with theIAs obtained from oocytes injected withPanulirus shaker and shal cRNA (lobsterIshaker and lobsterIshal, respectively) reveals that the pyloric cell IAs more closely resemble lobster Ishal than lobsterIshaker. Using a novel, quantitative single-cell-reverse transcription-PCR method to count the number of shal transcripts in individual identified pyloric neurons, we found that the size of the somaticIA varies linearly with the number of endogenous shal transcripts. These data suggest that theshal gene contributes substantially to the peak somaticIA in all neurons of the pyloric network.
Keywords: quantitative, single-cell-RT-PCR, stomatogastric, transient potassium current, Shaker family, potassium channel, gene regulation, Kv, transcriptional control, pyloric network, shal, identified neuron, noncompetitive PCR, invertebrate
The components of an electrically excitable system, be it a heart or a cortical circuit, possess unique electrophysiological phenotypes that are required for the proper performance of that system. In many instances, differences in the amount and/or properties of the transient K+ current (IA) help to establish these essential cell-specific phenotypes (Connor, 1975; Cassell and McLachlan, 1986;Cassell et al., 1986; Premack et al., 1989; Serrano and Getting, 1989;Hamill et al., 1991; Furakawa et al., 1992; Tierney and Harris-Warrick, 1992; Liu et al., 1993; Banks et al., 1996; Massengill et al., 1997). The functional consequences of IA heterogeneity are evident in the pyloric central pattern generator.
The 14-neuron pyloric network, located in the stomatogastric ganglion of the spiny lobster, Panulirus interruptus, is a model system for neural circuits that generate rhythmic, cyclic movements like locomotion, respiration, and mastication (Selverston and Moulins, 1987; Harris-Warrick et al., 1992; Simmers et al., 1995; Marder and Calabrese, 1996). In these types of systems, muscles must contract in proper succession to perform a motor task correctly. The order and timing of muscle contraction depend on when the different pyloric network neurons fire bursts of action potentials. The burst phase of the various pyloric neurons is partially determined by the amount and specific properties of the IA present in each cell. For example, during an ongoing motor pattern the lateral pyloric (LP) and pyloric constrictor (PY) neurons are simultaneously released from synaptic inhibition and display postinhibitory rebound. The LP rebounds faster and fires first, partly because it has a smallerIA at any given physiological voltage (Hartline, 1979; Graubard and Hartline, 1991; Hartline and Graubard, 1992; Tierney and Harris-Warrick, 1992; Harris-Warrick et al., 1995a,b). Thus, cell-specific differences in the IA strongly influence the order and timing of neuronal firing and muscle contraction.
How is IA heterogeneity established in this system? Constitutive differences in post-translational modifications could generate cell-specific differences in theIA, because theIAs in pyloric neurons can be differentially altered by the same neuromodulator. For instance, dopamine shifts the voltages of the somatic IAs of half activation in the depolarizing direction in the LP and PY cells (Harris-Warrick et al., 1995a,b) and in the hyperpolarizing direction in the pyloric dilator (PD) cell (Levini et al., 1996; P. Kloppenburg, unpublished data). On the other hand, differential gene expression also might produce IA heterogeneity.
In arthropods, A-channel α-subunits are encoded by twoShaker family genes, shaker and shal(Salkoff et al., 1992; M. Kim et al., 1995, 1996; Tsunoda and Salkoff, 1995a,b; Baro et al., 1996a) (also see Results). A single multimeric A-channel contains either shaker or shal α-subunits, but never a combination of the two (Covarrubias et al., 1991; Li et al., 1992;Sheng et al., 1993; Wang et al., 1993; Deal et al., 1994; Lee et al., 1994; Shen et al., 1995; Xu et al., 1995). In addition to α-subunits, arthropod A-channels may contain β-subunits, γ-subunits, and/or other auxiliary proteins (Zhong and Wu, 1993; Chouinard et al., 1995;Jegla and Salkoff, 1997; Tejedor et al., 1997). For the purposes of this paper, we will define an A-channel by the type ofShaker family α-subunit it possesses. Because all pyloric neurons express both the shaker and shal genes (Baro et al., 1996b) (also see Results), we previously hypothesized that varying mixtures of shaker and shal channels carry the somaticIA in each cell type. Differences in the somaticIA between cell types could be obtained by varying the fraction of shaker versus shal A-channels.
Like most adult systems, the lobster pyloric network is genetically intractable, so it is difficult to judge the extent to which differences in Shaker family gene expression contribute toIA heterogeneity. Voltage-clamp studies presented in this paper indicate that the six different pyloricIAs more closely resemble lobsterIshal than lobsterIshaker. To explicate this finding, we developed a quantitative, single-cell-reverse transcription PCR (SC-RT-PCR) method to count the number of shal transcripts in single, identified pyloric neurons. Using this method in conjunction with standard electrophysiological studies, we discovered a strictly linear relationship between shal transcript number and the size of the somatic IA in all pyloric neurons. After considering all of our data, we believe that our earlier hypothesis was incorrect. Large variations in the ratio of somatic shaker to shal channels are not responsible for somatic IAheterogeneity in the pyloric network.
MATERIALS AND METHODS
Electrophysiology
Pyloric neurons. The protocol used to study pyloric cell IAs using two-electrode voltage clamp has been described in detail by Harris-Warrick et al. (1995a,b). Briefly, a stomatogastric ganglion with the appropriate motor nerves and the associated commissural and esophageal ganglia was dissected from the animal (Selverston et al., 1976) and pinned in a dish. The preparation was perfused continually at 16°C with lobster saline containing (in mm): 479 NaCl, 12.8 KCl, 13.7 CaCl2, 3.9 Na2SO4, 10 MgSO4, 2 glucose, and 11.1 Tris, pH 7.35. Pyloric cells were identified electrophysiologically, using standard intracellular and extracellular recording techniques. IAs were characterized with a two-electrode voltage clamp. The following drugs were present in the saline to isolate the IA and block synaptic transmission: 0.05 mm picrotoxin, 20 mm TEA, 10−7m TTX, 5 mm Cs+, and 0.2 mmCd2+. Activation curves were generated by holding each cell at a potential at which the IA largely is inactivated and stepping to depolarized potentials to activate leak-subtracted non-IAs. These non-IA records were digitally subtracted from current traces in which the depolarization was preceded by a 200 msec hyperpolarizing prestep to remove resting inactivation ofIA. The resulting subtracted current could be abolished by 4 mm 4-AP and represents pureIA. The inactivation data were generated by varying the amplitude of the prestep while stepping to a fixed, depolarized potential near full activation. In both cases the voltage-dependent peak currents were converted to conductance by usingERev = −86 mV (Eisen and Marder, 1982). The average ERev was determined for each of the six pyloric cell types using tail current measurements of theIA. Tail currents were obtained by a series of hyperpolarizing steps after a 6 msec depolarization to +20 mV (preceded by a hyperpolarizing prepulse) to activate theIA. Non-IAs were digitally subtracted, as previously described. We found that the average ERev did not vary among the six pyloric cell types. Peak conductance was plotted versus the step potential for activation data or the prestep potential for inactivation data. The Boltzmann equation used for fitting was of the form:
| Equation 1 |
where Gmax is the maximal conductance,VA is the voltage of half-maximal activation,s is the slope factor, and n = 3 for activation and n = 1 for inactivation. The inactivation kinetics were fit with two exponentials, using the least-squares minimization procedure of pClamp (Axon Instruments, Foster City, CA). The current as a function of time (t) corresponds to the equation:
| Equation 2 |
where τf and τs represent the time constants of inactivation, and the amplitude of each time constant,If andIs, represents the relative contribution of each component to the peak. The time constants of activation (τa) were estimated by fitting the entire waveform (as seen in Fig. 2) to Equation 2, using three exponentials, where τf, τs,If, andIs were fixed to the values obtained previously from the inactivation fits to that waveform, and τa and Iawere allowed to vary. All time constants were determined for a depolarizing step to +20 mV (PD, PY, LP, and VD) or +25 mV (AB and IC).
Fig. 2.

The family of IAs in the pyloric network and the lobster shal andshaker currents. The six pyloric cell types and the number of cells in each cell type are PD, pyloric dilator (2); LP, lateral pyloric (1); PY, pyloric constrictor (8); AB, anterior burster (1);IC, inferior cardiac (1); and VD, ventricular dilator (1). The top panel for each cell type illustrates the IA waveform and amplitude activated by a depolarizing voltage step to +20 mV (PD, LP, PY, and VD) or +25 mV (AB and IC). The A-conductances activated at these voltages experience a nearly identical driving force and are >96% activated in PD, PY,IC, and VD and 72 and 82% activated inLP and AB, respectively. LobsterIshal and lobsterIshaker are voltage-clamp recordings of Xenopus oocytes injected with either lobster shal or lobster shaker RNA. Thebottom panel for each cell is the peak conductance/voltage relationship for activation (filled squares) and inactivation (filled circles) of the IA. The activation and inactivation curves are least-squares best fits to third- and first-order Boltzmann equations, respectively. Each set ofpoints is the average ± SEM from 5 (PD, AB, IC, VD), 7 (LP, PY), or 17 (lobsterIshaker) cells. The lobsterIshal curves were taken from Baro et al. (1996a). The steady-state IA is the small window representing the subset of the area under both the activation and inactivation curves.
The average cellular input capacitance for each of the six pyloric cell types was determined as previously described by Serrano and Getting (1989).
Xenopus oocytes. Two-electrode voltage clamp was used to study the shaker-evoked IA 2–4 d after injecting an oocyte with shaker RNA [clone K17(I); M. Kim, D. Baro, C. Lanning, M. Doshi, J. Farnham, H. Moskowitz, J. Peck, B. Olivera, and R. Harris-Warrick, unpublished data]. Harvesting, injections, and maintenance of oocytes were as previously described (Baro et al., 1996a). Shaker currents (lobsterIshaker) were elicited by depolarizing steps from a holding potential of −70 mV. Protocols and equations for determining the voltage dependence and inactivation kinetics of lobster Ishaker were as described in Baro (1996a), except that a minimum of three exponentials was required to fit the lobsterIshaker inactivation kinetics. A similar characterization of lobsterIshal appeared in Baro et al. (1996a).
Derivation of the correction factor for IAGmax
We have modeled the IA as the sum of a current passing through two A-channels that differ only in their rates of inactivation (Harris-Warrick, 1995a,b; Willms, 1997). The peak conductance, ḡA, is given by:
| Equation 3 |
where V is the voltage, Erevis the reversal potential, p is a positive integer,f ands are the maximal conductances of the populations of fast and slowly inactivating channels, respectively, m is the activation variable, andhf andhs are the inactivation variables for the fast and slow channels, respectively. Thus, the peak conductance is determined by both the activation and inactivation variables.
Because of inactivation during the rising phase of the current, the peak conductance for an IA is always less than the true maximal conductance (Fig. 1). We will define the true maximal conductance as the conductance obtained when all of the A-channels are open, before any inactivation occurs. An estimate of the true maximal conductance (called the correctedGmax) can be obtained by multiplying the measured Gmax by a correction factor that has been derived by Willms (1997). This correction factor (CF) represents the ratio of the true maximal conductance to the measured peak maximal conductance and is given by:
| Equation 4 |
where:
and
are the fractions of the current that inactivate with the fast and slow time constants,
and
are the ratios of the inactivation time constants to the activation time constant, and the effective time ratio is given by:
Fig. 1.

Theoretical conductance traces for a simulated voltage-clamp experiment starting from a strongly hyperpolarized state (fully deinactivated) and stepping to a strongly depolarized state (fully activated). The time constants of inactivation and the fraction of fast and slow channels were derived from Table 1, using the parameters for the PD cell (A) or the VD cell (B). In both cases the activation time constant was 1.5 msec. Time courses for activation and inactivation are displayed also. The scale on theleft ordinate is for the conductance (solid line), whereas the scale on the right ordinate is for the dimensionless activation and inactivation variables (dashed lines). The topinactivation curve is the sum of the two lower inactivation curves for the fast and slow channels. Note that the ratio of the peak conductance (Gpeak) to the true maximal conductance (true Gmax) is ∼85% for the PD cell and 43% for the VD cell.
When the relative number of A-channels in neurons with markedly different IA inactivation rates is assessed, it is more appropriate to use the correctedGmax, rather than the measuredGmax, because the correctedGmax accounts for differences inIA inactivation kinetics, which the measuredGmax does not. Simulated conductance traces based on our kinetic measurements of the PD and VDIAs are displayed in Figure 1 along with the time courses for activation and inactivation. The PD peak conductance (Fig. 1A) is much closer to the trueGmax than the VD peak conductance (Fig.1B), because the VD IA inactivates much more rapidly than the PD IA (Table 1; see Results). When multiplied by the correction factor, the peak conductances of both the PD and VD IAs more closely approximate the true maximal conductance (Willms, 1997).
Table 1.
Properties of IAs
| Cell type (number/type) | Inact τfast(msec)a | Inact τslow (msec)a | Inact τslow2 (msec)a,9 | % peak IA(τfast)a | % peak IA(τslow)a | (%) peak IA(τslow2)a,9 |
|---|---|---|---|---|---|---|
| PD (2) | 255,6 ± 3 | 1066 ± 11 | NA | 0.36 ± 0.01 | 0.64 ± 0.01 | NA |
| n = 5 | n = 5 | n = 5 | n = 5 | |||
| LP (1) | 275,6 ± 2 | 1066 ± 11 | NA | 0.35 ± 0.05 | 0.65 ± 0.04 | NA |
| n = 7 | n = 7 | n = 7 | n = 7 | |||
| PY (8) | 255,6 ± 3 | 1135,6 ± 24 | NA | 0.39 ± 0.04 | 0.61 ± 0.04 | NA |
| n = 7 | n = 7 | n = 7 | n = 7 | |||
| AB (1) | 162,3,4,6,7 ± 1 | 754,6,7 ± 12 | NA | 0.44 ± 0.05 | 0.56 ± 0.05 | NA |
| n = 5 | n = 5 | n = 5 | n = 5 | |||
| VD (1) | 32,3,4,5,7 ± 0.4 | 142,3,4,5,7 ± 3 | NA | 0.45 ± 0.05 | 0.55 ± 0.05 | NA |
| n = 5 | n = 5 | n = 5 | n = 5 | |||
| IC (1) | 295,6 ± 2 | 1365,6 ± 15 | NA | 0.34 ± 0.08 | 0.66 ± 0.08 | NA |
| n = 5 | n = 5 | n = 5 | n = 5 | |||
| Lobster1Ishal | 312,4,5,6 ± 1 | 2202,3,4,5,6,7 ± 7 | NA | 0.782,3,4,5,6,7 ± 0.01 | 0.222,3,4,5,6,7 ± 0.01 | NA |
| n = 16 | n = 16 | n = 16 | n = 16 | |||
| Lobster10Ishaker | 132,3,4,5,6,7,8 ± 0.3 | 5352,3,4,5,6,7,8 ± 26 | 1834 ± 51 | 0.502,3,4,5,6,7,8 ± 0.09 | 0.12,3,4,5,6,7,8 ± 0.8 | 0.25 ± 0.9 |
| n = 16 | n = 16 | n = 16 | n = 16 | n = 16 | n = 16 | |
| −423,5,7 ± 1 | 153 ± 0.7 | −675,7 ± 1 | 6 ± 0.3 | 3.55 ± 0.11 | ||
| n = 5 | n = 5 | n = 5 | n = 5 | n = 5 | ||
| −332,4,6,7 ± 1.5 | 252,4,5,6,7 ± 1.4 | −636,7 ± 1.4 | 8 ± 2.9 | 2.79 ± 0.41 | ||
| n = 8 | n = 7 | n = 3 | n = 3 | n = 7 | ||
| −403,5,6,7 ± 1.5 | 143,5 ± 0.4 | −636,7 ± 2.7 | 7 ± 0.9 | 2.09 ± 0.27 | ||
| n = 8 | n = 7 | n = 6 | n = 6 | n = 7 | ||
| −332,4,6,7 ± 2 | 153,4 ± 2 | −602,6 ± 1.4 | 6 ± 0.5 | 1.27 ± 0.27 | ||
| n = 5 | n = 5 | n = 5 | n = 5 | n = 7 | ||
| −453,4,5,7 ± 2.2 | 143 ± 1.6 | −713,4,5,7 ± 2 | 7 ± 0.5 | 0.44 ± 0.05 | ||
| n = 5 | n = 5 | n = 5 | n = 5 | n = 5 | ||
| −362,3,4,5,6 ± 1.2 | 143 ± 1.4 | −572,3,4,6 ± 1.2 | 7 ± 0.6 | 0.89 ± 0.08 | ||
| n = 5 | n = 5 | n = 5 | n = 5 | n = 5 | ||
| −403,5,6,7 ± 0.4 | 153 ± 0.4 | −712,3,4,5,7 ± 0.7 | 5 ± 0.2 | NA | ||
| n = 16 | n = 16 | n = 16 | n = 16 | |||
| −462,3,4,5,7,8 ± 0.7 | 142,3,5,8 ± 0.3 | −442,3,4,5,6,7,8 ± 0.4 | 32,3,4,5,6,7,8 ± 0.1 | NA | ||
| n = 16 | n = 16 | n = 16 | n = 16 |
Values indicate averages ± SEM.
1A description of how these parameters were obtained can be found in Baro et al. (1996a).
Significantly different (p < 0.05) from2PD, 3LP, 4PY, 5AB,6VD, 7IC,8Ishal.
9Significant differences not determined.
1015% of the current was noninactivating.
Obtained from Equation 2 in Materials and Methods.
Obtained from Equation 1 in Materials and Methods.
Quantitative SC-RT-PCR
Pyloric neurons were identified electrophysiologically, the glial caps were removed, and single neurons were isolated physically and used in shal RT-PCRs, as previously described (Baro et al., 1996b), with the following modifications. The α-tubulin primers were excluded and an RNA standard was added to the RT master mix (see below). 32P end-labeled primers (Baro et al., 1996b) were added to the PCR master mix (105 cpm/90 μl of mix) and the [MgCl2] was 1.5 mm; the PCR cycle was 1× at 95°C for 5 min; 25× at 94°C for 1 min, → 68°C for 1 min, → 72°C for 30 sec; and 5–10× at 94°C for 1.5 min, → 68°C for 1 min, → 72°C for 30 sec + 10 sec extension/cycle. The completed SC-RT-PCRs were electrophoresed on a 10% polyacrylamide gel. The gel was dried, and the PCR products were imaged with a PhosphorImager (Molecular Dynamics, Sunnyvale, CA) and stored on a Dell Dimension XPS 450V computer. The digitized 32P signals were quantitated with ImageQuant software (version 3.3, Molecular Dynamics). The bands usually were positioned in the center of boxes (but see Results) for which the dimensions did not vary, and the relative amount of 32P within each box was calculated automatically using a volume integration procedure.
The RNA standard was made by deleting a 45 bp segment (nucleotides 1282–1326) from the shal cDNA clone K/S10 (Baro et al., 1996a), using a modified, nested deletion method (Henikoff, 1987) in which the deletion extended bidirectionally from a BspEI restriction enzyme site. The deleted shal clone (Δshal) was linearized with HindIII in a standard restriction digest (Sambrook et al., 1989). The linearized Δshal clone then served as a template in a transcription reaction using T3 RNA polymerase and a Ribomax kit (Promega, Madison, WI). The transcripts were DNased (Life Technologies, Gaithersburg, MD), a small amount of 32P-dCTP was added, and free nucleotides were removed with a Nuctrap column (Stratagene, La Jolla, CA). Fractions containing no radioactivity were phenol/CHCl3extracted immediately, ethanol precipitated, and resuspended in dH2O. The concentration of the RNA standard was determined with a spectrophotometer. The concentration of the RNA standard was ∼109-fold greater than the final concentration in a SC-RT-PCR. Cloned DNA and RNase contamination were detected by using small aliquots of the concentrated RNA standard as the template in a PCR or in an overnight incubation in 1× superscript buffer at 37°C, followed by denaturing gel electrophoresis. An RNA standard was used only if both DNA and RNase were absent and the RNA appeared as a discrete band of the appropriate size. The DNA- and RNase-free concentrated RNA standard was stored at −70°C in 5 μl aliquots in siliconized tubes for up to 1 year. One aliquot was used per experiment and then discarded. At the time of the experiment an aliquot of the RNA standard was diluted with dH2O, using siliconized tubes to prevent the RNA from sticking. Carrier RNA (MS2, Boehringer Mannheim, Indianapolis, IN) also was added during the dilution series (final MS2: RNA standard = 106, w/w). The diluted RNA standard was heated to 95°C for 5 min and quick-frozen on dry ice. The RNA standard was thawed, spun, and added to the RT master mix (which was stored immediately on ice) right before aliquotting the mix into the tubes containing the cells. Three different preparations of the Δshal RNA standard were used in the quantitative SC-RT-PCR experiments described in this paper. All three preparations gave the same results.
RESULTS
IA is unique in each pyloric cell type
The 14 neurons of the pyloric network fall into six identified cell types (Fig. 2). Each cell type possesses a unique, unambiguous electrophysiological phenotype (Hartline and Graubard, 1992). To determine the extent ofIA heterogeneity in this network, we characterized the IA in each cell type with two-electrode voltage clamp from the cell soma. Using this method,Hartline et al. (1993) demonstrated that the maximal amplitude, activation threshold, voltage dependence, and inactivation kinetics of the IA were the same in an intact pyloric neuron as in a ligated soma. Thus, the IAs we measure from these intact neurons primarily reflect channels in the soma and initial length of the monopolar neurite, with little contribution from the current in unclamped distal neurites. We will refer to this current as the somatic IA.
Figure 2 demonstrates that the somatic IA in each cell type is unique under the same recording conditions. The upper panels show the somatic IAs obtained by depolarizing pyloric cells to nearly the same membrane potential (+20 or +25 mV). These traces demonstrate that at a given membrane potential both the size and the inactivation kinetics ofIA vary significantly between cell types. The peak amplitudes at these voltages vary by up to sevenfold. TheIA inactivation was fit by the sum of two exponentials. The IAs in the VD and AB cells inactivate much more rapidly relative to the other four cell types (Fig. 2, Table 1). This is attributable to two factors: (1) the time constants of inactivation (τfast and τslow) are up to 10-fold faster in these cells, and (2) a greater fraction of the channels inactivates with the fast, relative to the slow, time constant (Table1). The lower panels in Figure 2 display the voltage dependence of theIAs. The activation and inactivation curves are shifted in different cell types, with the V1/2s for activation and inactivation varying by up to 14 mV (Table 1). Consequently, the steady-state “window” IAis active over a different voltage range in different cells (Fig. 2). Finally, the maximal conductance (Gmax), obtained from Boltzmann fits to the peak conductance/voltage relation, varies between cell types by a factor of eight (Table 1). All of these data indicate that the properties of the somaticIA are distinct in each cell type under the same recording conditions. Because synaptic input is blocked by Cd2+ and picrotoxin and neuromodulators are not present in the bath, intrinsic differences in the baseline currents must be responsible for the observed IAheterogeneity.
IA density varies significantly among pyloric neurons
Cell-specific phenotypes can be brought about by changing the biophysical properties and/or the total amount of theIA in a given cell type. Table 1 demonstrates that pyloric neurons differentially regulate the properties of the somatic IA. Next, we set out to determine whether the somatic IA density also varies among cell types or whether the different current amplitudes seen in Figure 2merely reflect the different sizes of pyloric neurons. To obtain the somatic IA densities, we needed a measure of the size of both the soma and the maximal somatic IAfor each cell type. We estimated the average soma surface area for each cell type, using input capacitance as a gauge (Table2). The average input capacitance for each cell type indicates that the sizes of pyloric somata vary considerably. If somatic IA density is constant, then the maximum size of the somatic IA should be positively correlated with soma size. Conversely, if the six pyloric cell types differentially regulate somatic IAdensity, then the maximum size of the somatic IAshould vary in a manner that is independent of soma size. TheGmax, calculated from peak current measurements (Table 1), is used often as a measure of the size of theIA in a cell. If we normalize theGmax for soma size (averageGmax/average capacitance), somaticIA density varies by a factor of 6.9 (Table 2).
Table 2.
Somatic IA and shal transcript density in pyloric cells
| Cell type (number/type) | Input capacitance (nF) | IA density8 (μS/nF) | Corrected Gmax1 (μS) | Corrected IA density9 (μS/nF) | shal transcript density10 (transcripts/nF) |
|---|---|---|---|---|---|
| PD (2) | 1.24,5,6,7 ± 0.07 | 2.96 | 3.983,4,5,6,7 ± 0.12 | 3.32 | 2200 |
| n = 10 | n = 5 | ||||
| LP (1) | 1.474,5,6 ± 0.2 | 1.9 | 3.052,5,6,7 ± 0.47 | 2.07 | 1544 |
| n = 7 | n = 7 | ||||
| PY (8) | 0.92,3 ± 0.08 | 2.32 | 2.392,6,7 ± 0.34 | 2.66 | 1878 |
| n = 10 | n = 7 | ||||
| AB (1) | 0.662,3,6 ± 0.08 | 1.92 | 1.572,3 ± 0.28 | 2.38 | 1742 |
| n = 3 | n = 5 | ||||
| VD (1) | 1.022,3,5 ± 0.03 | 0.43 | 1.002,3,4 ± 0.14 | 0.98 | 1049 |
| n = 5 | n = 5 | ||||
| IC (1) | 0.872 ± 0.14 | 1.02 | 0.982,3,4 ± 0.09 | 1.13 | 1092 |
| n = 3 | n = 5 |
Values indicate averages ± SEM.
1The corrected Gmax =Gmax × correction factor (see Materials and Methods).
Significantly different (p < 0.05) from2PD, 3LP, 4PY, 5AB,6VD, 7IC.
8IA density = averageGmax ÷ average capacitance.
9Corrected IA density = average corrected Gmax ÷ average capacitance (see Materials and Methods).
10shal transcript density = average number of shal transcripts ÷ average capacitance.
The Gmax values in Table 1 were derived from peak current measurements and thus underestimate the true maximum size of the IA in a cell, because not all of the channels are open during the peak current because of channel inactivation during the rising phase of the current (Fig. 1, Materials and Methods). This is not a problem when neurons are compared with similar rates of IA inactivation; however, if the IA in one cell inactivates much more rapidly than the others, as is the case with VD, the underestimate is disproportionately greater for that cell (Fig. 1). To compare more accurately the maximum size of the IA among cell types, we multiplied the measured Gmax by a correction factor (Willms, 1997) that represents the ratio of the maximal conductance before any inactivation occurs to the measured conductance at the peak current (see Materials and Methods). The resulting value, which we will term the correctedGmax, is shown in Table 2. The effect of the correction factor can be seen in Figure3. In most cases the average correctedGmax is not significantly different from the average measured Gmax. However, the average corrected Gmax for the rapidly inactivating VD cell is more than twice the average measuredGmax.
Fig. 3.

The effect of the correction factor varies among pyloric cell types. The measured averageGmax (filled diamonds) and the corrected average Gmax (open squares) are plotted for each of the six pyloric cell types. Error bars indicate the SEM when it is larger than the symbols. Note that the corrected Gmax is approximately twice the measured Gmax in theVD cell, whereas the corrected and measuredGmax do not vary greatly in the other cell types.
Using the average corrected Gmax as the measure of the maximum size of the somatic IA in each cell type and normalizing for cell size (average correctedGmax/average capacitance), we find that the corrected somatic IA density varies between cell types by up to a factor of 3.4 (Table 2). Therefore, with either the corrected or uncorrected Gmax, the size of the IA does not simply increase or decrease with pyloric cell size. This finding is consistent with the idea that unique electrophysiological phenotypes are established by varying both the properties and the density of A-channels in a cell.
Comparison of the pyloric cell IAs to lobster Ishal and lobsterIshaker
Neurons could alter the properties and the amount ofIA by differentially regulating A-channel gene expression. Like their Drosophila homologs, thePanulirus shaker and shal genes both encode α-subunits for rapidly inactivating A-type channels, although with somewhat different properties than for the Drosophilachannels (Fig. 2, Table 1; M. Kim et al., 1995, 1996; Baro et al., 1996a). We compared the IAs obtained from overexpressing shaker and shal cRNA inXenopus oocytes (lobsterIshaker and lobsterIshal) with the six pyloricIAs (Fig. 2, Table 1). We discovered that the variations in pyloric IAs were not consistent with the idea that distinct pyloric IAs result from different mixtures of shaker and shal A-channels. Instead, we found that the pyloric cell IAs qualitatively resemble lobster Ishal more than lobster Ishaker; however, no pyloricIA was identical in all parameters to lobsterIshal.
The voltage dependence of the six pyloric IAs was quite variable but generally resembled lobsterIshal more than lobsterIshaker. The voltages of half activation (V1/2act) for pyloric cellIAs range from −33 to −45 mV. The lobsterIshalV1/2actis approximately in the middle of this range (−40 mV), whereas the lobster IshakerV1/2act lies below the lower limit of this range (−46 mV). The slopes of the activation curves are similar for allIAs except the LP. The pyloricIA voltages of half inactivation (V1/2 inact) range from −71 to −57 mV. The lobster IshalV1/2inact (−71 mV) is identical to the VDIA and marks the lower bound of the range. In contrast, the lobster IshakerV1/2inact (−44 mV) is significantly more depolarized, and the slope of the inactivation curve is significantly steeper than any of the six pyloric IAs. The pyloric IA voltages of half activation and inactivation are not identical to either lobsterIshal or lobsterIshaker, nor do they vary in a manner that would suggest the pyloric IA is a mixture of lobster Ishaker and lobster Ishal. For example, theV1/2act of the VD IAcurrent is more similar to lobsterIshaker, whereas itsV1/2inact is identical to lobsterIshal.
The inactivation kinetics for all six pyloricIAs are also more similar to lobsterIshal than lobsterIshaker or a mixture of the two channel types. First, lobster Ishalwas fit with a double exponential relation, like all six pyloricIAs, whereas lobsterIshaker could be fit only with a third-order equation. Second, lobsterIshaker contains a large noninactivating component that is not present in the six pyloricIAs or lobsterIshal (Fig. 2, Table 1). The fast time constants of inactivation (τfast) for the PD, PY, LP, and IC IAs are very similar to each other and to lobster Ishal, but they are significantly slower than lobsterIshaker. The slow time constants (τslow) of these pyloric neurons are approximately two times faster than lobster Ishal, but 5–17 times faster than lobsterIshaker (Table 1). The time constants of inactivation for the AB and VD IAs are significantly different from both lobsterIshal and lobsterIshaker (Fig. 2, Table 1).
A comparison of the eight different IAs shown in Figure 2 and Table 1 is not sufficient to ascertain which A-channels carry the pyloric IAs. However, the overall similarity of the neuronal IAs to lobsterIshal suggested that shalmay be an important contributor to the pyloric cellIAs. Therefore, we developed a method to quantitate shal gene expression in single identified neurons, using noncompetitive RT-PCR (Ferre, 1992; Foley et al., 1993;Gause and Adamovicz, 1994; Sucher and Deitcher, 1995).
Quantitating shal gene expression in single identified neurons
In our method, RNA from a single cell is reverse-transcribed and amplified along with 103 Δshal RNA standard molecules in an RT-PCR containing 32P-labeledPanulirus shal-specific primers. The Δshal RNA standard is identical to the endogenous shal transcript, except that it lacks the distal-most portions of the 5′ and 3′ untranslated regions and it contains a very small deletion in the region between the two PCR primers. This minor deletion allows the separation of the cellular shal and the standard Δshal RT-PCR products on the basis of size. The number of cellular transcripts is determined by normalizing the cellularshal RT-PCR product against the standard ΔshalRT-PCR product.
The results of a typical experiment are shown in Figure4. Neurons were identified electrophysiologically. Glial caps were removed because theshal gene is expressed in glial cells (Baro et al., 1996b), and individual neurons were physically isolated and used in RT-PCRs containing 103 Δshal RNA standard molecules. The RT-PCR products were size-separated, using polyacrylamide gel electrophoresis, and phosphorimaged. The upper band in each lane represents the product of the endogenous shaltranscripts present in a single cell. The lower band represents the product of the 1000 Δshal RNA standard molecules. The number of shal transcripts in each cell was calculated from:
| Equation 5 |
where X is the relative amplification efficiency per cycle of a Δshal to a shal DNA template, andn is the number of cycles in the PCR.
Fig. 4.

Results from a typical SC-RT-PCR experiment. Eachlane represents one SC-RT-PCR. The template in each SC-RT-PCR was cloned shal DNA (+), 1000 Δshal RNA standard molecules (B), or 1000 Δshal RNA standard molecules plus a single identified neuron lacking a glial cap (PY, LP, PD, PD*, and VD). Data from the cell PD* were not used because of obvious RNase degradation (see Results).
Shorter DNA molecules often are amplified more efficiently than longer molecules in a PCR. To determine whether the 262 bp ΔshalPCR product was amplified more efficiently than the 307 bpshal PCR product, we added equal numbers of shaland Δshal DNA templates to the same PCR (Fig.5). The PCR products were electrophoresed and phosphorimaged, and the digitized 32P signals were quantitated as described in Materials and Methods. The amplification efficiency per cycle of a Δshal relative to ashal DNA template was determined from the following equation: X = (cpm Δshal/cpmshal)1/n, where Xand n are described above. We found that ΔshalDNA molecules are amplified on average 1.029 ± 0.002 (n = 103) times more efficiently than an equivalent number of shal DNA molecules per PCR cycle. So, for a 30-cycle PCR, Xn = (1.029)30 = 2.4.
Fig. 5.

The relative amplification efficiency of Δshal over shal. Six representative PCRs are shown. Equal numbers of Δshal andshal DNA molecules were added to each PCR. PCRs were performed for (A) 20, (B) 25, or (C) 30 cycles. The PCR products were electrophoresed and phosphorimaged, and the digitized 32P signals were quantitated. The amplification efficiency per cycle of a Δshal relative to a shal DNA template was determined from the following equation: X = (cpm Δshal/cpmshal)1/n, whereX is the relative amplification efficiency per cycle andn is the number of cycles.
To ensure that our measurements of the relative amplification efficiency were accurate, we used several different DNA template preparations, and we varied the number of starting molecules and PCR cycles within the linear range of amplification (see below); otherwise, the conditions of the PCR were identical to the quantitative SC-RT-PCR. In those experiments with a large number of template molecules and PCR cycles, the shal and Δshal products tended to bleed together along the edges of the lane (Fig. 5C). Because the bands “smile” (Figs. 4, 5, 6), a smeared/streaked signal along the edge of the lane belongs to the band just below the smear/streak. Thus, in the few cases in which bleeding occurred, the phosphorimager measuring boxes (see Materials and Methods) were positioned so that the smear/streak between the bands went with the lower band. The average amplification efficiency of Δshalrelative to shal did not vary significantly with the number of starting molecules or PCR cycles.
Fig. 6.

Determining the linear range of amplification.A, Fifteen shal RT-PCRs were performed for 35 cycles. The templates in each of three RT-PCRs were 5 × 10⁴, 104, 103, 102, or 50 Δshal RNA molecules. Ten microliters of the completed RT-PCRs were run on each of three gels (only one gel is shown) and phosphorimaged. The average incorporated counts per minute in the nine resulting bands were determined for each of the five templates. B, The experiment inA was repeated three times, and the average incorporated counts per minute for the five templates were determined. The average incorporated counts per minute were plotted against the number of starting molecules on a log/log scale. The error bars represent the SEM. The line represents a linear regression to the first four data points (from 50 to 104molecules).
RNase is the bane of the quantitative SC-RT-PCR experiments. If an RNase is introduced when the cellular transcripts and the RNA standard are both present, they should be degraded equally, and the ratio of the signals will not change, just their intensity. However, if an RNase acts preferentially on either the endogenous transcript or the standard, there will be errors in our measurement. To detect and control for trace RNase contamination, we carried at least two blanks per experiment (RT-PCRs containing 1000 Δshal RNA standard molecules but no cell; Fig. 4). We used the data from an experiment only if the counts per minute in the standard bands of the blanks varied by less than a factor of 2. We used the data from an individual cell within an experiment only if the counts per minute in the standard band of that SC-RT-PCR were within or above the range of the blanks. For example, in Figure 4 the starred PD cell failed this criterion, so the data from this cell were not used.
Demonstrating that input is proportional to output in our SC-RT-PCRs
For our SC-RT-PCR method to be quantitative, we have to demonstrate that input is proportional to output. In a typical PCR the product increases exponentially with cycle number until eventually a plateau is reached. The PCR product is proportional to the number of starting molecules only if the PCR remains within the exponential phase (for review, see Ferre, 1992; Foley et al., 1993; Gause and Adamovicz, 1994). Several factors determine when the plateau is reached, including the number of starting molecules: everything else being equal, the larger the number of starting molecules, the sooner the PCR enters the plateau phase. For a given cycle number the linear range of amplification is defined as the range of starting template molecules over which the PCR remains within the exponential phase (for review, see Ferre, 1992). We determined the linear range of amplification for a 35 cycle RT-PCR under our quantitative SC-RT-PCR conditions (Fig.6). RT-PCRs containing 50–50,000 Δshal RNA molecules were performed for 35 cycles, and the amount of 32P incorporated into the ΔshalRT-PCR product was quantitated (Fig. 6A). Figure6B shows the relationship between the number of starting molecules and the amount of product. Each data point represents the average of nine different RT-PCR experiments. As Figure6B demonstrates, the log of the product increases linearly as a function of the log of the starting template over the range from 50 to at least 10,000 Δshal RNA molecules. The data point at 50,000 molecules is slightly below the line. This suggests that an RT-PCR containing 50,000 Δshal starting molecules enters the beginning stages of the plateau phase by 35 cycles and input may no longer be proportional to output. However, when the RT-PCR contains fewer starting molecules, and in particular <104, input is still proportional to output after 35 cycles. Thus, the linear range of amplification for a 35 cycle RT-PCR under the present SC-RT-PCR conditions includes at least 50–10,000 Δshal RNA template molecules. Preliminary experiments indicated that the number of endogenous shaltranscripts in a pyloric neuron never exceeded 4000. Because we add 1000 Δshal RNA standard molecules to a SC-RT-PCR, each reaction has between 1000 and 5000 starting molecules, which is well within the linear range of amplification for a 35 cycle SC-RT-PCR (Fig.6B). In some experiments we reduced the SC-RT-PCR cycle number to 30, and this did not change our results. This is what we would predict, because the upper limit of the linear range of amplification increases with decreasing cycle number. We should point out that the level of nonspecific RNA does not change significantly when a cell is added to the RT-PCR, because we include 20 ng of carrier RNA in each RT-PCR and a neuron most likely contributes <100 pg of nonspecific RNA to a reaction. Thus, adding a cell to the RT-PCR will not affect the linear range of amplification [see Gause and Adamovicz (1994) for a discussion of this point].
shal transcript number varies significantly among cell types
We performed a number of SC-RT-PCR experiments to determine the average number of shal transcripts in each pyloric cell type. The mean number of shal transcripts is plotted for each cell type in Figure 7. There are several points to be made. First, all pyloric cells expressshal. Second, the number of shal transcripts within a given cell type was consistent between individuals. Third, we observed significant differences in the average number ofshal transcripts among cell types, with shaltranscript levels varying by a factor of 2.8. Fourth, there is no positive correlation between the average number of shaltranscripts and the average input capacitance for a given cell type, as seen by our calculations of the shal transcript density, which varied from cell type to cell type (Table 2). Thus, pyloric cells differentially regulate shal gene expression at the level of the transcript. Pyloric neurons may differentially modulate transcript levels by varying rates of transcription, transcript processing, and/or transcript turnover. The fact that transcript levels are regulated does not exclude additional translational and post-translational regulation of shal gene expression in pyloric neurons as well.
Fig. 7.

The average number of shaltranscripts varies significantly among pyloric cell types. The average number of shal transcripts is plotted for each cell type; the error bars represent the SEM. The number of cells examined in each cell type was PD, 9; LP, 6;PY, 14; AB, 4; VD, 9; andIC, 6. Asterisks represent significant difference (p < 0.05): PY (*); AB, VD, IC (**); PD, LP (***); PD (****).
The maximum size of the somatic IA varies as a linear function of shal gene expression
If shal underlies a major fraction of the somaticIA in pyloric neurons, then it might be possible to correlate the maximum size of the somatic IAwith the number of shal transcripts in a given pyloric cell type. Plotting the mean number of shal transcripts in each cell type versus the average measured Gmaxreveals a remarkably strong positive correlation (Fig.8A). A linear regression fit to these data has an R2value of 0.95, demonstrating that the maximum size of the somaticIA in each cell type varies as a linear function of shal transcript levels (p < 0.001). The VD data point is significantly below the line in Figure8A. We suggest this is attributable to an underestimate of the VD Gmax calculated from peak current measurements because of the more rapid inactivation of the VD IA relative to other pyloric neurons (see Fig. 1). As described above, we can compensate for this underestimate by plotting the corrected Gmax versusshal transcript number for each cell type (Fig.8B). In this case the VD more closely approximates the line so that R2 becomes 0.98 andp < 0.0002.
Fig. 8.
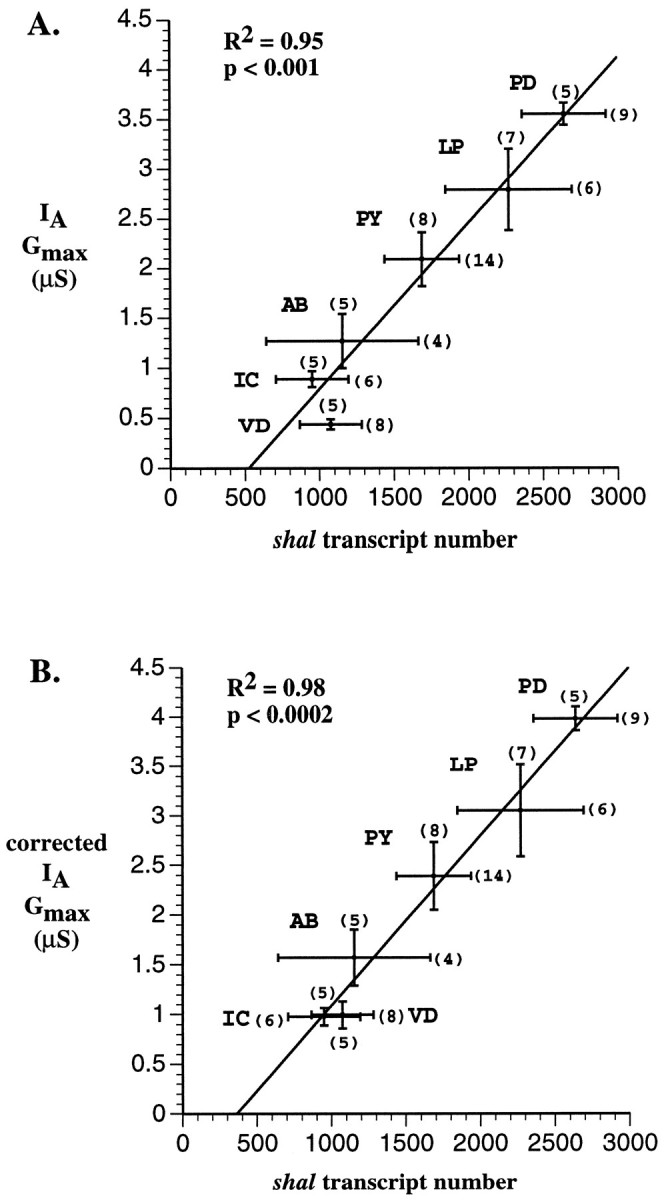
The maximum size of the somaticIA varies as a function ofshal gene expression. The average uncorrected (A) or corrected (B) Gmax was plotted against the mean number of shal transcripts for each of the six pyloric cell types. The lines represent linear regressions of the data points. The error bars on each data point represent the SE. The numbers inparentheses represent the number of cells used to measure either the Gmax or the number ofshal transcripts.
The simplest interpretation of our data is that shal is an α-subunit for the majority of somatic A-channels in all 14 neurons of the pyloric network. Research on flies and mammals has shown that K+ channel α-subunits from the shaker and shal subfamilies cannot coassemble to form a heteromeric channel, and one never finds an A-channel composed of shaker and shal α-subunits (Covarrubias et al., 1991; Li et al., 1992; Sheng et al., 1993; Wang et al., 1993; Deal et al., 1994; Lee et al., 1994; Shen et al., 1995; Xu et al., 1995) (but see Shahidullah et al., 1996). Subfamily-specific assembly is mediated via the NAB domain in the N-terminal regions of K+ channel subunits (Xu et al., 1995). NAB domains are conserved in a subfamily-specific manner. The amino acid identity among different NAB regions within a subfamily is generally >70%, but between subfamilies NAB identity drops to ∼30% (Xu et al., 1995). Because the NAB domains of Panulirus shaker and shal are 94 and 97% identical to their Drosophila homologs, respectively, we believe that Panulirus shaker and shal α-subunits do not form heterotetramers. Thus, if we consider onlyShaker family α-subunit genes for the moment, three possibilities exist: (1) the somatic IAs are carried by shaker channels alone; (2) the somaticIAs are carried by two different populations of A-channels, one containing shal α-subunits and the other containing shaker α-subunits; (3) the somatic IAs are carried by shal channels alone. Because the size of the somaticIA varies as a linear function ofshal transcript number with p < 0.001, and pyloric somatic IAs qualitatively resemble lobster Ishal but not lobsterIshaker, we can rule out the first possibility. With regard to the second possibility, the extremely highR2 value for theshal–IA correlation (Fig. 8) suggests that any significant contribution to the somaticIA from the shaker gene must either (1) remain fairly constant among cell types or (2) vary among cell types in a manner that is essentially identical to shal. If, on the one hand, the shaker gene produced a significant, constant number of somatic A-channels in every cell type, then there should be a sizable IA even when shaltranscripts are absent. In other words, when x is zero in Figure 8, the y-intercept should be positive. Because the extrapolated y-intercept in Figure 8 is negative, we can discard this possibility. If, on the other hand, the ratio of somatic shaker to shal channels is constant among the six different cell types, then shaker and shal gene expression must be completely coregulated in these six different cell types. However, strict coregulation of shaker and shal A-channel gene expression has not been described in previous studies in other systems (Roberds and Tamkun, 1991; Kues and Wunder, 1992; Lesage et al., 1992; Sheng et al., 1992; Tsaur et al., 1992; Dixon and McKinnon, 1994, 1996; Maletic-Savatic et al., 1995; Brahmajothi et al., 1996;Serôdio et al., 1996) (for review, see Chandy and Gutman, 1995). Because we have not yet quantified shaker expression in pyloric neurons, we cannot reject the possibility of coregulation categorically. Nevertheless, because the pyloric somaticIAs resemble lobsterIshal more than lobsterIshaker, we suggest that the third possibility is the simplest and most likely: in pyloric neurons theshal gene encodes most or all of the Shakerfamily α-subunits for somatic A-channels. This point eventually could be confirmed by demonstrating a causal relationship betweenshal and IA, usingshaker and shal knock-out techniques that use expression of antisense oligonucleotides (Chung et al., 1995) or dominant-negative mutations (Ribera, 1996).
The previous argument involved Shaker family α-subunits only. This argument did not consider the formation of heterotetramers between Shaker family α-subunits and other proteins.Drosophila mutant analysis indicates that Shakerfamily proteins might form heterotetramers with non-Shakerfamily K+ channel proteins such as EAG (Warmke et al., 1991; Zhong et al., 1991, 1993; Warmke and Ganetzky, 1994), and shaker and EAG have been shown to form heterotetramers in an oocyte expression system (Chen et al., 1996). Similarly, heterotetramers can form between shal α and γ subunits (Jegla and Salkoff, 1997). Our data do not rule out the possibility that some fraction, or even all, of the somatic A-channels are heterotetramers between α-subunits and EAG, γ-subunits, or other as yet unidentified subunits.
DISCUSSION
IA diversity in the 14-neuron pyloric network of the spiny lobster, Panulirus interruptus, is established by varying the density and/or the properties of A-channels between cells. Arthropod A-channels are multimeric proteins containingShaker family α-subunits encoded by either theshaker or shal gene in addition to other subunits (Salkoff et al., 1992; M. Kim et al., 1995, 1996; Tsunoda and Salkoff, 1995a,b; Baro et al., 1996a) (M. Kim, D. Baro, C. Lanning, M. Doshi, J. Farnham, H. Moskowitz, J. Peck, B. Olivera, and R. Harris-Warrick, unpublished data). Our voltage-clamp studies demonstrated that the pyloric IAs are more similar to lobsterIshal than lobsterIshaker. Quantitative SC-RT-PCR experiments show that there is an exceptionally strong linear correlation between the magnitude of the somaticIA and the number of shal transcripts in pyloric neurons. The two most likely interpretations of these data are either that shal channels underlie the major component of the somatic IA or that an unchanging ratio of shaker to shal channels underlies the somatic IA in all pyloric neurons.
Somatic IA heterogeneity in the pyloric network
Our results suggest that although lobster shal α-subunits or a constant ratio of shaker to shal α-subunits underlies the somaticIA in pyloric neurons, theIAs vary dramatically in their biophysical properties, depending on which cell is expressing the gene or genes. For example, the LP cell has more shal transcripts than the PY cell and more somatic A-channels (as determined from the average corrected or uncorrected Gmax; Fig. 3). However, the somatic IA is smaller in the LP cell at all submaximal activating voltages. This is because the LP activation curve is shifted in the depolarizing direction relative to the PY so that at any physiological membrane potential fewer A-channels will be open in the LP cell (Fig. 2, Table 1).
Qualitative and quantitative differences in Shaker family α-subunit gene expression do not seem to underlie the biophysical differences in the LP and PY IAs. Stable cell-specific variation in the post-translational modifications of A-channels could be partially responsible for IAdiversity in the pyloric network (Levitan, 1994; Holmes et al., 1996;Jonas and Kaczmarek, 1996; Villarroel and Schwarz, 1996; Harris-Warrick et al., 1997; Keros and McBain, 1997). Because a single lobster shal α-subunit has at least 31 putative protein kinase sites (Baro et al., 1996a) and the same neuromodulator can alter pyloric somaticIAs differentially (Harris-Warrick et al., 1995a,b; Levini et al., 1996; P. Kloppenburg, unpublished data), it is possible that cell-specific differences in constitutive cycles of α-subunit phosphorylation–dephosphorylation reproducibly alter pyloric cell IAs.
Other mechanisms also could contribute to pyloricIA diversity. For instance, it has been shown recently that the Shaker gene family encodes both classical α-subunits and regulatory γ-subunits. Classical α-subunits like shaker (Kv1), shab (Kv2), shaw (Kv3), shal (Kv4), and Kv5 are membrane-spanning subunits that can form functional homotetramers and contain a subset of 44 amino acids that are totally conserved across subfamilies and species (Chandy and Gutman, 1995). Although the definition of γ-subunits is still evolving, it seems that γ-subunits like Kv6, Kv7, Kv8, and shalγ1 are regulatory membrane-spanning subunits that cannot form functional homotetramers and contain alterations in a few of the 44 amino acids that are totally conserved in all classical α-subunits (Drewe et al., 1992; Hugnot, 1996; Jegla and Salkoff, 1997). γ-Subunits can form heteromultimers with classical α-subunits and change the properties of the K+ channel (Hugnot et al., 1996; Jegla and Salkoff, 1997). Jegla and Salkoff (1997) have shown recently that shal α and γ subunits interact in a constant stoichiometry. Thus, the number of α-subunit transcripts might help to determine the number of A-channels in a pyloric cell, whereas different γ-subunits in different cell types could alter the biophysical properties of those A-channels. Cell-specific alternate splicing of the α-subunit transcripts (Mottes and Iverson, 1995; Rogero and Tejedor, 1995) and/or β-subunit or other protein interactions with the α-subunits could alter IAs, although to date no shal β-subunits have been reported (Rudy et al., 1988; Chabala et al., 1993; Rettig et al., 1994; Serôdio et al., 1994; Chouinard et al., 1995; England et al., 1995; E. Kim et al., 1995; Majumder et al., 1995; McCormack et al., 1995; Morales et al., 1995; Rhodes et al., 1995, 1996; Cohen et al., 1996; Nakahira et al., 1996; Sewing et al., 1996; Shi et al., 1996; Yu et al., 1996; Tejedor et al., 1997). Finally, the same α-subunits could produce different IAs if the composition of the cellular membranes were distinct in different cells (Coronado et al., 1984; Barrantes, 1993; Bhushan and McNamee, 1993;Chang et al., 1995).
The VD IA
The VD IA is significantly different from the other pyloric neurons: it is much smaller, more rapidly inactivating, and both the activation and inactivation curves are more hyperpolarized (Fig. 2, Tables 1, 2). With uncorrectedGmax values, the VD data point does not lie on or near the line relating IAGmax to shal transcript number, as do the data points from all the other pyloric neurons (Fig.8A). There are at least three possible interpretations of these data, and they are not mutually exclusive. The first interpretation is that shaker contributes more substantially to the VD IA than to other pyloricIAs. The second interpretation is that most VD somatic A-channels contain shal α-subunits, but a greater fraction of VD shal channels are “silenced” under control conditions relative to other pyloric cells. The third interpretation is that the VD falls off the line in Figure 8A because, as shown in Figure1, the more rapid inactivation of the VD IAproduces a significant underestimate of the true VDGmax relative to the other pyloric cell types. To compensate for this error, we have used the correctedGmax as a measure of IAmagnitude. As seen in Figure 8B, plotting the corrected Gmax versus transcript number causes the VD to lie much closer to the line, suggesting that shaldoes underlie IA in the VD cell as well. Unfortunately, because of the more rapid inactivation, the correction procedure will be the most inaccurate for the VD cell (Willms, 1997). Thus this issue is not resolved and we cannot state conclusively which, if any, of these three possibilities is correct.
If shal underlies the somaticIA, where are the shakerA-channels?
We have shown with nonquantitative methods that shakeris expressed in all pyloric neurons and that shaker produces A-channels (Fig. 2; Baro et al., 1996b), yet in our more favored interpretation of the data, shal accounts for the majority of somatic A-channel α-subunits. One possible explanation for this apparent discrepancy is that most shaker A-channels may be localized to axons and nonclamped regions of the neuropil. In Drosophila, shaker channels are more highly concentrated in the axons and neuropil of adult brains and are not the major component of somaticIAs in most neurons (Solc et al., 1987; Baker and Salkoff, 1990; Schwarz et al., 1990; Tsunoda and Salkoff, 1995a,b). Similarly, in the mammalian brain, shal channels (Kv4.2) are concentrated in the somatodendritic compartment, whereas shaker A-channels (Kv1.4) are localized to axons and terminals (Sheng et al., 1992; Maletic-Savatic et al., 1995; Veh et al., 1995).
Electrophysiological analyses of Drosophila mutants indicate that shal encodes the somatic IA in most embryonic neurons (Tsunoda and Salkoff, 1995a,b). Moreover, hybrid arrest studies on rat brain mRNA expressed in Xenopusoocytes have shown that shal (Kv4.2), but notshaker (Kv1.4), mRNA underlies the somatic transient K+ current (ISA) recorded from rat thalamic and cerebellar neurons (Serôdio et al., 1994). Finally, Dixon and McKinnon (1996) suggest that members of the shal (Kv4) subfamily are likely to underlie the low-threshold somatic IA in sympathetic neurons, whereas shaker A-channels (Kv1.4) do not make a significant contribution to this current.
Note that our proposal does not imply that shal channels are localized only to the soma and therefore are excluded from the distal regions of the neuropil. Shal channels may be distributed over the entire surface of a pyloric neuron, in which case they certainly can affect neuronal activity and firing patterns. We have shown previously that dopamine modulation of the measured somatic IA can explain quantitatively the alterations in the postinhibitory rebound characteristics of the LP and PY neurons (Harris-Warrick et al., 1995a,b). Thus, either the somatic IAcontributes to neuronal firing patterns, and/or the A-channels present in the soma are also likely to be found in the neuropil. Interestingly, recent work from Drosophila suggests that shal channels are present in the membrane of Type III synaptic boutons (Martínez-Padrón and Ferrús, 1997).
shal transcripts and the somaticIA
It was somewhat surprising to find such a simple relationship between shal transcript number and the IAGmax. Any number of phenomena could have masked this relationship. If there were large cell-specific differences in the translational regulation of shal such that some cells produced 103 functional proteins per transcript whereas others produced one, then the size of IAwould not correlate with the number of shal transcripts. Similarly, if two cells had the same number of shaltranscripts and proteins, but the first cell concentrated all of its shal channels in the soma whereas the second localized them to the unclamped regions of the neuropil, we would detect anIA in the first cell, noIA in the second cell, and no positive correlation between transcript number and IAmagnitude. By the same token, if the average conductance of somatic A-channels varied significantly among pyloric neurons, then theR2 values in Figure 8 would be reduced dramatically even if shal encoded the α-subunits of the somatic IA. The fact that we can demonstrate an unequivocal linear relationship between shal transcript number and the size of the somatic IA suggests that translational regulation, shal channel localization (the fraction of shal channels in voltage-clamped vs nonvoltage-clamped regions), and average somatic A-channel conductance do not vary substantially among the 14 neurons of the pyloric network under control conditions.
The fact that the x-intercept in Figure 8 is not zero suggests that there is a sizable pool of unused shal RNA in these cells. Some portions of the transcripts we measure almost certainly are processed incompletely or incorrectly (Kramer, 1996) or partially degraded (Jacobson and Peltz, 1996) and therefore would yield no functional protein. In addition, shal gene expression could be regulated post-transcriptionally so that some of the transcripts are being stored rather than actively translated (Curtis et al., 1995; Decker and Parker, 1995; Hentze, 1995; Jansen et al., 1995;Wymore et al., 1996).
Conclusion
The most parsimonious explanation of the linear relationship between shal gene expression and IAGmax is that shal encodes theShaker family α-subunits for somatic A-channels in most or all of the pyloric neurons. If shaker plays a significant role, its expression must be coregulated exactly with shal. In either case, it does not appear that pyloricIA heterogeneity is attributable to varying ratios of shaker to shal channels in different cell types. Stable differences in Shaker family α-subunit gene expression correlate with the variations in somatic A-channel density among cell types; however, differences in Shaker family α-subunit gene expression do not underlie the differences in the biophysical properties of the six pyloric IAs. Other phenomena, including post-translational modifications and auxiliary subunits, must be responsible for the variety of differentIAs seen in pyloric neurons.
Footnotes
This work was supported by the Human Frontier Science program; National Institutes of Health Grants NS25915, NS35631, and NS17323; Office of Naval Research Grant N00014-95-1-0292 to R.H.-W.; and a Hughes undergraduate fellowship to H.E.R. We thank our anonymous reviewers, Ole Kiehn, Scott Hooper, Thomas Podleski, Jack Peck, Jenifer Levini, Amir Ayali, Ronald Hoy, Bruce Johnson, and David Deitcher for helpful comments on this manuscript.
Correspondence should be addressed to Dr. Deborah J. Baro, Section for Neurobiology and Behavior, Cornell University, Seeley G. Mudd Hall, Ithaca, NY 14853.
REFERENCES
- 1.Baker K, Salkoff L. The Drosophila shaker gene codes for a distinctive K+ current in a subset of neurons. Neuron. 1990;2:129–140. doi: 10.1016/0896-6273(90)90449-p. [DOI] [PubMed] [Google Scholar]
- 2.Banks MI, Haberly LB, Jackson MB. Layer-specific properties of the transient K current (IA) in piriform cortex. J Neurosci. 1996;16:3862–3876. doi: 10.1523/JNEUROSCI.16-12-03862.1996. [DOI] [PMC free article] [PubMed] [Google Scholar]
- 3.Baro DJ, Coniglio LM, Cole CL, Rodriguez HE, Lubell JK, Kim MT, Harris-Warrick RM. Lobster shal: comparison with Drosophila shal and native potassium currents in identified neurons. J Neurosci. 1996a;16:1689–1701. doi: 10.1523/JNEUROSCI.16-05-01689.1996. [DOI] [PMC free article] [PubMed] [Google Scholar]
- 4.Baro DJ, Cole CL, Harris-Warrick RM. RT-PCR analysis of shaker, shab, shaw, and shal gene expression in single neurons and glial cells. Receptors Channels. 1996b;4:149–159. [PubMed] [Google Scholar]
- 5.Barrantes FJ. Structural–functional correlates of the nicotinic acetylcholine receptor and its lipid microenvironment. FASEB J. 1993;7:1460–1467. doi: 10.1096/fasebj.7.15.8262330. [DOI] [PubMed] [Google Scholar]
- 6.Bhushan A, McNamee MG. Correlation of phospholipid structure with functional effects on the nicotinic acetylcholine receptor. Biophys J. 1993;64:716–723. doi: 10.1016/S0006-3495(93)81431-0. [DOI] [PMC free article] [PubMed] [Google Scholar]
- 7.Brahmajothi MV, Morales MJ, Liu S, Rasmusson RL, Campbell DL, Strauss HC. In situ hybridization reveals extensive diversity of K+ channel mRNA in isolated ferret cardiac myocytes. Circ Res. 1996;78:1083–1089. doi: 10.1161/01.res.78.6.1083. [DOI] [PubMed] [Google Scholar]
- 8.Cassell JF, McLachlan EM. The effect of a transient outward current (IA) on synaptic potentials in sympathetic ganglion cells of the guinea-pig. J Physiol (Lond) 1986;374:273–288. doi: 10.1113/jphysiol.1986.sp016079. [DOI] [PMC free article] [PubMed] [Google Scholar]
- 9.Cassell JF, Clark AL, McLachlan EP. Characteristics of phasic and tonic sympathetic ganglion cells of the guinea-pig. J Physiol (Lond) 1986;372:457–483. doi: 10.1113/jphysiol.1986.sp016020. [DOI] [PMC free article] [PubMed] [Google Scholar]
- 10.Chabala LD, Bakry N, Covarrubias M. Low molecular weight poly(A+) mRNA species encode factors that modulate gating of a non-shaker A-type K+ channel. J Gen Physiol. 1993;102:713–728. doi: 10.1085/jgp.102.4.713. [DOI] [PMC free article] [PubMed] [Google Scholar]
- 11.Chandy CK, Gutman GA. Voltage-gated potassium channel genes. In: North RA, editor. Handbook of receptors and channels: ligand- and voltage-gated ion channels. CRC; Boca Raton: 1995. pp. 1–71. [Google Scholar]
- 12.Chang HM, Reitstetter R, Gruener R. Lipid–ion channel interactions: increasing phospholipid headgroup size, but not ordering acyl chains, alters reconstituted channel behavior. J Membr Biol. 1995;145:13–19. doi: 10.1007/BF00233303. [DOI] [PubMed] [Google Scholar]
- 13.Chen M-L, Hoshi T, Wu C-F. Heteromultimeric interactions among K+ channel subunits from Shaker and eag families in Xenopus oocytes. Neuron. 1996;17:535–542. doi: 10.1016/s0896-6273(00)80185-3. [DOI] [PubMed] [Google Scholar]
- 14.Chouinard SW, Wilson GF, Schlimgen AK, Ganetzky B. A potassium channel β-subunit related to the aldo-keto reductase superfamily is encoded by the Drosophila hyperkinetic locus. Proc Natl Acad Sci USA. 1995;92:6763–6767. doi: 10.1073/pnas.92.15.6763. [DOI] [PMC free article] [PubMed] [Google Scholar]
- 15.Chung S, Saal DB, Kaczmarek LK. Elimination of potassium channel expression by antisense oligonucleotides in a pituitary cell line. Proc Natl Acad Sci USA. 1995;92:5955–5959. doi: 10.1073/pnas.92.13.5955. [DOI] [PMC free article] [PubMed] [Google Scholar]
- 16.Cohen NA, Brenman JE, Snyder SH, Bredt DS. Binding of the inward rectifier K+ channel Kir 2.3 to PSD-95 is regulated by protein kinase A phosphorylation. Neuron. 1996;17:759–767. doi: 10.1016/s0896-6273(00)80207-x. [DOI] [PubMed] [Google Scholar]
- 17.Connor JA. Neural repetitive firing: a comparative study of membrane properties of crustacean walking leg axons. J Neurophysiol. 1975;351:922–932. doi: 10.1152/jn.1975.38.4.922. [DOI] [PubMed] [Google Scholar]
- 18.Coronado R, Latorre R, Mautner HG. Single potassium channels with delayed rectifier behavior from lobster axon membranes. Biophys J. 1984;45:289–299. doi: 10.1016/S0006-3495(84)84155-7. [DOI] [PMC free article] [PubMed] [Google Scholar]
- 19.Covarrubias M, Wei AA, Salkoff L. Shaker, shal, shab, and shaw express independent K+ current systems. Neuron. 1991;7:763–773. doi: 10.1016/0896-6273(91)90279-9. [DOI] [PubMed] [Google Scholar]
- 20.Curtis D, Lehmann R, Zamore PD. Translational regulation in development. Cell. 1995;81:171–178. doi: 10.1016/0092-8674(95)90325-9. [DOI] [PubMed] [Google Scholar]
- 21.Deal KK, Lovinger DM, Tamkun MM. The brain Kv1.1 potassium channel: in vitro and in vivo studies on subunit assembly and post-translational processing. J Neurosci. 1994;14:1666–1676. doi: 10.1523/JNEUROSCI.14-03-01666.1994. [DOI] [PMC free article] [PubMed] [Google Scholar]
- 22.Decker CJ, Parker R. Diversity of cytoplasmic functions for the 3′ untranslated region of eukaryotic transcripts. Curr Opin Cell Biol. 1995;7:386–392. doi: 10.1016/0955-0674(95)80094-8. [DOI] [PubMed] [Google Scholar]
- 23.Drewe JA, Verma S, Frech G, Joho RH. Distinct spatial and temporal expression patterns of K+ channel messenger RNAs from different subfamilies. J Neurosci. 1992;12:538–548. doi: 10.1523/JNEUROSCI.12-02-00538.1992. [DOI] [PMC free article] [PubMed] [Google Scholar]
- 24.Dixon JE, McKinnon D. Quantitative analysis of potassium channel mRNA expression in atrial and ventricular muscles of rats. Circ Res. 1994;75:252–260. doi: 10.1161/01.res.75.2.252. [DOI] [PubMed] [Google Scholar]
- 25.Dixon JE, McKinnon D. Potassium channel mRNA expression in prevertebral and paravertebral sympathetic neurons. Eur J Neurosci. 1996;8:183–191. doi: 10.1111/j.1460-9568.1996.tb01179.x. [DOI] [PubMed] [Google Scholar]
- 26.Eisen JS, Marder E. Mechanisms underlying pattern generation in lobster stomatogastric ganglion as determined by selective inactivation of identified neurons. III. Synaptic connections of electrically coupled pyloric neurons. J Neurophysiol. 1982;48:1392–1415. doi: 10.1152/jn.1982.48.6.1392. [DOI] [PubMed] [Google Scholar]
- 27.England S, Uebele VN, Shear H, Kodali J, Bennett PB, Tamkun MM. Characterization of a voltage-gated K+ channel β subunit expressed in human heart. Proc Natl Acad Sci USA. 1995;92:6309–6313. doi: 10.1073/pnas.92.14.6309. [DOI] [PMC free article] [PubMed] [Google Scholar]
- 28.Ferre F. Quantitative or semi-quantitative PCR: reality versus myth. PCR Methods Appl. 1992;2:1–9. doi: 10.1101/gr.2.1.1. [DOI] [PubMed] [Google Scholar]
- 29.Foley KR, Leonard MW, Engel JD. Quantitation of RNA using the polymerase chain reaction. Trends Genet. 1993;9:380–385. doi: 10.1016/0168-9525(93)90137-7. [DOI] [PubMed] [Google Scholar]
- 30.Furakawa Y, Kandel E, Pfaffinger P. Three types of early transient potassium currents in Aplysia neurons. J Neurosci. 1992;12:989–1000. doi: 10.1523/JNEUROSCI.12-03-00989.1992. [DOI] [PMC free article] [PubMed] [Google Scholar]
- 31.Gause WC, Adamovicz J (1994) The use of PCR to quantitate gene expression. PCR Methods Appl 3[Suppl 6]:123–135. [DOI] [PubMed]
- 32.Graubard K, Hartline DK. Voltage-clamp analysis of intact stomatogastric neurons. Brain Res. 1991;557:241–254. doi: 10.1016/0006-8993(91)90141-h. [DOI] [PubMed] [Google Scholar]
- 33.Hamill OP, Huguenard JJ, Prince DA. Patch-clamp studies of voltage-gated currents in identified neurons of the rat cerebral cortex. Cereb Cortex. 1991;1:48–61. doi: 10.1093/cercor/1.1.48. [DOI] [PubMed] [Google Scholar]
- 34.Harris-Warrick RM, Marder E, Selverston AI, Moulins M. Dynamic biological networks: the stomatogastric nervous system. MIT; Cambridge, MA: 1992. [Google Scholar]
- 35.Harris-Warrick RM, Coniglio LM, Barazangi N, Guckenheimer J, Gueron S. Dopamine modulation of transient potassium current evokes phase shifts in a central pattern generator network. J Neurosci. 1995a;15:342–358. doi: 10.1523/JNEUROSCI.15-01-00342.1995. [DOI] [PMC free article] [PubMed] [Google Scholar]
- 36.Harris-Warrick RM, Coniglio LM, Levini RM, Gueron S, Guckenheimer J. Dopamine modulation of two subthreshold currents produces phase shifts in activity of an identified motoneuron. J Neurophysiol. 1995b;74:1404–1420. doi: 10.1152/jn.1995.74.4.1404. [DOI] [PubMed] [Google Scholar]
- 37.Harris-Warrick RM, Baro DJ, Coniglio LM, Johnson BR, Levini RM, Peck JH, Zhang B. Chemical modulation of crustacean stomatogastric pattern generator networks. In: Stein PSG, Grillner S, Selverston AI, Stuart DG, editors. Neurons networks and motor behavior. MIT; Cambridge, MA: 1997. [Google Scholar]
- 38.Hartline DK. Pattern generation in the lobster (Panulirus) stomatogastric ganglion. II Pyloric network simulation. Biol Cybern. 1979;33:223–236. doi: 10.1007/BF00337411. [DOI] [PubMed] [Google Scholar]
- 39.Hartline DK, Graubard K. Cellular and synaptic properties in the crustacean stomatogastric nervous system. In: Harris-Warrick RM, Marder E, Selverston AI, Moulins M, editors. Dynamic biological networks: the stomatogastric nervous system. MIT; Cambridge, MA: 1992. pp. 31–85. [Google Scholar]
- 40.Hartline DK, Gassie DV, Jones BR. Effects of soma isolation on outward currents measured under voltage clamp in spiny lobster stomatogastric motor neurons. J Neurophysiol. 1993;69:2056–2071. doi: 10.1152/jn.1993.69.6.2056. [DOI] [PubMed] [Google Scholar]
- 41.Henikoff S. Unidirectional digestions with ExoIII in DNA sequence analysis. Methods Enzymol. 1987;155:156–165. doi: 10.1016/0076-6879(87)55014-5. [DOI] [PubMed] [Google Scholar]
- 42.Hentze M-W. Translational regulation: versatile mechanisms for metabolic and developmental control. Curr Opin Cell Biol. 1995;7:393–398. doi: 10.1016/0955-0674(95)80095-6. [DOI] [PubMed] [Google Scholar]
- 43.Holmes TC, Fadool DA, Levitan IB. Tyrosine phosphorylation of the Kv1.3 potassium channel. J Neurosci. 1996;16:1581–1590. doi: 10.1523/JNEUROSCI.16-05-01581.1996. [DOI] [PMC free article] [PubMed] [Google Scholar]
- 44.Hugnot J-P, Salinas M, Lesage F, Guillemare E, de Weille J, Heurteaux C, Mattéi M-G, Lazdunski M. Kv8.1, a new neuronal potassium channel subunit with specific inhibitory properties towards Shab and Shaw channels. EMBO J. 1996;15:3322–3331. [PMC free article] [PubMed] [Google Scholar]
- 45.Jansen M, DeMoore CH, Sussenbach JS, Brande JLVD. Translational control of gene expression. Pediatr Res. 1995;37:681–686. doi: 10.1203/00006450-199506000-00001. [DOI] [PubMed] [Google Scholar]
- 46.Jacobson A, Peltz SW. Interrelationships of the pathways of mRNA decay and translation in eukaryotic cells. Annu Rev Biochem. 1996;65:693–739. doi: 10.1146/annurev.bi.65.070196.003401. [DOI] [PubMed] [Google Scholar]
- 47.Jegla T, Salkoff L. A novel subunit for shal K+ channels radically alters activation and inactivation. J Neurosci. 1997;17:32–44. doi: 10.1523/JNEUROSCI.17-01-00032.1997. [DOI] [PMC free article] [PubMed] [Google Scholar]
- 48.Jonas EA, Kaczmarek LK. Regulation of potassium channels by protein kinases. Curr Opin Neurobiol. 1996;6:318–323. doi: 10.1016/s0959-4388(96)80114-0. [DOI] [PubMed] [Google Scholar]
- 49.Keros S, McBain C. Arachidonic acid inhibits transient potassium currents and broadens action potentials during electrographic seizures in hippocampal pyramidal and inhibitory interneurons. J Neurosci. 1997;17:3476–3487. doi: 10.1523/JNEUROSCI.17-10-03476.1997. [DOI] [PMC free article] [PubMed] [Google Scholar]
- 50.Kim E, Niethammer M, Rothschild A, Jan YN, Sheng M. Clustering of Shaker-type K+ channels by interaction with a family of membrane-associated guanylate kinases. Nature. 1995;378:85–88. doi: 10.1038/378085a0. [DOI] [PubMed] [Google Scholar]
- 51.Kim MT, Baro DJ, Yuan A, Cole CL, Tapia M, Podleski TP, Harris-Warrick RM. Cloning and quantifying levels of shaker gene expression in pyloric neurons. Soc Neurosci Abstr. 1995;21:149. [Google Scholar]
- 52.Kim MT, Baro DJ, Cole CL, Doshi M, Moskowitz HS, Podleski T, Harris-Warrick RM. Alternatively spliced pore-lining regions in Panulirus shaker. Soc Neurosci Abstr. 1996;22:1248. [Google Scholar]
- 53.Kramer A. The structure and function of proteins involved in mammalian pre-mRNA splicing. Annu Rev Biochem. 1996;65:367–409. doi: 10.1146/annurev.bi.65.070196.002055. [DOI] [PubMed] [Google Scholar]
- 54.Kues WA, Wunder F. Heterogeneous expression patterns of mammalian potassium channel genes in developing and adult rat brain. Eur J Neurosci. 1992;4:1296–1308. doi: 10.1111/j.1460-9568.1992.tb00155.x. [DOI] [PubMed] [Google Scholar]
- 55.Lee TE, Philipson LH, Kuznetsov A, Nelson DJ. Structural determinants for assembly of mammalian K+ channels. Biophys J. 1994;66:667–673. doi: 10.1016/s0006-3495(94)80840-9. [DOI] [PMC free article] [PubMed] [Google Scholar]
- 56.Lesage F, Attali B, Lazdunski M, Barhanin J. Developmental expression of voltage-sensitive K+ channels in mouse skeletal muscle and C2C12 cells. FEBS Lett. 1992;310:162–166. doi: 10.1016/0014-5793(92)81320-l. [DOI] [PubMed] [Google Scholar]
- 57.Levini RM, Peck J, Harris-Warrick RM. The ionic basis of dopamine inhibition of PD neurons in the pyloric network of the lobster stomatogastric ganglion. Soc Neurosci Abstr. 1996;22:2046. [Google Scholar]
- 58.Levitan IB. Modulation of ion channels by protein phosphorylation and dephosphorylation. Annu Rev Physiol. 1994;56:193–212. doi: 10.1146/annurev.ph.56.030194.001205. [DOI] [PubMed] [Google Scholar]
- 59.Li M, Jan YN, Jan LY. Specification of subunit assembly by the hydrophobic amino-terminal domain of the shaker potassium channel. Science. 1992;257:1225–1230. doi: 10.1126/science.1519059. [DOI] [PubMed] [Google Scholar]
- 60.Liu D-W, Gintant GA, Antzelevitch C. Ionic basis for electrophysiological distinctions among epicardial midmyocardial and endocardial myocytes from the free wall of the canine left ventricle. Circ Res. 1993;72:671–687. doi: 10.1161/01.res.72.3.671. [DOI] [PubMed] [Google Scholar]
- 61.Majumder K, De Biasi M, Wang Z, Wible BA. Molecular cloning and functional expression of a novel potassium channel beta-subunit from human atrium. FEBS Lett. 1995;361:13–16. doi: 10.1016/0014-5793(95)00120-x. [DOI] [PubMed] [Google Scholar]
- 62.Maletic-Savatic M, Lenn NJ, Trimmer JS. Differential spatiotemporal expression of K+ channel polypeptides in rat hippocampal neurons developing in situ and in vitro. J Neurosci. 1995;15:3840–3851. doi: 10.1523/JNEUROSCI.15-05-03840.1995. [DOI] [PMC free article] [PubMed] [Google Scholar]
- 63.Marder E, Calabrese RL. Principles of rhythmic motor pattern generation. Physiol Rev. 1996;76:687–717. doi: 10.1152/physrev.1996.76.3.687. [DOI] [PubMed] [Google Scholar]
- 64.Martínez-Padrón M, Ferrús A. Presynaptic recordings from Drosophila: correlation of macroscopic and single channel K+ currents. J Neurosci. 1997;17:3412–3424. doi: 10.1523/JNEUROSCI.17-10-03412.1997. [DOI] [PMC free article] [PubMed] [Google Scholar]
- 65.Massengill JL, Smith MA, Son DI, O’Dowd DK. Differential expression of K4-AP currents and Kv3.1 potassium channel transcripts in cortical neurons that develop distinct firing phenotypes. J Neurosci. 1997;17:3136–3147. doi: 10.1523/JNEUROSCI.17-09-03136.1997. [DOI] [PMC free article] [PubMed] [Google Scholar]
- 66.McCormack K, McCormack T, Tanouye M, Rudy B, Stuhmer W. Alternative splicing of the human shaker K+ channel β1 gene and functional expression of the β2 gene product. FEBS Lett. 1995;370:32–36. doi: 10.1016/0014-5793(95)00785-8. [DOI] [PubMed] [Google Scholar]
- 67.Morales MJ, Castellino RC, Crews AL, Rasmusson R, Strauss HC. A novel beta subunit increases rate of inactivation of specific voltage-gated potassium channel alpha subunits. J Biol Chem. 1995;270:6272–6277. doi: 10.1074/jbc.270.11.6272. [DOI] [PubMed] [Google Scholar]
- 68.Mottes JR, Iverson LE. Tissue-specific alternative splicing of hybrid shaker-lacZ genes correlates with kinetic differences in shaker K+ currents in vivo. Neuron. 1995;14:613–623. doi: 10.1016/0896-6273(95)90318-6. [DOI] [PubMed] [Google Scholar]
- 69.Nakahira K, Shi G, Rhodes K, Trimmer JS. Selective interactions of voltage-gated K+ channel β-subunits with α-subunits. J Biol Chem. 1996;271:7084–7089. doi: 10.1074/jbc.271.12.7084. [DOI] [PubMed] [Google Scholar]
- 70.Premack BA, Thompson S, Coombs-Hahn J. Clustered distribution and variability in kinetics of transient K channels in molluscan neuron cell bodies. J Neurosci. 1989;9:4089–4099. doi: 10.1523/JNEUROSCI.09-11-04089.1989. [DOI] [PMC free article] [PubMed] [Google Scholar]
- 71.Rettig J, Heinemann SH, Wunder F, Lorra C, Parcej DN, Dolly JO, Pongs O. Inactivation properties of voltage-gated K+ channels altered by presence of β-subunit. Nature. 1994;369:289–294. doi: 10.1038/369289a0. [DOI] [PubMed] [Google Scholar]
- 72.Rhodes KJ, Keilbough SA, Barrezueta NX, Lopez KL, Trimmer JS. Association and colocalization of K+ channel α- and β-subunit polypeptides in rat brain. J Neurosci. 1995;15:5360–5371. doi: 10.1523/JNEUROSCI.15-07-05360.1995. [DOI] [PMC free article] [PubMed] [Google Scholar]
- 73.Rhodes KJ, Monaghan MM, Barrezueta NX, Nawoschik S, Bekele-Arcuri Z, Matos MF, Nakahira K, Schechter LE, Trimmer JS. Voltage-gated K+ channel β subunits: expression and distribution of Kvβ1 and Kvβ2 in adult rat brain. J Neurosci. 1996;16:4846–4860. doi: 10.1523/JNEUROSCI.16-16-04846.1996. [DOI] [PMC free article] [PubMed] [Google Scholar]
- 74.Ribera AB. Homogeneous development of electrical excitability via heterogeneous ion channel expression. J Neurosci. 1996;16:1123–1130. doi: 10.1523/JNEUROSCI.16-03-01123.1996. [DOI] [PMC free article] [PubMed] [Google Scholar]
- 75.Roberds SL, Tamkun MM. Cloning and tissue-specific expression of five voltage-gated potassium channel cDNAs expressed in rat heart. Proc Natl Acad Sci USA. 1991;88:1798–1802. doi: 10.1073/pnas.88.5.1798. [DOI] [PMC free article] [PubMed] [Google Scholar]
- 76.Rogero O, Tejedor FJ. Immunochemical characterization and developmental expression of shaker potassium channels from the nervous system of Drosophila. J Biol Chem. 1995;270:25746–25751. doi: 10.1074/jbc.270.43.25746. [DOI] [PubMed] [Google Scholar]
- 77.Rudy B, Hoger JH, Lester HA, Davidson N. At least two mRNA species contribute to the properties of rat brain A-type potassium channels expressed in Xenopus oocytes. Neuron. 1988;1:649–658. doi: 10.1016/0896-6273(88)90164-x. [DOI] [PubMed] [Google Scholar]
- 78.Salkoff L, Baker K, Butler A, Covarrubias M, Pak MD, Wei A. An essential “set” of K+ channels conserved in flies, mice, and humans. Trends Neurosci. 1992;15:161–166. doi: 10.1016/0166-2236(92)90165-5. [DOI] [PubMed] [Google Scholar]
- 79.Sambrook J, Fritsch EF, Maniatis T. Molecular cloning: a laboratory manual, 2nd Ed. Cold Spring Harbor Laboratory; Cold Spring Harbor, NY: 1989. [Google Scholar]
- 80.Schwarz TL, Papazian DM, Carretto RC, Jan Y-N, Jan LY. Immunological characterization of potassium channel components from the Shaker locus and differential distribution of splicing variants in Drosophila. Neuron. 1990;4:119–127. doi: 10.1016/0896-6273(90)90448-o. [DOI] [PubMed] [Google Scholar]
- 81.Selverston AI, Moulins M. The crustacean stomatogastric system. Springer; Berlin: 1987. [Google Scholar]
- 82.Selverston AI, Russell DF, Miller JP, King DG. The stomatogastric nervous system: structure and function of a small neural network. Prog Neurobiol. 1976;7:215–290. doi: 10.1016/0301-0082(76)90008-3. [DOI] [PubMed] [Google Scholar]
- 83.Serôdio P, Kentros C, Rudy B. Identification of molecular components of A-type channels activating at subthreshold potentials. J Neurophysiol. 1994;72:1516–1529. doi: 10.1152/jn.1994.72.4.1516. [DOI] [PubMed] [Google Scholar]
- 84.Serôdio P, Vega-Saenz de Miera E, Rudy B. Cloning of a novel component of A-type K+ channels operating at subthreshold potentials with unique expression in heart and brain. J Neurophysiol. 1996;75:2174–2179. doi: 10.1152/jn.1996.75.5.2174. [DOI] [PubMed] [Google Scholar]
- 85.Serrano EE, Getting PA. Diversity of the transient outward potassium current in somata of identified molluscan neurons. J Neurosci. 1989;9:4021–4032. doi: 10.1523/JNEUROSCI.09-11-04021.1989. [DOI] [PMC free article] [PubMed] [Google Scholar]
- 86.Sewing S, Roeper J, Pongs O. Kvβ1 subunit binding specific for shaker-related potassium channel α subunits. Neuron. 1996;16:455–463. doi: 10.1016/s0896-6273(00)80063-x. [DOI] [PubMed] [Google Scholar]
- 87.Shahidullah M, Hoshi N, Yokoyama S, Higashida H. Microheterogeneity in heteromultimeric assemblies formed by shaker (Kv1) and shaw (Kv3) subfamilies of voltage-gated K+ channels. Soc Neurosci Abstr. 1996;22:1754. doi: 10.1098/rspb.1995.0152. [DOI] [PubMed] [Google Scholar]
- 88.Shen NV, Pfaffinger P. Molecular recognition and assembly sequences involved in the subfamily-specific assembly of voltage-gated K+ channel subunit proteins. Neuron. 1995;14:625–633. doi: 10.1016/0896-6273(95)90319-4. [DOI] [PubMed] [Google Scholar]
- 89.Sheng M, Tsaur M-L, Jan YN, Jan LY. Subcellular segregation of two A-type K+ channel proteins in rat central neurons. Neuron. 1992;9:271–284. doi: 10.1016/0896-6273(92)90166-b. [DOI] [PubMed] [Google Scholar]
- 90.Sheng M, Liao YJ, Jan YN, Jan LY. Presynaptic A-current based on heteromultimeric K+ channels detected in vivo. Nature. 1993;365:72–75. doi: 10.1038/365072a0. [DOI] [PubMed] [Google Scholar]
- 91.Shi G, Nakahira K, Hammond S, Rhodes KJ, Schechter LE, Trimmer JS. Beta subunits promote K+ channel surface expression through effects early in biosynthesis. Neuron. 1996;16:843–852. doi: 10.1016/s0896-6273(00)80104-x. [DOI] [PubMed] [Google Scholar]
- 92.Simmers J, Meyrand P, Moulins M. Dynamic networks of neurons. Am Sci. 1995;83:262–268. [Google Scholar]
- 93.Solc CK, Zagotta WN, Aldrich RW. Single-channel and genetic analyses reveal two distinct A-type potassium channels in Drosophila. Science. 1987;236:1094–1098. doi: 10.1126/science.2437657. [DOI] [PubMed] [Google Scholar]
- 94.Sucher NJ, Deitcher DL. PCR and patch-clamp analysis of single neurons. Neuron. 1995;14:1095–1100. doi: 10.1016/0896-6273(95)90257-0. [DOI] [PubMed] [Google Scholar]
- 95.Tejedor FJ, Bokhari A, Rogero O, Gorczyca M, Zhang J, Kim E, Sheng M, Budnik V. Essential role for dlg in synaptic clustering of shaker K+ channels in vivo. J Neurosci. 1997;17:152–159. doi: 10.1523/JNEUROSCI.17-01-00152.1997. [DOI] [PMC free article] [PubMed] [Google Scholar]
- 96.Tierney AJ, Harris-Warrick RM. Physiological role of the transient potassium current in the pyloric circuit of the lobster stomatogastric ganglion. J Neurophysiol. 1992;67:599–609. doi: 10.1152/jn.1992.67.3.599. [DOI] [PubMed] [Google Scholar]
- 97.Tsaur M-L, Sheng M, Lowenstein DH, Jan YN, Jan LY. Differential expression of K+ channel mRNAs in the rat brain and down-regulation in the hippocampus following seizures. Neuron. 1992;8:1055–1067. doi: 10.1016/0896-6273(92)90127-y. [DOI] [PubMed] [Google Scholar]
- 98.Tsunoda S, Salkoff L. Genetic analysis of Drosophila neurons: shal, shaw, and shab encode most embryonic potassium currents. J Neurosci. 1995a;15:1741–1754. doi: 10.1523/JNEUROSCI.15-03-01741.1995. [DOI] [PMC free article] [PubMed] [Google Scholar]
- 99.Tsunoda S, Salkoff L. The major delayed rectifier in both Drosophila neurons and muscle is encoded by shab. J Neurosci. 1995b;15:5209–5221. doi: 10.1523/JNEUROSCI.15-07-05209.1995. [DOI] [PMC free article] [PubMed] [Google Scholar]
- 100.Veh RW, Lichtinghagen R, Sewing S, Wunder F, Grumbach IM, Pongs O. Immunohistochemical localization of five members of the Kv1 channel subunits: contrasting subcellular locations and neuron-specific colocalizations in rat brain. Eur J Neurosci. 1995;7:2189–2205. doi: 10.1111/j.1460-9568.1995.tb00641.x. [DOI] [PubMed] [Google Scholar]
- 101.Villarroel A, Schwarz TL. Inhibition of the Kv4 (Shal) family of transient K+ currents by arachidonic acid. J Neurosci. 1996;16:2522–2531. doi: 10.1523/JNEUROSCI.16-08-02522.1996. [DOI] [PMC free article] [PubMed] [Google Scholar]
- 102.Wang H, Kunkel DD, Martin TM, Schwartzkroin PA, Tempel BL. Heteromultimeric K+ channels in terminal and juxtaparanodal regions of neurons. Nature. 1993;365:75–79. doi: 10.1038/365075a0. [DOI] [PubMed] [Google Scholar]
- 103.Warmke J, Ganetzky B. A family of potassium channels related to eag in Drosophila and mammals. Proc Natl Acad Sci USA. 1994;91:3438–3442. doi: 10.1073/pnas.91.8.3438. [DOI] [PMC free article] [PubMed] [Google Scholar]
- 104.Warmke J, Drysdale R, Ganetzky B. A distinct potassium channel polypeptide encoded by the Drosophila eag locus. Science. 1991;252:1560–1562. doi: 10.1126/science.1840699. [DOI] [PubMed] [Google Scholar]
- 105.Willms A. Hodgkin–Huxley models: parameter estimation issues, an application to spike frequency adaptation, and analysis of a subcritical Hopf bifurcation. PhD dissertation, Cornell University; Ithaca, NY: 1997. [Google Scholar]
- 106.Wymore RS, Negulescu D, Kinoshita K, Kalman K, Aiyars J, Gutman GA, Chandy KG. Characterization of the transcription unit of mouse Kv1.4, a voltage-gated potassium channel gene. J Biol Chem. 1996;271:15629–15634. doi: 10.1074/jbc.271.26.15629. [DOI] [PubMed] [Google Scholar]
- 107.Xu J, Yu W, Jan YN, Jan LY, Li M. Assembly of voltage-gated potassium channels. J Biol Chem. 1995;270:24761–24768. doi: 10.1074/jbc.270.42.24761. [DOI] [PubMed] [Google Scholar]
- 108.Yu W, Jia X, Li M. NAB domain is essential for the subunit assembly of both α-α and α-β complexes of shaker-like potassium channels. Neuron. 1996;16:441–453. doi: 10.1016/s0896-6273(00)80062-8. [DOI] [PubMed] [Google Scholar]
- 109.Zhong Y, Wu C-F. Alteration of four identified K+ currents in Drosophila muscle by mutations in eag. Science. 1991;252:1562–1564. doi: 10.1126/science.2047864. [DOI] [PubMed] [Google Scholar]
- 110.Zhong Y, Wu C-F. Modulation of different potassium currents in Drosophila: a hypothetical role for the EAG subunit in multimeric K+ channels. J Neurosci. 1993;13:4669–4677. doi: 10.1523/JNEUROSCI.13-11-04669.1993. [DOI] [PMC free article] [PubMed] [Google Scholar]