

Abstract
Video time-lapse microscopy has made it possible to document growth cone motility during axon navigation in the intact brain. This approach prompted us to reanalyze the hypothesis, originally derived from observations of fixed tissue, that growth cone form is position-specific. The behaviors of DiI-labeled retinal axon growth cones were tracked from retina through the optic tract in mouse brain at embryonic day (E) 15–17, and these behaviors were matched with different growth cone forms. Patterns of behavior were then analyzed in the different locales from the retina through the optic tract.
Throughout the pathway, episodes of advance were punctuated by pauses in extension. Irrespective of locale, elongated streamlined growth cones mediated advance and complex forms developed during pauses. The rate of advance and the duration of pauses were surprisingly similar in different parts of the pathway. In contrast, the duration of periods of advance was more brief in the chiasm compared to those in the optic nerve and tract. Consequently, in the chiasm, growth cones spent relatively more time pausing and less time advancing than in the optic nerve or tract. Thus, because growth cone form is behavior-specific and certain behaviors predominate in particular loci, growth cone form appears to be position-specific in static preparations, due to the fraction of time spent in a given state in different locales.
Keywords: retinal ganglion cells, growth cone morphology, growth cone behavior, decision regions, optic chiasm, optic nerve, optic tract
In the nervous systems of a wide variety of species, growth cones exhibit striking changes in their morphology in different cellular contexts (see, for example, Speidel, 1942; Roberts and Taylor, 1983; Tosney and Landmesser, 1985; Caudy and Bentley, 1986;Bovolenta and Mason, 1987; Holt, 1989; Bovolenta and Dodd, 1990; Kim et al., 1991; Yaginuma et al., 1991; Hollyday and Morgan-Carr, 1995; Ramon y Cajal, 1995). In nerves and tracts, growth cones display simple streamlined forms and in decision regions, complex forms. These observations were culled from fixed preparations and were, by necessity, snapshots of dynamic scenes. The morphogenetic transitions are believed to reflect responses to local cellular and extracellular cues (Bovolenta and Mason, 1987; Williams et al., 1991), and vary according to growth order (Lopresti et al., 1973; Nordlander, 1987;Wilson and Easter, 1991; Fitzgerald and Reese, 1992; Burrill and Easter, 1995).
Our studies on growth cone morphogenesis have focused on the retinal axon path from the retina toward targets. This path is comprised of segments in which growth cones grow relatively straight ahead, such as the optic nerve and tract, as well as a classic example of a decision region, the optic chiasm, where axons resort and change trajectory (Bovolenta and Mason, 1987; Godement et al., 1990). Static and dynamic analyses of retinal growth cone extension have shown that uncrossed fibers, arising exclusively from ventrotemporal retina, grow toward the chiasm midline, develop complex branched growth cones, and make a turn back to the ipsilateral optic tract (Sretavan and Reichardt, 1993; Godement et al., 1994). This finding led to the hypothesis that cues localized at the chiasmatic midline instigate dramatic changes in growth cone form and behavior, that in turn lead to retinal axon divergence (Marcus et al., 1995; Wang et al., 1995).
Dynamic chronicles of axon growth in vivo obtained with video time-lapse microscopy have revealed features of growth cone motility, including the tempo of advance. These analyses have also indicated that growth cone forms undergo constant remodeling, both along paths and within targets (Harris et al., 1987; O’Rourke and Fraser, 1990; Kaethner and Stuermer, 1992; Dailey et al., 1994; Danks et al., 1994; Halloran and Kalil, 1994; O’Rourke et al., 1994). Further, the documentaries have suggested that the principle of position-specific morphology is not strict. For example, the streamlined forms typical of growth cones in tracts have been sited in decision regions (Godement et al., 1994).
With video time-lapse recording of dye-labeled growth cones in a semi-intact preparation of the embryonic visual system (Godement et al., 1994), the present study tests the hypothesis that growth cone form is position-specific. We examined whether specific growth cone forms developed during certain behaviors and if so, which behaviors, and thus forms, were predominant in each locale. Instead, growth cone form is related to particular behaviors, and certain behaviors predominate in the different parts of the trajectory of growing axons, resulting in a “read-out” of static preparations, that growth cone form is position-specific.
MATERIALS AND METHODS
Isolated brain preparation
Embryos at ages E14–E15 were derived from a timed-pregnancy breeding colony of C57BL/6J mice maintained under our direction at Columbia University. The first day of gestation was considered P0.
The dissection of the isolated brain preparation for video microscopy was performed essentially as described (Godement et al., 1994), except that the dorsal diencephalon containing the optic tract and lateral geniculate nucleus was included in the preparation. To do this, the entire brain was removed once the retinae and optic nerves were dissected. The cortex was cut away and the third ventricle was cut at the dorsal aspect. The preparation was flattened in an “open book configuration” with the ventral and lateral aspects of the diencephalon, including the optic tracts, apposed to the coverslip surface of the culture dish, such that the entire visual pathway could be viewed simultaneously (Fig.1A).
Fig. 1.
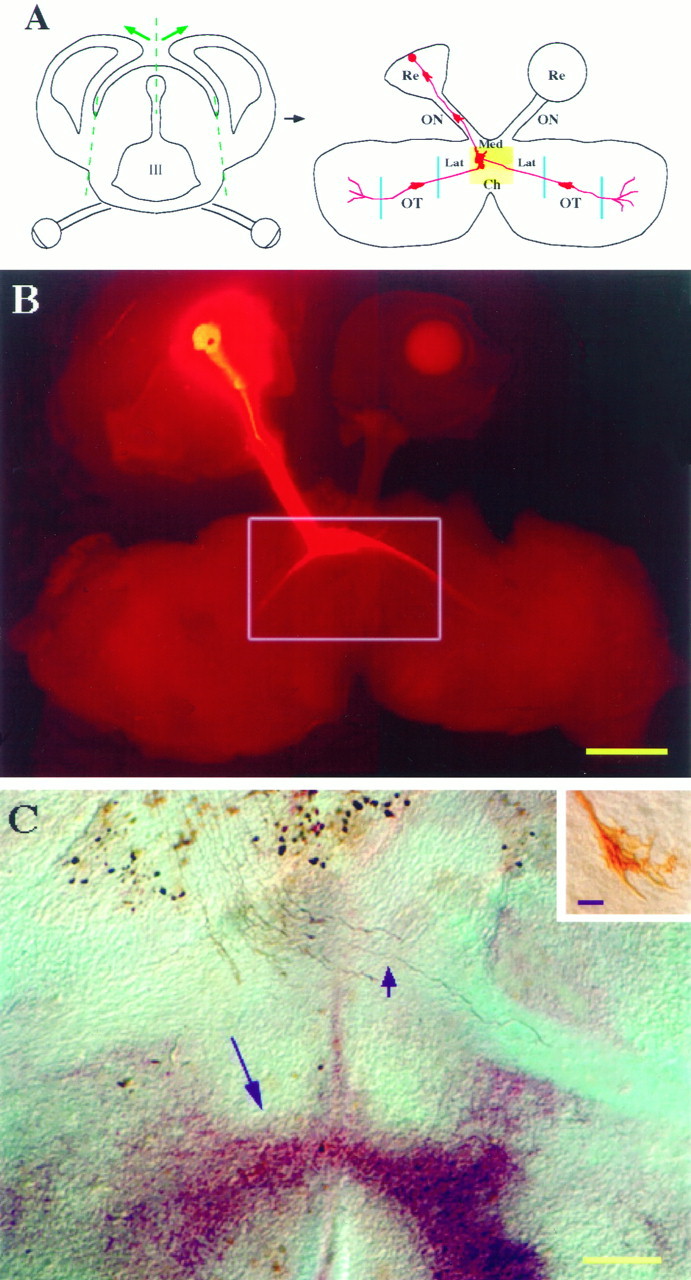
Isolated preparation of the embryonic mouse retinal axon pathway. A, Diagram of a transverse section (left panel) and “open book” preparation (right panel) of the retinal axon pathway at E14. As shown in transverse section, the cerebral cortex was removed with cuts along the lateral dashed lines, and the third ventricle (III) was opened at the dorsal aspect (middle dashed line). The prep was placed ventral and lateral-sides-down on the coverslip surface of the culture dish, as on the right. A DiI crystal was placed in peripheral ventrotemporal or dorsotemporal retina and the prep was stored in the incubator overnight. Growth cones were monitored as they extended through one or more regions from the retina through the chiasm and into the optic tract (Table 1). The preparation on the rightis “flipped” bottom-side-up with regard to the brain on theleft, and it shows the prep as viewed with the objective of the inverted microscope. The orientation of the prep matches all other figures in this paper, with the retinae and labeled axons at thetop of the figure and optic tracts at thebottom. Re, Retina; ON, optic nerve; Ch, medial (Med) and lateral (Lat) chiasm; OT, optic tract.B, Low-power view of DiI-labeled axons in an intact open-book preparation. The preparation was made at E14, incubated overnight, and fixed after monitoring for 8 hr. This image was obtained with epifluorescence illumination, together with low bright-field illumination to view both the outlines of the prep and the labeled axons. Box refers to approximate area shown inC, although C is a different preparation. Scale bar, 200 μm. C, The trajectory of retinal ganglion cell axons in the optic chiasm. Horizontal view of the optic chiasm of a preparation similar to those monitored by video microscopy, as in A (right panel). After 14 hr culture, the prep was fixed, vibratome-sectioned, photoconverted, and immunostained with a monoclonal antibody to SSEA-1. DiI-labeled axons appear brown, and the specialized early neuronal population resident to the ventral diencephalon, seen here as an inverted V-shaped cell arrangement (long arrow) (Marcus et al., 1995), appears red because of an alkaline phosphatase-conjugated second antibody, developed with phosphatase reagents (HistoMark, KPL, Gaithersburg, MD). Inset shows a growth cone that crossed the midline (short arrowpoints to position of this growth cone in C, which is out of the focal plane in the low-power micrograph). Scale bar: 200 μm; inset, 10 μm.
With a micropipette, a small crystal of DiI (1, 1′, dioctadecyl-3,3,3′,3′-tetramethylindocarbocyanine perchlorate, Molecular Probes, Eugene, OR) was applied near the periphery of the retina for labeling small numbers of ganglion cells and their growth cones. For video imaging, the DiI labeling was on a much smaller scale than in the prep in Figure 1B. In the most optimal cases, 1–5 fibers were labeled in the growing front. In ventrotemporal retina that give rise primarily to uncrossed fibers and to some crossed fibers, 47 preps were labeled, and 26 were labeled in dorsotemporal retina, a source of crossed fibers (Dräger, 1985; Godement et al., 1987a; Godement et al., 1987b; Colello and Guillery, 1990;Godement et al., 1990; Sretavan, 1990). After dye application, medium was added (DMEM/F12 serum-free medium supplemented with 15 mm HEPES buffer, 33 mm glucose, 0.4% methylcellulose, 1% BSA, 5 mg/l insulin, 5 mg/l transferrin, 5 μg/L sodium selenite (Sigma medium supplement, Cat. No. I-1884, Sigma, St. Louis, MO) and 20 U/ml penicillin/streptomycin), and preparations were incubated at 35°C overnight before monitoring.
Time-lapse image acquisition
Time-lapse video recordings were made as described (Godement et al., 1994) as growth cones grew in the retinae, optic nerves, lateral and medial regions of the chiasm, and optic tracts (Fig. 1, Table1). The culture dish was placed on the stage of a Zeiss Axiovert 35 with a 100 W mercury lamp, maintained at 33–36°C with a thermostatically driven heater. Potentially damaging illumination was reduced by placing a neutral density filter and a shutter (Uniblitz, Vincent Associates, Rochester, NY) in the light path. Images were obtained with a Hamamatsu SIT camera and recorded onto an optical disk recorder (Panasonic) after being processed by a digital image processer (IMAGE-1 or METAMORPH, Universal Imaging Corp., West Chester, PA). Axons were observed with lower power objectives (10× and 20×) for up to 47 hr, taking one frame every 15 or 20 min. Growth cone morphology was viewed at 1 or 3 min intervals at higher magnification using an oil-immersion objective (100×), for up to 13 hr. At the beginning and end of each recording session, or when switching recording fields, a frame was captured with phase or brightfield at 10× or 20× magnification to view the orientation of the preparation, and to determine the position of the growth cone.
Table 1.
Recordings of individual growth cones through segments of the retinal axon path

| Retina | Optic nerve | Chiasm (lateral) | Chiasm (medial)* | Optic tract | |||||
|---|---|---|---|---|---|---|---|---|---|
The lines represent the relative distance over which individual retinal axons were monitored, with the start point at left and the stop point at right. Some of the axons traversed several locales. Only approximate spatial indications are given, without consideration of time.
Vertical lines indicate the midline.
Postimmunostaining of movie preparations
A number of preparations were fixed, photoconverted, and immunostained after monitoring, to verify the location of the monitored growth cones and to study the morphology of the growth cones (Fig.1C). After the last image was obtained, the preparation was fixed with 4% paraformaldehyde for 1 hr, embedded in agar, sectioned at 100–150 μm on a vibratome, and collected in phosphate buffer. DiI labeling was then photoconverted from a fluorescent compound to a dark brown reaction product as described previously (Marcus et al., 1995). Vibratome sections with DiI-labeled axon growth cones were immunostained after photoconversion with monoclonal antibody RC2 (reveals radial glia in the embryonic mouse CNS and a radial glial palisade in the midline of the optic chiasm) or SSEA-1 (recognizes epitopes found on embryonic stem cells and a subset of cells at the direct chiasmatic midline), as described previously (Marcus et al., 1995).
Analysis of time-lapse sequences
To understand the relationship between growth cone behavior and form, growth cone maneuvers were documented with time-lapse video microscopy in the retinae, optic nerves, optic chiasm, and optic tracts (Fig. 1A,B). The present observations were based on imaging of 26 axons at low power and 40 axons at high power, selected from ∼100 sequences in 73 preparations. One or two axons were recorded from a single preparation. Criteria for inclusion of sequences for further analysis were that the sequence lasted for at least 1 hr, that axons did not display beading throughout the recording, and that they advanced during the course of recording or the growth cone was still motile at the end of the recording. At low power (10× and 20×), growth cone motility was monitored with little deleterious effect for up to 47 hr. During the recordings at low power, some growth cones traversed several segments of the pathway, yielding a total of 39 sequences in the different locales, even though only 26 axons were studied (Table 1). In the sequences that contained healthy advancing axons, the average time of recording and distance monitored for individual fibers and their growth cones at low power was 7 hr and 256 μm, and at high magnification, 3.25 hr and 94 μm.
To track the movements and tempo of growth of retinal growth cones, preparations showing small numbers (less than 5) of well-labeled fibers were used, at low power. The kinetics (advance/pause cycles, and rates of growth) were computed with the Image-1 system, as described previously (Godement et al., 1994), using the “track point function” to generate a list of points representing the movement of the same growth cone (Fig. 4). The plots indicate the position of the neck of the growth cone (the neurite immediately behind the body of the growth cone), rather than the growth cone center or tip, because the latter structures could change dramatically without the extension of the neurite, as is the case during a pause. From these plots, the duration of the pauses and advances was computed in the different regions of the visual pathway. To measure the rate of advance of individual growth cones, the distance moved over time was measured with the same function and statistically analyzed. The data from the medial chiasmatic area was compared to data from the other sites.
Fig. 4.

Retinal axon growth is intermittent in all regions from retina to optic tract. Plots of growth cone kinetics, recorded at low power and representing growth cone movement over time and space. Each circle represents the position of the neck of the growth cone, recorded every 15 min at low power. Pauses are evident where circles overlap or come together (arrows point to select examples), usually where extension of the neck did not occur or was <7 μm. All growth cones moved from top left tolower right. Dashed line inA indicates the entrance of the optic nerve.Dashed lines in C indicate the division between lateral region of the chiasm and the chiasmatic midline zone.Solid line in C indicates midline. Note that pauses occur in every locus. Scale bar, 100 μm.
For analysis of morphological changes, growth cones were viewed at high magnification. Growth cones were chosen if few other fibers or growth cones were labeled in that area, so that the background fluorescence would not obscure the edges of the neurite or growth cone. To determine the changes in growth cone form, the forms were determined in consecutive individual frames and viewed on the TV monitor. The image from each frame was then edited and printed directly on a Phaser color printer with Adobe photoshop software (version 3.0). To determine growth cone form change with respect to behavior, the maintenance of and transitions in growth cone form were determined in consecutive frames of the high power sequence. The corresponding behavioral states were correlated in each frame sequence, by comparing the position of the neck of the growth cone in consecutive frames. The relationship between growth cone form and behavior is presented in histogram form in Figures 5 and 8. To demonstrate that growth cone form appears to be position-specific in static preparations as a function of time spent in a particular state, the duration of traverse over 100 μm was calculated for each position, with the start and stop of each recording noted at low power. The predominance of growth cone forms was expressed as a percentage of the total time spent in simple or complex growth cone shapes per 100 μm (Fig. 10).
Fig. 5.

Growth cone forms represent specific behaviors in all positions along the retinofugal pathway. Growth cone form was analyzed with respect to behavior. Frames were recorded at high magnification, and sequences were pooled from all positions. They-axis represents the percentage of frames that contain growth cones had simple or complex forms during extension, pausing, or retraction. A majority of growth cones that were simple (77%) were advancing, whereas most growth cones that were complex (94%) were pausing.
Fig. 8.

Growth cone shape is behavior-specific in all positions. As in Figure 5, growth cone shape and behavior were correlated for each position along the retinofugal path. A majority of simple growth cones were advancing, whereas complex growth cones were in a pausing state or had retracted. Sequences (with one growth cone per sequence) were recorded in the retina (n = 3), optic nerve (n = 2), lateral chiasm (n = 8), chiasm midline (n = 20), and optic tract (n = 7).
Fig. 10.

Predominance of growth cone forms in different locales. This histogram indicates the percentage of the time spent traversing 100 μm, during which growth cones adopted simple or complex forms, reflecting the time spent in advance or pause states, respectively, in the several locations in the retinal axon path. For each growth cone recording made at high power, the total distance traveled and the time it took to traverse this distance was determined by marking the start and stop points of the chronicles at low power. The percentage of this time that a growth cone was simple or complex was then computed. The same data used for Figure 8 were analyzed here.
RESULTS
Growth cone behaviors along the retinal axon path
In the preparations analyzed in this study, retinal axons cultured overnight after dye application and then monitored by video microscopy for an additional 3–24 hr (with a few up to 47 hr), grew in the same pathways as in the intact embryo (Fig. 1B). Even though E14 embryos were used throughout, the location of the growing front of labeled growth cones varied depending on the proximity of DiI application to the optic disk: after the overnight culture period, injections near the disk labeled growth cones as far as the optic tract, whereas injections near the retinal periphery labeled growth cones in the retina and optic nerve. Many of the recordings were made within one locale, but other recordings tracked growth cones over one to two additional locales (Table 1).
Several basic behaviors—extension, pausing, retraction, and branching—were observed along the retinal axon pathway (Fig.2). Extension was defined as relatively straightforward advance of the neurite and the growth cone. We detected extension by the progression of the neck of the growth cone (the neurite immediately behind the body of the growth cone), rather than the tip, that could change shape and thus position without neurite advance. During pauses, there was little or no advance of the growth cone neck but protrusive activity continued, with extensive remodeling and changes in the form of the growth cone. As in growth cone collapse in vitro(see, for example, Kapfhammer and Raper, 1987; Bandtlow et al., 1990), retraction involved the withdrawal of the neck and the body of the growth cone ∼4-10 μm, often with a fine strand of cytoplasm remaining where the growth cone tip was located (Fig.2E). In the retina, optic nerve and tract, retraction was seen in approximately half of the axons monitored at least once during the recording, but was rarely seen in the chiasmatic midline region (in only 2 of 20 axons). Branching occurred exclusively at the growth cone distal to the neck, and the growth cone itself bifurcated (Fig. 7).
Fig. 2.

Growth cone behaviors and associated forms. Time-lapse video sequences of the forms of growth cones during different behaviors. Both simple and complex forms were found during advance and pausing, respectively, in both the chiasm and the tract. Time is denoted in minutes in the top right corner.A, A simple growth cone extends rapidly within the midline region of the optic chiasm. B, A growth cone in the optic tract. The recording began with an advance, followed by a short pause, as displayed by the broadened shape at 30 min. Between 50 and 90 min, the growth cone extended again by means of a simple form. The direction of growth then shifted, and the growth cone advanced more rapidly. The growth cone paused again at the end of the last frame shown (90 min) and spread. C, In the optic chiasm, a pausing growth cone has a complex filopodia-bearing form. Although there was no net advance for over 205 min, the exact shape of the complex form changed considerably and the growth cone appendages were motile. D, In the optic tract, this growth cone paused between 10 and 35 min, with a complex form developing during the pause. After the pause, the growth cone developed a simple form and advanced quickly (40 min). E, Retraction of a growth cone in the optic tract. This growth cone advanced (at 0 min), then retracted (10 min), leaving a thin strand (arrow). Reextension was followed by a second retraction (40–55 min). Extension then resumed (75 min) with a slight change in the angle of trajectory. Scale bar, 10 μm.
Fig. 7.

Growth cone branching is common during a shift in direction. This growth cone navigated from the optic nerve into the lateral region of the chiasm. The growth cone branched four times: at 0, 55, 105, and 145 min. Each time, one branch dominated and led to a shift from the direction of the parent neurite to growth in the axis of that branch, while the another branch withdrew. Time is denoted in minutes. Scale bar, 10 μm.
The above behaviors were displayed in certain combinatorial patterns. Retractions commonly occurred at the end of an advance period, but only after a short pause and never after a long pause (Fig.2E). Shifts in direction were never seen without a long pause preceding the shift, and could be dramatic, such as during a turn (Fig. 3A, 10:30–14:00), or subtle (Fig. 6A, 55–115), with a change of only a few degrees in the path of growth. Sharp turns, described previously in optic chiasm (Godement et al., 1994), involved multiple pauses and advances, with only small increments in net advance until after the turn was complete, then extension was rapid (see Fig.4C, trace 3). Branching always occurred during a pause.
Fig. 3.
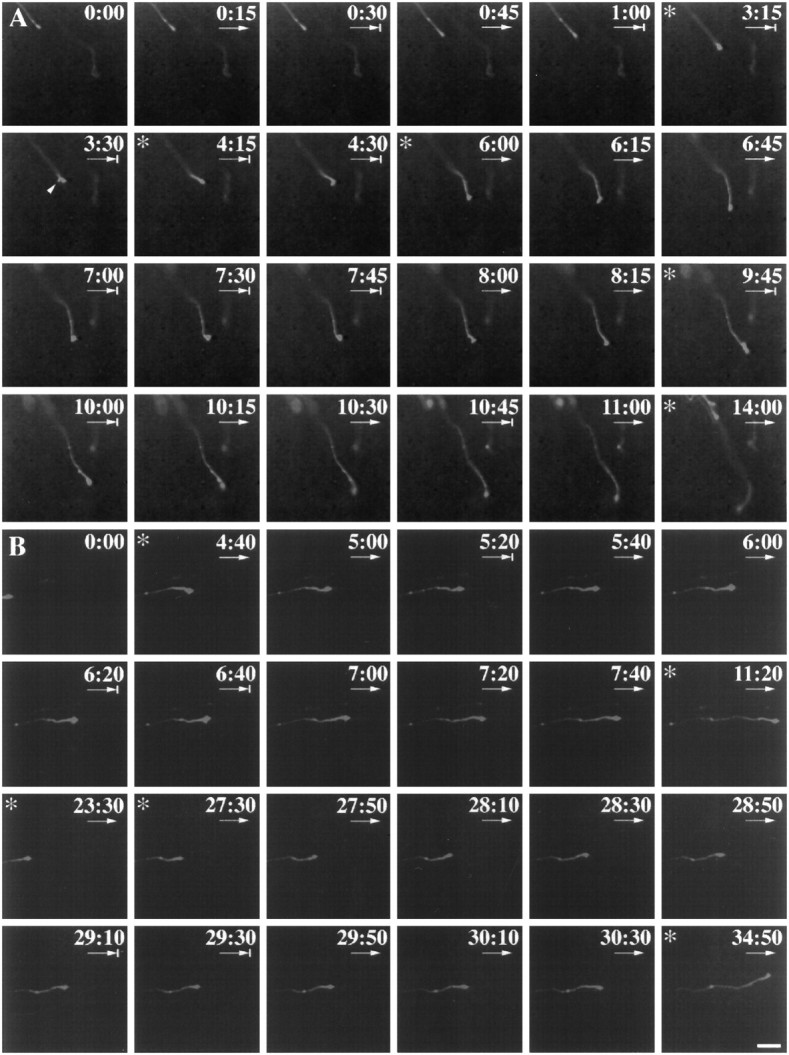
Intermittent growth is a common feature of growth cone motility, in both the optic chiasm (A), a decision region, and the optic tract (B), a straight path. In the chiasmatic midline region, axons pause frequently and elongate in short bursts, whereas in lateral chiasm region and optic tract, axons elongate for long periods and pause infrequently. Both chronicles were made over many hours (chiasm, 14 hr; tract, 34 hr). Frames were taken in the chiasm every 15 min, and in the tract, every 20 min.Asterisk indicates a break in the sequence of the frames displayed. Arrows under the time pointsignify advance with respect to the previous frame.Arrows with a short vertical line in front of the arrowhead signify a pause. Time is denoted in hours and minutes. Scale bar, 100 μm. In A, a growth cone from ventrotemporal retina advanced at the starting point of recording (0:00) in the lateral chiasm region, paused between 0:15 and 0:30, and then underwent another round of extension and pausing (0:30–1:00). Subsequently, there was a long period of extension, and then the growth cone paused (3:15) and started to split (arrowhead, 3:30). The right branch slightly shifted its angle of orientation and continued to advance until another pause (4:15–4:30), when the growth cone considerably changed its angle of orientation along the axis of the midline (downwardin frame). The growth cone then made many small advances and pauses up to 10:45. Subsequently, the growth cone turned away from the midline (between 11:00 and 14:00). In B, an uncrossed growth cone from ventrotemporal retina was recorded just after it diverged from crossed fibers and entered the ipsilateral optic tract (0:00). From 0:00 to 4:40, the growth cone advanced rapidly and paused several times. From 4:40, the growth cone rapidly extended (4:40–5:00), paused briefly (5:20), and advanced again until 6:00. From 6:00 to 6:40, the growth cone paused, advanced (6:40–7:40), and subsequently underwent similar intermittent growth until 11:20, thus traveling ∼3200 μm in 11 hr. The frame was shifted at 23:30, and over the next 11 hr, the growth cone advanced in a saltatory manner for an additional 11 hr. Note that although viewed at low power, growth cones were seen to develop expanded forms reminiscent of complex growth cones when pausing (e.g., 3:30, 7:00–7:30 in A, and 6:20–6:40 inB). Time is denoted in hours and minutes. Scale bar, 100 μm.
Fig. 6.

Transitions in growth cone form and behavior.A, This growth cone paused at the entrance of the chiasm (0–55 min) and maintained a spread, complex form, retracted slightly by 85 min, then changed direction by means of a complex growth cone, and advanced rapidly with a simple form (115–170). B, This growth cone (1) paused in the chiasmatic midline in a complex form (0–21 min), (2) advanced (21–84 min) with a simple form, (3) retracted (84–108 min), (4) paused (108–159 min), and (5) grew again (159–180 min). Time is denoted in minutes. Scale bar, 10 μm.
The tempo of motility was appreciated by viewing the video sequences during playback of frames, as well as by comparing the position of the growth cone from frame to frame. Both of these modes of observation showed that growth cone advance was punctuated by pauses or retractions in every portion of the retinal axon path, in the optic chiasm (Fig.3A) (Godement et al., 1994), as well as in nondecision regions such as the optic tract (Figs. 3B, 4).
To graphically depict intermittent growth, axon extension was plotted as a function of distance (Fig. 4), with each circle representing the position of the growth cone (Godement et al., 1994), viewed at low magnification. Extension was defined as the advance of the neck of the growth cone more than 7 μm (the smallest increment in advance that could be reliably detected at low magnification) in the space of 15 min (the interval between two frames in low magnification chronicles). Pauses were defined as no net extension or extension less than 7 μm in the space of 15 min. This analysis confirmed that pauses occurred in every part of the pathway, lasting from 15 min to over 1 hr (Table2). Between pauses, advance occurred in periods of 20–90 min.
Table 2.
Growth cone extension along the retinal axon patha
| Retina | Optic nerve | Chiasm (lateral) | Chiasm (medial) | Optic tract | |
|---|---|---|---|---|---|
| Total number of axons analyzed2-b | 6 | 4 | 9 | 14 | 6 |
| Total distance over which growth cones were monitored (μm) | 2635 | 931 | 1722 | 2753 | 1938 |
| Total observation time (hr) | 49 | 18 | 32 | 137 | 47 |
| - - - - - - - - - - - - - - - - - - - - - - - - - | |||||
| Rate during advance (μm/hr) | 58 ± 14 | 52 ± 13 | 52 ± 21 | 51 ± 16 | 50 ± 18 |
| Significance (pvalue)2-c | NS | NS | NS | Ref | NS |
| - - - - - - - - - - - - - - - - - - - - - - - - - | |||||
| Average duration of advance (min) | 95 ± 106 | 53 ± 22 | 50 ± 40 | 40 ± 24 | 76 ± 65 |
| (n = episodes2-d) | (n = 24) | (n = 17) | (n = 30) | (n = 100) | (n = 21) |
| Significance (pvalue) | <0.05 | NS | NS | Ref | <0.05 |
| Average duration of pauses (min) | 25 ± 5 | 17 ± 5 | 22 ± 6 | 31 ± 16 | 23 ± 13 |
| (n = episodes2-d) | (n = 22) | (n = 15) | (n = 28) | (n = 112) | (n = 19) |
| Significance (pvalue) | NS | NS | NS | Ref | NS |
| Ratio of average duration of advance/average duration of pause | 3.8 | 3.1 | 2.3 | 1.3 | 3.3 |
| - - - - - - - - - - - - - - - - - - - - - - - - - | |||||
| Average overall growth rate (μm/hr) | 57 ± 17 | 49 ± 7 | 45 ± 17 | 38 ± 11 | 49 ± 17 |
| Significance (pvalue) | <0.05 | NS | NS | Ref | NS |
Data expressed as mean ± SD.
Some individual axons traversed more than one locale (as indicated in Table 1).
Data were statistically analyzed using one-way ANOVA and compared to medial chiasm values as the reference values (Ref; n = 10 crossed, 2 uncrossed, 2 unknown axons). NS, Not significant.
Each episode equaled a pause-advance-pause cycle.
To summarize the behaviors, growth cones display advances, pauses, retractions, and branching. The transition from one behavior to the other usually occurs in a certain sequence. Finally, in every part of the pathway, intermittent growth occurs, consisting of cycles of extension and pausing.
Growth cone form is behavior-specific
To investigate to what extent growth cone form is position-specific, we examined whether growth cone form is behavior-specific, then investigated the applicability of these correlations to the different locales from retina to optic tract. Two broad categories of growth cone form were constructed. Simple growth cones were defined as having an elongated body (∼5-15 μm long by 4 μm wide), either scalloped in outline due to lamellopodia extending from the growth cone core (e.g., Fig. 2A, 50 min; Fig. 2C, 135 min) or torpedo-like (Fig.6A, 135 and 170 min). Complex growth cones had a body that was twice as broad as long, usually had an irregular outline, and commonly bore filopodia (e.g., Figs. 2C,D,6A, 0–55 min; Fig. 6B, 0, 21, 108–159 min). In general, the categories and dimensions corresponded to those in Bovolenta and Mason (1987) and Godement et al. (1994). Within the complex category was a subcategory of hypercomplex growth cones, described in our previous studies as having spread forms in a Y-shape, or a tri-partite branched configuration, in which one or two of the thick branches were tipped with a smaller complex growth cone (see Godement et al., 1994, their Figs. 9, 10).
Fig. 9.

The rhythm of growth cone progression in the optic chiasm and tract. The incidence of pause (x) and advance (–) periods was charted over time, in successive frames with a 15 min interval, for a select group of axons in low-power chronicles, indicating the “beat” or rhythm of progression through these regions. Each line of symbols is a temporal rather than spatial representation (compare to Fig. 4). A, Optic chiasm. All fibers in this figure crossed the midline, indicated by a vertical line. Before crossing the midline, most growth cones had a higher frequency of advance-pause cycles and displayed brief periods of extension. After crossing the midline, advance periods were longer. B, Optic tract. In contrast to growth cone progression in the optic chiasm in A, the duration of extension periods was longer and the cycling from advance to pause was less frequent. Thus, retinal axons undergo shorter bouts of extension and pause more frequently in the chiasm compared to the tract.
The two general forms of growth cone described above, simple and complex, were then correlated with three growth cone behaviors, extension, pausing, and retraction. For this analysis, motility was not measured with the track point function, as at low power, but, rather, by the comparison of form and behavior in consecutive frames with a 3 min interval, viewing at high magnification. When the form changed, the series was reanalyzed up to that point and the behaviors noted through that series of frames. Advance was considered as extension of the neck of the growth cone more than 2 μm in the space of 3 min (the interval between two frames in high magnification recordings). Pauses were defined as no net extension or extension less than 2 μm in the interval of 3 min. When a given form was maintained throughout a set of frames, the percentage of the frame pairs that had growth cones displaying particular behaviors was computed, summing data from recordings in each locale.
Of the frames where growth cones displayed simple shapes (n = 40 growth cones; 3213 total frame pairs), 77% were advancing, 16% were pausing and 7% retracted. In contrast, of the frames that contained growth cones with complex shapes (n = 40 growth cones; 5785 total frames), 94% were pausing, 3% were advancing and 3% had retracted (Fig.5).
To further investigate the relationship of growth cone form to behavior, we studied the transitions in growth cone behavior and analyzed whether the form changed according to the above correlations. First, when growth cones were pausing, then began to advance, the shape transited from a complex to a streamlined form (Fig.6A, 100–135 min; Fig.6B, 21–84 min). Second, when growth cones transited from advancing to a pause state (Fig. 2B, 70–90 min) or upon retraction (Fig. 2E, 0–10 min; Fig.6B, 84–108 min), growth cones became complex. Third, during a pause or recovery from a retraction, small advances could be made by a complex growth cone over a short period of time and at a slow rate (Fig. 2E, 10–40 min; Fig. 6A, 100–115 min), but further rapid advances over long distances were made only by a streamlined growth cone (Fig. 6A, 135–170 min; Fig. 6B, 39–84 min). Finally, if after a pause, an advance occurred with a shift in direction, growth cones became unusually complex (branching, hypercomplex) before the advance (Fig.6B, 129–159 min), branching into distinct fingers (Fig. 7, and see Godement et al., 1994). Thus, the correlations made between behavior and form held when shifts of behavior occurred.
These data demonstrate that growth cone forms correlate with specific behaviors. During advance, growth cones are streamlined and elongated whereas during pauses, growth cones have complex forms.
The relationship between growth cone form and behavior, and position
To address why growth cone form appears to be position-specific, we analyzed whether the above correlations between behavior and form applied in the different locales from retina through the optic tract, using the analysis of growth cone form and behavior in consecutive frames, as above. In each locale examined, of the frame intervals that contained growth cones with streamlined forms, the majority of those growth cones were advancing (retina, 78%; optic nerve, 67%; lateral chiasm, 68%; medial chiasm, 75%; and optic tract, 86%). Likewise, of the intervals that contained complex forms developed, the majority of growth cones were pausing (retina, 93%; optic nerve, 94,%; lateral chiasm, 98,%; medial chiasm, 96%; and optic tract, 81%) (Fig.8). While hypercomplex forms were always associated with pausing, these growth cones were only seen near the chiasm midline, and correlated with subsequent extreme changes in directionality as seen in uncrossed axons (n = 3 axons) (see also Godement et al., 1994), and was the only behavior that was site-specific. Thus, growth cone form was found to be behavior-specific, and in the same manner for each site.
Given the consistent correlations between form and behavior in all sites, we then analyzed whether the patterns of behaviors and corresponding growth cone forms were different in the five locales. We predicted that positional specificity of form could be explained by different frequencies of behaviors in each locale. First, we examined the rate of advance, duration of advances and pauses, and the overall growth rate (per given distance) (Table 2). The growth during individual bouts of extension was rapid (∼50 μm/hr) but similar in every locale except for the retina, where it was somewhat more rapid (almost 60 μm per hr). The average duration of pauses was also similar in all parts of the retinal pathway, with the longest in the chiasm, even though this difference was not significant. However, the duration of advance was significantly shorter in the chiasm compared to that in the retina and optic tract (p < 0.05). The more brief advance periods in the chiasm yielded the lowest overall growth rate (Table 2). We thought that it was unlikely that the slow rate of progression in the chiasmatic midline resulted from having filmed axons for long periods, with consequent deleterious effects on the monitored axons. In fact, the slow tempo of growth was seen at this site irrespective of when the sequence began, and rapid growth always resumed once axons left the chiasm and entered either optic tract. These data suggest that the patterns of behavior are indeed different during growth through the several locales from retina through optic tract.
Second, we determined the predominance of behavior in the different segments of the retinal axon path, by calculating the ratio of the average duration of advance to the average duration of pauses (Table2). For the chiasm, the ratio is 1.3 whereas for the retina it is 3.8 and for the optic tract, 3.3. This demonstrates that growth cones spend relatively more time extending as they grow in nondecision regions such as the optic nerve and tract, than they do in the optic chiasm.
To graphically demonstrate these site-specific differences in behavior patterns, the “beat” or tempo of growth was depicted. For a subset of axons tracked at low power, advancing and pausing were indicated by a dash or x, respectively, for each 15 min frame interval (Fig.9). In the chiasm, frequent bouts of advance to pause cycles are seen, with rather brief advance periods. Pause periods ranged from 15 min to over 1 hr, compared to the pause duration in the optic tract. It should be noted that the pause periods in Figure 9appear longer than those summarized in Table 2, in which the values were averaged for all axons at the different sites. This can be explained by the fact that in the beat chart, only selected individual examples are shown. Moreover, as indicated in Godement et al. (1994)the pause periods for uncrossed axons are longer than those for crossed axons; most of the axons examined in Table 2 were crossed axons (10 of 14). After crossing the midline, axons displayed longer advance-pause cycles (Fig. 9), as extension continued uninterrupted for several hours and pauses were relatively short in this segment of the path.
To test the above findings, that the fraction of time spent in different behavioral states with correspondingly different growth cone forms underlies positional specificity of growth cone shape, we examined the predominance of forms over time, in a given span of growth in each locale. We calculated the time spent traversing 100 μm and the percentage of that time that growth cones assumed one of two forms, simple forms as seen during advance and complex forms as during a pause (Figs. 5, 8, 10). To do this, for each recording, the distance that an individual growth cone traveled was measured (by viewing the start and stop points in the preparation at low power). Then, the percentage of frames and thus proportion of time (each frame interval was 3 min, at high magnification) that a growth cone had either simple or complex forms was computed. In the retina, nerve, and tract, all straight paths, more than 70% of the time a growth cone spent traversing 100 μm, growth cones assumed simple shapes. In contrast, in the medial chiasmatic region, growth cones spent 86% of the time it took to traverse 100 μm assuming complex shapes. These data demonstrate that the time spent assuming different forms of growth cone and therefore either pausing or advance behaviors, varies with different loci along the path. Together with the data in Table 2 and Figure 9 showing the beat of growth, these measures indicate that in the chiasm, especially the medial region, growth cones spend a greater fraction of the time pausing, and therefore more frequently display complex shapes, whereas in the optic tract, growth cones spend more time advancing and thus are more commonly sited with streamlined growth cones.
To summarize, in all parts of the pathway, extension of fibers occurs in bouts of advance and pauses. Simple streamlined growth cones develop during advance, and complex growth cones during pauses. The rate of extension and the duration of pauses are similar irrespective of locale, but the average duration of advance is shorter in the chiasm, yielding a slower overall rate of growth in this decision region. Finally, the fraction of time spent in any one behavior varies with position. Because growth cone form reflects behavior, and different behaviors predominate in each locale, growth cone form is not directly, but is ultimately, position-specific.
DISCUSSION
This study analyzes the relationship of growth cone form and behavior in different locales along the retinal axon pathway through the optic tract. Fibers extend in bouts of advances and pauses. Simple streamlined growth cones develop during advances, and complex growth cones during pauses. While the rate of extension and duration of pause periods are similar throughout the pathway, advance periods are shorter in the chiasm compared to other segments of the path, yielding a slower overall rate of growth in this decision region. A key finding of this analysis is that the fraction of time spent in any one behavior varies with position. Because growth cone form reflects behavior, and different behaviors predominate in each locale, growth cone form is consequently, but not directly, position-specific. Remarkably, previous analyses of growth cone morphology in fixed tissue, based on “snapshots” of individual axons (see, for example, Bovolenta and Mason, 1987), arrived at similar conclusions. The present study provides definitive evidence that the apparent predominance of growth cone forms viewed in fixed material stems from sampling the most common behaviors and thus the most common forms.
Growth cone form and behavior relationships
The distinction drawn here between simple and complex growth cones, mediating advance and pausing, respectively, has been made previously (O’Rourke and Fraser, 1990; Kaethner and Stuermer, 1992;Sretavan and Reichardt, 1993; Dailey et al., 1994; Danks et al., 1994;Godement et al., 1994; O’Rourke et al., 1994; Brittis et al., 1995). Simple growth cones with elongated bodies and few filopodia predominate during rapid extension in straight paths (Harris et al., 1987; Halloran and Kalil, 1994). In the living retina, elongated growth cones with scalloped lamellar surfaces (e.g., Fig. 2A, 50 min) fasciculate with other fibers (Brittis and Silver, 1995). Ultrastructural analyses of growth cones having this shape indicate that the lamellae enfold axon fascicles (Bovolenta and Mason, 1987;Williams et al., 1991). Indeed, at E15, the developmental time point studied here, numerous axons have already projected through the chiasm and optic tract and form substrates for subsequent fibers. Lanceolate or torpedo-like growth cones were also seen to mediate advance in the present study (see Figs. 2A, 6A, 0 min) (see also Scalia and Matsumoto, 1985). Growth cones with this form have been postulated to extend by minimizing their volume and “snaking” between other nonaxonal cellular elements (Burrill and Easter, 1995). Both variants of simple forms develop during extension in the retinal axon pathway at E15–E17.
This study correlates growth cones having complex shapes with pauses, in agreement with analyses of living preparations in vivo at transition points in the path, such as in decision regions (Holt, 1989;Godement et al., 1994) and at the entry to targets (Halloran and Kalil, 1994; Bastmeyer and O’Leary, 1996), and within targets (Kaethner and Stuermer, 1992; P. Godement and B. Llirbat, unpublished data). Complex growth cones have not been previously noted in tracts, perhaps because of their fleeting appearance during the relatively brief pauses compared to the extended periods of advance. The cell-cell interactions of complex growth cones are likely to be more varied than those for elongated lamellar growth cones (Marcus et al., 1995).
In apposition to the present findings, complex growth cones have been seen to develop during extension in vitro (Bray and Bunge, 1973; Letourneau, 1975; Argiro et al., 1984; Payne et al., 1992;Buettner et al., 1994), and in vivo, in tracts at the growing front of axons (Burrill and Easter, 1995) or when growth cones appose glial endfeet (Wilson and Easter, 1991; Brittis et al., 1995) or fibroblasts (Speidel, 1933). All of these substrates have common physical features in that they are flat, two dimensional surfaces.
Together, these observations raise an important issue not directly analyzed in this study: The specific form of growth cones reflects the physical and molecular composition of the growth context. These interactions in turn lead to particular behaviors. Support for the direct link between form, and cellular and molecular interactions, comes from studies in vitro. When complex growth cones extend on a flat permissive substrate and encounter other neurites that are also permissive, the growth cones embrace the neurites and transform into the elongated lamellar forms seen in the present study in extending axons (Lin and Forscher, 1993; Baird and Mason, unpublished observations; Letourneau, unpublished observations). Likewise, when growth cones transit from one permissive substrate to another, both having the same physical conformation but different molecular composition, even if both substrates are growth-permissive, changes in form and behavior can ensue (Buettner et al., 1994; Gomez and Letourneau, 1994; Smith, 1994; Burden-Gulley et al., 1995).
It should be emphasized that the present analysis linking forms of growth cones with given behaviors pertains to the mouse retinal axon pathway at E15–E17, and might not apply to neurons in other pathways or even to the same neurons growing during earlier periods (see Marcus and Mason, 1995). Moreover, each neuronal population is likely to have a distinct repertoire of responses to its growth context; these responses are manifested in a hierarchy of forms, at different developmental periods and across different sites (see Tosney and Landmesser, 1985 on motor vs sensory axons). A fuller understanding of the cellular and molecular factors affecting the form-behavior relationship requires combined dynamic, ultrastructural and immunolocalization analyses of specific pathways in vivo, and of identified neuronal populations in vitro.
What induces particular patterns of intermittent growth?
The present study has provided new insights into a previously undocumented feature of behavior in situ, i.e., the tempo or rhythm of growth cone advance within a pathway. Retinal axons undergo intermittent growth in every portion of the path up to their first target. Intermittent growth cone advance has been recorded in targets and segments of paths in the CNS of other species (Kaethner and Stuermer, 1992; Halloran and Kalil, 1994). Through this stop-start behavior, growth cones, like other motile cells, may undergo rhythmic rests of the motility machinery (Abercrombie and Heaysman, 1953;Abercrombie, 1970) to mobilize resources for the next spurt of growth. In addition, growth cones are likely, during pauses, to respond to cellular and molecular discontinuities along their growth trajectory (Seeger et al., 1993; Stoeckli and Landmesser, 1995).
One surprising relationship outlined in this study is that while pause periods were similar throughout the path, the advance periods were truncated considerably in the optic chiasm compared to those in the retina, optic nerve and tract. What prevents growth cones from advancing over a long stretch within this locale? One possibility is that retinal axons encounter novel cellular arrangements within this decision region compared to the nerve or lateral chiasm, namely, the radial glial palisade and an intersecting palette of early neurons (Marcus et al., 1995). Retinal growth cones may encounter molecular differences on these cells or in the extracellular matrix (see Stoeckli and Landmesser, 1995 on the floor plate). In addition, the chiasm contains diffusible factors that produce a general slowing of growth. Such growth suppressing factor(s) are hypothesized to temper the growth of all axons entering the chiasmatic midline zone, to prime them to perceive other, more specific cues leading to retinal axon divergence and/or fiber-fiber rearrangements (Guillery et al., 1995; Wang et al., 1996). However, as the present study suggests that the speed during advance is constant across positions, such factors may simply cut short advance rather than affect the absolute speed.
Although the factors that affect the duration of advance are not understood, events that occur at the transitions from advance to pause and vice-versa include both the detection and transduction of guidance information (Doherty and Walsh, 1994). At least two types of intracellular responses to guidance cues have been noted: 1). alteration of surface molecules on the neurite or growth cone (Dodd et al., 1988; Stoeckli and Landmesser, 1995), either by postranslational modification or after signaling back to the cell soma; 2). reorganization of the cytoskeleton (Bentley and O’Connor, 1994), especially during a change in direction or exploration of a decision region (Burmeister and Goldberg, 1988; Sabry et al., 1991; O’Connor and Bentley, 1993; Tanaka and Kirschner, 1995). Such changes are likely to occur upon detection of inhibitory and positive cues encountered in both decision and nondecision regions.
Conclusions
This study presents a dynamic analysis of growth cone form, behavior, and position along the retinal axon pathway. Variations in behavior patterns ultimately lead to the apparent specificity of growth cone form in different locales. In addition, these data point to differences in tempo of growth in decision versus nondecision regions. The predictive nature of the relationships between growth cone form and behavior can be used as a guide in interpreting static and dynamic analyses of the cellular interactions of dye-labeled growth cones. Through this approach, we can learn how growth cones interpret extrinsic signals leading to changes in growth cone trajectory, shape, and motility.
Footnotes
This work was supported by National Institutes of Health Grant NS/EY 27615 (Jacob Javits Award to C.A.M.). We thank Drs. Pierre Godement and Dan Goldberg, and Qin Zhang and Stan Ward for their helpful comments and for reading this manuscript. Rich Blazeski assisted in histology and photography, and Suping Wen provided advice on statistical analysis.
Correspondence should be addressed to Dr Carol Mason at the above address.
Dr. Wang’s current address: Department of Neuroscience, Genentech, Inc., 460 Point San Bruno Boulevard, South San Francisco, CA 94080.
REFERENCES
- 1.Abercrombie M. Contact inhibition in tissue culture. In Vitro. 1970;6:128–142. doi: 10.1007/BF02616114. [DOI] [PubMed] [Google Scholar]
- 2.Abercrombie M, Heaysman JE. Observations on the social behavior of cells in tissue culture. I. Speed of movement of chick heart fibroblasts in relation to their mutual contacts. Exp Cell Res. 1953;5:111–131. doi: 10.1016/0014-4827(53)90098-6. [DOI] [PubMed] [Google Scholar]
- 3.Argiro V, Bunge MB, Johnson MI. Correlation between growth cone form and movement and their dependence on neuronal age. J Neurosci. 1984;4:3051–3062. doi: 10.1523/JNEUROSCI.04-12-03051.1984. [DOI] [PMC free article] [PubMed] [Google Scholar]
- 4.Bandtlow C, Zachleder T, Schwab ME. Oligodendrocytes arrest neurite growth by contact inhibition. J Neurosci. 1990;10:3837–3848. doi: 10.1523/JNEUROSCI.10-12-03837.1990. [DOI] [PMC free article] [PubMed] [Google Scholar]
- 5.Bastmeyer M, O’Leary DDM. Dynamics of target recognition by interstitial axon branching along developing cortical axons. J Neurosci. 1996;16:1450–1459. doi: 10.1523/JNEUROSCI.16-04-01450.1996. [DOI] [PMC free article] [PubMed] [Google Scholar]
- 6.Bentley D, O’Connor TP. Cytoskeletal events in growth cone steering. Curr Opin Neurobiol. 1994;4:43–48. doi: 10.1016/0959-4388(94)90030-2. [DOI] [PubMed] [Google Scholar]
- 7.Bovolenta P, Dodd J. Guidance of commissural growth cones at the floor plate in embryonic rat spinal cord. Development. 1990;109:435–447. doi: 10.1242/dev.109.2.435. [DOI] [PubMed] [Google Scholar]
- 8.Bovolenta P, Mason CA. Growth cone morphology varies with position in the developing mouse visual pathway from retina to first targets. J Neurosci. 1987;7:1447–1460. doi: 10.1523/JNEUROSCI.07-05-01447.1987. [DOI] [PMC free article] [PubMed] [Google Scholar]
- 9.Bray D, Bunge M (1973) The growth cone in neurite extensions. In: Locomotion of tissue cells (Porter W, Fitzsimmons DW, ed), pp 195–209. Ciba Foundation Symposium. [DOI] [PubMed]
- 10.Brittis PA, Silver J. Multiple factors govern intraretinal axon guidance: a time-lapse study. Mol Cell Neurosci. 1995;6:413–432. doi: 10.1006/mcne.1995.1031. [DOI] [PubMed] [Google Scholar]
- 11.Brittis PA, Lemmon V, Rutishauser U, Silver J. Unique changes of ganglion cell growth cone behavior following cell adhesion molecule perturbations: a time-lapse study of living retina. Mol Cell Neurosci. 1995;6:433–449. doi: 10.1006/mcne.1995.1032. [DOI] [PubMed] [Google Scholar]
- 12.Buettner HM, Pittman RN, Ivins JK. A model of neurite extension across regions of nonpermissive substrate: simulations based on experimental measurement of growth cone motility and filopodial dynamics. Dev Biol. 1994;163:407–422. doi: 10.1006/dbio.1994.1158. [DOI] [PubMed] [Google Scholar]
- 13.Burden-Gulley SM, Payne HR, Lemmon V. Growth cones are actively influenced by substrate-bound adhesion molecules. J Neurosci. 1995;15:4370–4381. doi: 10.1523/JNEUROSCI.15-06-04370.1995. [DOI] [PMC free article] [PubMed] [Google Scholar]
- 14.Burmeister DW, Goldberg DJ. Micropruning: the mechanism of turning of Aplysia growth cones at substrate borders in vitro. J Neurosci. 1988;8:3151–3159. doi: 10.1523/JNEUROSCI.08-09-03151.1988. [DOI] [PMC free article] [PubMed] [Google Scholar]
- 15.Burrill JD, Easter SS. The first retinal axons and their microenvironment in zebrafish: cryptic pioneers and the pretract. J Neurosci. 1995;15:2935–2947. doi: 10.1523/JNEUROSCI.15-04-02935.1995. [DOI] [PMC free article] [PubMed] [Google Scholar]
- 16.Caudy M, Bentley D. Pioneer growth cone morphologies reveal proximal increases in substrate affinity within leg segments of grasshopper embryos. J Neurosci. 1986;6:364–379. doi: 10.1523/JNEUROSCI.06-02-00364.1986. [DOI] [PMC free article] [PubMed] [Google Scholar]
- 17.Colello RJ, Guillery RW. The early development of retinal ganglion cells with uncrossed axons in the mouse: retinal position and axon course. Development. 1990;108:515–523. doi: 10.1242/dev.108.3.515. [DOI] [PubMed] [Google Scholar]
- 18.Dailey ME, Buchanan J, Bergles DE, Smith SJ. Mossy fiber growth and synaptogenesis in rat hippocampal slices in vitro. J Neurosci. 1994;14:1060–1078. doi: 10.1523/JNEUROSCI.14-03-01060.1994. [DOI] [PMC free article] [PubMed] [Google Scholar]
- 19.Danks AM, Kim P, Wang Z, Meyer RL. Imaging of individual normal and regenerating optic fibers in the brain of living adult goldfish. J Comp Neurol. 1994;345:253–266. doi: 10.1002/cne.903450207. [DOI] [PubMed] [Google Scholar]
- 20.Dodd J, Morton SB, Karagogeos D, Yamamoto M, Jessell TM. Spatial regulation of axonal glycoprotein expression on subsets of embryonic spinal neurons. Neuron. 1988;1:105–116. doi: 10.1016/0896-6273(88)90194-8. [DOI] [PubMed] [Google Scholar]
- 21.Doherty P, Walsh FS. Signal transduction events underlying neurite outgrowth stimulated by cell adhesion molecules. Curr Opin Neurobiol. 1994;4:49–55. doi: 10.1016/0959-4388(94)90031-0. [DOI] [PubMed] [Google Scholar]
- 22.Dräger UC. Birth dates of retinal ganglion cells giving rise to the crossed and uncrossed optic projections in the mouse. Proc R Soc Lond [Biol] 1985;224:57–77. doi: 10.1098/rspb.1985.0021. [DOI] [PubMed] [Google Scholar]
- 23.Fitzgerald T, Reese BE. Position of growth cones within the retinal nerve fibre layer of fetal ferrets. J Comp Neurol. 1992;323:153–166. doi: 10.1002/cne.903230203. [DOI] [PubMed] [Google Scholar]
- 24.Godement P, Salaün J, Métin C. Fate of uncrossed retinal projections following early or late prenatal monocular enucleation in the mouse. J Comp Neurol. 1987a;255:97–109. doi: 10.1002/cne.902550108. [DOI] [PubMed] [Google Scholar]
- 25.Godement P, Vanselow J, Thanos S, Bonhoeffer F. A study in developing visual systems with a new method of staining neurones and their processes in fixed tissue. Development. 1987b;101:697–713. doi: 10.1242/dev.101.4.697. [DOI] [PubMed] [Google Scholar]
- 26.Godement P, Salaün J, Mason CA. Retinal axon pathfinding in the optic chiasm: Divergence of crossed and uncrossed fibers. Neuron. 1990;5:173–196. doi: 10.1016/0896-6273(90)90307-2. [DOI] [PubMed] [Google Scholar]
- 27.Godement P, Wang L-C, Mason CA. Retinal axon divergence in the optic chiasm: Dynamics of growth cone behavior at the midline. J Neurosci. 1994;14:7024–7039. doi: 10.1523/JNEUROSCI.14-11-07024.1994. [DOI] [PMC free article] [PubMed] [Google Scholar]
- 28.Gomez TM, Letourneau PC. Filopodia initiate choices made by sensory neuron growth cones at laminin/fibronectin borders in vitro. J Neurosci. 1994;14:5959–5972. doi: 10.1523/JNEUROSCI.14-10-05959.1994. [DOI] [PMC free article] [PubMed] [Google Scholar]
- 29.Guillery RW, Mason CA, Taylor JSH. Developmental determinants at the mammalian optic chiasm. J Neurosci. 1995;15:4727–4737. doi: 10.1523/JNEUROSCI.15-07-04727.1995. [DOI] [PMC free article] [PubMed] [Google Scholar]
- 30.Halloran MC, Kalil K. Dynamic behaviors of growth cones extending in the corpus callosum of living cortical brain slices observed with video microscopy. J Neurosci. 1994;14:2161–2177. doi: 10.1523/JNEUROSCI.14-04-02161.1994. [DOI] [PMC free article] [PubMed] [Google Scholar]
- 31.Harris WA, Holt CE, Bonhoeffer F. Retinal axons with and without their somata, growing to and arborizing in the tectum of frog embryos: a time-lapse vido study of single fibers in vivo. Development. 1987;101:23–133. doi: 10.1242/dev.101.1.123. [DOI] [PubMed] [Google Scholar]
- 32.Hollyday M, Morgan-Carr M. Chick wing innervation. II. Morphology of motor and sensory axons and their growth cones during early development. J Comp Neurol. 1995;357:254–271. doi: 10.1002/cne.903570206. [DOI] [PubMed] [Google Scholar]
- 33.Holt CE. A single-cell analysis of early retinal ganglion cell differentiation in Xenopus: from soma to axon tip. J Neurosci. 1989;9:2402–2411. doi: 10.1523/JNEUROSCI.09-09-03123.1989. [DOI] [PMC free article] [PubMed] [Google Scholar]
- 34.Kaethner RJ, Stuermer CAO. Dynamics of terminal arbor formation and target approach of retinotectal axons in living zebrafish embryos. A time lapse study of single axons. J Neurosci. 1992;12:3257–3271. doi: 10.1523/JNEUROSCI.12-08-03257.1992. [DOI] [PMC free article] [PubMed] [Google Scholar]
- 35.Kapfhammer J, Raper J. Collapse of growth cone structure on contact with specific neurites in culture. J Neurosci. 1987;7:201–212. doi: 10.1523/JNEUROSCI.07-01-00201.1987. [DOI] [PMC free article] [PubMed] [Google Scholar]
- 36.Kim GJ, Shatz CJ, McConnell SK. Morphology of pioneer and follower growth cones in the developing cerebral cortex. J Neurobiol. 1991;22:629. doi: 10.1002/neu.480220608. [DOI] [PubMed] [Google Scholar]
- 37.Letourneau P. Cell-to-substratum adhesion and guidance of axonal elongation. Dev Biol. 1975;44:92–101. doi: 10.1016/0012-1606(75)90379-6. [DOI] [PubMed] [Google Scholar]
- 38.Lin CH, Forscher P. Cytoskeletal remodeling during growth cone-target interactions. J Cell Biol. 1993;121:1369–1383. doi: 10.1083/jcb.121.6.1369. [DOI] [PMC free article] [PubMed] [Google Scholar]
- 39.Lopresti V, Macagno ER, Levinthal C. Structure and development of neuronal connections in isogenic organisms: cellular interactions in the development of the optic lamina of Daphnia. Proc Natl Acad Sci USA. 1973;70:433–437. doi: 10.1073/pnas.70.2.433. [DOI] [PMC free article] [PubMed] [Google Scholar]
- 40.Marcus RC, Mason CA. The first retinal axon growth in the mouse optic chiasm: Axon patterning and the cellular environment. J Neurosci. 1995;15:6389–6402. doi: 10.1523/JNEUROSCI.15-10-06389.1995. [DOI] [PMC free article] [PubMed] [Google Scholar]
- 41.Marcus RC, Blazeski R, Godement P, Mason CA. Retinal axon divergence in the optic chiasm: Uncrossed axons diverge from crosssed axons within a midline glial specialization. J Neurosci. 1995;15:3716–3729. doi: 10.1523/JNEUROSCI.15-05-03716.1995. [DOI] [PMC free article] [PubMed] [Google Scholar]
- 42.Nordlander RH. Axonal growth cones in the developing amphibian spinal cord. J Comp Neurol. 1987;263:485–496. doi: 10.1002/cne.902630403. [DOI] [PubMed] [Google Scholar]
- 43.O’Connor TP, Bentley D. Accumulation of actin in subsets of pioneer growth cone filopodia in response to neural and epithelial guidance cues in situ. J Cell Biol. 1993;123:935–948. doi: 10.1083/jcb.123.4.935. [DOI] [PMC free article] [PubMed] [Google Scholar]
- 44.O’Rourke NA, Fraser SE. Dynamic changes in optic fiber terminal arbors lead to retinotopic map formation: an in vivo confocal microscopic study. Neuron. 1990;5:159–171. doi: 10.1016/0896-6273(90)90306-z. [DOI] [PubMed] [Google Scholar]
- 45.O’Rourke NA, Cline H, Fraser SE. Rapid remodeling of retinal arbors in the tectum with and without blockade of synaptic transmission. Neuron. 1994;12:921–934. doi: 10.1016/0896-6273(94)90343-3. [DOI] [PubMed] [Google Scholar]
- 46.Payne HR, Burden SM, Lemmon V. Modulation of growth cone morphology by substrate-bound adhesion molecules. Cell Motil Cytoskeleton. 1992;21:65–73. doi: 10.1002/cm.970210108. [DOI] [PubMed] [Google Scholar]
- 47.Ramon y Cajal S. Histology of the nervous system of man and vertebrates (Swanson N, Swanson LW, translators from the French). Oxford UP; New York: 1995. [Google Scholar]
- 48.Roberts A, Taylor JSH. A study of growth cones of developing embryonic sensory neurites. J Embryol Exp Morphol. 1983;75:31–47. [PubMed] [Google Scholar]
- 49.Sabry JH, O’Connor TP, Evans L, Toroian-Raymond A, Kirschner M, Bentley D. Microtubule behavior during guidance of pioneer neuron growth cones in situ. J Cell Biol. 1991;115:381–395. doi: 10.1083/jcb.115.2.381. [DOI] [PMC free article] [PubMed] [Google Scholar]
- 50.Scalia F, Matsumoto DE. The morphology of growth cones of regenerating optic nerve axons. J Comp Neurol. 1985;231:323–338. doi: 10.1002/cne.902310304. [DOI] [PubMed] [Google Scholar]
- 51.Seeger MA, Tear G, Ferres-Marco D, Goodman CS. Mutations affecting growth cone guidance in Drosophila. Genes necessary for guidance toward or away from the midline. Neuron. 1993;10:409–426. doi: 10.1016/0896-6273(93)90330-t. [DOI] [PubMed] [Google Scholar]
- 52.Smith CL. Cytoskeletal movements and substrate interactions during initiation of neurite outgrowth by sympathetic neurons in vitro. J Neurosci. 1994;14:384–398. doi: 10.1523/JNEUROSCI.14-01-00384.1994. [DOI] [PMC free article] [PubMed] [Google Scholar]
- 53.Speidel CC. Studies of living nerves. II. Activities of ameboid growth cones, sheath cells, and myelin segments, as revealed by prolonged observation of individual nerve fibers in frog tadpoles. Am J Anat. 1933;52:1–79. [Google Scholar]
- 54.Speidel CC. Studies of living nerves. VII. Growth adjustments of cutaneous terminal arborizations. J Comp Neurol. 1942;76:57–69. [Google Scholar]
- 55.Sretavan DW. Specific routing of retinal ganglion cell axons at the mammalian optic chiasm during embryonic development. J Neurosci. 1990;10:1995–2007. doi: 10.1523/JNEUROSCI.10-06-01995.1990. [DOI] [PMC free article] [PubMed] [Google Scholar]
- 56.Sretavan DW, Reichardt LF. Time-lapse video analysis of retinal ganglion cell axon pathfinding at the mammalian optic chiasm: growth cone guidance using intrinsic chiasm cues. Neuron. 1993;10:761–777. doi: 10.1016/0896-6273(93)90176-r. [DOI] [PubMed] [Google Scholar]
- 57.Stoeckli ET, Landmesser LT. Axonin-1, Nr-CAM, and Ng-CAM play different roles in the in vivo guidance of chick commissural neurons. Neuron. 1995;14:1165–1179. doi: 10.1016/0896-6273(95)90264-3. [DOI] [PubMed] [Google Scholar]
- 58.Tanaka E, Kirschner MW. The role of microtubules in growth cone turning at substrate boundaries. J Cell Biol. 1995;128:127–137. doi: 10.1083/jcb.128.1.127. [DOI] [PMC free article] [PubMed] [Google Scholar]
- 59.Tosney KW, Landmesser LT. Growth cone morphology and trajectory in the lumbosacral region of the chick embryo. J Neurosci. 1985;5:2345–2358. doi: 10.1523/JNEUROSCI.05-09-02345.1985. [DOI] [PMC free article] [PubMed] [Google Scholar]
- 60.Wang L-C, Dani J, Godement P, Marcus RC, Mason CA. Crossed and uncrossed retinal axons respond differently to cells of the optic chiasm midline in vitro. Neuron. 1995;15:1349–1364. doi: 10.1016/0896-6273(95)90013-6. [DOI] [PubMed] [Google Scholar]
- 61.Wang L-C, Rachel RA, Marcus RC, Mason CA. Chemosuppression of retinal axon growth by the mouse optic chiasm. Neuron. 1996;17:849–862. doi: 10.1016/s0896-6273(00)80217-2. [DOI] [PubMed] [Google Scholar]
- 62.Williams RW, Borodkin M, Rakic P. Growth cone distribution patterns in the optic nerve of fetal monkeys: implications for mechanisms of axon guidance. J Neurosci. 1991;11:1081–1094. doi: 10.1523/JNEUROSCI.11-04-01081.1991. [DOI] [PMC free article] [PubMed] [Google Scholar]
- 63.Wilson SW, Easter SS. Stereotyped pathway selection by growth cones of early epiphysial neurons in the embryonic zebrafish. Development. 1991;112:723–746. doi: 10.1242/dev.112.3.723. [DOI] [PubMed] [Google Scholar]
- 64.Yaginuma H, Homma S, Künzi R, Oppenhein RW. Pathfinding by growth cones of commissural interneurons in the chick embryo spinal cord: A light and electron microscopic study. J Comp Neurol. 1991;304:78–102. doi: 10.1002/cne.903040107. [DOI] [PubMed] [Google Scholar]