

Abstract
The rate of exocytic events from both neurons and non-neuronal cells exhibits fluctuations consistent with fractal (self-similar) behavior in time, as evidenced by a number of statistical measures. We explicitly demonstrate this for neurotransmitter secretion atXenopus neuromuscular junctions and for rat hippocampal synapses in culture; the exocytosis of exogenously supplied neurotransmitter from cultured Xenopus myocytes and from rat fibroblasts behaves similarly. The magnitude of the fluctuations of the rate of exocytic events about the mean decreases slowly as the rate is computed over longer and longer time periods, the periodogram decreases in power-law manner with frequency, and the Allan factor (relative variance of the number of exocytic events) increases as a power-law function of the counting time. These features are hallmarks of self-similar behavior. Their description requires models that exhibit long-range correlation (memory) in event occurrences. We have developed a physiologically plausible model that accords with all of the statistical measures that we have examined. The appearance of fractal behavior at synapses, as well as in systems comprising collections of synapses, indicates that such behavior is ubiquitous in neural signaling.
Keywords: quantal secretion, vesicular exocytosis, miniature endplate currents, fractal, long-term correlation, lognormal process, Xenopus neuromuscular junction, myocyte autoreception, fibroblast, hippocampal synapse
Communication in the nervous system is mediated by action- potential-initiated exocytosis of multiple vesicular packets (quanta) of neurotransmitter (Katz, 1966). Even in the absence of such action potentials, however, many neurons spontaneously release individual packets of neurotransmitter (Fatt and Katz, 1952). A packet may contain from 7000 to 10,000 molecules of acetylcholine (ACh), if we use the neuromuscular junction as an example (Kuffler and Yoshikami, 1975). On arrival at the postsynaptic membrane, the ACh molecules induce elementary endplate currents (EECs), which take the form of nonstationary two- (or multi-) state on–off sequences (Sakmann, 1992). Current flows when the ACh channel is open (i.e., when its two binding sites are occupied by agonist) and ceases when the channel is closed. A postsynaptic miniature endplate current (MEPC) comprises some 1000 EECs (Sakmann, 1992). It was shown by Del Castillo and Katz (1954) that superpositions of MEPC-like events comprise the postsynaptic endplate currents elicited by nerve impulses.
It generally has been assumed that the sequence of MEPCs forms a memoryless stochastic process (Fatt and Katz, 1952). However,Rotshenker and Rahamimoff (1970) discovered that exocytosis in the frog neuromuscular junction can exhibit correlation (memory) over a period of seconds, provided that extracellular Ca2+ levels are elevated above their normal values. Cohen et al. (1974b)subsequently found such correlation (event clustering) even in the absence of elevated Ca2+ levels.
In this paper we study the statistical properties of exocytic events over a far larger range of time scales than previously examined. MEPCs were recorded from innervated myocytes in Xenopusnerve–muscle cocultures and from rat hippocampal neurons in cell culture. MEPCs from non-neuronal preparations also were examined: the quantal secretion of ACh from isolated myocytes (autoreception) and from rat fibroblasts, both exogenously loaded with ACh (Dan and Poo, 1992; Girod et al., 1995).
We direct particular attention toward those statistical measures that reveal the presence of memory. Our analysis reveals that the time sequences of the MEPCs, and therefore of the underlying exocytic events, exhibit memory that appears to decay away slowly in both neuronal and non-neuronal cells. This long-duration correlation is present over the entire range of time scales investigated, which stretches to thousands of seconds. The occurrence of an MEPC, therefore, makes it more likely that another MEPC will occur at some time thereafter. The analysis of long MEPC data sets reveals that the rate of exocytic events behaves in a manner consistent with a fractal process, exhibiting fluctuations over multiple time scales. Fractals are objects that possess a form of self-similarity: parts of the whole can be made to fit to the whole by shifting and stretching. The hallmark of fractal behavior is power-law dependence in one or more statistical measures over a substantial range of the time (or frequency) scales at which the measurement is conducted (Lowen and Teich, 1995; Thurner et al., 1997). Because multiscale fluctuations are at the heart of this behavior, selecting short data segments that exhibit minimal fluctuations will dilute whatever fractal characteristics might be present in a given data set, as we illustrate. The classic work of Fatt and Katz (1952) is revisited in light of these findings.
MATERIALS AND METHODS
Xenopus nerve–muscle cocultures. Cultures were prepared by following previously reported methods (Spitzer and Lamborghini, 1976; Anderson et al., 1977; Tabti and Poo, 1991). In brief, the neural tube from 1-d-old embryos (stage 20–24; Nieuwkoop and Faber, 1967) was dissociated in Ca2+/Mg2+-free Ringer’s solution supplemented with EDTA, plated on clean glass coverslips, and incubated at 20–22°C for 1 d before recording. Recording and culture medium consisted of 50% (v/v) Leibovitz’s medium (Life Technologies, Gaithersburg, MD), 1% (v/v) fetal calf serum (Life Technologies), and 49% (v/v) Ringer’s solution (115 mm NaCl, 2 mm CaCl2, 2.5 mm KCl, and 10 mm HEPES, pH 7.3).
Hippocampal cultures. Hippocampal cultures were prepared by following protocols previously described (Goslin and Banker, 1991), but with the following modifications. Hippocampi from newborn Sprague Dawley rats (postnatal day 0) were dissociated and plated at low density, without glial support cells. Cells from 7- to 14-d-old cultures were used for experiments. The recording solution consisted of (in mm) 140 NaCl, 5 KCl, 1 CaCl2, 1 MgCl2, 10 HEPES, 24 d-glucose, and 0.01 TTX (Sigma, St. Louis, Mo), pH 7.4.
Fibroblast cultures. Parenteral 3Y1 cells, a line of rat skin fibroblasts (Sternberg et al., 1993) were kindly provided by Paul Greengard (Rockefeller University, New York, NY). The cells were cultured in DMEM and 10% fetal calf serum at 37°C with 5% CO2 and were used 2–3 d after subculture. For detection of ACh secretion from fibroblasts, the latter were treated with trypsin–EDTA solution (Life Technologies); the suspension of the fibroblasts was added to the recording chamber that contained culturedXenopus myocytes.
Electrophysiology. Recordings of miniature endplate currents at Xenopus neuromuscular junctions were made with the gigaohm seal, nystatin perforated-patch technique (Horn and Marty, 1988). Conventional heat-polished patch pipettes were filled with pipette saline containing (in mm) 150 KCl, 1 NaCl, 1 MgCl2, 10 HEPES, pH 7.4, and nystatin (Sigma). Nystatin was added at a final concentration of 460 μM (final concentration of DMSO, 1%). Nystatin stock (46 mm; 1 mg/ml in DMSO) was prepared before each experiment, stored at room temperature in a lightproof container, and used for up to 6 hr after preparation. A conventional gigaohm seal was formed by pressing the pipette gently against the myocyte and providing light suction. Spherically shaped myocytes were selected.
For all other experiments, including hippocampal cells and non-neuronal cells, the conventional gigaohm seal whole-cell recording method was used (Hamill et al., 1981). For experiments in which MEPC-like events were recorded from an isolated myocyte loaded intracellularly with ACh (autoreception), the intrapipette solution containing (in mm) 150 KCl, 1 NaCl, 1 MgCl2, and 10 HEPES, pH 7.4, was supplemented with 20 mm AChCl (Dan and Poo, 1992). The intrapipette solution used for recording from hippocampal neurons consisted of (in mm) 155 K-gluconate, 1 MgCl2, 10 HEPES, 1 sodium gluconate, 5 MgATP, 0.5 NaGTP, and 0.1 leupeptin, pH 7.4. The internal solution in the patch pipette for fibroblasts contained (in mm) 105 K-gluconate, 1 Na-gluconate, 10 HEPES, 5 MgATP, and 0.5 NaGTP, pH 7.4, supplemented with 50 mm AChCl. The detached fibroblast was patched before being manipulated into contact with an isolatedXenopus myocyte. The recording pipette for the myocyte contained (in mm) 150 KCl, 1 NaCl, 1 MgCl2, and 10 HEPES, pH 7.4.
In all experiments, currents were recorded at room temperature under voltage-clamped conditions (holding voltage Vh = −70 mV for myocytes, −80 mV for fibroblasts, and −65 mV for hippocampal neurons), with an Axopatch 1D amplifier (Axon Instruments, Foster City, CA). The currents were filtered at 1 kHz, digitized, and stored on videotape for later playback. Computer analysis was performed with the SCAN program kindly provided by Dr. J. Dempster (Strathclyde University, UK). This analysis resulted in a series of exocytosis event times, which were quantized to 55 msec: multiple events falling within a single 55 msec window were registered as a single event. To guarantee sufficient statistical accuracy for estimating parameters of the fractal behavior, we retained only data sets with N ≥ 400 events for analysis.
RESULTS
Spontaneous vesicular exocytosis from neuromuscular junctions, hippocampal synapses, and non-neuronal cells
Within 1 d of plating, Xenopus embryonic spinal neurons establish functional synaptic transmission with cocultured myocytes, exhibiting stable spontaneous and evoked release characteristics (Chow and Poo, 1985; Xie and Poo, 1986). Spontaneous pulsatile membrane currents resembling MEPCs (Fig. 1) developed in a whole-cell voltage-clamped myocyte within several minutes of forming a tight seal with a pipette containing normal intracellular solution supplemented with nystatin. The configuration was permitted to stabilize for 10 min before experiments were begun. The observed current pulses were virtually identical in their rate and amplitude distributions to events recorded by the conventional whole-cell recording configuration.
Fig. 1.

Spontaneous ACh neurotransmitter secretion obtained from a typical developing Xenopus neuromuscular junction. The mean miniature endplate current (MEPC) rate for this particular neuron is 0.55 events/sec. A, Inward MEPCs, shown as downward deflections, recorded from a myocyte by using a nystatin perforated-patch whole-cell voltage clamp. The MEPCs result from quantal ACh secretion from the spinal neuron. B, A section of the recording in A shown on a magnified time scale. C, A section of the recording inB, which has been magnified further. D, A differential interference contrast photomicrograph of a typical neuron (N) innervating a myocyte (M).
These pulsatile current events represent spontaneous exocytosis of ACh-containing synaptic vesicles at the developing neuromuscular junction, because their rate and amplitude distribution are not affected by the addition of TTX (data not shown; but see Xie and Poo, 1986). The large amplitude variability presumably results from immature filling of the synaptic vesicles (Evers et al., 1989). (Vesicles containing an unusually small amount of ACh could result in a current event with a magnitude that lies below the threshold of detectability of the recording system, thereby escaping detection.) In the low-density cultures we use, each myocyte is innervated by a single neuron. Thus, the neurotransmitter release that is detected arises from a single synapse, which, in general, comprises a number of individual release sites.
Similar spontaneous pulsatile inward currents were observed from isolated myocytes exogenously loaded with ACh (Dan and Poo, 1992). MEPC-like events appeared within several minutes after establishing the whole-cell configuration. The average amplitude and rate of these events increased with time thereafter, ceasing to exhibit systematic changes after ∼10 min. Analysis of spontaneous release from the cells was begun after a 15 min loading period to ensure that stability had been established. In this preparation the inward currents result from the spontaneous, quantal release of ACh packets from the myocyte and the subsequent detection of this release by activation of its own surface ACh receptors (autoreception).
Spontaneous quantal ACh secretion from exogenously loaded fibroblasts also was observed (Girod et al., 1995) with the help of the ACh detection system inherent in Xenopus myocytes. Whole-cell voltage-clamped recordings from a myocyte in contact with the fibroblast displayed transient inward currents resembling MEPCs. The frequency and amplitude of these events also increased gradually with time during a period of ∼30 min. The events were recorded after this period to permit stability to be achieved. It appears that the secretion events result from the sequestration of ACh into vesicles and the subsequent exocytosis of those vesicles. It is likely that the vesicles are components of the constitutive endocytosis or membrane recycling pathways.
The analysis and comparison of the secretion in the three forms of vesicular release discussed above support the view that the basic machinery for secretion, both in neuronal and non-neuronal cells, is relatively similar (Girod et al., 1995).
Inward currents also were observed in 7- to 14-d-old hippocampal neurons cultured at low density. These currents are also the result of spontaneous neurotransmitter release, because they are apparent even in the presence of TTX. In this case, however, the neurotransmitter was most likely glutamate, because the addition of the AMPA receptor blocker CNQX and the NMDA receptor blocker AP-5 abolished the currents. Unlike the spontaneous currents observed at neuromuscular junctions inXenopus cell culture, it is likely that these MEPCs arise from excitation by several presynaptic neurons. Even at low densities it is not possible to trace exact pre- and postsynaptic neuronal cell pairs. Moreover, by 7 d in culture, an extensive network of neurites forms, making it likely that each neuron receives input from a multitude of neurons.
We have analyzed the statistical patterns of the spontaneous secretion events generated in all of these preparations and have formulated a suitable model for the exocytic behavior: the fractal lognormal-noise-driven doubly stochastic Poisson process (FLNDP). We begin by examining various statistical measures of the sequence of MEPCs observed in the Xenopus neuromuscular junction.
Interevent-interval histogram (IIH)
The solid curve in Figure 2 is a semilogarithmic plot of the MEPC IIH, arising from spontaneous vesicular release activity observed in a typical Xenopusneuromuscular junction. The IIH is a measure of the relative frequency of the times between successive events. The sequence of events from which this histogram was constructed has a duration L = 8164 sec and contains N = 2644 interevent intervals, thereby exhibiting a mean interevent interval E[t] = 3.09 sec and a mean rate λ = 1/E[t] = 0.324 events/sec.
Fig. 2.

Semilogarithmic plot of the interevent-interval histogram (IIH) versus interevent-intervalt for spontaneous vesicular release obtained from aXenopus neuromuscular junction (solid curve). The sequence of events from which this histogram has been constructed has a duration L = 8164 sec and contains N = 2644 interevent intervals, thereby exhibiting a mean interevent interval E[t] = 3.09 sec and a mean rate λ = 1/E[t] = 0.324 events/sec. The bin width is 0.275 sec or five times the clock period used to acquire the data. The best-fitting theoretical gamma density function (dashed curve, corresponding to the GRP) has parameters τ = 12.4 and a = 0.249 (and therefore a mean interevent time E[t] = aτ = 3.09 sec). The simulated IIH using the FLNDP model, which also has a mean interevent time E[t] = 3.09 sec, is shown as thedotted curve. Both models provide good fits to the experimental IIH, but only the FLNDP leads to results that accord with the statistical measures provided in Figures 3, 4, 5.
Traditional mathematical descriptions of vesicular exocytosis generally assume that the MEPC sequence forms a renewal process. Renewal processes are memoryless; successive intervals are all independent and are drawn from a single distribution. They are, therefore, characterized completely by the IIH, which is an estimate of the interevent-interval probability density p(t).
The simplest renewal model is the homogeneous Poisson point process (HPP; Cox and Lewis, 1966). The HPP is characterized by a single constant quantity, its rate λ, which is the number of vesicular release events expected to occur in a unit time interval. The HPP interevent-interval probability density functionp(t) behaves as a decreasing exponential functionp(t) = λexp(−λt),t ≥ 0, where t is the interevent interval and E[t] = 1/λ is the mean interevent time. Incorporating the effects of dead time (absolute refractoriness) or sick time (relative refractoriness) in the process preserves the exponential tail of the interevent-interval distribution while suppressing p(t) for shorter times. Because the exponential function plotted on semilogarithmic coordinates is a straight line, the HPP model clearly does not provide a good fit to the experimental IIH presented in Figure 2. Cohen et al. (1974a) reached this same conclusion from their studies of the frog neuromuscular junction.
A reasonable fit can be obtained if a slightly more complex renewal process, the gamma renewal process (GRP; Cox and Lewis, 1966), is used. This is the approach taken by Hubbard and Jones (1973). The theoretical IIH is then the two-parameter gamma density functionp(t) =ta−1exp(−t/τ)/Γ(a)τa, where τ is a characteristic time, a is a parameter known as the order of the gamma process, and Γ(·) is the gamma function. The mean interevent interval for this distribution is E[t] = aτ; its variance is Var[t] = aτ2. (The particular case a = 1 corresponds to the exponential distribution, illustrating that the HPP is a special case of the GRP.) The gamma IIH, with its mean and variance set equal to those of the data, is shown as the dashed curve in Figure 2. The fit is very good. Thus, were the MEPC sequence renewal in nature, it would be describable by a GRP, and nothing more need be said about it.
However, we demonstrate that the MEPC sequence is not renewal using three statistical measures that are sensitive to the presence of memory in a point process: vesicular release-rate measurements over different time scales, the Allan factor (AF), and the periodogram (PG). The dependencies among the interevent intervals evidenced by these measures reveal that a fractal-rate stochastic point process (FRSPP) (Teich et al., 1996a; Thurner et al., 1997) represents the sequence of MEPCs. A fractal-rate process is required because the IIH does not follow a power-law form and hence does not exhibit scaling. This indicates that the sequence of exocytic events itself does not form a fractal in time. However, the rate of event occurrencesis consistent with scaling behavior, leading to the FRSPP model for the MEPC sequence.
Indeed a particular FRSPP, the FLNDP, provides an excellent representation for all of the statistical measures of the exocytic events that we have investigated, as discussed at the very end of this section. The associated three-parameter simulated interevent-interval density function is displayed as the dotted curve in Figure 2; it clearly provides an excellent fit to the IIH, even a bit superior to that of the GRP. Because the MEPCs do not form a renewal process, however, it is clear that the IIH alone is inadequate for choosing among alternative models.
Self-similarity of vesicular release rates
Perhaps the simplest measure of neuronal activity is the estimate of the rate: the number of events registered per unit time (Teich, 1992). For vesicular release, even this straightforward measure is consistent with the presence of fractal properties; the magnitude of the fluctuations of the rate (e.g., its standard deviation) decreases more slowly, as the counting time used to compute it increases, than would be expected for independent-event counts.
In Figure 3a we illustrate the vesicular release rate for the same Xenopus neuromuscular data as those analyzed in Figure 2. Two different counting times were used to compute the rate: T = 25 sec (solid curve) and T = 250 sec (dashed curve). The total duration of the solid curve is 775 sec (31 consecutive samples, each of 25 sec), whereas that of the dashed curve is 7750 sec (31 consecutive samples, each of 250 sec). Evidently, increasing the averaging time by a factor of 10 reduces the magnitude of the fluctuations only slightly. This indicates that long-duration fluctuations are present in the train of vesicular release events, consistent with a fractal rate.
Fig. 3.

Semilogarithmic plot of the rate estimates for original and shuffled data. a, Rate of spontaneous vesicular exocytosis for the same data set illustrated in Figure 2. Two different counting times were used to compute the rate:T = 25 sec (solid curve) andT = 250 sec (dashed curve). The fluctuations in the estimate do not diminish appreciably as the averaging time increases, although some reduction must occur.b, The same plots computed after shuffling (randomly reordering the intervals of) the data shown in a. The fluctuations diminish much more rapidly with increasing averaging time. In all cases the mean rate λ = 1/E[t] ∼0.3, as expected.
This behavior derives from dependencies among the interevent intervals, as confirmed by using a surrogate data set; the fractal properties of the rate estimate are destroyed by shuffling (randomly reordering) the intervals. This operation removes the dependencies among the intervals while exactly preserving the interevent-interval histogram. With all dependencies among the intervals eliminated by shuffling (aside from those inherent in retaining the same IIH), the resulting surrogate essentially behaves as a renewal point process. The vesicular release rate for these same data, after such shuffling, is illustrated in Figure 3b. The T = 250 sec shuffled data (dashed curve) now exhibits noticeably smaller fluctuations than does the T = 25 sec shuffled data (solid curve). This more rapid reduction in the magnitude of the fluctuations with larger averaging time is typical for nonfractal rates.
The quantitative behavior of the magnitude of the rate fluctuations with counting time is considered more conveniently in terms of the AF, which is discussed next.
Power-law behavior of the AF
A highly useful measure that is sensitive to correlations in a point process is the AF, a relative variance based on a particular wavelet transform (Teich et al., 1996a). Its definition and properties are presented in Appendix . The AF calculated at a particular counting time T provides a quantitative measure of the variability exhibited by the rate estimates displayed in Figure 3a. For general well behaved processes, the AFA(T) is a function of the counting time T; the unique exception is the HPP, for whichA(T) = 1 for all counting timesT. Useful values of the counting time T range from one-half of the minimum interevent interval to approximately one-tenth of the duration of the recording.
The solid curve in Figure 4 is the AF for the same sequence of Xenopus neuromuscular junction MEPCs, the IIH of which is shown in Figure 2 and the rate functions of which are shown in Figure 3. The AF is seen to increase steadily for counting times greater than ∼10 sec, exceeding a value of 100 at a counting timeT = 400 sec. For sufficiently large counting times, the AF is well approximated by a straight line on this doubly logarithmic plot, so that it is well fit by an increasing power-law function of the counting time, A(T) ∝TαA, with αA ∼1.5 for this particular junction. A monotonic, power-law increase indicates the presence of fluctuations on many time scales. The quantity αA is identified as an estimate of the fractal exponent of the point process (Lowen and Teich, 1995; Thurner et al., 1997).
Fig. 4.

Doubly logarithmic plot of the Allan factor (AF) versus counting time T for the same vesicular exocytosis data (solid curve) that were examined in Figures 2 and3. For counting times larger than ∼10 sec, this curve approximately follows a straight line, which represents a fractional power-law increase of the AF with T on these doubly logarithmic coordinates. The fractal exponent αA ∼1.5 was estimated by using a least-squares fit of the functional formA(T) = C + (T/To)αA, in which C is a parameter related to the refractoriness, and To is a fractal onset time (Lowen and Teich, 1997). The range of counting times used to obtain the fit wasL/104 ≤ T ≤L/10, in which L is the duration of the recording. The long-dashed curve represents the AF after the data were shuffled 100 times and the AFs computed for each shuffling were averaged; also displayed are the ± 1 SD limits about the AF for the shuffled data (medium-dashed curves). The simulated FLNDP AF (dotted curve), using parameters identical to those used in Figure 2, agrees well with the experimental data (solid curve); the shuffled version of the FLNDP agrees well with the shuffled data (shuffled simulation not shown).
A plot of the AF alone does not reveal whether its substantial magnitude arises from the distribution of the interevent intervals (the IIH) or from their ordering. This issue is addressed by plotting the AF for the shuffled intervals. AFs constructed from shuffled data retain information about the relative sizes of the intervals, but all correlations and dependencies among the intervals are destroyed by the shuffling process, as discussed earlier. The curves designated “shuffled data” in Figure 4 illustrate the AFs obtained by this method; the long dashes indicate the mean value obtained from 100 shufflings, and the short dashes delineate a range of ± 1 SD about this mean value. The lack of observed fractal behavior in the AFs of the shuffled data indicates that it is the ordering of the intervals that gives rise to the power-law growth of the AF for those records. This confirms that the original data cannot be modeled as a renewal process.
The long-dashed curve behaves very much like the AF for a GRP, approaching a maximum value close to 1/a = 4.01 for large counting times, as expected from theory (Teich et al., 1997). Indeed, AF simulations for the GRP that best fits the IIH (long-dashed curve in Fig. 2) closely resemble the long-dashed curve in Figure4. It is clear, therefore, that the GRP provides a good fit to the AF only for the shuffled data and therefore cannot possibly describe the original (unshuffled) data. In contrast, the simulated FLNDP AF shown in Figure 4 (dotted curve) follows the original AF much more closely; moreover, a shuffled version of the FLNDP also provides a good fit to the shuffled-data AF (shuffled simulation not shown).
Power-law behavior of the PG
Fractal variability of the exocytic events also manifests itself in other statistical measures, perhaps the most familiar of which is the PG, which is an estimator of the power spectral density. Much as for continuous-time processes, the power spectral density computed for the exocytic events reveals how power is concentrated in various frequency bands. In Figure 5 we present a doubly logarithmic PG plot for the same Xenopus data sequence (solid curve) examined in Figures 2, 3, 4. For low frequenciesf (corresponding to long time scales T), the PG is well fit by a decreasing power-law function of the frequency,S(f) ∝f−αS. Thus, MEPC activity exhibits 1/f-type noise. The quantity αS provides an alternative means of estimating the fractal exponent of the vesicular exocytosis process. For this particular neuron, the PG yields αS ∼1.6, which is in close accord with the value αA∼1.5 obtained from the AF, as expected (Teich et al., 1996a; Thurner et al., 1997).
Fig. 5.

Doubly logarithmic plots of the periodogram (PG) for the same vesicular exocytosis data (solid curve) examined in Figures 2, 3, 4. The PG is an estimate of the power spectral density of the vesicular release activity. For sufficiently low frequencies, the PG approximately follows a straight line on these coordinates, representing a fractional power-law decreasing function off. The data were divided intoNFFT = 4096 equally spaced adjacent bins, and the number of MEPC events registered in each bin was recorded. A PG was computed for this sequence of counts. Smoothing was achieved by averaging PG values corresponding to frequencies within a factor of 1.02. For this particular junction the PG yields αS ∼1.6, which is in close accord with the value αA ∼1.5 obtained from the AF. The fractal exponent αS was estimated over the frequency range 1/L ≤ f ≤ 103/L, using a procedure similar to that used to estimate αA from the AF, as described in the caption of Figure 4. The long-dashed curve represents the PG of the shuffled data; it shows no such power-law behavior. The FLNDP PG simulation results (dotted curve), using parameters identical to those used in Figure 2, agree well with the data, and shuffled versions agree with the shuffled data (shuffled simulations not shown).
The PG computed from a shuffled version of the data (dashed curve), in contrast, is quite flat at low frequencies, providing further evidence that it is the ordering of the intervals, rather than their relative magnitudes, that is responsible for the fractal aspects of the rate of vesicular activity. Again, the simulated FLNDP PG shown in Figure 5 (dotted curve) provides a good fit to the experimental PG, and shuffled versions of the FLNDP also lead to results that accord with the shuffled-data PG (shuffled simulations not shown).
Because the PG is the Fourier transform of the joint coincidence rate (a measure of correlation used for a process of events), the results presented here are not inconsistent with those obtained by Rotshenker and Rahamimoff (1970; their Fig. 1), who showed excess correlation to 5 sec in preparations subjected to extracellular Ca2+levels above their normal values. Evidence for excess power at low frequencies in the absence of elevated Ca2+ also was provided by Cohen et al. (1974b). In our case, however, the power-law form for the PG shown in Figure 5 reaches down to ∼1.24 × 10⁻⁴ Hz, indicating that excess correlation extends to at least 8164 sec (the reciprocal of 1.24 × 10⁻⁴), which is the full length of the data set. We see evidence of power-law behavior in the PG of data fromall of the preparations we have examined, including theXenopus neuromuscular junction (with and without added KCl).
Alteration of the exocytosis pattern induced by depolarization with KCl
The addition of KCl to the bath solution depolarizes the nerve terminal, thereby resulting in an elevation of the cytosolic Ca2+ concentration and a consequent increase in the rate of spontaneous vesicular exocytosis (Katz, 1962). Normalized IIHs for the Xenopus neuromuscular junction in the presence of added KCl are shown in Figure 6a(dashed curve corresponds to 10 mm KCl;dotted curve corresponds to 20 mm). The IIH in the absence of added KCl, which is a normalized version of the solid curve in Figure 2, is presented for purposes of comparison (solid curve). Normalized IIHs were used to facilitate direct comparison of the curves. Each recording was obtained from a different neuromuscular junction because long data sets are required to obtain accurate statistics, and individual preparations typically do not remain viable long enough to permit more than a single recording to be obtained from a given preparation. The IIH curves all follow an exponential decay for long interevent intervals; however, the value near t = 0 is suppressed in the presence of KCl, and the coefficient of variation for the intervals is decreased.
Fig. 6.
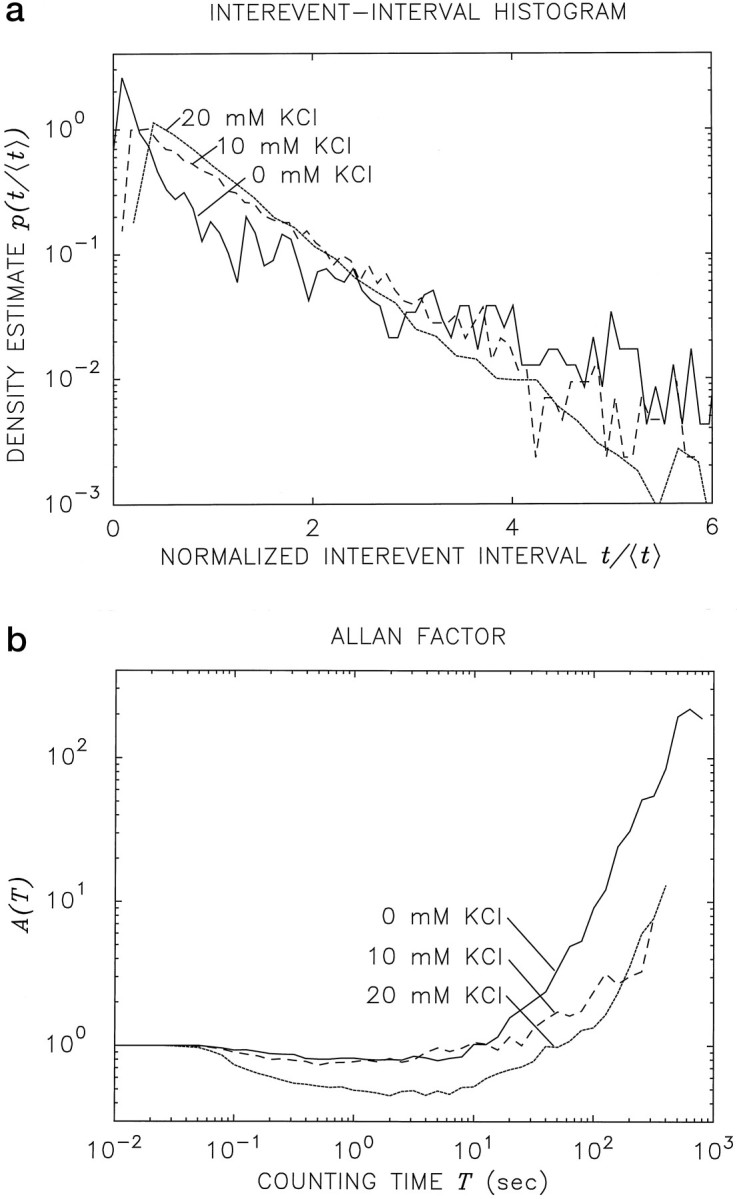
Effects of KCl-induced depolarization onXenopus neuromuscular junction activity.a, Normalized interevent-interval histograms (IIHs) with various levels of KCl in the bath solution. To facilitate comparison among the IIH plots, we normalized the interevent intervals for each data set to unity mean before we computed the histograms. The IIH obtained with no added KCl, shown in Figure 2, is replotted in normalized form (solid curve) for the purposes of comparison. The mean interevent intervals were E[t] = 3.09, 0.624, and 0.272 sec, respectively, for 0,10, and 20 mm added KCl. Although the shapes of the IIH plots are similar for all three levels of KCl, the probability density in the vicinity oft = 0 is reduced in the presence of this agent; there is a concomitant decreased coefficient of variation for the intervals. b, AF plots for the same three data sets used in a. The curve in the absence of KCl is replotted from Figure 4 for the purposes of comparison (solid curve). The AF plots for all three KCl levels show an increase at larger counting times, albeit starting at different values of the abscissa.
The same data used to construct the IIHs in Figure 6a were used to generate the AF curves in Figure 6b. The three AFs show evidence of power-law behavior at long counting times, although the minimum value of the AF is reduced under stimulation. The increased rate of vesicular release serves to regularize the process and thereby leads to a reduction of the Allan variance over time scales where refractoriness is operative (Lowen and Teich, 1997). The presence of KCl also seems to reduce the strength of the long-term correlation present in the data (see also Cohen et al., 1974b), thus increasing the counting time at which power-law behavior becomes apparent.
Data selection: dilution of fractal-rate behavior
Fatt and Katz (1952) were the first to investigate the statistical behavior of sequences of MEPCs, finding that the IIH was exponentially distributed. For a renewal process, this implies that the sequence can be described by a memoryless HPP. The IIHs measured in subsequent studies often have been variants of the exponential, which sometimes has fostered the (erroneous) notion that the event sequences are describable by processes akin to the Poisson, such as the gamma-renewal (Hubbard and Jones, 1973) or dead-time-modified Poisson (Vere-Jones, 1966) processes.
Fatt and Katz (1952) were very careful to note that the segment of data they selected for analysis (their Figs. 11–13) was sufficiently short (duration L = 176.8 sec comprising N = 800 MEPCs; E[t] ∼0.221 sec) so as to exclude, as they put it, the “occasional occurrences of short high-rate bursts” of events, and to avoid “progressive changes of the mean,” present in their data. The observation of fractal-rate behavior requires long data sets, and burstiness and apparent trends are at its very core, existing as natural components of exocytic behavior. We therefore would like to believe that the MEPCs observed by Fatt and Katz indeed did exhibit fractal-rate fluctuations but that these researchers removed most traces of it by selecting relatively short segments of data for analysis and moreover by choosing precisely those segments that exhibited minimal fluctuations.
Indeed, an analysis by Cox and Lewis (1966, page 220) of even the special segment selected by Fatt and Katz reveals a departure from Poisson behavior that takes the form of a “relatively long-term effect.” Similar conclusions were reached by Cohen et al. (1973,1974a,b) and by Van der Kloot et al. (1975).
We proceed to explicitly demonstrate the consequences of selecting such segments of data with our own measurements. We choose the 20 mm KCl data set (16358 events; duration 4451 sec; E[t] ∼0.272 sec) because it has a large number of events and its rate is comparable with that of Fatt and Katz’s classic data set.
The PG for our full data set is displayed as the solid curve in Figure7. We now select a segment from the center of the full data set (N = 800 events, excising both the 7779 events preceding it and the 7779 events after it; L = 162 sec; E[t] ∼0.203 sec) that is comparable with the segment analyzed by Fatt and Katz in number of events, data duration, and mean interevent interval. The PG for this truncated MEPC segment is shown as the dashed curve in Figure 7. Because of its limited length, it is clear that the lowest frequency available to this PG isfmin = 1/L = 1/162 ∼6 × 10⁻³ Hz, the left-hand endpoint of the dashed curve. Although the agreement of the two curves is reasonable over the range where they coexist, it is plain that the fractal behavior in the full data set cannot be accessed in the truncated version. Similarly, the AF of the truncated MEPC data set cannot be estimated reliably forT > 16 sec, assuming that a minimum of 10 samples is required for statistical accuracy. The dotted curve in Figure6b reveals that the AF begins to depart from simple renewal behavior only for counting times >16 sec. Moreover, selecting aparticular short segment of data on the basis of lack of variability (i.e., lack of burstiness or lack of progressive changes of the mean) serves to reduce further any manifestations of fractal-rate behavior.
Fig. 7.

Doubly logarithmic plot of the PG for the entire20 mm KCl data set (solid curve). The IIH for this data set is shown in Figure6a (dotted curve), and the AF is shown in Figure 6b (dotted curve). The data were divided into NFFT = 4096 equally spaced adjacent bins, and the number of MEPC events registered in each bin was recorded. A PG was computed for this sequence of counts. Smoothing was achieved by multiplying the estimated correlation function by a triangular window. The dashed curve represents the smoothed PG for a truncated segment of the data, which shows no such power-law behavior. Short data sets generally do not exhibit fractal behavior.
We conclude that fractal-rate behavior, although it well may have been present in the original data set collected by Fatt and Katz, could not be discerned in the 176.8 sec segment that they analyzed.
Power-law behavior of the AF for rat hippocampal synapses,Xenopus myocytes, and rat fibroblasts
Although our attention thus far has been directed principally toward the Xenopus neuromuscular junction, we also have observed vesicular exocytosis consistent with fractal-rate behavior from other neuronal and non-neuronal preparations, as mentioned earlier. Figure 8 displays the AFs for spontaneous vesicular release from two neuronal and two non-neuronal cells: theXenopus neuromuscular junction (solid curve; reproduced from Figs. 4, 6b), the rat hippocampal synapse in the presence of TTX (long-dashed curve),Xenopus–myocyte autoreception (short-dashed curve), and the exogenously loaded rat fibroblast brought into synaptic contact with a Xenopus myocyte (dotted curve). The curves presented in Figure 8 are representative of the data sets that were sufficiently long to merit analysis (N ≥ 400); these comprise four Xenopusneuromuscular junctions, four hippocampal synapses, oneXenopus myocyte, and two fibroblasts.
Fig. 8.

Comparison of AFs for four biological preparations exhibiting in vitro fractal spontaneous vesicular release: the Xenopus neuromuscular junction (solid curve, reproduced from Figs. 4,6b; E[t] ∼3.09 sec), a rat cultured hippocampal synapse (long-dashed curve; E[t] ∼1.95 sec), Xenopus myocyte autoreception (short-dashed curve; E[t] ∼3.44 sec), and a rat fibroblast (dotted curve; E[t] ∼12.1 sec). For longer counting times, all of the AFs suggest the presence of a power-law increase.
For large counting times, all of the eleven vesicular-exocytosis data sets examined to date exhibit AFs that increase with the counting time, in a form consistent with the presence of fractal behavior. Fractal exponents estimated from the AF plots were in the range αA = 0.1–2.7 (mean = 1.23), whereas those from the PG plots were in the range αS = 0.2–4.0 (mean = 1.79). The fractal exponents calculated from the AF and PG were in general agreement (Teich et al., 1996a; Thurner et al., 1997); the overall correlation coefficient was +0.62, with substantially superior agreement for the longer data sets. Improved correlation would, no doubt, be obtained if the recordings were of yet longer duration so that asymptotic power-law behavior could be attained. Nevertheless, fractal-rate activity seems to be ubiquitous in exocytic events.
Biophysical origin of the fractal behavior
A number of possible origins exist for the observed fractal behavior. One plausible scenario is that exocytosis is governed by fractal Ca2+-ion channel activity and that this activity ultimately derives from 1/f-type fluctuations of the membrane voltage. We proceed to provide a biophysical description of this process. The mathematical formulation, which leads to the FLNDP, is developed in Appendix .
It generally is accepted that voltage-gated Ca2+-ion-channel openings are responsible for vesicular exocytosis (Zucker, 1993). For a fixed membrane voltageV near the resting potential, calcium flow is negligible. Occasionally, however, random thermally induced channel openings occur, which often lead to spontaneous exocytic events for nearby vesicles. Such spontaneous behavior is almost completely memoryless and is therefore well modeled by an HPP, with rate λ given by the Arrhenius equation (Berry et al., 1980) λ = 𝒜exp{−[EA −zFV]/R𝒯}, as given in Equation B1. Here 𝒜 is a rate constant (often called the frequency factor),EA is the constant activation energy associated with the ion-channel opening, z is the valence of the charge involved in the channel opening, F is the Faraday constant (coulombs/mol), R is the thermodynamic gas constant, and 𝒯 is the absolute temperature. Channel-opening events that do not lead to exocytosis are accounted for in the values of 𝒜 and EA. According to this picture, different fixed membrane voltages V lead to spontaneous exocytic patterns that differ only in their average rates; all are HPPs. These rates are exponential functions of the membrane voltage, as prescribed by the Arrhenius equation. Indeed, the low-variability sections of data selected for analysis by Fatt and Katz (1952) likely would be associated with regions for which the rate is relatively constant so that the sequence of events could be well approximated by an HPP, as they found.
However, the membrane voltage is not fixed but, rather, varies randomly in time. Denoted V(t), it has a gaussian amplitude distribution and a 1/f-type spectrum (Verveen and Derksen, 1968). The rate λ(t) of the Poisson process, therefore, also varies in time, as described by Equation B2, which shows that the rate is the exponential transform of the voltage. Because the latter has a gaussian (normal) amplitude distribution, the rate is described by a lognormal amplitude distribution (Saleh, 1978) with a closely related spectrum. (A lognormal random variable is one for which the logarithm is normally distributed.) The rate process therefore is called fractal lognormal noise (FLN) and is described in Appendix . In short, the channel openings are characterized by a doubly stochastic Poisson process (Cox and Lewis, 1966) with a rate that is FLN: the FLNDP.
The net result is that the calcium-flow events, and therefore the exocytic events, are described by the FLNDP, the properties of which are provided in Appendix . Unlike the HPP, the FLNDP has memory. Thus, the fluctuating membrane voltage imparts fractal correlations to the rate of exocytic events so that the observation of a short (long) interevent interval, for example, signifies a locally high (low) rate λ(t), which in turn indicates that the next interevent interval is also likely to be short (long). The FLNDP is clearly a nonrenewal process. However, the sequence of events generated by the FLNDP model does not form a proper fractal in time because it does not itself scale. Rather, the rate of event occurrences scales so that the FLNDP belongs to the family of fractal-rate stochastic point processes.
Analytical predictions and computer simulations based on this model were compared with the exocytic-event data for a variety of statistical measures. We performed 100 simulations of the FLNDP, using parameter values obtained from the data set that is displayed in Figures 2, 3, 4, 5. IIH plots were computed for each simulation; these differed only in the seeds used for the random number generator. These 100 plots were averaged together to yield an aggregate IIH plot. This same process was used to construct AF and PG plots, using the same simulations (and therefore the same parameters and random seeds).
The resulting theoretical curves, denoted FLNDP, are presented as the dotted curves in Figures 2, 4, and 5. The theoretical results shown in all of these figures used a single set of parameters derived from the experimental data. Agreement with the data is excellent over all time scales. The slight deviations between the behavior of the FLNDP and the experimental data evidenced in the AF (Fig. 4) and in the PG (Fig. 5) would diminish no doubt were refractoriness included in the simulation. Indeed, it is known that refractoriness produces a dip in the AF for counting times in the vicinity of the refractory period (Lowen and Teich, 1997), the very region where the agreement is least satisfactory in Figure 4. Moreover, the AF and PG calculated using shuffled FLNDP simulations are in excellent accord with those of the shuffled data (long-dashed curves) in Figures 4 and 5, respectively. We conclude that, aside from its physiological plausibility, the FLNDP provides an excellent mathematical model for characterizing sequences of MEPCs observed in our experiments.
It is, however, possible that the fractal-rate behavior manifested in exocytic data derives from other mechanisms. Wide ranges of conformational states and time scales seem to be ubiquitous in large proteins (Liebovitch and Tóth, 1990) so that fractal-rate exocytic behavior could originate from fractal behavior of the specialized proteins directly involved in vesicular exocytosis rather than via mediation by calcium. Or, fractal Ca2+-ion-channel openings could lead to average intracellular Ca2+-ion concentrations that behave in a fractal manner, in turn modulating global docking- and transport-protein behavior (Zucker, 1993). Even in these cases, however, the FLNDP model would provide a useful mathematical description of the vesicular release process, albeit with a different biological interpretation.
DISCUSSION
As indicated above, activity consistent with fractal-rate behavior is present in every in vitro spontaneous vesicular-secretion preparation of sufficient length (N≥ 400 events) that we have examined, neuronal and non-neuronal alike. Because vesicular exocytosis at the synapse shares many features and proteins in common with exocytosis and intracellular trafficking in all eukaryotic cells (Bennett and Scheller, 1993), it may be that such behavior is present in these systems as well.
Fractal and fractal-rate behavior are also present in excitable- tissue recordings for various biological systems in vivo, from the microscopic to the macroscopic (Bassingthwaighte et al., 1994; West and Deering, 1994). Examples include the openings and closings of ion channels (Läuger, 1988; Millhauser et al., 1988; Liebovitch and Tóth, 1990; Teich et al., 1991; Lowen and Teich, 1993a–c); patterns of action-potential firings in the auditory system (Teich, 1989, 1992; Teich et al., 1990; Powers and Salvi, 1992; Kumar and Johnson, 1993; Kelly et al., 1996; Lowen and Teich, 1996, 1997), visual system (Turcott et al., 1995; Teich et al., 1996a,b, 1997), somatosensory cortex (Wise, 1981), and mesencephalic reticular formation (Grüneis et al., 1993); and even the sequence of human heartbeats (Kobayashi and Musha, 1982; Saul et al., 1988; Turcott and Teich, 1993, 1996). In almost all of these cases, the upper limit of the observed time over which fractal correlations exist is imposed by the duration of the recording. The appearance of fractal-rate behavior at synapses, as well as in systems comprising collections of synapses, indicates that such behavior is ubiquitous in neural signaling.
The connection between fractal-rate fluctuations and information encoding and transmission in neurons, if there is one, remains unclear. Fractal noise exhibits larger fluctuations at lower frequencies and thereby generally renders difficult the detection of the slowest, most gradual changes in a signal. Thus fractal exocytic activity could represent a fundamental source of noise ubiquitous in living cells, to which natural systems must adapt. However, many natural signals are themselves fractal (Voss and Clarke, 1978), and it may be that fractal activity in neurons provides some advantages in terms of matching the detection system to the expected signal (Teich, 1989, 1992).
Fractal-rate activity also represents a form of memory, because the occurrence of an event at a particular time increases the likelihood of another event occurring later, with the strength of this memory persisting for some time. Fractal-rate synaptic activity therefore provides a distributed network for memory and may provide a mechanism for potentiation.
Although it is difficult to ascribe definitively the observed long-term correlation in neurotransmitter release events to fractal-rate behavior for a single data set of the limited size available in these experiments, it is gratifying that the FLNDP model, which relies on only three free parameters (interevent-interval mean and variance, and fractal exponent), provides good agreement with the exocytic data. That activity consistent with fractal-rate behavior exists in all of the 11 data sets that we have examined indicates that the FLNDP is a useful model for describing our observations. Further confidence in the use of this model is engendered by the success of its close relative, the refractoriness-modified fractal binomial-noise-driven doubly stochastic Poisson process (FBNDP), for modeling action-potential activity of primary afferent auditory-nerve fibers in the cat (Lowen and Teich, 1995, 1996; Thurner et al., 1997). For voltage fluctuations small enough so that the exponential transform in Equation B2 can be approximated by a linear function, the FLNDP becomes nearly the same as the FBNDP. Moreover, the FLNDP and another related process, the fractal binomial-noise-driven doubly stochastic gamma process (FBNDG), have been used successfully to model retinal-ganglion-cell and lateral-geniculate-cell action-potential activity in the visual system of the cat (Teich et al., 1997).
In conclusion, it is clear that traditional renewal models treating vesicular exocytosis as a memoryless stochastic process are wholly inadequate for representing many of its salient features. Rather, a new class of models that rely on fractal-rate stochastic point processes is required.
DEFINITION AND PROPERTIES OF THE AF
The Allan factor (AF) is defined as the ratio of the Allan variance to twice the mean of the event count (Teich et al., 1996a). The Allan variance, in turn, is the average variation in the difference of adjacent counts (Allan, 1966). To compute the Allan variance at a specified counting time T, the data record of durationL first is divided into L/T contiguous counting windows, each of duration T. Much as in the procedure used to calculate the rate estimate, the number of eventsZk(T) falling within the k-th window is registered for all indicesk corresponding to windows lying entirely within the data record. The difference between the count numbers in a given window [i.e., Zk(T)] and the one after it [Zk+1(T)] is then computed for all k. The mean square of this quantity, E{[Zk+1(T) −Zk(T)]2} , is the Allan variance. Dividing the Allan variance by twice the mean yields the AF:
| Equation 1A |
This process is performed for a set of different counting timesT (leading to different sequences of counts {Zk(T)}), to generate plots of the functional form of the AF versus counting time. For general sequences of events, A(T) varies with T; the unique exception is the HPP, for whichA(T) = 1 for all T. Sequences of events also may be represented by a counting process,N(T), equal to the number of events registered between the time origin and a time t, so that:
| Equation 2A |
For an arbitrary sequence of events, useful values of the counting time T typically range from one-half the minimum interevent interval, below which A(T) = 1, to approximately one-tenth the duration of the recording (L/10), above which the statistical accuracy becomes poor as a result of an insufficient number of samples L/T. The behavior of the AF plot at various intervening time scales reveals important information about the behavior of the underlying process. One example is provided by absolute or relative refractoriness, which, if present, causes a dip in the AF plot for counting times near (and somewhat larger than) the refractory period. This arises because refractoriness imposes a minimum spacing between events, which serves to regularize the numbers of eventsZk(T) in each counting window. This, in turn, reduces the Allan variance, thereby leading to a diminished AF in the vicinity of those counting times.
An increase in the AF near a specific time scale occurs if event clusters of that particular scale are present in the data; the AF then will reach a plateau beyond the largest time scale present. Such behavior would be manifested, for example, by a Bartlett–Lewis cluster process such as that used by Cohen et al. (1974b) to model the MEPC sequence in the frog neuromuscular junction. A fractal-rate stochastic point process, in contrast, generates a hierarchy of clusters of different durations, which leads to an AF plot that continues to rise as each cluster time scale is incorporated in turn. The net result is an AF that rises in power-law manner with increasing counting time T (straight line on a doubly logarithmic plot). For such processes the AF begins to rise above its asymptotic value of unity at a counting time that depends on the relative strength of the fractal component of its rate.
It is important to note that the random fluctuations inherent in any finite data set lead to AF plots that exhibit variability about the values predicted for exactly defined (nonrandom) point processes (Thurner et al., 1997). For data sets of sizes comparable with those used in this paper, such fluctuations can prove significant for any single plot, and conclusive proof of fractal behavior is not always possible. However, given a number of data sets of this size, uncertainty is greatly reduced. A similar argument applies for the PG.
The AF is preferred to the count index of dispersion (Fano factor), a similar measure constructed from the ordinary variance–time curve, for the analysis of fractal-rate stochastic point processes because of its greater generality and freedom from bias (Lowen and Teich, 1996; Teich et al., 1996a; Thurner et al., 1997). A particular advantage of the use of the AF (or, equivalently, the Allan variance–time curve, which contains the same information) over the ordinary variance–time curve (Cox and Smith, 1953; Cohen et al., 1974b) lies in its insensitivity to linear trends, a result of the fact that it relies on a first-order difference. This is a very important feature, which stems from the close relation of the AF to wavelet theory and, in particular, to the Haar wavelet. Generalizations of the AF, based on other wavelets, are insensitive to higher order trends (Teich et al., 1996a).
MATHEMATICAL FORMULATION OF THE FLNDP
For a membrane voltage near the resting potential, calcium-ion flux into the cell generally remains well below the value needed to trigger an exocytic event (Zucker, 1993), because voltage-gated Ca2+-ion channels tend to remain closed under these conditions. Random thermal fluctuations, however, occasionally cause a few nearby channels to open in the same time frame, although the membrane voltage greatly favors the closed state. It turns out that only a few such channels need open to provide sufficient calcium to trigger vesicular exocytosis (Zucker, 1993). Were the membrane voltage fixed, this spontaneous behavior would be essentially memoryless; knowledge of all previous event occurrence times would yield no additional information about the future beyond that given by the average rate λ of the events. The mathematical model for discrete events in this case is the HPP, which is specified by a single parameter: the expected rate λ of nearby, nearly simultaneous Ca2+-ion-channel openings and, therefore, of the associated exocytic events.
Transition-state theory (Berry et al., 1980) describes the dependence of this expected rate λ on various parameters of the ion channels (Hille, 1992) and predicts that it is given by the Arrhenius equation:
| Equation 1B |
Here 𝒜 is a rate constant (often called the frequency factor), EA is the constant activation energy associated with the ion-channel opening, zis the valence of the charge involved in the channel opening,F is the Faraday constant (coulombs/mol), R is the thermodynamic gas constant, and 𝒯 is the absolute temperature. That some channel-opening events do not lead to exocytosis is incorporated into the values of 𝒜 andEA. Different fixedmembrane voltages V lead to spontaneous exocytic patterns that differ only in their average rates; all are HPPs. These rates are exponential functions of the membrane voltage, as prescribed by Equation B1.
However, the resting voltage V of an excitable-tissue membrane is not fixed but, rather, exhibits fractal (1/f-type) fluctuations with a gaussian amplitude distribution (Verveen and Derksen, 1968). We therefore replaceV by V(t) in Equation B1 to accommodate these voltage fluctuations:
| Equation 2B |
For a stationary process with a gaussian amplitude distribution, the mean and spectrum suffice to describe the process completely (Saleh, 1978). The power spectral densitySV(f) for a 1/f-type process follows the form:
| Equation 3B |
over a range of frequencies for some positive constantsc and α. A rate function with a power spectral density of the form of Equation B3 is fractal, because changing the frequency (or time) scale is tantamount to changing the amplitude. For example, replacing f by 2f yields the same result as changing c to 2−αc.
Thus, three parameters completely describe the membrane voltage: μV ≡ E[V], c, and α. (The membrane voltage variance, ςV2 ≡ Var[V], is expressible in terms of these three parameters.) We could, alternatively, have used a formulation in terms of the autocorrelation function RV(τ) ≡ E[V(t)V(t+τ)], which is the Fourier transform of the power spectral density.
Because the voltage is gaussian (normal), and the rate is the exponential transform of the voltage in accordance with Equation B2, the rate has a lognormal amplitude distribution [the exponential of a gaussian is defined to be lognormal (Saleh, 1978)]. The random process describing the rate λ(t) therefore is given the appellation fractal lognormal noise (FLN); its amplitude distribution is lognormal, and its spectrum is derived from 1/f-type noise. The mathematical model for the discrete events in this case is therefore a Poisson process with a rate described by FLN, i.e., the FLNDP.
It remains for us to determine the relevant statistics of λ(t) for the FLN described by Equation B2. These, in turn, will be used to determine the statistics of the exocytic events themselves, which are described by the FLNDP. We proceed by defining an auxiliary process X(t), which is a normalized version of the membrane voltage V(t):
| Equation 4B |
so that the rate in Equation B2 becomes:
| Equation 5B |
X(t) also has a gaussian amplitude distribution, with associated mean μX ≡ E[X] = (zFμV −EA)/R𝒯, variance ςX2 ≡ Var[X] = (zF/R𝒯)2ςV2, and autocorrelation functionRX(τ) = μX2 + (zF/R𝒯)2[RV(τ) − μV2]. Straightforward application of probability theory yields the moments of the rate:
| Equation 6B |
by completing the square. In particular, the rate λ(τ) has a mean E[λ] = 𝒜exp(μX + ςX2/2) and a variance Var[λ] = 𝒜2 exp(2μX) × [exp(2ςX2) − exp(ςX2)].
We now turn to the autocorrelation function of the rate:
| Equation 7B |
To proceed, we split X(t + τ) into two portions, one of which is proportional to X(t) and the other uncorrelated with it. We therefore write:
| Equation 8B |
in which the correlation coefficient ρX(τ) is given by:
| Equation 9B |
and where Y(t,τ) is defined implicitly by Equation B8. Since:
| Equation 10B |
we see that E[X(t)Y(t+ τ)] = 0 so that X(t) andY(t,τ) are uncorrelated andY(t,τ) has zero mean. BecauseX(t) is a gaussian process andY(t,τ) is linearly related to it, it is apparent that Y(t,τ) is also gaussian and, in fact, is jointly gaussian with X(t). Therefore,X(t) and Y(t,τ) are independent (Saleh, 1978). Rearranging Equation B8 leads to the variance of Y(t,τ):
| Equation 11B |
We now use conditional expectation to determine the autocorrelation function of λ(t):
| Equation 12B |
where the independence of X(t) andY(t,τ) permits the replacement of the expectation of the product by the product of the expectations. Using a relation analogous to that used in Equation B6 to evaluate the first and third factors on the right-hand side of Equation B12 yields the final result:
| Equation 13B |
The associated power spectral densitySλ(f) of λ(t) is the Fourier transform ofRλ(τ). The exponential transformation in the rightmost portion of Equation B13 renders the relationship between the autocorrelation functions of the voltage V(t) and the rate λ(t) nonlinear; in particular,Sλ(f) will not follow an exact power-law decay as doesSV(f). However, for relatively small ςX2, which appears to apply for the vesicular-release events we have recorded, the forms of the two power spectral densities do not differ greatly.
Finally, we consider the process of the exocytic events themselves, which we denote N(t), as in Appendix . These events are described in terms of a Poisson process driven by a fractal lognormal rate function λ(t). The sequence of the coincident calcium-flow events, and therefore of the vesicular release events themselves, is then described by a FLNDP, as promised. The statistics of the FLNDP process are computed readily from those of the FLN rate. If the results for a general Poisson process (Saleh, 1978;Lowen, 1996) are used, the power spectral densitySN(f) of the events becomes:
| Equation 14B |
The AF is related to the power spectral density by (Lowen, 1996):
| Equation 15B |
For a power spectral density that takes the form of Equation B3, we have A(T) ∼Tα.
If we assume further that the rate λ(t) [or equivalently the voltage V(t)] exhibits fluctuations that are slow in comparison with the average rate of channel openings E[λ], closed-form expressions for the moments of the times tbetween channel openings also can be obtained, again with the help of general Poisson-process theory (Saleh, 1978):
| Equation 16B |
In particular, t has a mean:
| Equation 17B |
and a variance:
| Equation 18B |
In short, a membrane voltage with a 1/f-type power spectral density ultimately leads to a sequence of exocytic events with an approximately 1/f-type spectrum. The argument is summarized as follows. The voltage V(t) has an amplitude distribution that is gaussian and a spectrumSV(f) that decays as 1/fα (Eq. B3). The autocorrelation function of the voltage RV(τ) (which is the inverse Fourier transform of the spectrum) does not itself scale for the values of α determined from most exocytic recordings but nonetheless contains all of the information that resides in the spectrumSV(f). The normalized voltage X(t) (Eq. B4) is linearly related to V(t) and therefore has statistics simply related to those of V(t). The rate λ(t) is obtained by exponentially transforming the voltageV(t) (Eq. B2) or, equivalently, the normalized voltage X(t) (Eq. B5); it therefore exhibits a lognormal amplitude distribution and an autocorrelation functionRλ(τ) obtained via the exponential transform of RV(τ) (Eq. B13). The spectrum of the rate Sλ(f) is obtained by Fourier transformation of Rλ(τ). For the parameter values that emerge from the data, the exponential transform is roughly linear so that RV(τ) andRλ(τ) are approximately proportional to each other, so that Sλ(f) essentially follows the same 1/fα form as SV(f). The spectrum SN(f) of the exocytic event sequence itself, N(t), differs from Sλ(f) only by a constant (Eq. B14) so that it also then varies as 1/fα. Finally, for such processes the AF A(T) increases with counting time Tas Tα (Eq. B15 and following). We conclude that the spectrum of the membrane voltage, of the rate, and of the exocytic events all decay as 1/fαwith the same power-law exponent α, which is identical to the exponent that appears in the AF.
Footnotes
This work was supported by Grants from the Whitaker Foundation to S.B.L., from the National Institutes of Health (NS-31923) to M-m.P., and from the Office of Naval Research (N00014-92-J-1251) to M.C.T. We thank Conor Heneghan and Eric Schwartz for helpful suggestions.
Correspondence should be addressed to Professor Malvin C. Teich, Department of Electrical and Computer Engineering, Boston University, Boston, MA 02215.
REFERENCES
- 1.Allan DW. Statistics of atomic frequency standards. Proc IEEE. 1966;54:221–230. [Google Scholar]
- 2.Anderson MJ, Cohen MW, Zorychta E. Effects of innervation on the distribution of acetylcholine receptors on cultured muscle cells. J Physiol (Lond) 1977;268:731–756. doi: 10.1113/jphysiol.1977.sp011879. [DOI] [PMC free article] [PubMed] [Google Scholar]
- 3.Bassingthwaighte JB, Liebovitch LS, West BJ. Fractal physiology. American Physiological Society/Oxford; New York: 1994. [Google Scholar]
- 4.Bennett MK, Scheller RH. The molecular machinery for secretion is conserved from yeast to neurons. Proc Natl Acad Sci USA. 1993;90:2559–2563. doi: 10.1073/pnas.90.7.2559. [DOI] [PMC free article] [PubMed] [Google Scholar]
- 5.Berry RS, Rice SA, Ross J. Physical chemistry. Wiley; New York: 1980. [Google Scholar]
- 6.Chow I, Poo M-m. Release of acetylcholine from embryonic neurons upon contact with the muscle cell. J Neurosci. 1985;5:1076–1082. doi: 10.1523/JNEUROSCI.05-04-01076.1985. [DOI] [PMC free article] [PubMed] [Google Scholar]
- 7.Cohen I, Kita H, Van der Kloot W. Miniature end-plate potentials: evidence that the intervals are not fit by a Poisson distribution. Brain Res. 1973;54:318–323. doi: 10.1016/0006-8993(73)90054-1. [DOI] [PubMed] [Google Scholar]
- 8.Cohen I, Kita H, Van der Kloot W. The intervals between miniature end-plate potentials in the frog are unlikely to be independently or exponentially distributed. J Physiol (Lond) 1974a;236:327–339. doi: 10.1113/jphysiol.1974.sp010437. [DOI] [PMC free article] [PubMed] [Google Scholar]
- 9.Cohen I, Kita H, Van der Kloot W. The stochastic properties of spontaneous quantal release of transmitter at the frog neuromuscular junction. J Physiol (Lond) 1974b;236:341–361. doi: 10.1113/jphysiol.1974.sp010438. [DOI] [PMC free article] [PubMed] [Google Scholar]
- 10.Cox DR, Lewis PAW. The statistical analysis of series of events. Methuen; London: 1966. [Google Scholar]
- 11.Cox DR, Smith WL. The superposition of several strictly periodic sequences of events. Biometrika. 1953;40:1–11. [Google Scholar]
- 12.Dan Y, Poo M-m. Quantal transmitter secretion from myocytes loaded with acetylcholine. Nature. 1992;359:733–736. doi: 10.1038/359733a0. [DOI] [PubMed] [Google Scholar]
- 13.Del Castillo J, Katz B. Quantal components of the end-plate potential. J Physiol (Lond) 1954;124:560–573. doi: 10.1113/jphysiol.1954.sp005129. [DOI] [PMC free article] [PubMed] [Google Scholar]
- 14.Evers J, Laser M, Sun Y-a, Xie Z-p, Poo M-m. Studies of nerve–muscle interactions in Xenopus cell culture: analysis of early synaptic currents. J Neurosci. 1989;9:1523–1539. doi: 10.1523/JNEUROSCI.09-05-01523.1989. [DOI] [PMC free article] [PubMed] [Google Scholar]
- 15.Fatt P, Katz B. Spontaneous subthreshold activity at motor nerve endings. J Physiol (Lond) 1952;117:109–128. [PMC free article] [PubMed] [Google Scholar]
- 16.Girod R, Popov S, Alder J, Zheng JQ, Lohof A, Poo M-m. Spontaneous quantal transmitter secretion from myocytes and fibroblasts: comparison with neuronal secretion. J Neurosci. 1995;15:2826–2838. doi: 10.1523/JNEUROSCI.15-04-02826.1995. [DOI] [PMC free article] [PubMed] [Google Scholar]
- 17.Goslin K, Banker G. Rat hippocampal neurons in low-density culture. In: Banker G, Goslin K, editors. Culturing nerve cells. MIT; Cambridge, MA: 1991. [Google Scholar]
- 18.Grüneis F, Nakao M, Mizutani Y, Yamamoto M, Meesmann M, Musha T. Further study on 1/f fluctuations observed in central single neurons during REM sleep. Biol Cybern. 1993;68:193–198. doi: 10.1007/BF00224851. [DOI] [PubMed] [Google Scholar]
- 19.Hamill OP, Marty A, Neher A, Sakmann B, Sigworth FJ. Improved patch-clamp techniques for high-resolution current recording from cells and cell-free membrane patches. Pflügers Arch. 1981;391:85–100. doi: 10.1007/BF00656997. [DOI] [PubMed] [Google Scholar]
- 20.Hille B. Ionic channels of excitable membranes. Sinauer; Sunderland, MA: 1992. [Google Scholar]
- 21.Horn R, Marty A. Muscarinic activation of ionic currents measured by a new whole-cell recording method. J Gen Physiol. 1988;92:145–159. doi: 10.1085/jgp.92.2.145. [DOI] [PMC free article] [PubMed] [Google Scholar]
- 22.Hubbard JI, Jones SF. Spontaneous quantal transmitter release: a statistical analysis and some implications. J Physiol (Lond) 1973;232:1–21. doi: 10.1113/jphysiol.1973.sp010254. [DOI] [PMC free article] [PubMed] [Google Scholar]
- 23.Katz B. The transmission of impulses from nerve to muscle, and the subcellular unit of synaptic action. Proc R Soc Lond [Biol] 1962;155:455–479. [Google Scholar]
- 24.Katz B. Nerve, muscle, and synapse. McGraw-Hill; New York: 1966. [Google Scholar]
- 25.Kelly OE, Johnson DH, Delgutte B, Cariani P. Fractal noise strength in auditory-nerve fiber recordings. J Acoust Soc Am. 1996;99:2210–2220. doi: 10.1121/1.415409. [DOI] [PubMed] [Google Scholar]
- 26.Kobayashi M, Musha T. 1/f fluctuation of heartbeat period. IEEE Trans Biomed Eng. 1982;29:456–457. doi: 10.1109/TBME.1982.324972. [DOI] [PubMed] [Google Scholar]
- 27.Kuffler SW, Yoshikami DJ. The number of transmitter molecules in a quantum: an estimate from iontophoretic application of acetylcholine at the neuromuscular synapse. J Physiol (Lond) 1975;251:465–482. doi: 10.1113/jphysiol.1975.sp011103. [DOI] [PMC free article] [PubMed] [Google Scholar]
- 28.Kumar AR, Johnson DH. Analyzing and modeling fractal intensity point processes. J Acoust Soc Am. 1993;93:3365–3373. doi: 10.1121/1.405692. [DOI] [PubMed] [Google Scholar]
- 29.Läuger P. Internal motions in proteins and gating kinetics of ionic channels. Biophys J. 1988;53:877–884. doi: 10.1016/S0006-3495(88)83168-0. [DOI] [PMC free article] [PubMed] [Google Scholar]
- 30.Liebovitch LS, Tóth TI. Using fractals to understand the opening and closing of ion channels. Ann Biomed Eng. 1990;18:177–194. doi: 10.1007/BF02368428. [DOI] [PubMed] [Google Scholar]
- 31.Lowen SB. Refractoriness-modified doubly stochastic Poisson point process. Center for Telecommunications Research Technical Report 449-96-15. Columbia University; New York: 1996. [Google Scholar]
- 32.Lowen SB, Teich MC. Fractal renewal processes generate 1/f noise. Phys Rev E. 1993a;47:992–1001. doi: 10.1103/physreve.47.992. [DOI] [PubMed] [Google Scholar]
- 33.Lowen SB, Teich MC. Fractal renewal processes. IEEE Trans Inform Theory. 1993b;39:1669–1671. [Google Scholar]
- 34.Lowen SB, Teich MC. Fractal auditory-nerve firing patterns may derive from fractal switching in sensory hair-cell ion channels. In: Handel PH, Chung AL, editors. Noise in physical systems and 1/f fluctuations, AIP conference proceedings 285. American Institute of Physics; New York: 1993c. pp. 745–748. [Google Scholar]
- 35.Lowen SB, Teich MC. Estimation and simulation of fractal stochastic point processes. Fractals. 1995;3:183–210. [Google Scholar]
- 36.Lowen SB, Teich MC. The periodogram and Allan variance reveal fractal exponents greater than unity in auditory-nerve spike trains. J Acoust Soc Am. 1996;99:3585–3591. doi: 10.1121/1.414979. [DOI] [PubMed] [Google Scholar]
- 37.Lowen SB, Teich MC. Estimating scaling exponents in auditory- nerve spike trains using fractal models incorporating refractoriness. In: Lewis ER, Long GR, Lion RF, Narins PM, Steele CR, Hecht-Poinar E, editors. Diversity in auditory mechanics. World Scientific; Singapore: 1997. pp. 197–204. [Google Scholar]
- 38.Millhauser GL, Salpeter EE, Oswald RE. Diffusion models of ion- channel gating and the origin of power-law distributions from single-channel recording. Proc Natl Acad Sci USA. 1988;85:1503–1507. doi: 10.1073/pnas.85.5.1503. [DOI] [PMC free article] [PubMed] [Google Scholar]
- 39.Nieuwkoop PD, Faber J. Normal table of Xenopus laevis (Daudin), 2nd Ed. North-Holland; Amsterdam: 1967. [Google Scholar]
- 40.Powers NL, Salvi RJ. Comparison of discharge rate fluctuations in the auditory nerve of chickens and chinchillas. In: Lim DJ, editor. Abstracts of the fifteenth midwinter research meeting of the Association for Research in Otolaryngology. Association for Research in Otolaryngology; Des Moines, IA: 1992. p. 101. [Google Scholar]
- 41.Rotshenker S, Rahamimoff R. Neuromuscular synapse: stochastic properties of spontaneous release of transmitter. Science. 1970;170:648–649. doi: 10.1126/science.170.3958.648. [DOI] [PubMed] [Google Scholar]
- 42.Sakmann B. Elementary steps in synaptic transmission revealed by currents through single ion channels. Science. 1992;256:503–512. doi: 10.1126/science.1373907. [DOI] [PubMed] [Google Scholar]
- 43.Saleh BEA. Photoelectron statistics. Springer; Berlin: 1978. [Google Scholar]
- 44.Saul JP, Albrecht P, Berger RD, Cohen RJ. Analysis of long term heart rate variability: methods, 1/f scaling and implications. Proc IEEE Comput Cardiol Conf. 1988;14:419–422. [PubMed] [Google Scholar]
- 45.Spitzer NC, Lamborghini JC. The development of the action potential mechanism of amphibian neurons isolated in culture. Proc Natl Acad Sci USA. 1976;73:1641–1645. doi: 10.1073/pnas.73.5.1641. [DOI] [PMC free article] [PubMed] [Google Scholar]
- 46.Sternberg DW, Scholz G, Fukui Y, Hanafusa H. Activation of a histone H1 kinase by tyrosine phosphorylation in v-src-transformed fibroblasts. EMBO J. 1993;12:323–330. doi: 10.1002/j.1460-2075.1993.tb05660.x. [DOI] [PMC free article] [PubMed] [Google Scholar]
- 47.Tabti N, Poo M-m. Culturing spinal neurons and muscle cells from Xenopus embryos. In: Banker G, Goslin K, editors. Culturing nerve cells. MIT; Cambridge, MA: 1991. [Google Scholar]
- 48.Teich MC. Fractal character of the auditory neural spike train. IEEE Trans Biomed Eng. 1989;36:150–160. doi: 10.1109/10.16460. [DOI] [PubMed] [Google Scholar]
- 49.Teich MC. Fractal neuronal firing patterns. In: McKenna T, Davis J, Zornetzer S, editors. Single neuron computation. Academic; Boston: 1992. pp. 589–625. [Google Scholar]
- 50.Teich MC, Johnson DH, Kumar AR, Turcott RG. Rate fluctuations and fractional power-law noise recorded from cells in the lower auditory pathway of the cat. Hear Res. 1990;46:41–52. doi: 10.1016/0378-5955(90)90138-f. [DOI] [PubMed] [Google Scholar]
- 51.Teich MC, Lowen SB, Turcott RG. On possible peripheral origins of the fractal auditory neural spike train. In: Lim DJ, editor. Abstracts of the fourteenth midwinter research meeting of the Association for Research in Otolaryngology. Association for Research in Otolaryngology; Des Moines, IA: 1991. p. 50. [Google Scholar]
- 52.Teich MC, Heneghan C, Lowen SB, Turcott RG. Estimating the fractal exponent of point processes in biological systems using wavelet- and Fourier-transform methods. In: Aldroubi A, Unser M, editors. Wavelets in medicine and biology, Chap 14. CRC; Boca Raton, FL: 1996a. pp. 383–412. [Google Scholar]
- 53.Teich MC, Turcott RG, Siegel RM. Temporal correlation in cat striate-cortex neural spike trains. IEEE Eng Med Biol Mag. 1996b;15(5):79–87. [Google Scholar]
- 54.Teich MC, Heneghan C, Lowen SB, Ozaki T, Kaplan E. Fractal character of the neural spike train in the visual system of the cat. J Opt Soc Am A. 1997;14:529–546. doi: 10.1364/josaa.14.000529. [DOI] [PubMed] [Google Scholar]
- 55.Thurner S, Lowen SB, Feurstein M, Feichtinger HG, Teich MC (1997) Analysis, synthesis, and estimation of fractal-rate stochastic point processes. Fractals, in press.
- 56.Turcott RG, Teich MC. Long-duration correlation and attractor topology of the heartbeat rate differ for healthy patients and those with heart failure. Proc SPIE. 1993;2036:22–39. [Google Scholar]
- 57.Turcott RG, Teich MC. Fractal character of the electrocardiogram: distinguishing heart-failure and normal patients. Ann Biomed Eng. 1996;24:269–293. doi: 10.1007/BF02667355. [DOI] [PubMed] [Google Scholar]
- 58.Turcott RG, Barker PDR, Teich MC. Long-duration correlation in the sequence of action potentials in an insect visual interneuron. J Stat Comput Simul. 1995;52:253–271. [Google Scholar]
- 59.Van der Kloot W, Kita H, Cohen I. The timing of the appearance of miniature end-plate potentials. Prog Neurobiol. 1975;4:271–326. [Google Scholar]
- 60.Vere-Jones D. Simple stochastic models for the release of quanta of transmitter from a nerve terminal. Aust J Stat. 1966;8:53–63. [Google Scholar]
- 61.Verveen AA, Derksen HE. Fluctuation phenomena in nerve membrane. Proc IEEE. 1968;56:906–916. [Google Scholar]
- 62.Voss RF, Clarke J. “1/f noise” in music: music from 1/f noise. J Acoust Soc Am. 1978;63:258–263. [Google Scholar]
- 63.West BJ, Deering W. Fractal physiology for physicists: Lévy statistics. Phys Rep. 1994;246:1–100. [Google Scholar]
- 64.Wise ME. Spike interval distributions for neurons and random walks with drift to a fluctuating threshold. In: Taillie CEA, editor. Statistical distributions in scientific work, Vol 6. Reidel; Boston: 1981. pp. 211–231. [Google Scholar]
- 65.Xie Z-p, Poo M-m. Initial events in the formation of the neuromuscular synapse. Proc Natl Acad Sci USA. 1986;83:7069–7073. doi: 10.1073/pnas.83.18.7069. [DOI] [PMC free article] [PubMed] [Google Scholar]
- 66.Zucker RS. Calcium and transmitter release. J Physiol (Paris) 1993;87:25–36. doi: 10.1016/0928-4257(93)90021-k. [DOI] [PubMed] [Google Scholar]