

Abstract
Cells within the ventricular zone (VZ) of developing neocortex are coupled together into clusters by gap junction channels. The specific role of clustering in cortical neurogenesis is unknown; however, clustering provides a means for spatially restricted local interactions between subsets of precursors and other cells within the VZ. In the present study, we have used a combination of 5-bromo-2′-deoxyuridine (BrDU) pulse labeling, intracellular biocytin labeling, and immunocytochemistry to determine when in the cell cycle VZ cells couple and uncouple from clusters and to determine what cell types within the VZ are coupled to clusters. Our results indicate that clusters contain radial glia and neural precursors but do not contain differentiating or migrating neurons. In early neurogenesis, all precursors in S and G2 phases of the cell cycle are coupled, and approximately half of the cells in G1 are coupled. In late neurogenesis, however, over half of the cells in both G1 and S phases are not coupled to VZ clusters, whereas all cells in G2 are coupled to clusters. Increased uncoupling in S phase during late neurogenesis may contribute to the greater percentage of VZ cells exiting the cell cycle at this time. Consistent with this hypothesis, we found that pharmacologically uncoupling VZ cells with octanol decreases the percentage of VZ cells that enter S phase. These results demonstrate that cell clustering in the VZ is restricted to neural precursors and radial glia, is dynamic through the cell cycle, and may play a role in regulating neurogenesis.
Keywords: neurogenesis, cerebral cortex, development, gap junctions, migration, cell cycle
The neurons and glia of the neocortex are generated from within the pseudostratified ventricular epithelium (PVE) (Takahashi et al., 1993) that surrounds the lateral ventricles of the embryonic forebrain. The PVE includes two populations of proliferating cells: ventricular zone (VZ) and subventricular zone (SVZ) cells (for references, see Boulder Committee, 1970). The VZ is the first proliferative population to appear, contains radially oriented cells, and is believed to give rise to the majority of neocortical neurons. In the mouse, neuronal precursors in the VZ undergo a final division and leave the proliferative pool of cells between embryonic day 11 (E11) and E18. Cell nuclei in the VZ move between the basal and apical surfaces as the cells progress through the cell cycle. Cells enter S phase at the basal surface of the VZ and progress through G2 as they move to the apical or ventricular surface where they then enter mitosis (M phase). After mitosis, the two daughter cells migrate back to the basal portion of the VZ where they either reenter or exit the cell cycle.
Several diffusible factors present in the VZ have been shown to either promote or inhibit the number of cortical precursors that remain in the cell cycle. Such factors include the amino acid neurotransmitters GABA and glutamate that reduce the number of VZ cells in S phase (LoTurco et al., 1995) and basic FGF (bFGF) that increases proliferation of neocortical precursors (Ghosh and Greenberg, 1995). A recent paper has demonstrated that GABA can counter the proliferative effects of bFGF, suggesting an interaction between these distinct signaling systems (Antonopoulos et al., 1997).
In addition to interacting with extracellular diffusible factors, cells within the VZ can interact directly with each other by intercellular coupling (LoTurco and Kriegstein, 1991). The function of cell coupling in the VZ is not known; however, gap junction communication among cells has been shown to be an important regulator of development in other systems (Guthrie and Gilula, 1989). In addition, as neurogenesis proceeds in the developing neocortex, clusters in the VZ progressively decrease in size (LoTurco and Kriegstein, 1991), suggesting that a decrease in coupling is related to the increased output of neurons from the VZ. Of the known gap junction channel proteins, connexin 26, connexin 43, and connexin 45 (Dermietzel, 1996) have been shown to be expressed in the VZ, and the expression of connexins 26 and 43 increases to the middle of neurogenesis then decreases as neurogenesis terminates (Dermietzel et al., 1989; Nadarajah et al., 1997). Although changes in coupling and in connexin expression indicate that interactions mediated by coupling in the VZ change during neurogenesis, it is not known what types of cells within the VZ are directly interacting or how coupling is related to the cell cycle of neocortical precursors. For example, clusters could be composed of precursors in one phase of the cell cycle or could contain cells in all phases. Furthermore, clusters could contain radial glia or postmitotic, migrating cells that are also located within the VZ. The cellular composition of clusters and any change in the composition constrain the types of direct interactions within the VZ that are mediated by gap junction channels.
To determine which cells are coupled into clusters in the VZ of developing neocortex, we have combined cluster labeling with 5-bromo-2′-deoxyuridine (BrDU) immunohistochemistry to identify coupled cells in different phases of the cell cycle. In addition, we have used antibody markers for radial glial cells and a neuron-specific tubulin to examine whether these cell types are included within VZ clusters. Our results indicate that clusters are composed of precursors in all phases of the cell cycle, except M, contain radial glial cells but do not contain migrating or postmitotic neurons. Moreover, coupling is dynamic through the cell cycle; cells couple through S and G2, uncouple in M, recouple through G1in early neurogenesis, and recouple through S in late neurogenesis.
MATERIALS AND METHODS
Preparation of embryos. Pregnant CD1 mice at E13–E18 were used in most experiments. Pregnant rats were used in some experiments to allow direct comparisons with results obtained previously with Lucifer yellow injections in rats. Embryonic age was determined by the presence of a vaginal plug (E0) and confirmed by the rump–crown length of the embryos (Schambra et al., 1992). For BrDU labeling, pregnant animals were injected intraperitoneally with BrDU (Sigma, St. Louis, MO) at 60 mg/kg in saline with 0.007N NaOH. Each animal was allowed to survive for a predetermined length of time, 1–2, 4, or 8 hr, before being killed.
Embryos were removed and placed in cold artificial CSF (ACSF), containing (in mm): 124 NaCl, 5 KCl, 2 MgCl2, 10 d-glucose, 1.25 NaH2PO4, 2 CaCl2, and 26 NaHCO3. Brains were dissected from the embryos, and several small explants of cortex (∼1 mm2) were cut from the dorsomedial telencephalons. With the ventricular surface facing up, explants were attached to a 35 mm2 Petri dish with plasma and thrombin (Sigma) as described previously (Blanton et al., 1989). Explants were placed in an oxygenated, humidified chamber (95% O2/5% CO2) and allowed to clot. Slices were then immersed and stored at room temperature in ACSF saturated with 95% O2/5% CO2.
Pharmacological uncoupling experiments. Explants of E16 cortex and postnatal day 3 (P3) cerebellum were incubated for 4 hr in either halothane (1 mm) or octanol (1 mm) in ACSF (95% O2/5% CO2) and then treated for 1 hr with 5 μm BrDU. Sections were then fixed with 4% paraformaldehyde in 0.12 m phosphate buffer overnight in the refrigerator. Tissue was paraffin-embedded and processed for BrDU immunohistochemistry as described below.
Biocytin labeling and immunohistochemistry. Clusters were filled with biocytin using whole-cell patch-clamp techniques (Blanton et al., 1989). Glass patch pipettes were pulled with a Narishige gravity pipette puller such that resistances ranged from 8 to 12 MΩ. Pipettes were filled with (in mm) 130 Cs gluconate, 10 EGTA, 10 HEPES, 1 CsCl, 1 MgCl2, and 1 CaCl2, and biocytin at ∼2 mg/ml. Osmolality was adjusted to 275–300 mOsm. For cell injections, explants were moved to a chamber and continuously perfused with ACSF, 95% O2/5% CO2, at room temperature. Whole-cell patch-clamp recordings were made as described previously (LoTurco and Kriegstein, 1991), and cells were filled with biocytin for ∼10 min. Filling for >10 min did not label more cells within a cluster.
For biocytin and BrDU double labeling, explants were fixed with cold 4% paraformaldehyde in 0.12 m phosphate buffer at 4°C overnight. All subsequent incubations were performed at room temperature. Explants were rinsed in PBS and then placed in 0.5% H2O2 in PBS for 12–30 min to saturate endogenous peroxidase activity, and then placed in 1% normal goat serum and 0.2% Triton X-100 in PBS for 1 hr. Sections were next incubated with avidin–biotin horseradish peroxidase (ABC; Vector Laboratories, Burlingame, CA) in PBS and 0.1% Triton X-100 for 1 hr. Tissue was rinsed and then reacted with diaminobenzidine (Vector Laboratories, Burlingame, CA) in the presence of 0.05% H2O2 to produce a brown precipitate. Some sections were then embedded in 1% agar in PBS, sliced at 100 μm using a vibratome, wet-mounted with 90% glycerol/10% PBS, and photographed as described below. The remaining sections were dehydrated in ascending alcohols, cleared in xylene or Hemo-D (Fisher Scientific, Houston, TX), and paraffin-embedded. Paraffin blocks were sectioned at 5 μm, and ribbons were collected onto gelatin-coated slides. Sections containing cells labeled with biocytin were then stained immunohistochemically for BrDU.
BrDU labeling was performed by clearing sections of paraffin, rehydrating, and rinsing in PBS heated to 65°C for 10 min. After two brief PBS rinses, DNA was exposed via incubation in 0.1N HCl with pepsin at 0.2 mg/ml for 6–10 min. Next, tissue was placed in 0.2N HCl at 37°C for 20 min to separate the DNA strands. After several rinses to remove excess HCl, sections were blocked with 5% normal goat serum in PBS with 0.3% Triton X-100 and were placed in mouse anti-BrDU (Novocastra) diluted 1:200 in PBS, 1% normal goat serum, and 0.3% Triton X-100 for 1 hr. Sections were then processed with the indirect avidin–biotin horseradish peroxidase technique and visualized with nickel-intensified diaminobenzidine. Tissue was lightly counterstained with 1% basic fuschin, dehydrated, cleared, and coverslipped in Permount.
For double fluorescent labeling, tissue fixed as described above was cryoprotected in 30% sucrose in PBS for 2 hr to overnight at 4°C. Tissue was changed to a 1:1 mixture of O.C.T. and PBS/sucrose and was left to incubate at 4°C overnight. Sections were placed in embedding molds (Electron Microscopy Sciences), surrounded by O.C.T., and quick frozen using liquid nitrogen vapors. Blocks were sliced at 8 μm on a cryostat and mounted onto gelatin-coated slides. Tissue was then processed for double immunofluorescence.
Sections were incubated at room temperature with rhodamine-conjugated avidin (Vector Laboratories) diluted 1:200 in HEPES-buffered saline, pH 8.2. Sections containing clusters were then stained immunocytochemically with either TUJ (Menezes and Luskin, 1994) or RAT 401 (Alvarez-Buylla et al., 1987). Tissue was blocked in 3% normal goat serum, PBS, and 0.1% Triton X-100 for 45 min, was changed directly to primary in PBS and 0.05% Triton X-100 (diluted 1:500 for TUJ and 1:200 for RAT 401) for 1 hr, and was then reacted with goat anti-mouse fluorescein isothiocyanate (FITC) IgG plus IgM (H+L) (Jackson ImmunoResearch, West Grove, PA) diluted 1:200 in PBS, 0.05% Triton X-100, and 1% normal goat serum. Slides were rinsed with PBS, counterstained with 2 μm 4,6-diamidino-2-phenylindole (DAPI; Sigma), and coverslipped in 90% glycerol/10% PBS.
Quantification and analysis. Sections were visualized with a Nikon Optiphot-2 microscope with an episcopic fluorescence attachment (EFD-3; Nikon). Images were captured with a cooled charge-coupled device video camera (Photometrics Imagepoint) using National Institutes of Health Image 1.59. BrDU indices of each cluster and the surrounding VZ were calculated. For the BrDU index of a cluster, the percentage of BrDU-labeled cells within the cluster was determined [(BrDU- and biocytin-labeled cells)/biocytin-labeled cells]. For the BrDU index of the VZ, three fields of VZ at the same level and adjacent to where clusters were labeled were counted, and a BrDU-labeling index was determined (BrDU-labeled cells/total cells in the same field). The ventricular surface and the basal extent of the cluster were used to determine the width of the VZ. In older embryos, clusters never extended into the horizontally oriented cells in the SVZ. By using the extent of the clusters to define the VZ, we found that we were able to distinguish clearly between the VZ and SVZ populations in older neocortices. Support for our ability to distinguish between the VZ and SVZ comes from the observation that the percentages of BrDU-labeled cells in the VZ after both the 1–2 and 4 hr survival times were not different. Because VZ cells and not SVZ cells undergo interkinetic cell movement and because the index remains similar for both survival times, our BrDU index for the 1–2 hr survival time is primarily that of the VZ population. Cluster and VZ BrDU-labeling indices were compared using ANOVA with the aid of SuperANOVA software running on a Power PC Macintosh. Post hoc analysis was also performed with SuperANOVA.
Visualization of fluorescent markers was performed using standard filters. Clusters were visualized using a rhodamine filter set. FITC labeling was observed using an excitation filter of 465–495 nm and a barrier filter of 515–555 nm. DAPI staining was observed with an excitation filter of 330–380 nm and a barrier filter of 420 nm.
For the pharmacological experiments, a BrDU index was computed for the VZ of E16 cortical explants and the external granular layer (EGL) of P3 cerebellar explants as described above. Comparisons of the different treatment groups were also done using SuperANOVA software.
RESULTS
Clusters are confined to the VZ
In the present study we have used biocytin to fill and label cells intracellularly in the cortical plate (CP), the IZ, and the VZ in both embryonic rat and mouse neocortex. We reported previously that Lucifer yellow injected into single cells within embryonic rat cortex resulted in the labeling of clusters of cells only when injections were made into VZ cells (LoTurco and Kriegstein, 1991). Biocytin has been shown to label coupled groups of neural cells better than Lucifer yellow does in both retina (Penn et al., 1994) and neocortex (Yuste et al., 1992). Nevertheless, in the embryonic rat or mouse neocortex, results with biocytin injections are similar to results obtained with Lucifer yellow injections. As seen with Lucifer yellow injections, biocytin injections label groups of more than two cells (clusters) only when injected into VZ cells (Fig. 1C). Injections within the IZ or CP labeled only single cells (Fig.1A,B). In slices, injections into SVZ cells labeled only single cells. In addition to labeling clusters, biocytin injections into cells in the upper part of the VZ, particularly in the latter stages of neurogenesis, often labeled one to two cells (Fig. 1D).
Fig. 1.
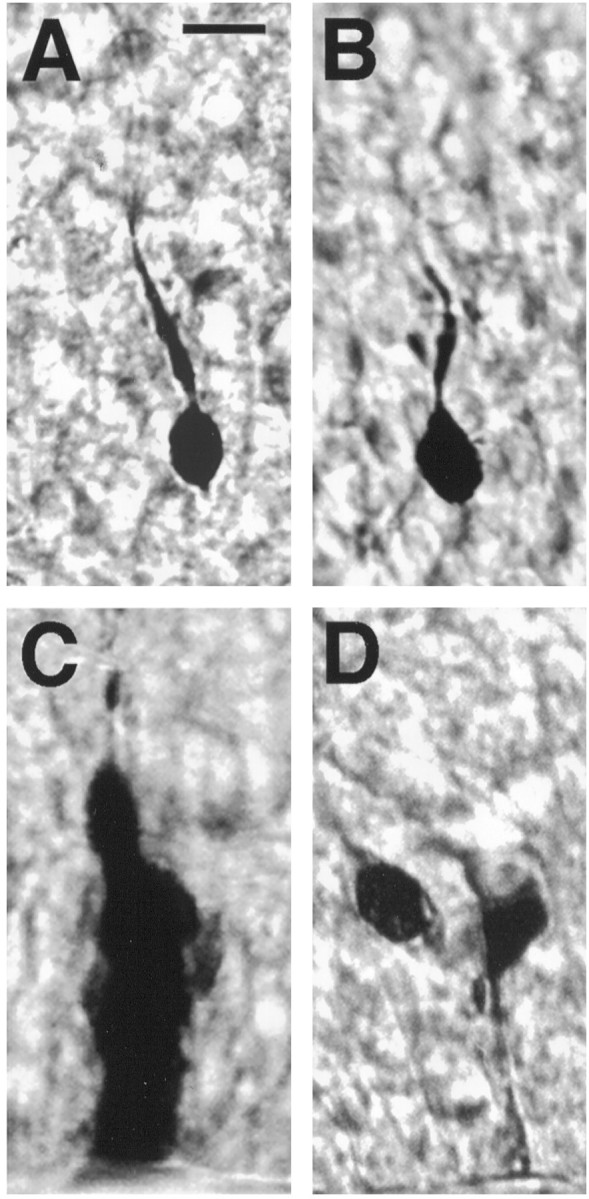
Only cells in the VZ of embryonic cortex form clusters of coupled cells. A, A cell in the IZ, a putative migrating neuron, not coupled to any other cells.B, A cell in the CP not coupled to any other cells.C, An entire cluster of cells in a 100 μm section labeled with biocytin. Cells are packed tightly, so individual cells are difficult to distinguish in a thick section. A single process exits from the top of the cluster. D, Two cells coupled at the top of the VZ. Scale bar, 10 μm.
Clusters contain precursors in S, G2, and G1
To determine the relationship between the phases of the cell cycle and cluster composition, we developed a BrDU pulse-labeling protocol based on cell cycle times reported for cells in the PVE of mice (Takahashi et al., 1995). Using the strategy illustrated in Figure2A, we labeled populations of cortical precursors in different phases of the cell cycle. Pregnant dams ranging from E13 to E18 were injected with the BrDU and allowed to survive for 1–2, 4, or 8 hr. These survival times allowed us to label cells primarily in S, late S/G2, and G1 phases of the cell cycle. Animals were then killed, and the embryos were removed. Cortical explants were taken from the embryos, and VZ clusters were filled with biocytin (Fig.2A). Tissue was then processed for biocytin and BrDU double labeling as described in Materials and Methods. Figure2B shows BrDU-stained cells within a cluster of coupled cells stained for biocytin. BrDU-labeled cells were present within clusters for the 1–2, 4, and 8 hr survival times. Therefore, precursors in S, G2, and G1 are all members of clusters.
Fig. 2.

Strategy for BrDU and biocytin double-labeling experiments. A, Pregnant mice at E13–E18 were injected with BrDU and allowed to survive for different times before the preparation of cortical explants and biocytin injection.B, Photomicrograph of tissue double-labeled for BrDU and biocytin. Black reaction product reveals BrDU staining, whereas brown product is biocytin. Thearrow indicates a cell within a cluster that is double labeled. Scale bar, 10 μm.
Clusters do not contain cells in M
Cells undergo a marked change in morphology during M phase; they retract their processes, move to the VZ surface, and divide. This alteration in morphology and the results described below indicating decreased coupling in G1 suggested that precursors may uncouple from clusters during M. To determine whether M phase cells were coupled to clusters, we used a fluorescent label for clusters in combination with a fluorescent label for nuclei, DAPI, to identify M phase nuclei. Neither rounded M phase nuclei nor mitotic figures were found to be coupled into clusters (Fig.3E,F) (n = 12). As shown in Figure 3, rounded M phase cells appeared to be explicitly excluded from clusters; the apical processes extending from cells in clusters wrapped around M cells at the ventricular surface.
Fig. 3.
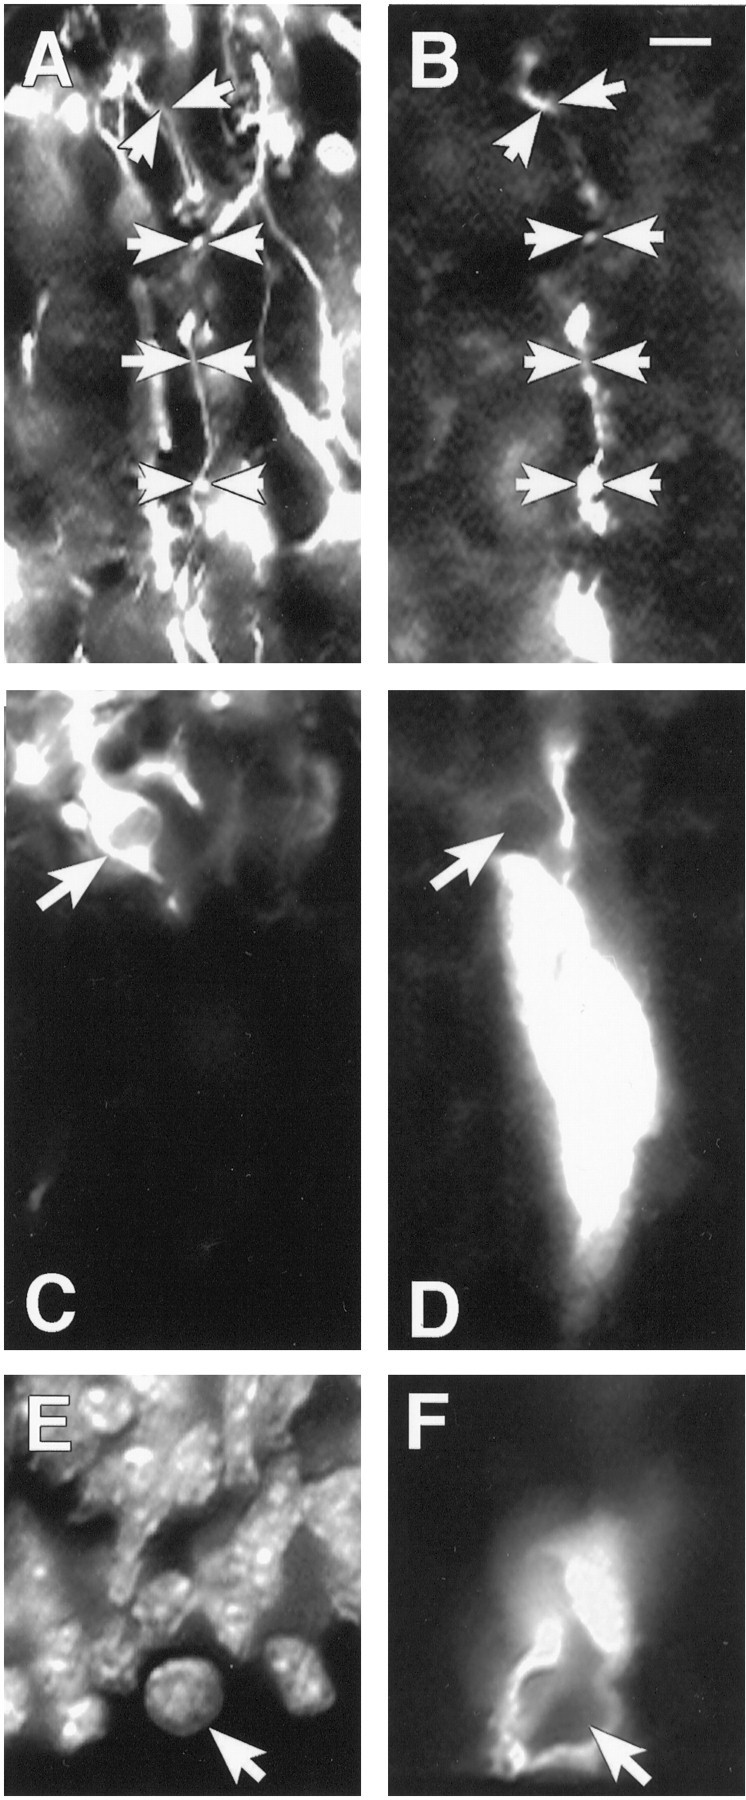
Cell types within and not within VZ clusters.A, RAT 401 nestin labeling of fibers in the IZ of E16 mouse cortex. Arrows mark the course of a glial fiber that is shown in B. B, A fiber extending into the IZ from a cluster filled in the VZ. The arrowsin A and B track the same fiber that is double-labeled for both RAT 401 and biocytin. C, TUJ labeling of the same field shown in D. Thearrow indicates a TUJ-labeled cell that is stained, and that cell is directly adjacent to the cluster labeled inD but is not coupled to the cluster. Also the fiber extending from the cluster does not stain with TUJ. D, A cluster of cells labeled with biocytin. The cluster is overexposed to show more clearly the borders of the cluster. E, A DAPI-stained view of the same field shown in F.F, The bottom of a cluster of cells at the ventricular surface. The arrow points to an M phase cell that is not coupled to the cluster. Scale bar, 10 μm.
A direct way to determine whether M phase cells were members of clusters would be to fill cells in M phase with biocytin. We were, however, unable to directly patch clamp cells that were in M phase. Recent calcium imaging experiments (D. F. Owens and A. R. Kriegstein, unpublished observations), however, show that mitotic cells often display transients in calcium concentration, and these transients do not spread into surrounding cells. Calcium should easily pass through gap junction channels; therefore, consistent with the current biocytin and DAPI double-labeling experiments, most if not all cells in M phase are not members of clusters.
Clusters contain radial glial cells
In most clusters, a single process extends from the top of the cluster into the IZ and often branches into several processes that project through the CP to the pial surface. In 38 of 45 (84.4%) clusters, a single fiber extended from the cluster through the IZ. Clusters lacking a process contained an average of 25 cells whereas those clusters with a process averaged 30.22 cells. To determine whether these processes were coming from either neural precursors or radial glial cells, we performed double fluorescent-labeling experiments on explants from E16 mice. For these experiments, the monoclonal antibody RAT 401 that has been shown to label radial glia in mouse cortex (Alvarez-Buylla et al., 1987; Sherman et al., 1992) was used in combination with a fluorescent-labeling protocol for intracellularly injected biocytin. As shown in Figure 3, Aand B, processes extending from clusters into the IZ are labeled with RAT 401. In fact, all processes that extended from clusters in the VZ into the CP were labeled with RAT 401 (n = 7). Thus, clusters in the VZ are organized around single or very few radial glial cells. Furthermore, because all biocytin-labeled processes extending into the IZ were positive for RAT 401, migrating neurons that may still be within the VZ and have leading processes extending into the IZ are not coupled to clusters.
Clusters do not contain postmitotic neurons
A postmitotic population of cells in the VZ expresses antigen for the monoclonal antibody TUJ (Menezes and Luskin, 1994). This population is believed to represent a population of postmitotic, radially migrating neurons within the proliferative zone (Menezes and Luskin, 1994). We used double labeling to determine whether this population of cells is coupled to clusters. As shown in Figure 3, TUJ-labeled cells immediately adjacent to clusters were not coupled to cells within clusters (n = 5). This result, together with the observation that cells in the IZ are not coupled to clusters, suggests that clusters may not contain postmitotic neurons.
Coupling is influenced by cell cycle phase and stage of neurogenesis
To determine whether coupling in clusters changed through the course of the cell cycle, we compared the BrDU index determined for clusters with the BrDU index determined for the population of VZ cells. If the BrDU index for clusters is greater than the index for the population, then there is an increased coupling into clusters in that particular phase of the cell cycle, and conversely, if the BrDU index for clusters is less than that for the population, then there is a decrease in coupling in that phase of the cell cycle. The BrDU index for the population nearly doubles between the 4 and 8 hr survival times, a result consistent with the doubling of cells after division. The BrDU index for clusters, however, remains similar between 4 and 8 hr (Fig. 4). At 8 hr the difference between the cluster index and the population index is significantly different (**p < 0.01; n = 17). The decreased BrDU index in the clusters relative to that in the population at the 8 hr survival time indicates that many cells in G1 phase are not coupled to clusters.
Fig. 4.
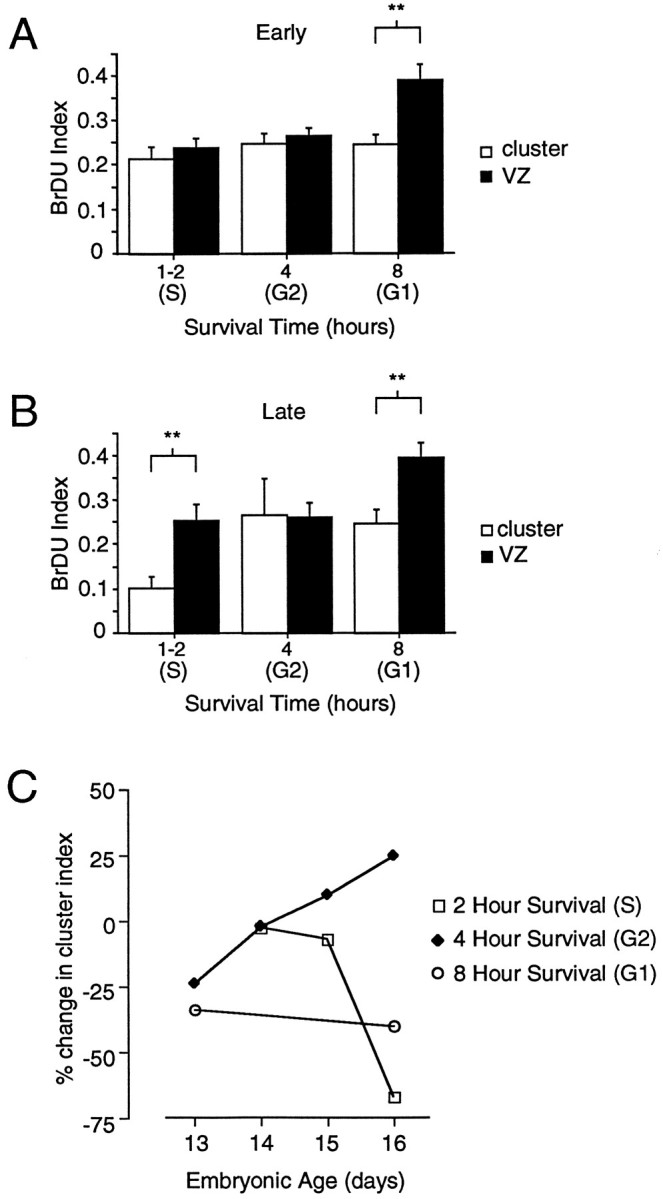
Coupling changes throughout the cell cycle and the course of neurogenesis. A, A bar graph comparing the BrDU indices for cells in clusters with the indices for the VZ population. The BrDU index for a cluster and that for the VZ population were significantly different at the 8 hr survival time or during G1 (Tukey, **p < 0.01). Omnibus ANOVA comparing the VZ index with the cluster index across all times was significant at p < 0.01 (E13–E18).B, In late neurogenesis (E16–E18), there is a significant difference between the VZ and cluster indices at both 1–2 hr (primarily S phase cells) and 8 hr (G1 phase cells) (Tukey, **p < 0.01). C, A summary of the differences in BrDU indices between cells in clusters and cells in the VZ population. Unlike the analyses in A andB that show the means and SEM of the BrDU index determined separately for each cluster, the percentage differences reported in C are for the percentage of BrDU-labeled cells determined for cells in all clusters pooled together. The difference index indicates the fraction of BrDU cells in the population that cannot be accounted for in clusters in early and late neurogenesis for three phases of the cell cycle.
In addition to the difference in BrDU indices at 8 hr, there was a significant difference between the cluster and VZ indices for the 1–2 hr survival time or S phase (*p < 0.05). Unlike the difference at 8 hr, however, the difference at 2 hr was only evident in latter stages of neurogenesis. One to two hours after BrDU injection in E16–18 embryos, ∼25% of the proliferative population in the VZ is labeled with BrDU, whereas BrDU labeling within clusters was only ∼10%. These results indicate that in late neurogenesis less than one-half of the cells in S phase are coupled into clusters.
Figure 4C shows a plot of the differences between the cluster BrDU index and population BrDU index across different days of neurogenesis for the three survival times corresponding to G1, late S/G2, and S phases (8, 4, and 1–2 hr survival times, respectively). A negative difference indicates that there are fewer cells represented in clusters than in the population. There are fewer G1 cells in clusters than in the population at both E13 and E16. Cells in S are initially equally represented in clusters and in the population; however, by E16 there are fewer cells in S within clusters than there are in the population. Cells in late S/G2, in contrast, are equally represented in clusters and within the VZ population at E14 but by E16 are actually enriched in clusters relative to the VZ population. The change in coupling in later neurogenesis is consistent with the location and change over time in the number of uncoupled cells labeled with biocytin. Cells that are not coupled to clusters in the VZ are most frequently filled in the upper one-half of the VZ, the same region in which many G1 and S phase cells are located. Similarly, there is an overall increase in the incidence of uncoupled cells in the VZ in late neurogenesis (LoTurco and Kriegstein, 1991).
Uncoupling decreases the number of precursors that enter S phase
During later stages of neurogenesis in the neocortex, the G1 phase of the cell cycle increases significantly in length, and an increasing fraction of cells exits the cell cycle (Takahashi et al., 1995). Because we found that there was a decrease in the percentage of cells in clusters in S phase in later stages of neurogenesis (Fig. 4C), we hypothesized that uncoupling may decrease the probability that a cell enters S phase. To test this hypothesis, we conducted experiments in which explants of E16 cortex were incubated for 5 hr in either halothane (1 mm) or octanol (1 mm). Both halothane and octanol have been shown to uncouple clusters in the VZ, as measured by both dye spread and an increase in membrane resistance (LoTurco and Kriegstein, 1991;Mienville et al., 1994). To determine whether these concentrations of halothane or octanol could have nonspecific effects on the cell cycle, we also incubated slices of P3 cerebellum. EGL cells in the cerebellum are a cycling population of neural precursors that are not coupled together by gap junction channels, as measured by injections either of Lucifer yellow (data not shown) or of biocytin (Rossi and Slater, 1993). We reasoned that if the effects of halothane and octanol were specific to gap junction coupling, then uncoupled cycling cells should be insensitive to halothane and octanol. Figure5 shows the results from these experiments. Incubation of cortical explants with either octanol or halothane decreased the number of cells that were in S phase (halothane by 22% and octanol by 43%). In contrast, neither uncoupling agent had an effect on the percentage of cells that were in S phase in the EGL. In addition, the BrDU indices for cells in the SVZ, which similar to EGL cells are not coupled, were not significantly different between control or halothane- or octanol-treated explants (data not shown). Together, these results indicate that coupling between cells in the VZ increases the probability that cells enter S phase.
Fig. 5.
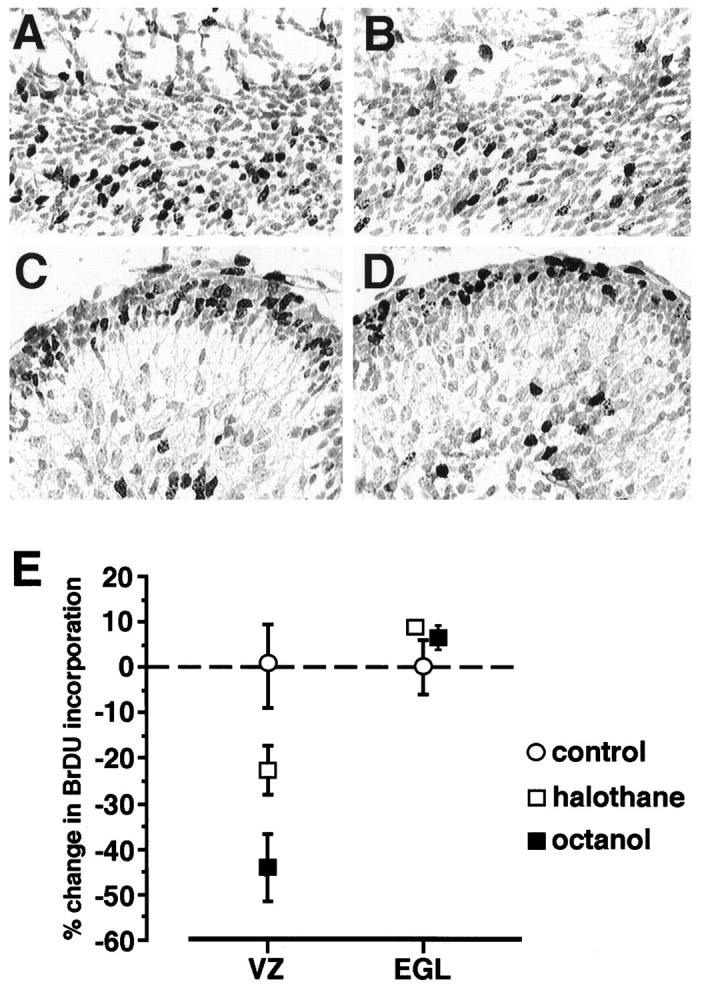
Pharmacological blockade of coupling decreases the number of cells in S phase. A, BrDU labeling in an explant of E16 dorsal cortex. The explant was incubated for 4 hr in ACSF, 95% O2/5% CO2, and then pulsed for 1 hr with 5 μm BrDU. B, BrDU labeling in an explant of cortex treated with 1 mm octanol.C, D, BrDU labeling in explants of cerebellum incubated for 4 hr and then pulsed with BrDU. The tissue inC was incubated in ACSF, and the tissue inD was incubated with ACSF and 1 mm octanol.E, Means and SEM showing the effects of octanol and halothane (1 mm) on the number of cells in S phase for explants of both neocortex and cerebellum. The uncoupling agents decreased the number of S phase cells in the VZ but not in the EGL, where cells are not coupled by gap junction channels.
DISCUSSION
As precursors progress through the cell cycle, they couple into clusters in S, remain coupled through G2, uncouple in M, and recouple through G1. In early neurogenesis the recoupling is complete by the next S phase; however, in later neurogenesis recoupling is not complete until G2. In addition, if VZ cells do not reenter S (i.e., either cells migrate into the IZ, or TUJ-labeled cells remain within in the VZ), then they do not rejoin clusters. VZ clusters also contain radial glia in addition to precursors in the cell cycle (Fig.6).
Fig. 6.
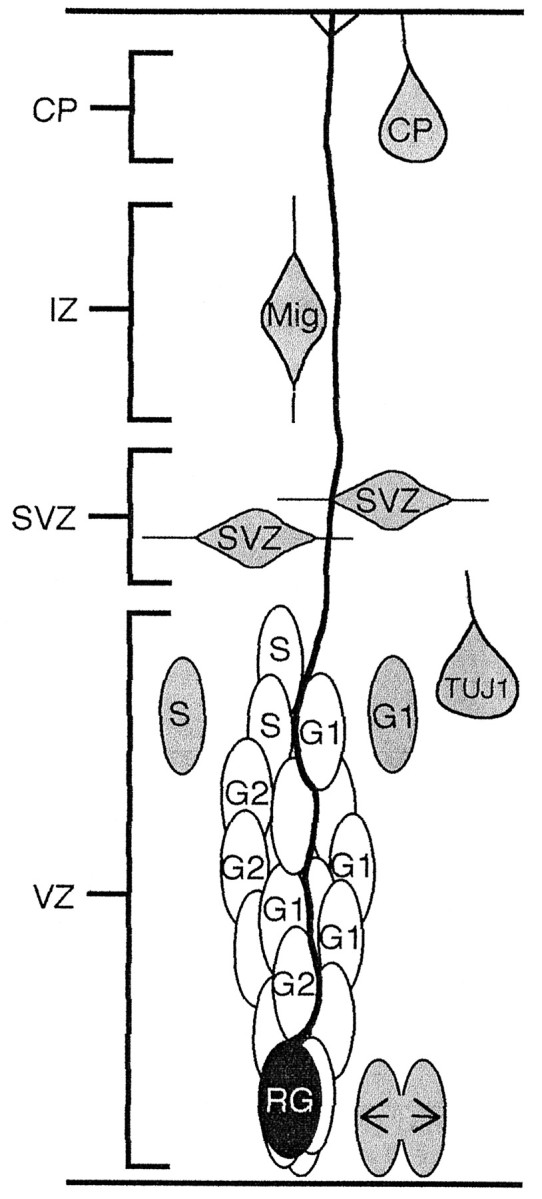
Diagram summary depicting the composition of clusters in the VZ. Clusters are organized around radial glial (RG) fibers and contain cells in G1, S, and G2. Shaded cells are not members of VZ clusters; these include cells in M phase (arrows), postmitotic neurons (TUJ1), migrating neurons (Mig), SVZ cells, and some cells in S and G1phases of the cell cycle.
Coupling through cortical development
Coupling has been described for neocortical neurons in later stages of development (Gutnick and Price, 1981; Yuste et al., 1995). In the early postnatal period in rats, coactive domains of neocortical neurons have been shown to be formed by gap junction coupling, and these domains may function in activity-dependent circuit formation (Yuste et al., 1995). Because our results with biocytin fail to show any coupling between either migrating neurons in the IZ or neurons within the embryonic CP, the coupling in later cortical development must result from neurons coupling after their migration into the CP. The pattern of coupling and uncoupling between precursors in the VZ and then later between neurons in cortical layers is consistent with the recently described changes in the pattern of connexin expression through cortical development (Nadarajah et al., 1997).
Coupling between radial glia and neural precursors
Our results show that clusters in the VZ contain both radial glial cells as well as neural precursors. Most clusters have long processes that extend out of the VZ and to the pial surface. These processes stain positively for the radial glial cell marker RAT 401. Radial glial cells provide a scaffolding for neurons migrating out of the VZ (Rakic, 1988; Gasser and Hatten, 1990; Hatten, 1990), and it has been suggested that clusters of ontogenetically related neurons migrate out of the VZ along the same radial glial fibers (Rakic, 1988). Our results indicate that before migration cortical precursors in the VZ directly communicate with radial glia through gap junction channels. Moreover, clusters seem to be organized around single radial glial cells, raising the possibility that radial glial cells, in addition to directing migration, could also serve to propagate signals from the intermediate zone, marginal zone, or CP back to a restricted set of precursor cells in the VZ.
Coupling and implications for cell fate
Both lineage analysis (Reid et al., 1995) and imaging experiments (Fishell et al., 1993) indicate that cortical precursors in the VZ can migrate tangentially through the VZ (Fishell et al., 1993). The cells within a clone that migrate out of the VZ along a similar radial path have similar fates (Parnavelas et al., 1991; Reid et al., 1995), although those that migrate tangentially generally have fates different from the radially migrating cells in a clone. This pattern suggests that there may be spatially localized signals within the VZ that differentially influence the fates of cells. Such spatially restricted signals have yet to be identified within the VZ; however, cell clustering provides a mechanism in which cell interactions are tightly restricted to small regions within the VZ. In addition, we have shown that many cells in M and G1 have uncoupled from clusters. Perhaps uncoupled precursor cells migrate tangentially through the VZ and then join a new VZ cluster in a different location by recoupling during S and G2 phases of their next cell cycle.
Cell cycle and cell coupling
Our data indicate that coupling into clusters changes through the course of the cell cycle. Coupling is high in G2 and low in G1 throughout neurogenesis and is high in S in early neurogenesis but low in late neurogenesis. Connexin 26 has been shown to be regulated through the cell cycle in mammary epithelial cells (Lee et al., 1992). Connexin 26 mRNA levels in these cells are highest in late S and G2 and are lowest in G1. Connexin 43 expression, on the other hand, does not change through the cell cycle. In addition, cycling cells in the regenerating tracheal epithelium of the lung are coupled through S and G2 and then uncouple in M (Gordon et al., 1982).
The regulation of coupling through the cell cycle in diverse cell types suggests that connexins may generally regulate cell division. In transformed cells, transfection of connexins (Eghbali et al., 1991;Mehta et al., 1991; Zhu et al., 1991) has been shown to slow proliferation, suggesting that gap junctions may be tumor suppressor genes. Similarly, a subtractive hybridization approach has revealed that connexin 26 is downregulated in mammary tumor cells (Lee et al., 1992). We find that pharmacological blockade of gap junction coupling decreases the number of cells that enter S phase and propose that, in the VZ, coupling between cells positively influences the entry of cells into S phase.
During neurogenesis in the VZ, G1 is the only phase of the cell cycle that changes appreciably, approximately tripling in length from early to late neurogenesis (Takahashi et al., 1995). We show here that coupling in G1 and S phases decreases through neurogenesis and that pharmacologically uncoupling cells decreases the number of cells that enter S phase. One interpretation of our results is that uncoupled cells have a reduced probability of entering S phase. As a result, G1 phase would lengthen as coupling decreases, and there would be more uncoupled cells in S phase in late neurogenesis. Clonally related cells have been shown recently to form cell clusters in the VZ, and these clusters, based on their location in the VZ, may have synchronized cell cycles (Cai et al., 1997). Whereas VZ clusters formed by gap junction coupling are much larger than clonal clusters (∼5- to 10-fold more cells), coupling between adjacent cells in a cluster of cells could facilitate synchronized entry into different phases of the cell cycle. Perhaps, just as coupling in the more mature nervous system synchronizes the electrophysiological behavior of cells, coupling between neighboring cells in the VZ could synchronize the cell cycle of neocortical precursors.
Footnotes
This work was supported by National Institutes of Health Grants MH56524 to J.J.L. and NS21223 to A.R.K., by Human Frontier Science Program Grant RG-53195B, and by a grant from the Klingenstein Foundation to J.J.L. We thank Dr. Leslie Boyce for contributing to the early stages of this study.
Correspondence should be addressed to Dr. Joe LoTurco, Department of Physiology and Neurobiology, University of Connecticut, U-156, Storrs, CT 06269-4156.
REFERENCES
- 1.Alvarez-Buylla A, Buskirk D, Nottebohm F. Monoclonal antibody reveals radial glia in adult avian brain. J Comp Neurol. 1987;264:159–170. doi: 10.1002/cne.902640203. [DOI] [PubMed] [Google Scholar]
- 2.Antonopoulos J, Pappas I, Parnavelas J. Activation of the GABAA receptor inhibits the proliferative effects of bFGF in cortical progenitor cells. Eur J Neurosci. 1997;9:291–298. doi: 10.1111/j.1460-9568.1997.tb01399.x. [DOI] [PubMed] [Google Scholar]
- 3.Blanton M, LoTurco J, Kriegstein A. Whole cell recording from neuron in slices of reptilian and mammalian cerebral cortex. J Neurosci Methods. 1989;30:203–210. doi: 10.1016/0165-0270(89)90131-3. [DOI] [PubMed] [Google Scholar]
- 4.Boulder Committee. Embryonic vertebrate central nervous system: revised terminology. Anat Rec. 1970;166:257–261. doi: 10.1002/ar.1091660214. [DOI] [PubMed] [Google Scholar]
- 5.Cai L, Hayes N, Nowakowski R. Synchrony of clonal cell proliferation and contiguity of clonally related cells: production of mosaicism in the ventricular zone of developing mouse neocortex. J Neurosci. 1997;17:2088–2100. doi: 10.1523/JNEUROSCI.17-06-02088.1997. [DOI] [PMC free article] [PubMed] [Google Scholar]
- 6.Dermietzel R. Molecular diversity and plasticity of gap junctions in the nervous system. In: Spray D, Dermietzel R, editors. Gap junctions in the nervous system. Chapman and Hall; New York: 1996. pp. 13–38. [Google Scholar]
- 7.Dermietzel R, Traub O, Hwang T, Beyer E, Bennett M, Spray D. Differential expression of three gap junction proteins in developing and mature brain tissues. Proc Natl Acad Sci USA. 1989;86:10148–10152. doi: 10.1073/pnas.86.24.10148. [DOI] [PMC free article] [PubMed] [Google Scholar]
- 8.Eghbali B, Kessler J, Reid L, Roy C, Spray D. Involvement of gap junctions in tumorigenesis: transfection of tumor cells with connexin 32 cDNA retards growth in vivo. Proc Natl Acad Sci USA. 1991;88:10701–10705. doi: 10.1073/pnas.88.23.10701. [DOI] [PMC free article] [PubMed] [Google Scholar]
- 9.Fishell G, Mason C, Hatten M. Dispersion of neural progenitors within the germinal zones of the forebrain. Nature. 1993;362:636–638. doi: 10.1038/362636a0. [DOI] [PubMed] [Google Scholar]
- 10.Gasser U, Hatten M. Central nervous system neurons migrate on astroglial fibers from heterotypic brain regions in vitro. Proc Natl Acad Sci USA. 1990;87:4543–4547. doi: 10.1073/pnas.87.12.4543. [DOI] [PMC free article] [PubMed] [Google Scholar]
- 11.Ghosh A, Greenberg M. Distinct roles for bFGF and NT-3 in the regulation of cortical neurogenesis. Neuron. 1995;15:89–103. doi: 10.1016/0896-6273(95)90067-5. [DOI] [PubMed] [Google Scholar]
- 12.Gordon R, Lane B, Marin M. Regeneration of rat tracheal epithelium: changes in gap junctions during specific phases of the cell cycle. Exp Lung Res. 1982;3:47–56. doi: 10.3109/01902148209115815. [DOI] [PubMed] [Google Scholar]
- 13.Guthrie S, Gilula N. Gap junctional communication and development. Trends Neurosci. 1989;12:12–16. doi: 10.1016/0166-2236(89)90150-1. [DOI] [PubMed] [Google Scholar]
- 14.Gutnick M, Price D. Dye coupling and possible electrotonic coupling in the guinea pig neocortical slice. Science. 1981;211:67–70. doi: 10.1126/science.7444449. [DOI] [PubMed] [Google Scholar]
- 15.Hatten M. Riding the glial monorail: a common mechanism for glial-guided neuronal migration. Trends Neurosci. 1990;13:179–184. doi: 10.1016/0166-2236(90)90044-b. [DOI] [PubMed] [Google Scholar]
- 16.Lee S, Tomasetto C, Paul D, Keyomarsi K, Sager R. Transcriptional downregulation of gap-junction proteins blocks junctional communication in human mammary tumor cell lines. J Cell Biol. 1992;118:1213–1221. doi: 10.1083/jcb.118.5.1213. [DOI] [PMC free article] [PubMed] [Google Scholar]
- 17.LoTurco J, Kriegstein A. Clusters of coupled neuroblasts in embryonic neocortex. Science. 1991;252:563–566. doi: 10.1126/science.1850552. [DOI] [PubMed] [Google Scholar]
- 18.LoTurco J, Owens D, Heat M, Davis M, Kriegstein A. GABA and glutamate depolarize cortical progenitor cells and inhibit DNA synthesis. Neuron. 1995;15:1287–1298. doi: 10.1016/0896-6273(95)90008-x. [DOI] [PubMed] [Google Scholar]
- 19.Mehta P, Hotz-Wagenblatt A, Rose B, Shalloway D, Loewenstein W. Incorporation of the gene for a cell–cell channel protein into transformed cells leads to normalization of growth. J Membr Biol. 1991;124:207–225. doi: 10.1007/BF01994355. [DOI] [PubMed] [Google Scholar]
- 20.Menezes J, Luskin M. Expression of neuron-specific tubulin defines a novel population in the proliferative layers of the developing telencephalon. J Neurosci. 1994;14:5399–5416. doi: 10.1523/JNEUROSCI.14-09-05399.1994. [DOI] [PMC free article] [PubMed] [Google Scholar]
- 21.Mienville JM, Lange GD, Barker JL. Reciprocal expression of cell–cell coupling and voltage dependent sodium current during embryogenesis of rat telencephalon. Dev Brain Res. 1994;77:89–95. doi: 10.1016/0165-3806(94)90216-x. [DOI] [PubMed] [Google Scholar]
- 22.Nadarajah B, Jones A, Evans W, Parnavelas J. Differential expression of connexins during neocortical development and neuronal circuit formation. J Neurosci. 1997;17:3096–3111. doi: 10.1523/JNEUROSCI.17-09-03096.1997. [DOI] [PMC free article] [PubMed] [Google Scholar]
- 23.Parnavelas J, Barfield J, Franke E, Luskin M. Separate progenitor cells give rise to pyramidal and nonpyramidal neurons in the rat telencephalon. Cereb Cortex. 1991;1:1047–3211. doi: 10.1093/cercor/1.6.463. [DOI] [PubMed] [Google Scholar]
- 24.Penn A, Wong R, Schatz C. Neuronal coupling in the developing mammalian retina. J Neurosci. 1994;14:3805–3815. doi: 10.1523/JNEUROSCI.14-06-03805.1994. [DOI] [PMC free article] [PubMed] [Google Scholar]
- 25.Rakic P. Specification of cerebral cortical areas. Science. 1988;241:170–176. doi: 10.1126/science.3291116. [DOI] [PubMed] [Google Scholar]
- 26.Reid C, Liang I, Walsh C. Systematic widespread clonal organization in cerebral cortex. Neuron. 1995;15:299–310. doi: 10.1016/0896-6273(95)90035-7. [DOI] [PubMed] [Google Scholar]
- 27.Rossi DJ, Slater NT. The developmental onset of NMDA receptor-channel activity during neuronal migration. Neuropharmacology. 1993;32:1239–1248. doi: 10.1016/0028-3908(93)90018-x. [DOI] [PubMed] [Google Scholar]
- 28.Schambra U, Lauder J, Silver J. Atlas of the prenatal mouse brain. Academic; San Diego: 1992. [DOI] [PubMed] [Google Scholar]
- 29.Sherman G, Rosen G, Stone L, Press D, Galaburda A. The organization of radial glial fibers in spontaneous neocortical ectopias of newborn New Zealand Black mice. Dev Brain Res. 1992;67:279–283. doi: 10.1016/0165-3806(92)90228-o. [DOI] [PubMed] [Google Scholar]
- 30.Takahashi T, Nowakowski R, Caviness V. Cell cycle parameters and patterns of nuclear movement in the neocortical proliferative zone of the fetal mouse. J Neurosci. 1993;13:820–833. doi: 10.1523/JNEUROSCI.13-02-00820.1993. [DOI] [PMC free article] [PubMed] [Google Scholar]
- 31.Takahashi T, Nowakowski R, Caviness V. The cell cycle of the pseudostratified ventricular epithelium of the embryonic murine cerebral wall. J Neurosci. 1995;15:6046–6057. doi: 10.1523/JNEUROSCI.15-09-06046.1995. [DOI] [PMC free article] [PubMed] [Google Scholar]
- 32.Yuste R, Peinado A, Katz L. Neuronal domains in developing neocortex. Science. 1992;257:665–669. doi: 10.1126/science.1496379. [DOI] [PubMed] [Google Scholar]
- 33.Yuste R, Nelson D, Rubin W, Katz L. Neuronal domains in developing neocortex: mechanisms of coactivation. Neuron. 1995;14:7–17. doi: 10.1016/0896-6273(95)90236-8. [DOI] [PubMed] [Google Scholar]
- 34.Zhu D, Caveney S, Kidder G, Naus C. Transfection of C6 glioma cells with connexin 43 cDNA: analysis of expression, intercellular coupling, and cell proliferation. Proc Natl Acad Sci USA. 1991;88:1883–1887. doi: 10.1073/pnas.88.5.1883. [DOI] [PMC free article] [PubMed] [Google Scholar]