

Abstract
Using functional magnetic resonance imaging (fMRI) and cortical unfolding techniques, we analyzed the retinotopy, motion sensitivity, and functional organization of human area V3A. These data were compared with data from additional human cortical visual areas, including V1, V2, V3/VP, V4v, and MT (V5). Human V3A has a retinotopy that is similar to that reported previously in macaque: (1) it has a distinctive, continuous map of the contralateral hemifield immediately anterior to area V3, including a unique retinotopic representation of the upper visual field in superior occipital cortex; (2) in some cases the V3A foveal representation is displaced from and superior to the confluent foveal representations of V1, V2, V3, and VP; and (3) inferred receptive fields are significantly larger in human V3A, compared with those in more posterior areas such as V1. However, in other aspects human V3A appears quite different from its macaque counterpart: human V3A is relatively motion-selective, whereas human V3 is less so. In macaque, the situation is qualitatively reversed: V3 is reported to be prominently motion-selective, whereas V3A is less so. As in human and macaque MT, the contrast sensitivity appears quite high in human areas V3 and V3A.
Keywords: fMRI, V3A, retinotopy, motion selectivity, visual cortex, MT/V5, human, primate
After cortical visual areas V3 and V4 were identified and named in macaque monkeys, another region was discovered between them and named “V3 accessory” (V3A) (Van Essen and Zeki, 1978; Zeki, 1978a,b). V3A is now regarded as a cortical area that is entirely independent and distinct from its similarly named neighbor, V3, in terms of its retinotopy (Van Essen and Zeki, 1978;Zeki, 1978a,b; Gattass et al., 1988), its histology (Burkhalter et al., 1986; Felleman and Van Essen, 1987; DeYoe et al., 1990; Girard et al., 1991; Tootell and Taylor, 1995; Felleman et al., 1997), its functional properties (Felleman and Van Essen, 1987; Gaska et al., 1987, 1988) and its connections (for review, see Gaska et al., 1988; Felleman and Van Essen, 1991). Thus the name V3A is misleading, but it is retained here because of historical convention.
V3A occupies a position in the hierarchy of cortical visual areas that is intermediate between lower tier areas (e.g., V1) and higher tier areas (e.g., inferotemporal cortex). V3A shares connections with areas in both parietal and temporal cortex (for review, see Gaska et al., 1988; Felleman and Van Essen, 1991) Unlike other retinotopic areas in superior occipital cortex (Van Essen and Zeki, 1978; Gattass et al., 1988), macaque V3A has a complete representation of lower and upper visual fields. However, further details of the retinotopy within V3A remain unclear (Van Essen and Zeki, 1978; Zeki, 1978b;Gattass et al., 1988; Van Essen et al., 1990; Felleman et al., 1997).
Although there are few single unit reports from this region, some interesting properties have been reported (Gaska et al., 1987; Galletti and Battaglini, 1989). Single units in area V3 are reported to be commonly motion- and direction-selective (Felleman and Van Essen, 1987;Gegenfurtner et al., 1994) (but see Zeki, 1978b), presumably reflecting the distinctive input from layer 4B of primary visual cortex (Lund and Boothe, 1975; Burkhalter et al., 1986; Van Essen et al., 1986). However, such motion and direction selectivity is apparently much less prevalent in V3A (Zeki, 1978b; Gaska et al., 1988; Galletti et al., 1990) (Joris et al., 1997). Another notable feature of this general region is the unique distinction in connections and functional properties between the complementary quarter-field representations in macaque areas V3 versus VP (Burkhalter et al., 1986).
The intriguing but incomplete nature of the data on V3A and neighboring areas suggested that follow-up studies would be worthwhile. These areas also were experimentally appealing because the borders of these areas can be defined by retinotopic criteria, eliminating ambiguity about where one is sampling functional activity. Furthermore, V3A and some of its neighbors occupy intermediate levels in the visual processing hierarchy—thus study of these areas could clarify the nature of processing at higher levels while being tractable enough to activate with relatively simple visual stimuli, as in lower tier areas.
Ideally, such information might be obtained from corresponding areas in human visual cortex to test and extend previous information from the macaque. Although such experiments necessarily are limited by the restricted nature of noninvasive techniques available for use in humans, the recently developed functional magnetic resonance imaging (fMRI) technique could furnish maps of the cortical topography in adequate detail.
Do such corresponding areas actually exist in human visual cortex? Retinotopic imaging studies have revealed apparent human homologs of retinotopic macaque areas V1, V2, V3, and VP (Schneider et al., 1993;DeYoe et al., 1994, 1996; Sereno et al., 1995; Shipp et al., 1995;Tootell et al., 1995a, 1996b; Engel et al., 1997). However, a retinotopically differentiated human V3A has been suggested only in a preliminary way (Tootell et al., 1995a,b, 1996a; DeYoe et al., 1996). Furthermore, very little is known about the functional properties of human V3A or surrounding cortical areas.
Here we were able to confirm the presence of a human visual cortical area retinotopically similar to macaque V3A, using fMRI of intrinsic hemodynamics (Bandettini et al., 1992; Kwong et al., 1992; Ogawa et al., 1992) combined with phase-encoded retinotopic analysis (DeYoe et al., 1994, 1996; Engel et al., 1994, 1997; Sereno et al., 1995) (see below), and using novel “thin” stimuli (Koch and Tootell, 1996;Tootell et al., 1996a,b) and cortical surface flattening (Dale and Sereno, 1993; Sereno et al., 1995; DeYoe et al., 1996; Tootell et al., 1996b; Engel et al., 1997). By comparing the borders of this and surrounding areas to functional activation via additional tests, we were able to characterize V3A and related cortical areas for other functional dimensions such as receptive field size, motion, and contrast sensitivity.
Some of the data has been presented previously in preliminary form (Tootell et al., 1996a,b).
MATERIALS AND METHODS
General procedures. Experimental details are similar to those described elsewhere (Sereno et al., 1995; Tootell et al., 1995a,b, 1996a,b), with the specific modifications described below. Normal human subjects were scanned using a 1.5 tesla General Electric magnetic resonance imager, using echo-planar imaging (Advanced NMR, Wilmington, MA). Scans were acquired using a bilateral quadrature receive-only surface coil, molded for relatively uniform sensitivity throughout occipital cortex, including posterior portions of temporal and parietal cortex.
A typical scanning session began with a sagittal localizer, followed by one or more scans used as input to an on-line optimization procedure for calculating shim coil settings (linear x, y, andz and quadratic z spherical harmonic shims). After shim coils were adjusted, a series of echo-planar scans was collected (16 slices, 4 mm thick, no gap). Slices were oriented in an oblique axial plane, approximately perpendicular to the calcarine fissure. This slice prescription was used for all subsequent scans during that scanning session. The first echo-planar scan was a T1-weighted inversion recovery scan (TE = 40 msec, TI = 1050 msec, TR = 20 sec, NEX = 2, matrix = 128 × 64) used as an anatomical localizer to align the subsequent functional scans with the cortical surface.
This was followed by a series (typically 6–12) of asymmetric spin echo (ASE) functional scans (TE = 70 msec, offset = −25 msec, TR = 2000 or 4000 msec, matrix = 128 × 64; in-plane resolution, 3.1 × 3.1 mm). Each functional scan lasted either 4 min 16 sec or 8 min 32 sec (TR = 2 or 4 sec, respectively) and consisted of 128 images/slice, for a total of 2048 images per scan. Functional data generated specifically for this study include 138 scans of the cortical retinotopy, 201 scans of motion selectivity, and 78 scans devoted to additional and related parameters, from 21 subjects. The total number of functional images acquired in this study exceeds 800,000.
Each scanning session typically lasted 1.5–2.5 hr. Sessions were terminated prematurely in the event of discomfort or sleepiness. Informed written consent was obtained for each subject before the scanning session, and all procedures were approved by Massachusetts General Hospital Human Studies Protocols 90-7227 and 96-7464.
Subjects normally used an individually molded bite bar (adjustable plastic frame and mount coated with a thermoplastic dental impression compound) to stabilize head motion. The bite bar typically reduced skull motion to <1 mm during a given scan and essentially eliminated cumulative head drift during the course of the scanning session. Two subjects (LK and BK) sometimes were scanned without the bite bar; in these atypical scan sessions, periodic T1 anatomical scans were interposed between every third or fourth functional scan to track and correct three-dimensional head registration during the scan session. Two motion correction algorithms (Woods et al., 1992; Jiang et al., 1995; Friston et al., 1996) were available for tracking and correcting for head motion during and between scans in the functional MR images. However, routine use of the bite bar made it unnecessary to use these motion correction algorithms on the data set analyzed here.
Visual stimuli. Visual stimuli were generated in real time on a Silicon Graphics Onyx computer (8 CPUs) with GL graphics library functions. A subsample (640 × 480 pixels) of the high-resolution RGB video output signal was converted to a 60 Hz interlaced composite S-video signal, via Silicon Graphics broadcast video option board. These outputs drove a Sharp model 2000 color liquid crystal display (LCD) projector that projected a small image (∼18 × 12 cm) onto a translucent rear projection screen (Day-tex) located just below the subject’s chin. Subjects viewed the screen by looking up (i.e., rostral, while lying prone) onto a large adjustable mirror, angled ∼45° to the subject’s normal line of sight (see Fig.1). This arrangement provided visual stimuli with a field of view of ∼48 × 36°, at an effective distance of 20–22 cm from the viewer’s eyes. If necessary, subjects were corrected for optimal accommodation on the screen display, using either contact lenses or magnet-compatible glasses. Because subjects were typically young, the relatively close screen distance did not pose any special accommodative problems.
Fig. 1.

Schematic diagram of stimulus presentation and patient position during scanning. The subject lies prone, staring at a mirror, oriented 45° to the subject’s normal line of sight. This would give a view out the bore of the magnet, i.e., toward the subject’s feet, which are mildly spread to furnish a clear light path. Instead, the subject sees a translucent rear projection screen positioned in the bore of the magnet at the level of the subject’s neck, occluding the view that otherwise would be seen down the bore of the magnet. The visual stimulus is programmed initially on a computer and drives an LCD projector. The LCD projector (minus a commercially supplied lens) is positioned just outside the magnet room, with a substitute lens (producing a near-collimated beam of light rather than the normal diverging lens) positioned in the light path just inside the magnet room. The light is projected through the bore of the magnet, ultimately focused on the rear projection screen described above. The rear projection screen is attached to the roof of the bore with Velcro so that its position (and image focus) can be fine-adjusted by the subject. This arrangement furnishes a wide field of view and a clarity equal to the spatial resolution of the projector (640 × 480 pixels here, but 1200 × 1080 is now commercially available).
Except for the foveal-activating stimulus described below, all stimuli were presented within a circular aperture 30° in diameter. Phase-encoded stimuli (e.g., retinotopic; see below) consisted of flickering black-and-white checks formed into either a ring- or ray-shaped configuration. The check size was scaled such that it retained a near-constant polar angle with variations in eccentricity. Thus check size became smaller toward the center of the stimulus and larger farther away, on a logarithmic scale. Consistent with this, ring size and expansion speed (in the eccentricity stimulus) and the speed of local ray motion (in the polar angle stimulus) also varied near-logarithmically with variations in stimulus eccentricity. Finally, the phase-encoded retinotopic stimuli spared the central 0.75° diameter to avoid ambiguities caused by fixation instability.
Phase-encoded retinotopic stimuli were presented for eight cycles per scan, using a cycle time of 64 sec. Two condition stimulus comparisons (e.g., moving vs stationary stimuli) typically were presented for 16 sec/condition for either 8 or 16 cycles/scan (using TR values of 4 or 2 sec, respectively). Additional details of each stimulus are described below in the relevant Results section.
A small fixation point appeared at the center of all stimuli, and subjects were instructed to stare continuously at the fixation point throughout the scans. To confirm that eye fixation was adequate during the visual stimulation, we monitored eye movements with an eye movement monitor (Ober 2; sampling rate = 1000 Hz) during the MR scans in a related study using similar stimuli and an overlapping subject pool (Reppas et al., 1997). Such results confirmed that eye movements were not a problem in these studies. In addition, tests using large-field moving stimuli used radial (rather than planar) motion to minimize optokinetic nystagmus. Logically, many of the retinotopic results described below (e.g., discrete mapping of the foveal representation) could not have been obtained in the presence of significant eye drift or poor fixation.
The retinotopic experiments are described first. In a second set of experiments aimed at mapping motion selectivity, the stimulus extended throughout a circular region, 30° in diameter, for the whole scan (i.e., it did not vary retinotopically). This stimulus was similar to that used in earlier studies on motion selectivity (Tootell et al., 1995a,b) (rectangular rings surrounding the central fixation point, 0.5 cycles/degree; duty cycle = 0.2; thin white rings on a thicker black background, expanding/contracting in alternating 2 sec epochs at 7°/sec when moving). In the present study the stimulus usually was presented at low luminance contrast (∼1.5%), because this has been shown to produce more selective activation of certain motion-selective areas, including the middle temporal (MT) visual area as well as the superior occipital motion area (Tootell et al., 1995a; our unpublished observations).
We calibrated the luminance of this stimulus and the LCD projector with a Spectra photometer. The measurement and calculation of luminance contrast were based on the standard formula for luminance contrast (Lmax −Lmin/Lmax +Lmin). In this experiment, rectangular wave gratings were used rather than square or sine waves. The rectangular wave was used because it has a broader spatial frequency spectrum than either square or sine wave gratings, so it should activate more cells irrespective of their spatial frequency tuning. Thus, stimulus contrast was calculated without correction for the unequal duty cycle of rectangular wave grating. Because stimulus contrast was not varied within a scan and because steady-state differences in mean luminance did not produce significant variations in MR signal level over the range presented, this specification of contrast should be adequate for experimental replication and comparison with other results.
Data analysis. All data were archived onto 8 mm videocassette tapes and analyzed off-line. Analytic steps are similar to those described elsewhere (Sereno et al., 1995; Tootell et al., 1995a,b, 1996a,b).
Data could be screened for technical artifacts, such as head motion or baseline drift, by examining the raw image data. Baseline drift was typically quite minor, and scanner noise was typically ∼0.3% of average MR level within the volume covered by this coil.
All data were analyzed in flattened cortical format. Although rendering the fMRI data on flattened cortex does require extra effort, the flattened data format offers several advantages over conventional slice-based or three-dimensional formats: (1) because the retinotopy, area boundaries, and cortical maps are all fundamentally two-dimensional, these variables can be understood and analyzed most easily in the two-dimensional (unfolded) format; (2) no information is lost in the unfolded format—information about intrinsic gyral/sulcal location, standard Talairach coordinates from the folded surface, and the extent of flattened distortion at a given point on the cortical surface are all readily available; (3) fMRI activity acquired from an unlimited number of scans on subsequent days or months can be signal-averaged cumulatively or compared on the same cortical surface—something that is impossible in slices taken from different days or different slice slice prescriptions; (4) the flattened format disambiguates activity occurring on opposite banks of the same sulcus—activity that can appear misleadingly close or artifactually combined in the normal folded format and/or in standard Talairach coordinates.
Previous versions of the flattening procedure used here are described in Dale and Sereno (1993) and Sereno et al. (1995). It is conceptually similar to flattening procedures used by others (DeYoe et al., 1996;Drury et al., 1996; Engel et al., 1997). In these procedures, activity data are displayed on the reconstructed cortical surface from each individual. Therefore, for each subject a first step is to acquire the structural images used for reconstruction, using a high-resolution (128 slice, 1.0 cubic mm) inversion recovery-prepared spoiled grass anatomical scan (Siemens MP RAGE; TE = 3 msec, flip angle 10°) tuned to optimize the contrast between gray versus white matter in brain. This structural scan was acquired only once per subject (19 min scan time), in a head coil for full head coverage. From these three-dimensional data, image components caused by the skull were stripped off automatically by “shrink-wrapping” a stiff deformable template onto the brain images. Then the gray/white matter boundary was estimated for each hemisphere with a region-growing method. The result was tessellated to generate a surface (∼130,000 vertices) that was refined against the MRI data with a deformable template algorithm. Then it was inspected for topological defects (e.g., “handles”) and reconstructed without surface defects, if necessary.
The resulting surface was aligned manually with the functional scan by direct iterative comparisons in three orthogonal planes between the echo-planar imaging (EPI) inversion recovery scan (1.5 × 1.5 × 3–4 mm) and the high-resolution structural data set (1 × 1 × 1 mm) used to construct the cortical surface. This procedure allowed rotation, translation, and single-axis scaling. The three-dimensional functional data set (3.1 × 3.1 × 3–4 mm) was sampled with the cortical surface. By choosing a surface near the gray/white matter border, we effectively sampled activity near and below cortical layer 4 rather than near the surface where the macrovascular artifact is maximal. Thus we were able to assign activations more accurately to the correct bank of a sulcus. The lower resolution activation data were interpolated smoothly onto the high-resolution surface reconstruction (1 polygon, ∼1 × 1 mm). Then the surface was unfolded by reducing curvature while adding an additional local area-preserving term. For a completely flattened cortical surface, the inflated brain was cut along the calcarine fissure and just posterior to the sylvian fissure. The resulting surface portion was pushed onto a coronal plane in one step and unfurled on the plane. A relaxation algorithm was applied to minimize areal and linear distortion, weighted equally. The vertex update rule for flattening was further modified to include a shear-minimizing term, because maintaining only the original local area allows substantial distortion (e.g., rectangular and rhombic distortions of an original square).
As mentioned above, an unlimited number of functional scans can be added to a given subject’s cortical surface cumulatively, either by signal averaging of similar data or by comparison of different data sets on the same surface. In addition to furnishing more robust data, such surface-averaged retinotopic data were also more continuous, because a combination of data acquired from independently differing slice prescriptions also reduced aliasing artifacts between slices.
For two-condition comparisons, signed activation significance (p) values were computed on a voxel-by-voxel basis by using a comparison between the Fourier domain amplitude of the voxel time course at the stimulation frequency and the average amplitude of the response at other frequencies. Frequencies lower than three per scan (i.e., 0.0059 or 0.0118 Hz, typically because of minor head motion or baseline drift) were rejected. The phase of the signal was used to distinguish between positive- and negative-going inflections in the MR signal and to convert between phase and retinotopic location in phase-mapped retinotopic experiments.
The gain, threshold, phase delay, polarity, degree of filtering, and other graphic variables were defined quantitatively and displayed in one of several pseudocolor formats with the use of a menu-driven interface. For instance, with two alternating stimuli presented in stimulus periods of 32 sec and TR = 2 sec, the known hemodynamic delay (Bandettini et al., 1992; Boynton et al., 1996; Buckner et al., 1996) equals a phase delay of ∼79° for “positive” (first condition) activation and 259° for “negative” (second condition) activation. Thus maximal positive pseudocolor (here, red through white) would be set for 79°, etc. Another analytic variable, spatial filtering (nearest neighbor averaging), could be done either on the slice data or on the cortical surface maps. The cumulative spatial filtering in the flattened data amounted to ∼2.5–3.5 mm (depending on the experimental design), half-width at half-amplitude.
The significance values were not corrected for multiple comparisons. For two-dimensional (cortical surface) analysis guided by specific topographic predictions, the Bonferroni correction used in typical imaging studies (including many more potential voxels) is inappropriately conservative. We used a display threshold for minimum activation of p < 0.01 or less (e.g.,p < 0.001). Depending on the amount of signal averaging, the stimulus comparison, the scan sequence, the coil used, and the individual subject, signal maxima can range up top < 10−42. Because maximalf-values vary so much, we scaled the maximal pseudocolor value to match the maximal f-value in each image, rather than using a single rigid range inappropriate for most data sets.
The flattening procedure stores the two-dimensional distortion between the original topography and the flattened topography so that all topographical measurements could be corrected later, even if the flattened display contains some distortion. Final display distortion averaged ∼15% for both angle and area. The degree of local distortion (areal or angular) could be displayed in pseudocolor for each cortical surface.
In several of the experiments described below, multiple scans were acquired from the same stimuli in a given session for the purposes of signal averaging. In the course of our analysis, test–retest comparisons of these results were generated routinely. Although such comparisons depend on several variables (including the number of averages acquired, the robustness of the variables measured, variations among individuals, and coil/scanner/sequence sensitivity), comparisons of robust visual stimuli from single scans (128 images/slice) using our typical paradigms typically yielded correlation coefficients between 0.7 and 0.9, similar to those described by other fMRI groups doing similar experiments (DeYoe et al., 1994).
The boundaries of retinotopic cortical areas (V1, V2, V3, VP, V3A, and V4v) were defined on the cortical surface for each individual subject on the basis of phase-encoded retinotopy (DeYoe et al., 1994, 1996;Engel et al., 1994, 1997; Sereno et al., 1995) and subsequent calculation of field sign boundaries (Sereno et al., 1995). The phase-encoded retinotopy was generated by presenting each subject with two paired scans, each devoted to periodic stimulus variations (64 sec/cycle; 8 cycles/scan) in either stimulus eccentricity or polar angle (“ring” and “ray” stimuli, respectively). A fast Fourier transform (FFT) was performed on the time series of the resulting fMRI variations. In each voxel the phase of the FFT revealed the cortical location of the retinotopic representation, in polar coordinates (values of eccentricity from one scan and polar angle from the second scan). The magnitude of the FFT in each voxel reflected the level of retinotopic specificity. Note that low retinotopic specificity could be produced either by a lackof response to the stimulus or to an equal response to all retinotopic locations of the stimulus.
The visual field “sign,” or polarity, of the visual field representation is either similar to the actual visual field geometry or mirror symmetrical to it. By definition, each cortical visual area has only one corresponding field sign. Because the field sign polarity typically reverses in adjacent cortical areas, it has been a useful criterion for distinguishing cortical areas in experimental animals and in humans (Sereno et al., 1994, 1995).
In the present study the field sign for each cortical area was calculated objectively from the constituent phase-encoded maps of polar angle and eccentricity, as in Sereno et al. (1995). Each field sign map shown here was based on the average of at least four scans (two mapping polar angle and two mapping eccentricity; 8192 functional images in total) acquired from two or more slice prescriptions. These cortical area boundaries were overlaid onto additional data sets, based on different types of visual stimulation, to clarify how each retinotopic area responded to stimuli of different types. The locations of additional cortical areas in which retinotopy has not yet been revealed (e.g., MT/V5), were based on other, global (nonretinotopic) stimulus comparisons (e.g., moving vs stationary) described below and elsewhere (Tootell et al., 1996b).
RESULTS
Detailed retinotopy
Our first experimental goal was to define the retinotopy in greater detail so that additional functional properties (defined in associated scans) could be assigned to the correct cortical area. As in previous studies (DeYoe et al., 1994, 1996; Engel et al., 1994, 1997;Sereno et al., 1995), we mapped the retinotopy using slowly moving phase-encoded stimuli filled with flickering checks. However, stimuli in the present study were modified to increase their effectiveness in human areas with cruder retinotopy.
Previous (thick) phase-encoded retinotopic stimuli extended over one-half of the scaled visual field (DeYoe et al., 1994, 1996; Engel et al., 1994, 1997; Sereno et al., 1995). Based on macaque data, receptive fields in a hypothetical human V3A presumably would be larger than those in lower tier cortical areas (Gaska et al., 1988; Gattass et al., 1988) and may have powerful lateral inhibition (Gaska et al., 1987). In this study we therefore used very thin retinotopic stimuli, ∼6% of the (scaled) width of stimuli used previously, to avoid retinotopic saturation of fMRI signals (see Fig.2).
Fig. 2.

Thinner probe stimuli produce increased retinotopic differentiation in two anterior human cortical areas, V3A and V4v. A, D, Two stationary samples of phase-encoded stimuli, similar to each other except for the radial width of the stimuli. During the actual experiment only one or the other ring was presented in each scan. During those scans both versions of these stimuli expanded (or in different scans, contracted) in size continuously, going through eight 64 sec expansions from central (0.75°) through peripheral (15°) eccentricities in repeating cycles. Check size and expansion speed were both scaled approximately logarithmically, and the black and white checks flickered continuously at ∼3 Hz throughout the scan. In accompanying scans wedge-shaped (ray-shaped) stimuli, locally perpendicular to the ring-shaped stimuli, also were presented in thin versus thick versions (10 vs 180° in polar angle, respectively) to map the polar angle representation. Such data produced thin–thick stimulus differences similar to those shown here. The thin stimuli produce signals with greater retinotopic modulation than the thick stimuli. This is revealed in both the map data (B, E) and in the time courses of activity from single voxels (C,F). In this and all subsequent figures, maps (e.g., B, E) are shown in right hemisphere format (whether actually from left or right hemisphere) for ease of comparison. Systematic differences in the size or topography of areas described in this study were not seen between right versus left hemispheres. Regions showing significant retinotopic modulation to the thick and thin ring stimuli are shown in B andE, respectively, in a pseudocolor format identical to that used in earlier publications (Sereno et al., 1995; Koch and Tootell, 1996; Tootell et al., 1996a) (see logo of corresponding contralateral visual field locations in bottom right of B). In this pseudocolor format, retinotopically specific modulation appears in red,green, or blue (centered approximately at eccentricities 1.5, 3.8, and 10.3°, respectively). The gyral/sulcal anatomy (before flattening) is coded in underlying shades oflighter and darker gray, respectively. The visual area boundaries of areas V1, V2, V3, VP, V3A, and V4v were defined in the same hemisphere, based on calculations of field sign, as described in earlier publications (Sereno et al., 1995; Tootell et al., 1996a,b) and in Materials and Methods. In all figures these area boundaries are indicated in dotted and solid lines corresponding to vertical and horizontal meridian representations, respectively. In this figure, area V3A is indicated with an asterisk, and V4v is indicated with aplus symbol. The scale bar represents 1 cm of topographical distance measured near layer 4—but this is an average value. At any local region in the flattened map, actual distances on the corresponding cortical surfaces may be slightly different (typically near 15%, areal and angular distortion). The systematic parallel bands indicating the isoeccentricity representations extend throughout V3A and V4v when produced by the thin rings (E). However, the isoeccentricity bands stop approximately at the posterior border of V3A and V4v when they are produced by the thick rings (B). Each map is based on one scan (128 time points per voxel), so the map comparison is done at equal levels of signal averaging. Averaged time courses produced by each of the stimuli are shown in C andF. Each graph shows the MR activity during eight stimulus cycles, combined into an average time course representing a single cycle (16 time points and one 64 sec stimulus expansion per cycle). Because cortical tissue from each sampled voxel is retinotopic, it shows modulation specific for a specific phase of the periodic stimulus. Thus each phase value corresponds to a single retinotopic eccentricity, as in the x-axis label in Cand F. Data are sampled from one voxel inV1 and one voxel in V3A (based on position in the field sign map from the same hemisphere). For each of those voxels data also are shown from one scan that used a thin ring stimulus (red) and one scan that used a thick ring stimulus (green). Peak amplitude has been normalized to make it easier to compare the retinotopic “bandwidth” in each area. These fMRI “time courses” suggest that the increased retinotopic specificity revealed in V3A by the thin rings is attributable to larger receptive fields (or at least a larger point spread function) in V3A, as compared withV1.
As expected, these thin stimuli did produce much more robust and revealing retinotopy in more anterior (presumably higher tier) cortical areas. This can be seen in the flattened image data (Fig.2B,E) as well as in the averaged time courses from voxels within area V3A (Fig. 2C,F). Retinotopic modulation in response to the thin stimuli was typically two to three times that obtained using thick stimuli in human V3A. On the basis of macaque data (Gattass et al., 1988; Boussaoud et al., 1990), one also might expect relatively large receptive fields in V4v, another human area near V3A. Although we do not discuss V4v in detail here, it is interesting to note that the thin stimuli also produced increased modulation in human V4v. The increased retinotopic modulation produced by the thin stimuli and the averaging of data on the cortical surface from different scanning sessions made it possible to describe the retinotopy in V3A (and other areas) in more detail than previously possible.
Figure 3 shows a generalized diagram of the retinotopy in macaque cortical areas V1, V2, V3, VP, and V3A, based on previous reports (Van Essen and Zeki, 1978; Maunsell and Newsome, 1987; Gattass et al., 1988; Tootell et al., 1988, Tootell and Hamilton, 1989; Van Essen et al., 1990, 1992; Colby and Duhamel, 1991; Felleman and Van Essen, 1991; Tootell and Taylor, 1995). This diagram serves as a reference template for our study of the topography of human retinotopy, especially V3A. To the extent that the macaque and human retinotopy are similar, this suggests that correspondingly named areas in humans and macaques have common evolutionary precursors. However, we recognize that such conclusions about homology are always inferential and can be controversial (Kaas, 1995a,b).
Fig. 3.

Diagram of the retinotopic organization in flattened macaque visual cortex. The diagram is from a right hemisphere, including areas V1, V2,V3, VP, and V3A, based on previous reports (Van Essen and Zeki, 1978; Maunsell and Newsome, 1987;Gattass et al., 1988; Van Essen et al., 1990, 1992; Colby and Duhamel, 1991; Felleman and Van Essen, 1991; Tootell and Taylor, 1995). The internal retinotopy of V3A is based on the descriptions of Van Essen and Zeki (1978), Zeki (1978a,b), Van Essen et al. (1990), and Felleman et al. (1997); the organization described by Gattass et al. (1988) is less consistent. Macaque V4v is not indicated here because its internal retinotopy is known incompletely. A, A representation of retinotopic polar angle. As shown in the pseudocolor logo (A, bottom left), the representation of the upper third of the visual field is coded red, the lower third is codedgreen, and the middle third, centered on the horizontal meridian, is coded blue. Cortical area boundaries corresponding to the representation of the horizontal meridian are indicated by solid white lines, and the vertical meridian is indicated by dotted white lines. Because the horizontal meridian within V3A is not a cortical area boundary, it is indicated only by the blue pseudocolor stripe.B, The representation of visual field eccentricity. As illustrated in the corresponding logo, the foveal representation is coded white, and progressively more peripheral eccentricities are coded red, thenblue, and then green. The pseudocolor scale for eccentricity is scaled logarithmically, in approximate accord with the cortical magnification factor; thus the range of visual field eccentricities is coded by green >blue > red>white.
Throughout most of macaque visual cortex (including V1, V2, V3, and VP), the superior half of the visual field is mapped onto inferior cortex, and the inferior visual hemifield is mapped superiorly (see Fig. 3). However, immediately anterior to macaque V3 (lower field only), there is a complete representation of the visual hemifield, including both lower and upper visual fields; this is V3A (Van Essen and Zeki, 1978; Zeki, 1978b; Gattass et al., 1988). The V3A representation is bounded exteriorly by the the vertical meridian, with a horizontal meridian mapped interiorly. The location of the horizontal meridian representation, and even the upper versus lower visual fields, in our diagram of V3A are estimated from discrepant descriptions in the previous literature (Van Essen and Zeki, 1978; Zeki, 1978b; Van Essen et al., 1990; Colby and Duhamel, 1991) (but see Gattass et al., 1988).
The thin phase-encoded stimuli revealed an area with very similar retinotopy in human visual cortex, an apparent homolog of macaque V3A (see Fig. 4). Most distinctive is theupper field representation in anterior V3A, coded in red in Figure 4. This upper field representation was not seen reliably in two previous fMRI reports that used thick phase-encoded stimuli in fewer subjects (Sereno et al., 1995; DeYoe et al., 1996). However, in the present study that used thin stimuli, the upper field representation of V3A was seen in all subjects from whom it was practical to achieve adequate signal-to-noise levels. As in most diagrams of macaque V3A, human V3A is bounded exteriorly by lower and upper vertical meridian representations (posteriorly, at the V3/V3A border and at the anterior border, respectively).
Fig. 4.

fMRI maps of polar angle in flattened human visual cortex and associated visual area boundaries from three hemispheres. The polar angle maps are shown in B–D. Each polar angle map shows MR data from two scans that used phase-encoded thin ray stimuli, averaged on the cortical surface of the hemisphere from which it was obtained. Retinotopically specific activation is represented by using a pseudocolor scale identical to that in Figures 3 and 12 and elsewhere (Sereno et al., 1995; Koch and Tootell, 1996) (seelogo in B). As in macaque, there is a representation of the full contralateral hemifield (codedgreen through blue throughred) in the superior lateral occipital cortex (upper middle right in B–D), which is a unique distinguishing feature of human V3A. A, A map of retinotopic field sign (as in Sereno et al., 1995) from the same hemisphere shown in B. The most significant area boundaries revealed in the field sign map are translated to the maps of polar angle for the same hemispheres. Here and throughout this paper the representation of the vertical meridian is coded in dotted lines, and the representation of the horizontal meridian is coded in solid lines. The confluent foveal representations in V1, V2, and V3/VPare coded in asterisks. The calibration bar inB represents 1 cm on the cortical surface, on average, for all panels.
In macaque V3A, the fovea is reported to be represented inferiorly butdisplaced superiorly from the contiguous foveal representation of areas V1, V2, V3, and VP (Van Essen and Zeki, 1978;Gattass et al., 1988; Felleman and Van Essen, 1991) (see Fig. 3). The phase-encoded stimuli used here and previously do not reveal this human foveal representation, because such stimuli systematically spared the central 0.75° diameter (Sereno et al., 1995). To test for a similar displaced foveal representation in human V3A, we presented moving concentric rings confined within a small (∼0.7° radius) circular aperture (experimental condition), as compared to a uniform gray field (control condition) (see Fig.5A).
Fig. 5.

Maps of foveal activation, including evidence for a separate foveal representation in inferior V3A, in multiple hemispheres. During this experiment subjects fixated on the foveal stimulus shown in A and described in the text. In alternating 16 sec control epochs, the stimulus in A was replaced by a uniform gray field. B–D, Shown is the resulting activation in three different flattened hemispheres. Area boundaries from the field sign maps of each hemisphere are indicated also. Typically, this foveal stimulus activated an approximately continuous strip of cortex between the upper and lower field representations of V1, V2, andV3/VP. In some subjects there was also a clear patch of activation in inferior V3A, displaced somewhat superiorly from the confluent foveal representation inV1–V3/VP. This is consistent with reports of a similar, superiorly displaced foveal representation in inferiorV3A of macaque. In addition, this stimulus activatedMT/MSTd (or foveal representations thereof; seeB–D). With increased signal averaging, this stimulus also reveals foveal activation inferior and anterior toV4v (see B), which is not obviously predicted by the macaque data. The pseudocolor scale beneath each panel indicates the null hypothesis probability, based on the F test for the data in each panel. The distance scale bar (1 cm) below D applies toB and C as well. Below Ais a calibration bar indicating the visual field angle subtended by the stimulus.
As expected, this stimulus comparison activated the confluent foveal representation of V1, V2, V3, and VP. In some subjects the foveal representation in human V3A showed activation that was displaced superiorly, as one would expect from the macaque maps (compare with Figs. 3, 5). As one would expect from the nature of the stimulus comparison (foveal stimulus vs uniform field), this experiment also activated the region of foveal sensitivity in certain areas more anteriorly, such as MT/MST (see Fig. 5B–D).
In some subjects the representation of parafoveal eccentricities also appeared to branch superiorly within V3A (seearrows and red isoeccentricity band in Fig. 6B,D), as one might expect from a large foveal displacement. However, in other subjects the representation of parafoveal eccentricities in V3A was not distinguishable from a single band, contiguous with the representation of those same eccentricities in areas V2 and V3 (see Fig. 6A,C).
Fig. 6.

Phase-encoded maps of retinotopic eccentricity in four hemispheres, with associated visual area boundaries from field sign maps in the same hemispheres. The data in each panel represent an average from two scans of thin ring stimuli. The labeling conventions are as described elsewhere. InB, the scale bar indicates ∼1 cm, and the eccentricitylogo is as described above. Generally, the isoeccentricity bands (red, or blue andgreen) form parallel bands oriented perpendicular to the polar angle representation. However, in some subjects the representation of parafoveal eccentricities in the lower visual field (top red band in A–D) bifurcates posterior to V3A, with the superior branch extending into inferior V3A and the inferior parafoveal branch extending into regions apparently inferior to V3A (see paired arrows inB and D). In D one also can see a slight shift in the parafoveal isoeccentricity band coincident with the V3/V3A border. Both of these effects are consistent with the evidence for a slightly displaced foveal representation in V3A (e.g., Fig. 5).
V3A was not revealed in a previous study that used field sign analysis and thick retinotopic stimuli (Sereno et al., 1995). However, when the field sign was calculated from the present data that used thin stimuli, area V3A was clearly visible (see Figs.7-9).
Fig. 7.

Field sign map, including V3A, on normal, inflated, and flattened cortical surface representations from a single hemisphere. A, The field sign data (blue, consistent with geometry of visual field;yellow, mirror image of visual field) calculated from polar angle and eccentricity data from the same hemisphere. The field sign data are rendered on a three-dimensional reconstruction in a “normal” (cortically folded) state, from a posterior viewpoint, in right hemisphere format. The lower field representations ofV1, V2, and V3 are labeled, along with V3A. In A, these areas are partially buried within sulci, occluded from view.B, The same regions on an “inflated” cortical surface, where sulci and gyri are both visible (rendered indarker and lighter gray, respectively). The topography of these areas is fully revealed in the flattened format (C, D). C, The location of area MT/MST is added, based on the moving versus stationary stimulus comparisons described in Figures 14 and 15 and elsewhere (Tootell et al., 1995a,b, 1996b). D, The locations ofV3A (extracted from the field sign data) andMT, drawn as borders so that the underlying sulci and gyri also can be localized. The peripheral region of V3Acrosses the transverse occipital sulcus (TOS) approximately at a right angle. The fundus of the TOS is indicated as white dotted lines in A, B, and D. The intraparietal sulcus (IPS), which normally intersects the TOS in a T configuration, also is indicated (green dotted lines). The confluent foveal representation ofV1–V2–V3 is indicated between the two white asterisks (B,C). The calibration bar in B applies toA and B, and the calibration bar inD applies to C andD.
Although some variability exists, area V3A also had a reasonably consistent location on the cortex, relative to the gyral/sulcal landmarks. V3A generally crossed the transverse occipital sulcus (Duvernoy, 1992) approximately at a local right angle, such that the more peripheral representation of V3A (in different cases, including 5–15° eccentricity) were buried within it (see Figs. 7, 8, 9). The more central representation of V3A extended inferiorly over the lateral portion of the occipital lobe. It is likely that V3A extends farther peripherally than we have drawn, corresponding to regions beyond the limits of our visual stimulus (15°).
Fig. 8.

Variation in the topography of V3A across individuals. The extent of activated V3A is rendered inblue, based on field sign data from the same hemispheres, in four representative cases. Data are rendered on folded-format right-sided cortical surfaces, seen from a posterior lateral viewpoint. Although some variability exists, V3A always extends over the lateral surface, elongated along the superior–inferior axis, ∼3–5 cm from the occipital pole. The calibration bar accurately reflects distances across the cortical surface, excepting perspective foreshortening.
Fig. 9.

The anatomical relationship of V3A and a sulcal landmark. This figure is based on the same data as in Figure 8, but it is rendered on inflated rather than folded cortical surfaces. Only the boundaries of V3A have been drawn (solid white lines) so that the underlying sulcal/gyral topography can be seen. In each hemisphere the fundus of the transverse occipital sulcus has been indicated with dotted white lines. In all cases examined, the peripheral visual field representation of V3A (superior in cortex, toward the top in the figure) extends into the transverse occipital sulcus, typically at a locally near-orthogonal angle. The calibration bar is accurate, excepting perspective foreshortening.
In the five subjects in which V3A was best defined, the averaged Talairach coordinates (Talairach and Tournoux, 1988) for central V3A (the inferior lateral end of V3A in Figs.8 and 9; approximate eccentricity = 0.6°) were ±29, −86, and −16. Corresponding coordinates for peripheral V3A (the superior medial end of activated V3A in Figures 8 and 9, at ∼13–15° eccentricity) were ±14, −84, 19.
Cortical image point spread
In general, receptive fields become progressively larger as one ascends the visual cortical hierarchy. Thus macaque V2 has larger receptive fields than V1, VP has larger receptive fields than V2, and so on (for review, see Gattass et al., 1985). If human areas such as V1, V2, V3, VP, and V3A are homologous to their macaque namesakes, one would expect a similar and progressive increase in receptive field size, if one could measure this from V1 through V3A.
Although we could not measure individual receptive field size directly in these human fMRI experiments, we did two experiments to measure a closely related concept, the cortical image point spread. Conceptually similar experiments have been described in macaque (Dow et al., 1981;Tootell et al., 1988; Grinvald et al., 1994). The goal of such experiments is to present an infinitely small stimulus and measure the topographic (retinotopic) spread of activity produced by such stimuli, akin to measuring an impulse response function in the temporal domain. In actual experiments such stimuli need to be larger than a certain minimum size to produce measurable activity. From these measurements we can infer average receptive field size from the population response. Additional factors also are reflected in these measurements, and these are addressed in Discussion.
In the first of these experiments we examined the averaged MR time course from individual voxels in selected cortical areas, from the measurements of retinotopic polar angle, using the thin ray stimuli described previously (e.g., Fig. 4). As this stimulus passed repeatedly through the aggregate receptive fields sampled in a given voxel, it produced an averaged time course with an approximately gaussian profile (see Fig. 10). The width of the gaussian reflects, in part, the underlying receptive field sizes. The thin ray produced a wider “point spread” modulation in V3A, as compared with V1, consistent with the larger receptive fields presumed in these areas from the macaque data (Felleman and Van Essen, 1991). Responses in intermediate areas (V2, V3, and VP) were correspondingly intermediate in width to the extremes shown in Figure 10 (data not shown); again, this is consistent with receptive field measurements from macaque. The inference of larger receptive fields in V3A is also consistent with the clearer retinotopic differentiation produced by thin versus thick stimuli in V3A, compared with their negligible advantage in V1 and V2 (see Fig. 2).
Fig. 10.

The retinotopic point spread in human V3A and comparison areas, measured as a spatiotemporal impulse function. The stimulus was a thin ring that expanded slowly and continuously (64 sec/full cycle) from the center to the periphery of the visual field, as described in Results and portrayed in B (three samples of the stimulus at different eccentricities). The fMRI time course in A was sampled from voxels in each of the visual areas, from similar eccentricities, representing the average of three consecutive scans from one subject. The borders ofV1 and V3A were defined by the field sign tests, and areas MT and SPO (the superior parieto-occipital area) were defined by motion tests (see Tootell et al., 1995a,b, 1996b) (also see Fig. 13). The retinotopic response function in V3A was consistently wider than that produced concurrently by the same stimuli in V1. The thin rings activated MT and SPO at all retinotopic locations tested, consistent with previous data showing nonretinotopic activation in these regions (Sereno et al., 1995;Tootell et al., 1995a, 1996b).
We also did an additional, complementary experiment on the retinotopic point spread, using a two-condition design rather than the continuously moving phase-encoded design described in Figure 10. In this second experiment, we presented a very thin (0.6°) ring of flickering checks at a stationary eccentricity of 12.3° (experimental condition), compared to a uniform gray field (control condition). Figure11 shows this stimulus and its effect in superior occipital cortex in relationship to area borders that had been defined by the phase-encoded retinotopic stimuli described above. The stationary ring representation is most discrete (thinnest) in areas posterior to V3A (e.g., V1, V2, etc.), becoming noticeably expanded within V3A (see Fig. 10).
Fig. 11.
Measurements of the cortical point spread of activity, measured here from stationary stimuli, also show a relatively expanded representation in V3A. Subjects fixated on a central dot throughout this experiment, as shown in the experimental stimulus in A. In each 16 sec experimental epoch the contrast of the black and white checks in the isoeccentric ring alternated in counterphase (3 Hz). The ring had a radius of 12.3° (midpoint) and a width of 0.6° (see calibration bar inA). In alternating 16 sec control epochs, the stimulus in A was replaced by a uniform gray field.B, The differential activation map produced by this stimulus comparison (red through white; see pseudocolor scale bar for significance values) is shown in superior occipital cortex. Also shown are the visual area borders extracted from the retinotopic field sign maps asdotted and solid lines. The activation produced by this ring extended further in V3A, as compared with V3, V2, orV1, over a range of significance values.V3A includes twice the polar angle representation, as compared with the quarter-field representations of V1,V2, and V3 shown here; thus one would expect its representation along that continuum (left to right in B) to be expanded correspondingly. However, the ring representation in V3A also is expanded along the eccentricity dimension (up–down inB). The latter likely reflects an increase in receptive field size in V3A relative to V1–V3, as suggested in the time course data of Figure 10.
Composite human retinotopic map
To complement the individual examples of retinotopy shown above, we prepared an averaged map of the human retinotopy. First, diagrams were prepared from each of six hemispheres, labeled at the intersections of horizontal and (upper and lower) vertical meridians where they crossed the isoeccentricity representations at ∼1.5, 3.8, and 10.3° eccentricity. The confluent representations of 0° were also available, based on the centers of activity produced by the foveal stimuli (e.g., Fig. 5).
For each hemisphere, straight lines were drawn between the nearest intersection points along both the isoeccentricity and isopolar axes. To create a geometrically averaged retinotopy from these data, we averaged the length and orientation of each line segment to form a quadrilateral-based average figure. This figure was rounded somewhat to form the more naturalistic averaged human retinotopic diagram in Figure12.
Fig. 12.

Averaged retinotopic organization of human visual cortex revealed by fMRI of thin phase-encoded stimuli and field sign analysis. The diagrams have a format comparable to the corresponding macaque retinotopy in Figure 3. A reveals the averaged polar angle retinotopy, and B reveals the averaged eccentricity data, from the same six hemispheres, averaged in right hemisphere format. The steps involved in the geometric averaging are described in the text. In A, each of thered, blue, and greenpseudocolor ranges represents retinotopically differentiable activation within a 60° subdivision of polar angle in the contralateral visual field (see logo, A). In B, the red, blue, and greenranges correspond to fMRI activation within logarithmically equal subdivisions of the eccentricity range from 0.75 through ∼15° in the visual field, centered at ∼1.5° (red), 3.8° (blue), and 10.3° (green) (seelogo, B). The representation of eccentricities beyond 15° was not activated by our stimuli, so the diagrams are correspondingly limited to the central two-thirds of the surface area in each of retinotopic areas shown here. Although techniques used to study the macaque and human retinotopy differ significantly, the macaque and human retinotopic maps are quite similar. The most significant difference here is inV3/VP, in which the polar angle representation is expanded proportionately in humans.
Retinotopy in adjacent area(s) V3/VP
Overall, the averaged human retinotopy is reasonably similar to that described in the Old World macaque monkey (compare with Figs. 3and 12). In one minor aspect this happy confluence of results may be misleading—although the parafoveal representation in human V3A is not displaced superiorly in all subjects (e.g., Fig. 6), it is displaced in the averaged sample.
However, another distinction is quite reliable: macaque areas V3 and VP are extremely long and thin in shape, but human V3 and VP are proportionately less elongated in essentially all subjects tested. These differences have specific retinotopic implications, because the overall topography of these areas directly reflects theirretinotopy. Here we do not address whether the complementary quarter-field representations in V3 and VP comprise two different areas, as considered by some (Burkhalter et al., 1986), or instead two retinotopic divisions of the same area (superior/dorsal V3 superior and inferior/ventral V3), as considered by others (Gattass et al., 1988;Boussaoud et al., 1990).
In V3 and VP of both humans and macaques, variations in eccentricity are mapped along the long axis, and polar angle is represented along the orthogonal (short) axis (see Figs. 3 and 12). In both species the cortical magnification of eccentricity in V3/VP is very similar to that in V1 and V2—this is manifest in the approximately confluent isoeccentricity bands crossing V1, V2, and V3/VP. However, in macaque the magnification of polar angle is higher (more compressed) in V3 and VP, compared with that in V2 and V1—thus V3 and VP as a whole are markedly thinner than corresponding regions of V1 and V2. However, human areas V3 and VP show no such thinning: instead, human V3/VP are approximately as wide as V2 and V1, immediately posterior.
A relatively thicker human V3 would not be expected from any artifactual effect of the cortical surface processing that we can think of. A difference-of-gaussian spatial filter conceivably could change the apparent width of these regions because of image “ringing,” but we did not use such a filter. Instead, in the field sign calculation we used a simple gaussian (nearest neighbor, or boxcar) filter, which should simply blur a hypothetical very thin V3/VP into invisibility. The thickened width of human V3/VP shows up quite clearly even in the polar angle maps, which undergo very minimal spatial filtering (see Fig. 4; gaussian blur, ∼2.5 mm).
The relative anisotropy of V3/VP in macaques and humans has direct retinotopic ramifications (see Fig.13). Imagine an exact circle drawn onto the flattened surface of macaque V3: because of the anisotropy this corresponds to the representation of a banana-shaped ovoid in the visual field. As noted by Newsome et al. (1986), the ovoid is magnified approximately five times as much in a direction parallel to isoeccentric lines, compared with that in the perpendicular (radial) axis. However, human V3/VP shows much less cortical anisotropy (see Fig. 13C,D; anisotropy ∼1.5). Possible implications of this species difference in anisotropy are considered in Discussion.
Fig. 13.

Illustration of the relative isotropy in the visual field projections in areas V3/VP in humans, as compared to macaques. A and C include diagrams of the polar angle representation in macaques and humans from Figures 3 and 12, respectively. B and Dinclude representations of the corresponding contralateral polar angle subdivisions in a pseudocolor format corresponding to that of the polar angle maps. In A and C we also have drawncircles on the cortical surface in V3/VPof arbitrary size (here, ∼2 mm) at a range of eccentricities.C and D show the projection of such circles in the visual field in colors corresponding to the cortical circles. Across all eccentricities the consistent result is an ovoid-shaped (highly anisotropic) projection in macaqueV3/VP and a more circular (more isotropic) projection in human V3/VP. These results are directly related to the difference in topographic width (and corresponding polar angle magnification) between V3/VP in these two primate orders.
Retinotopy in adjacent area V4v
In macaque cortex the large region ventral to V3A is named “V4.” In human neuroimaging maps one subset of the region that is topographically analogous to macaque V4 contains a retinotopic representation of the upper visual field; hence it originally was given the name “V4v” (ventral V4; Sereno et al., 1995; DeYoe et al., 1996; Tootell et al., 1996b). The increased signal-to-noise ratio in the present maps allow us to conclude that V4v (as defined by the field sign maps) has only a quarter-field (not a half-field) representation of the upper visual field (compare with Fig. 4). Unfortunately, the name V4v naturally implies the existence of a complementary quarter-field representation of the lower visual field (“V4d;” dorsal V4, or V4d), located superior to V4v. However, such a V4d has not been demonstrated in previous studies nor by the increased signal averaging and smaller stimuli in the present study. In that sense the name “V4v” for the retinotopic region is misleading.
One might imagine that the upper field quarter-field representation in V4v might be the “missing” retinotopic complement to V3A. However, V3A cannot be considered complementary to V4v for two reasons: (1) V3A includes a continuous representation of the wholecontralateral visual field (upper plus lower visual fields) and thus it does not lack (and cannot logically accommodate) a quarter-field complement such as V4v, and (2) area V3A is functionally quite different from V4v with regard to motion selectivity (see below) and additional functional properties.
Although it is counterintuitive, all of our fMRI evidence suggests that the upper field representation in V4v does not have a retinotopic complement in the lower visual field. In that sense it may be akin to the quarter-field representations in V3 and VP. However, additional lower field representations have been reported in the vicinity of V4v (McKeefry and Zeki, 1997), and the retinotopy in this region is under active investigation.
Motion selectivity in human V3A and V3
Recent detailed electrophysiological reports indicate that approximately one-half of the neurons in macaque V3 are motion- and direction-selective (Felleman and Van Essen, 1987; Gegenfurtner et al., 1994). However, this motion selectivity is apparently less prevalent in macaque V3A (Gaska et al., 1988; Galletti et al., 1990).
Previous human imaging studies often have reported a motion-selective area in this general region of cortex (Watson et al., 1993; De Jong et al., 1994; Dupont et al., 1994; McCarthy et al., 1995; Shipp et al., 1995; Tootell et al., 1995a,b). Influenced by the macaque data, this human motion-selective area often has been attributed to human V3 (Shipp et al., 1994; De Jong et al., 1994; Dupont et al., 1994) (but see Tootell et al., 1995a,b, 1996a).
Here we were able to define V3 and adjacent areas retinotopically. By mapping the topography of both motion selectivity and retinotopic area boundaries in the same subjects, we were able to resolve which cortical area is actually motion-selective.
Phase-encoded retinotopic maps were made as described above. Maps of motion selectivity were made by comparing activity produced by moving versus stationary concentric rings, as in previous studies (Shipp et al., 1994; De Jong et al., 1994; Dupont et al., 1994) (but see Tootell et al., 1995a,b, 1996a) and as described above in Materials and Methods. However, similar moving/stationary comparisons also were done using stimuli of high (∼95%) luminance contrast as a control. Area MT also was labeled by the moving versus stationary comparisons. Technically adequate maps of both motion and retinotopy were obtained from 21 hemispheres in 13 subjects.
The results from the activity maps were quite consistent. Figure14 shows representative results from three different hemispheres showing activity in area MT (lower right of each panel) and in superior occipital cortex (upper middle of each panel). The topography of maximal motion selectivity in this cortical region was similar whether it was produced by high- or low-stimulus contrast (compare with Fig.14A,B). However, the high-contrast stimuli also recruit moderate motion-selective activation in additional areas, such as at the representation of the outer stimulus border in V1 (Fig.14B).
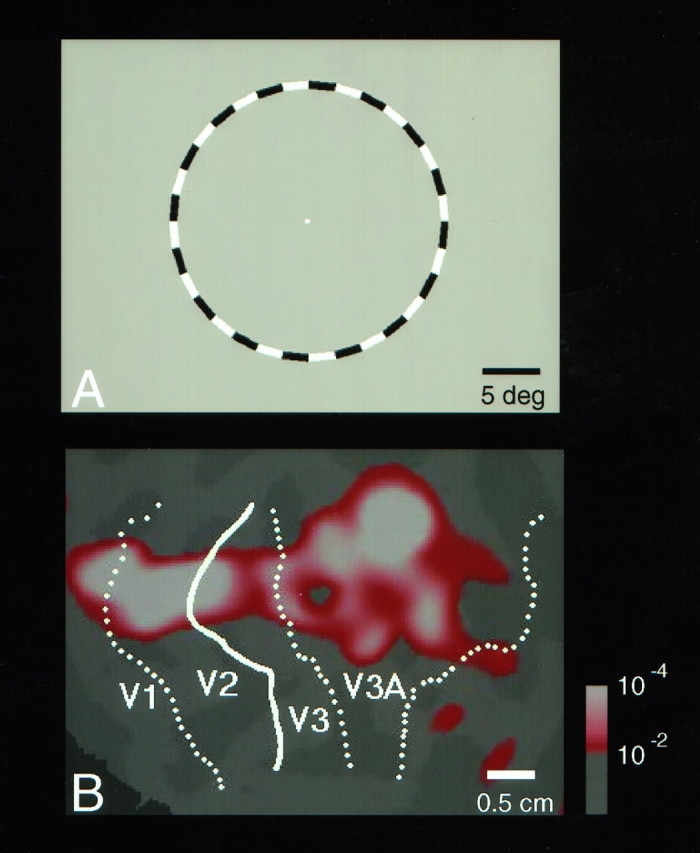
Fig. 14.

fMRI maps show high motion selectivity in humanV3A, but not in V3. A–D show the topography of motion-selective activity in lateral and superior occipital cortex in three representative hemispheres. The activation map (red through white) shows two main regions that responded significantly more to radially moving concentric rings, as compared with MR levels produced by viewing those same rings when they were stationary. The boundaries of areas V1,V2, V3, VP,V3A, and V4v are transposed from retinotopic field sign maps produced in the same hemispheres.A and B show the motion-selective map from the same hemisphere, produced by stimuli of two different contrasts. C and D show data similar to those in A from two additional hemispheres. A, C, and D are produced by a stimulus of ∼1.5% luminance contrast; in B the stimulus was ∼95% contrast. In all panels, human area MT/MSTd appears as an activated focus at the bottom right. The second main motion-selective focus, in superior occipital cortex (upper left of panel), lies within retinotopically defined area V3A. Note that motion-selective fMRI activity is not seen in humanV3. Comparing A and Bconfirms that the focus of maximal activity within MT/V5 andV3A remains essentially constant despite a large difference in stimulus contrast. However, additional motion-selective activity is recruited when high contrast is used. In Bthe recruited activity occurs at the retinotopic representation of the (peripheral, circular) stimulus border in V1—because this is the highest contrast border in the stimulus and becauseV1 responds poorly to low-contrast stimuli (Tootell et al., 1995a; Boynton et al., 1996). Such high-contrast stimuli also can activate V2 as well. The calibration bar equals 1 cm, on average.
Figure 15 shows the location of the voxel that showed maximal motion selectivity (the “centroid”) in superior occipital cortex from all 21 hemispheres, relative to the retinotopic field sign borders from the same hemispheres. In all cases within this sample, the patch of motion selectivity within superior occipital cortex lay within retinotopically defined V3A. Although superior V2, V3, and regions anterior to V3A were within our sample area, the obtained centroids never lay within these areas.
Fig. 15.

Locations of the single voxel showing maximal motion-selective activation within superior occipital cortex, combining data from 21 hemispheres. This analysis was similar to that shown in Figure 14, except that the threshold was raised so that only the single voxel showing maximal activity within this region (among superiorV2, V3, V3A, or the 2 cm anterior to V3A) was distinguished within each hemisphere. Then the location of this centroid was measured in all 21 subjects in which technically optimal maps were available, relative to the retinotopic field sign borders in the same hemispheres. All centroids were extracted from moving versus stationary comparisons at low (∼1.5%) luminance contrast. In each hemisphere linear measurements were made approximately perpendicular to the long axis of the area borders, passing through the single centroid (when found in the same area) or contiguous with that line when not found in that area (see diagram, top). These measurement lines thus fell approximately parallel with the isoeccentricity lines. The graph in thebottom portion of this figure shows the visual area boundaries and the average (normalized) distances encountered along these lines on the x-axis. For example, the average widths of V3 and V3A along these lines are ∼10 and 17 mm, respectively (see calibration bar, bottom right). The y-axis and the histogram bars indicate the number of centroids found within each area. Thex-axis also indicates the approximate location of each centroid along the measurement line. The location of any obtained centroid was calculated first as a ratio of distances relative to the raw width of the area in which it was found. Then this ratio was normalized relative to the averaged width of the area in which the centroids were found (empirically, V3A) and assigned to one of five histogram bins within each area. In all cases the centroids were found within V3A, usually toward the center of the area.
This analysis of the regions of “highest” motion selectivity produces a slightly misleading impression of the cortical selectivity for motion in this region. If one lowers the threshold (or increases the number of scan images averaged) to include more “motion-selective” voxels, then visual motion selectivity is clearly apparent in additional cortical areas such as V2, VP, etc. Additional experimental variables (affecting stimulus specificity and signal-to-noise ratio) will also interact in the fMRI results. However, we still found clear differences between human cortical areas in motion selectivity even in a previous study, which was conducted by using a quite different approach (Tootell et al., 1995b). The experimental differences in this previous study included high-contrast stimuli, a calculation of motion selectivity relative to both stationary and fixation-only epochs, averaging of normalized time courses in all significantly activated voxels from all areas in all subjects, etc. Such comparisons only confirmed the difference in mapped activity in Figures 14 and 15. The rank ordering of the motion selectivity in that previous experiment was as follows: MT > V3A > V2 > VP > V3 = V1 (Tootell et al., 1995b). Thus, even when using these very different procedures, we found that V3 was less selective for motion than V3A. In fact, in that study V3 was tied for lowest motion selectivity among the six areas tested.
DISCUSSION
With regard to the emerging comparisons between macaque and human cortical data, the present results are generally quite comforting: most aspects of the human retinotopy are similar to those reported earlier in macaque. This consistency is especially impressive when one considers the substantial technical differences between the human versus macaque data. Macaque retinotopic maps have been extrapolated in large part from single unit and connectional data, whereas the human data are derived almost entirely from imaging techniques. In macaque, large-scale views of the extrastriate retinotopy have not been imaged directly, except from restricted segments of V2 using non-fMRI techniques (Tootell and Hamilton, 1989; Grinvald et al., 1994; Roe and Ts’o, 1995). Furthermore, the human maps may be partially distorted by the idiosyncratic structure of the macrovascular bed, which contributes to the fMRI signals.
We were able to minimize the imaging artifacts in this study by combining the phase-encoded retinotopy with two new procedures. First, we used stimuli that were better matched for the area(s) in question (thin rings/rays) to coax out cruder retinotopy in V3A and V4v. Second, we averaged together the retinotopic maps acquired from several different sessions on the cortical surface. Such averaged maps are demonstrably more robust and less noisy than those produced from single scans or from paired scans that used a single slice prescription.
When V3A was localized on the folded (normal) brain, it consistently crossed the transverse occipital sulcus (TOS; Figs. 7, 8, 9). This link between V3A and the TOS suggests a degree of anatomical–functional consistency that was previously less obvious. Similar links between sulcal landmarks and corresponding functional areas are well accepted in better understood visual areas such as primary visual cortex (approximately centered within the calcarine fissure; Stensaas et al., 1974) and area MT/V5 (in the ascending limb of the inferior temporal sulcus; Watson et al., 1993) and nonvisual areas such as primary motor/somatosensory cortex (relative to the central sulcus; Talairach and Tournoux, 1988). Although the V3A–TOS relationship is approximate rather than definitive, it may help in circumstances in which localizing V3A is impractical (e.g., the clinic) and in qualitative analysis of neuroimaging data from subjects who are long gone.
Despite the overall similarities between the macaque and human organization, there is also evidence for several apparent species differences. Previous studies showed clear differences between humans versus monkeys in the topography of the “stripes” in area V2 (Tootell and Taylor, 1995) and in the cortical magnification factor of V1 (Sereno et al., 1995). The data presented here raise additional questions about how well the internal retinotopy in V3A of humans corresponds to that in V3A of macaques—but this issue awaits clarification in the macaque [cf. Gattass et al. (1988) relative toVan Essen and Zeki (1978), Zeki (1978b), and Felleman et al. (1997)].
A more striking species difference is reflected in the topographic width of areas V3/VP in humans (wide) versus macaques (narrow). Macaque areas V3/VP are unusually thin, reflecting a polar angle representation that is highly compressed relative to the representation of stimulus eccentricity (i.e., the cortical magnification factor is anisotropic). However, in human V3/VP this anisotropy has been largely “corrected.”
Although teleology is inherently speculative, this example is interesting. Let us assume that the number of neurons in human V3/VP increased because evolutionary divergence from the macaque line as a result of specialized use or other factors. Increased numbers of cells could not be added along the isopolar representation without disturbing the contiguity with the isoeccentric representation in adjacent areas V2, V4v, etc. Thus any cell additions would have to be added along the isoeccentric lines, passively “correcting” the anisotropy visible in V3/VP of present day macaques. This idea also can be reversed: perhaps the evolutionary progenitor of present day macaques had a thicker V3/VP (like humans), but it has been “devolving” toward a more vestigial area in present day macaque—also losing cortical space along the isoeccentric representation.
Perhaps the most profound evidence for species differences is the qualitative reversal of the motion sensitivity in areas V3 versus V3A in humans versus macaques. Simply put, area V3A appears to be “the” second lower tier motion area (after MT/V5), and it is clearly the most retinotopic motion area in humans. In macaques, V3 has instead been considered a second motion area (Felleman and Van Essen, 1987;Gegenfurtner et al., 1994). This distinction is so salient that one anonymous reviewer suggested switching the (retinotopically based) names V3 and V3A in humans to match the “reversal” of motion selectivity in humans. Although this suggestion has merit, we have chosen to leave the human names V3 and V3A consistent with their retinotopic counterparts in macaque, implicitly assuming that the motion selectivity has become wired differently in V3 and V3A in monkeys, as compared to humans.
The V3/V3A difference is unexpected especially because the motion selectivity in macaque V3 has been regarded not as an arbitrary specialization but rather as intimately related to its connections and position in the magnocellular stream. In macaque, V3 receives a strong and direct projection from layer 4B of V1 (Burkhalter et al., 1986; Van Essen et al., 1986; Girard et al., 1991), a layer strongly dominated by magnocellular input (Lund and Boothe, 1975; Fitzpatrick et al., 1991;Yoshioka et al., 1994). V3 itself shows motion and direction selectivity in approximately one-half of its neurons (Felleman and Van Essen, 1987; Gegenfurtner et al., 1994). The percentage of motion-selective cells in layer 4B is higher than that in any other known layer of V1 (Dow, 1974; Blasdel and Fitzpatrick, 1984; Hawken et al., 1988), approximately equal to that in V3 (Felleman and Van Essen, 1987; Gegenfurtner et al., 1994). Besides V3, MT is the most prominent extrastriate area that shares a direct input from this layer of V1, and MT is widely accepted to be involved in motion and direction processing. Like MT, macaque V3 has increased myelin staining in its lower layers (Burkhalter et al., 1986; Van Essen et al., 1986; Felleman and Van Essen, 1987; Gegenfurtner et al., 1994)—this may reflect the highly myelinated inputs from layer 4B of V1 (i.e., the stria of Gennari), known to terminate in layer 4 of V3 and MT. Highly myelinated fibers would be expected to speed up conduction time, a process that is especially useful in a stream processing visual motion at fast rates. More circumstantially, V3 shows distinctively higher staining for the monoclonal antibody CAT-301, like several other areas in the macaque magnocellular stream (DeYoe et al., 1990), including MT.
Macaque V3A has no such specialized links to the magnocellular stream, although it can be linked indirectly to such influences (for review, see Gaska et al., 1988; Felleman and Van Essen, 1991). The fMRI evidence for a shift of motion selectivity from V3 in macaques to V3A in humans makes it unclear how much one can generalize safely from the careful detailed studies of single units in macaque V3 and V3A to human neurons in these two areas. Another question that arises is whether layer 4B in humans projects to human V3A instead of (or in addition to) V3. Unfortunately, it is not yet technically possible to trace such connections in humans. However, the histological characteristics of human V3 and V3A can be tested in further studies, and preliminary evidence suggests that human V3A also differs histologically from its namesake in macaque (Tootell and Taylor, 1995;Tootell et al., 1996b).
In this study V3A responded to stimuli of very low (∼1.5%) contrast at essentially maximal MR levels (compare with Fig.14A,B). Therefore, V3A appears to have highcontrast sensitivity in addition to high motionselectivity. A similar coincidence of high motion and contrast sensitivity has been reported previously in MT in both humans (Tootell et al., 1995a) and macaques (Sclar et al., 1990) and in previous sites along the magnocellular pathway in macaque (Hawken et al., 1988). However, high contrast sensitivity also has been reported in human area V3 (Tootell et al., 1995a).
Kaas and coworkers recently proposed that area DM (defined originally in the New World aotus monkey) could be homologous to area V3 plus the upper visual field representation in V3A of macaque, an Old World primate (Kaas and Krubitzer, 1991; Krubitzer and Kaas, 1993; Kaas, 1995b; Stepniewska and Kaas, 1996). This model requires an upper visual field representation to occur between presently defined V3 and the lower visual field representation of V3A [as in one figure of Gattass et al. (1988) but different from the descriptions of Van Essen and Zeki (1978), Zeki (1978b), Van Essen et al. (1990), Colby and Duhamel (1991), and Felleman et al. (1997)].
The data presented here do not address this controversy between monkey species. However, the retinotopy in human V3A (which is quite robust and consistent across individuals) does not appear consistent with the DM model. Instead, the human maps show a dual mirror image representation of the lower visual field in V3 plus adjacent V3A and then the upper visual field representation. The New World area DM conceivably could be homologous to allof human V3A, but this would leave unexplained the interposition of area V3 between V2 and V3A/DM.
Certain technical considerations arise from our experiments on the retinotopic point spread function, from which we inferred that receptive fields are smaller in V1 than in V3A. Given the ubiquitous finding that receptive fields in primary visual cortex (V1) are smaller than in any other cortical area, in all mammals studied to our knowledge, these human results are not particularly controversial. However, it should be noted that our fMRI point spread measurements conceivably can be distorted by (1) hemodynamic “blur” in both spatial and spatiotemporal realms (Boynton et al., 1996), (2) differences in sampled eccentricity (because of greater imprecision near the foveal representation caused by fixation instability), (3) magnification anisotropy, and (4) differences in cortical surface area.
Some of these factors can be discounted in our experiments, at least partially: (1) the hemodynamic temporal filtering is approximately equal in V1 versus V3A, and (2) the data in Figures 10and 11 were sampled from voxels at similar or equal eccentricities. Finally, the average surface area of V3A is ∼15% smaller than that in retinotopically corresponding regions of V1, V2, and V3 (see Figs.12 and 15). Such a reduction in surface area should restrictthe relative extent of the point spread in V3A correspondingly, if the point image in V3A were equal to that in other retinotopic areas. Instead, we observed a clear expansion (see Fig. 11).
Many authors have pointed out how much more is known about visual cortex in monkeys, compared with what we know about visual cortex in our own species (Crick and Jones, 1993; Kaas, 1995a; Tootell et al., 1996b). Given this comparative data vacuum, it has been convenient to presume that human visual cortex is simply a (much) larger version of macaque visual cortex, and macaque research often has been rationalized as a good model of the human visual system. This belief has held up fairly well in better known areas such as V1 (primary visual cortex), in MT/V5 (for review, see Kaas, 1995a), and in psychophysical comparisons of macaques and humans (DeValois et al., 1974) (but seeJacobs, 1996).
However, these and previous imaging data (for review, see Engel, 1996;Tootell et al., 1996b) emphasize that it is now feasible to analyze the properties of specific areas of human cortex more directly. As we have learned more about human cortex, specific details of the cortical organization in humans appear to differ slightly from those of macaque. This is not unexpected, given the tens of millions of years of evolutionary divergence separating the two primate orders and the differences in cortical organization among other nonhuman primates separated by similar lengths of time. A clear understanding of both the similarities and differences in macaque versus human cortex should be indispensable in future studies, because research opportunities and constraints are so complementary in these two primates.
Footnotes
This study was supported by the Human Frontiers Science Program and National Eye Institute Grant EY07980, both to R.T. J.M. was supported by the McDonnel Pew Foundation. N.K.H. was supported by Swiss Fonds National de la Recherche Scientifique. This study could not have been done without the generous support of the Massachusetts General Hospital Nuclear Magnetic Resonance Center. We are particularly grateful to Mary Foley for scanning support and to Bruce Rosen, Robert Savoy, Ken Kwong, Stephan Brandt, and Sean Marett for fruitful discussions and more pragmatic support. The machine shop at the Rowland Institute furnished valuable plastic hardware.
Correspondence should be addressed to Dr. Roger B. H. Tootell, Nuclear Magnetic Resonance Center, Massachusetts General Hospital, 149 Thirteenth Street, Charlestown, Massachusetts 02129.
REFERENCES
- 1.Bandettini PA, Wong EC, Hinks RS, Tikofsky RS, Hyde JS. Time course EPI of human brain function during task activation. Magn Reson Med. 1992;25:390–397. doi: 10.1002/mrm.1910250220. [DOI] [PubMed] [Google Scholar]
- 2.Blasdel GG, Fitzpatrick D. Physiological organization of layer 4 in macaque striate cortex. J Neurosci. 1984;4:880–895. doi: 10.1523/JNEUROSCI.04-03-00880.1984. [DOI] [PMC free article] [PubMed] [Google Scholar]
- 3.Boussaoud D, Ungerleider LG, Desimone R. Pathways for motion analysis: cortical connections of the medial superior temporal and fundus of the superior temporal visual areas in the macaque. J Comp Neurol. 1990;296:462–495. doi: 10.1002/cne.902960311. [DOI] [PubMed] [Google Scholar]
- 4.Boynton GM, Engel SA, Glover GH, Heeger DJ. Linear systems analysis of functional magnetic resonance imaging in human V1. J Neurosci. 1996;16:4207–4221. doi: 10.1523/JNEUROSCI.16-13-04207.1996. [DOI] [PMC free article] [PubMed] [Google Scholar]
- 5.Buckner RL, Bandettini P, O’Craven K, Savoy R, Petersen SE, Raichle ME, Rosen BR. Detection of cortical activation during averaged single trials of a cognitive task using functional magnetic resonance imaging. Proc Natl Acad Sci USA. 1996;93:14878–14883. doi: 10.1073/pnas.93.25.14878. [DOI] [PMC free article] [PubMed] [Google Scholar]
- 6.Burkhalter A, Van Essen DC. Processing of color, form, and disparity information in visual areas VP and V2 of ventral extrastriate cortex in the macaque monkey. J Neurosci. 1986;6:2327–2351. doi: 10.1523/JNEUROSCI.06-08-02327.1986. [DOI] [PMC free article] [PubMed] [Google Scholar]
- 7.Burkhalter A, Felleman DJ, Newsome WT, Van Essen DC. Anatomical and physiological asymmetries related to visual areas V3 and VP in macaque extrastriate cortex. Vision Res. 1986;26:68–80. doi: 10.1016/0042-6989(86)90071-4. [DOI] [PubMed] [Google Scholar]
- 8.Colby CL, Duhamel JR. Heterogeneity of extrastriate visual areas and multiple parietal areas in the macaque monkey. Neuropsychologia. 1991;29:517–537. doi: 10.1016/0028-3932(91)90008-v. [DOI] [PubMed] [Google Scholar]
- 9.Crick F, Jones E. Backwardness of human neuroanatomy. Nature. 1993;361:109–110. doi: 10.1038/361109a0. [DOI] [PubMed] [Google Scholar]
- 10.Dale AM, Sereno MI. Improved localization of cortical activity by combining EEG and MEG with MRI cortical surface reconstruction: a linear approach. J Cognit Neurosci. 1993;5:162–176. doi: 10.1162/jocn.1993.5.2.162. [DOI] [PubMed] [Google Scholar]
- 11.De Jong B, Shipp S, Skidmore B, Frackowiak RS, Zeki S. The cerebral activity related to the visual perception of forward motion in depth. Brain. 1994;117:1039–1054. doi: 10.1093/brain/117.5.1039. [DOI] [PubMed] [Google Scholar]
- 12.DeValois RL, Morgan HC, Polson MC, Mead WR, Hull EM. Psychophysical studies of monkey vision. I. Macaque luminosity and colour vision tests. Vision Res. 1974;14:53–67. doi: 10.1016/0042-6989(74)90116-3. [DOI] [PubMed] [Google Scholar]
- 13.DeYoe EA, Hockfield S, Garren H, Van Essen DC. Antibody labeling of functional subdivisions in visual cortex: CAT-301 immunoreactivity in striate and extrastriate cortex of the macaque monkey. Vis Neurosci. 1990;5:67–81. doi: 10.1017/s0952523800000080. [DOI] [PubMed] [Google Scholar]
- 14.DeYoe EA, Bandettini P, Neitz J, Miller D, Winans P. Functional magnetic resonance imaging (fMRI) of the human brain. J Neurosci Methods. 1994;54:171–187. doi: 10.1016/0165-0270(94)90191-0. [DOI] [PubMed] [Google Scholar]
- 15.DeYoe EA, Carman GJ, Bandettini P, Glickman S, Wieser J, Cox R, Miller D, Neitz J. Mapping striate and extrastriate visual areas in human cerebral cortex. Proc Natl Acad Sci USA. 1996;93:2382–2386. doi: 10.1073/pnas.93.6.2382. [DOI] [PMC free article] [PubMed] [Google Scholar]
- 16.Dow BM. Functional classes of cells and their laminar distribution of monkey visual cortex. J Neurophysiol. 1974;37:79–100. doi: 10.1152/jn.1974.37.5.927. [DOI] [PubMed] [Google Scholar]
- 17.Dow BM, Snyder AZ, Vautin RG, Bauer R. Magnification factor and receptive field size in foveal striate cortex of the monkey. Exp Brain Res. 1981;44:213–228. doi: 10.1007/BF00237343. [DOI] [PubMed] [Google Scholar]
- 18.Drury HA, Van Essen DC, Anderson CH, Lee CW, Coogan TA, Lewis JW. Computerized mappings of the cerebral cortex—a multiresolution flattening method and surface-based coordinate system. J Cognit Neurosci. 1996;8:1–28. doi: 10.1162/jocn.1996.8.1.1. [DOI] [PubMed] [Google Scholar]
- 19.Dupont P, Orban GA, De Bruyn B, Verbruggen A, Mortelmans L. Many areas in the human brain respond to visual motion. J Neurophysiol. 1994;72:1420–1424. doi: 10.1152/jn.1994.72.3.1420. [DOI] [PubMed] [Google Scholar]
- 20.Duvernoy HM. The human brain. Springer; New York: 1992. [Google Scholar]
- 21.Engel SA. Looking into the black box: new directions in neuroimaging. Neuron. 1996;17:375–378. doi: 10.1016/s0896-6273(00)80170-1. [DOI] [PubMed] [Google Scholar]
- 22.Engel SA, Rumelhart DE, Wandell BA, Lee AT, Glover GH, Chichilnisky EJ, Shadlen MN. fMRI of human cortex. Nature. 1994;370:106. doi: 10.1038/369525a0. [DOI] [PubMed] [Google Scholar]
- 23.Engel SA, Glover GH, Wandell BA. Retinotopic organization in human visual cortex and the spatial precision of functional MRI. Cereb Cortex. 1997;7:181–192. doi: 10.1093/cercor/7.2.181. [DOI] [PubMed] [Google Scholar]
- 24.Felleman DJ, Van Essen DC. Receptive field properties of neurons in area V3 of macaque monkey extrastriate cortex. J Neurophysiol. 1987;57:889–920. doi: 10.1152/jn.1987.57.4.889. [DOI] [PubMed] [Google Scholar]
- 25.Felleman DJ, Van Essen DC. Distributed hierarchical processing in the primate cerebral cortex. Cereb Cortex. 1991;1:1–47. doi: 10.1093/cercor/1.1.1-a. [DOI] [PubMed] [Google Scholar]
- 26.Felleman DJ, Burkhalter A, Van Essen DC. Cortical connections of areas V3 and VP of macaque monkey extrastriate visual cortex. J Comp Neurol. 1997;379:21–47. doi: 10.1002/(sici)1096-9861(19970303)379:1<21::aid-cne3>3.0.co;2-k. [DOI] [PubMed] [Google Scholar]
- 27.Fitzpatrick D, Lund JS, Blasdel GG. Intrinsic connections of macaque striate cortex: afferent and efferent connections of lamina 4C. J Neurosci. 1991;5:3329–3349. doi: 10.1523/JNEUROSCI.05-12-03329.1985. [DOI] [PMC free article] [PubMed] [Google Scholar]
- 28.Friston KJ, Williams S, Howard R, Frackowiak RS, Turner R. Movement-related effects in fMRI time series. Magn Reson Med. 1996;35:346–355. doi: 10.1002/mrm.1910350312. [DOI] [PubMed] [Google Scholar]
- 29.Galletti C, Battaglini PP. Gaze-dependent visual neurons in area V3A of monkey prestriate cortex. J Neurosci. 1989;9:1112–1125. doi: 10.1523/JNEUROSCI.09-04-01112.1989. [DOI] [PMC free article] [PubMed] [Google Scholar]
- 30.Galletti C, Battaglini PP, Fattori P. “Real-motion” cells in area V3A of macaque visual cortex. Exp Brain Res. 1990;82:67–76. doi: 10.1007/BF00230838. [DOI] [PubMed] [Google Scholar]
- 31.Gaska JP, Jacobson LD, Pollen D. Response suppression by extending sine wave gratings within the receptive fields of neurons in visual cortical area V3A of macaque monkey. Vision Res. 1987;27:1687–1692. doi: 10.1016/0042-6989(87)90098-8. [DOI] [PubMed] [Google Scholar]
- 32.Gaska JP, Jacobson LD, Pollen D. Spatial and temporal frequency selectivity of neurons in visual cortical area V3A of the macaque monkey. Vision Res. 1988;28:1179–1191. doi: 10.1016/0042-6989(88)90035-1. [DOI] [PubMed] [Google Scholar]
- 33.Gattass R, Sousa APB, Covey E. Cortical visual areas of the macaque: possible substrates for pattern recognition mechanisms. In: Chagas R, Gattass R, Gross C, editors. Pattern recognition mechanisms, Vol 54. Pontificae Acadamiae Scientarium Scripta Varia; Rome: 1985. pp. 1–20. [Google Scholar]
- 34.Gattass R, Sousa APB, Gross CG. Visuotopic organization and extent of V3 and V4 of the macaque. J Neurosci. 1988;8:1831–1845. doi: 10.1523/JNEUROSCI.08-06-01831.1988. [DOI] [PMC free article] [PubMed] [Google Scholar]
- 35.Gegenfurtner KR, Kiper DC, Levitt JB. Analysis of color and motion in macaque area V3. Soc Neurosci Abstr. 1994;20:1741. [Google Scholar]
- 36.Girard P, Salin PA, Bullier J. Visual activity in areas V3a and V3 during reversible inactivation of area V1 in the macaque monkey. J Neurophysiol. 1991;66:1493–1503. doi: 10.1152/jn.1991.66.5.1493. [DOI] [PubMed] [Google Scholar]
- 37.Grinvald A, Lieke EE, Frostig RD, Hildesheim R. Cortical point-spread function and long-range lateral interactions revealed by real-time optical imaging of macaque monkey primary visual cortex. J Neurosci. 1994;14:3545–2568. doi: 10.1523/JNEUROSCI.14-05-02545.1994. [DOI] [PMC free article] [PubMed] [Google Scholar]
- 38.Hawken MJ, Parker AJ, Lund JS. Laminar organization and contrast sensitivity of direction-selective cells in the striate cortex of the Old World monkey. J Neurosci. 1988;8:3541–3548. doi: 10.1523/JNEUROSCI.08-10-03541.1988. [DOI] [PMC free article] [PubMed] [Google Scholar]
- 39.Jacobs GH. Primate photopigments and primate color vision. Proc Natl Acad Sci USA. 1996;93:577–581. doi: 10.1073/pnas.93.2.577. [DOI] [PMC free article] [PubMed] [Google Scholar]
- 40.Joris PX, Raiguel SE, Xiao DK, Orban GA (1997) Responses in macaque area V3A to moving random dot patterns. Soc Neurosci Abstr 23, in press.
- 41.Jiang A, Kennedy DN, Baker JR, Weiskoff RM, Tootell RBH, Woods RP, Benson RR, Kwong KK, Brady TJ, Rosen BR, Belliveau JW. Motion detection and correction in functional MR imaging. Hum Brain Mapp. 1995;3:224–235. [Google Scholar]
- 42.Kaas JH. Human visual cortex: progress and puzzles. Curr Biol. 1995a;5:1126–1128. doi: 10.1016/s0960-9822(95)00228-4. [DOI] [PubMed] [Google Scholar]
- 43.Kaas JH. The evolution of the isocortex. Brain Behav Evol. 1995b;46:187–196. doi: 10.1159/000113273. [DOI] [PubMed] [Google Scholar]
- 44.Kaas JH, Krubitzer LA. Neuroanatomy of the visual pathways and their development. In: Dreher B, Robinson SR, editors. Vision and visual dysfunction, Vol 3. CRC; Boca Raton, FL: 1991. pp. 302–323. [Google Scholar]
- 45.Koch C, Tootell RBH. Stimulating brain but not mind. Nature. 1966;383:301–303. doi: 10.1038/383301a0. [DOI] [PubMed] [Google Scholar]
- 46.Krubitzer LA, Kaas JH. The dorsomedial visual area of owl monkey: connections, myeloarchitecture, and homologies in other primates. J Comp Neurol. 1993;334:497–528. doi: 10.1002/cne.903340402. [DOI] [PubMed] [Google Scholar]
- 47.Kwong KK, Belliveau JW, Chesler DA, Goldberg IE, Weiskoff RM, Poncelet BP, Kennedy DN, Hoppel BE, Cohen MS, Turner R, Rosen BR, Brady TJ. Dynamic magnetic resonance imaging of human brain activity during primary sensory stimulation. Proc Natl Acad Sci USA. 1992;89:5675–5679. doi: 10.1073/pnas.89.12.5675. [DOI] [PMC free article] [PubMed] [Google Scholar]
- 48.Lund JS, Boothe RG. Interlaminar connections and pyramidal neuron organization in the visual cortex, area 17, of the macaque monkey. J Comp Neurol. 1975;159:305–334. [Google Scholar]
- 49.Maunsell JH, Newsome WT. Visual processing in monkey extrastriate cortex. Annu Rev Neurosci. 1987;10:363–401. doi: 10.1146/annurev.ne.10.030187.002051. [DOI] [PubMed] [Google Scholar]
- 50.McCarthy G, Spicer M, Adrignolo A, Luby M, Gore J, Allison T. Brain activation associated with visual motion studied by functional magnetic resonance imaging in humans. Hum Brain Mapp. 1995;2:234–243. [Google Scholar]
- 51.McKeefry DJ, Zeki S. Mapping and topographic organization of the visual field in human area V4 as revealed by fMRI. NeuroImage. 1997;5:S1. [Google Scholar]
- 52.Newsome WT, Maunsell JHR, Van Essen DC. Ventral posterior visual area of the macaque: visual topography and areal boundaries. J Comp Neurol. 1986;252:139–153. doi: 10.1002/cne.902520202. [DOI] [PubMed] [Google Scholar]
- 53.Ogawa S, Tank DW, Menon R, Ellerman JM, Kim SG, Merkle H, Ugurbil K. Intrinsic signal changes accompanying sensory stimulation: functional brain mapping with magnetic resonance imaging. Proc Natl Acad Sci USA. 1992;89:5951–5955. doi: 10.1073/pnas.89.13.5951. [DOI] [PMC free article] [PubMed] [Google Scholar]
- 54.Reppas JB, Niyogi S, Dale AM, Sereno MI, Tootell RBH. Representation of motion boundaries in retinotopic human visual cortical areas. Nature. 1997;388:175–179. doi: 10.1038/40633. [DOI] [PubMed] [Google Scholar]
- 55.Roe AW, Ts’o D. Visual topography in primate V2: multiple representation across functional stripes. J Neurosci. 1995;15:3689–3715. doi: 10.1523/JNEUROSCI.15-05-03689.1995. [DOI] [PMC free article] [PubMed] [Google Scholar]
- 56.Schneider W, Noll DC, Cohen JD. Functional topographic mapping of the cortical ribbon in human vision with conventional MRI scanners. Nature. 1993;365:150–153. doi: 10.1038/365150a0. [DOI] [PubMed] [Google Scholar]
- 57.Sclar G, Maunsell JHR, Lennie P. Coding of image contrast in central visual pathways of the macaque monkey. Vision Res. 1990;30:1–10. doi: 10.1016/0042-6989(90)90123-3. [DOI] [PubMed] [Google Scholar]
- 58.Sereno MI, McDonald CT, Allman JM. Analysis of retinotopic maps in extrastriate cortex. Cereb Cortex. 1994;4:601–620. doi: 10.1093/cercor/4.6.601. [DOI] [PubMed] [Google Scholar]
- 59.Sereno MI, Dale AM, Reppas JB, Kwong KK, Belliveau JW, Brady TJ, Rosen BR, Tootell RBH. Borders of multiple visual areas in humans revealed by functional magnetic resonance imaging. Science. 1995;268:889–893. doi: 10.1126/science.7754376. [DOI] [PubMed] [Google Scholar]
- 60.Shipp S, de Jong BM, Zihl J, Frackowiak RS, Zeki S. The brain activity related to residual motion vision in a patient with bilateral lesions of V5. Brain. 1994;117:1023–1038. doi: 10.1093/brain/117.5.1023. [DOI] [PubMed] [Google Scholar]
- 61.Shipp S, Watson JDG, Frackowiak RSV, Zeki S. Retinotopic maps in human prestriate visual cortex: the demarcation of areas V2 and V3. NeuroImage. 1995;2:125–132. doi: 10.1006/nimg.1995.1015. [DOI] [PubMed] [Google Scholar]
- 62.Stensaas SS, Eddington DK, Dobelle WH. Topography of the human visual cortex. J Neurosurg. 1974;40:747–751. doi: 10.3171/jns.1974.40.6.0747. [DOI] [PubMed] [Google Scholar]
- 63.Stepniewska I, Kaas JH. Topographic patterns of V2 cortical connections in macaque monkeys. J Comp Neurol. 1996;371:129–152. doi: 10.1002/(SICI)1096-9861(19960715)371:1<129::AID-CNE8>3.0.CO;2-5. [DOI] [PubMed] [Google Scholar]
- 64.Talairach J, Tournoux P. Co-planar stereotaxic atlas of the human brain. Thieme Medical; New York: 1988. [Google Scholar]
- 65.Tootell RBH, Hamilton SL. Functional anatomy of the second cortical visual area (V2) in the macaque. J Neurosci. 1989;9:2620–2644. doi: 10.1523/JNEUROSCI.09-08-02620.1989. [DOI] [PMC free article] [PubMed] [Google Scholar]
- 66.Tootell RBH, Taylor JB. Anatomical evidence for MT and additional cortical visual areas in humans. Cereb Cortex. 1995;5:39–55. doi: 10.1093/cercor/5.1.39. [DOI] [PubMed] [Google Scholar]
- 67.Tootell RBH, Siverman MS, Hamilton SL, Switkes E. Functional anatomy of macaque striate cortex. II. Retinotopic position. J Neurosci. 1988;8:1531–1568. doi: 10.1523/JNEUROSCI.08-05-01531.1988. [DOI] [PMC free article] [PubMed] [Google Scholar]
- 68.Tootell RBH, Reppas JB, Kwong KK, Malach R, Born RT, Brady TJ, Rosen BR, Belliveau JW. Functional analysis of human MT and related visual cortical areas using magnetic resonance imaging. J Neurosci. 1995a;15:3215–3230. doi: 10.1523/JNEUROSCI.15-04-03215.1995. [DOI] [PMC free article] [PubMed] [Google Scholar]
- 69.Tootell RBH, Reppas JB, Dale AM, Malach R, Look RB, Jiang HJ, Brady TJ, Rosen BR. Visual motion aftereffect in human cortical area MT/V5 revealed by functional magnetic resonance imaging. Nature. 1995b;375:139–141. doi: 10.1038/375139a0. [DOI] [PubMed] [Google Scholar]
- 70.Tootell RBH, Dale AM, Mendola JD, Reppas JB, Sereno MI. fMRI analysis of human visual cortical area V3A. NeuroImage. 1996a;3:S358. [Google Scholar]
- 71.Tootell RBH, Dale AM, Sereno MI, Malach R. New images from human visual cortex. Trends Neurosci. 1996b;19:481–489. doi: 10.1016/S0166-2236(96)10053-9. [DOI] [PubMed] [Google Scholar]
- 72.Van Essen DC, Zeki SM. The topographic organization of rhesus monkey prestriate cortex. J Physiol (Lond) 1978;277:193–226. doi: 10.1113/jphysiol.1978.sp012269. [DOI] [PMC free article] [PubMed] [Google Scholar]
- 73.Van Essen DC, Newsome WT, Maunsell JHR, Bixby JL. The projections from striate cortex (V1) to areas V2 and V3 in the macaque monkey: asymmetries, areal boundaries, and patchy connections. J Comp Neurol. 1986;244:451–480. doi: 10.1002/cne.902440405. [DOI] [PubMed] [Google Scholar]
- 74.Van Essen DC, Felleman DF, DeYoe EA, Olavarria J, Knierim JJ. Modular and hierarchical organization of extrastriate visual cortex in the macaque monkey. Cold Spring Harb Symp Quant Biol. 1990;55:679–696. doi: 10.1101/sqb.1990.055.01.064. [DOI] [PubMed] [Google Scholar]
- 75.Van Essen DC, Anderson CH, Felleman DJ. Information processing in the primate visual system: an integrated systems perspective. Science. 1992;255:419–423. doi: 10.1126/science.1734518. [DOI] [PubMed] [Google Scholar]
- 76.Watson JDG, Myers R, Frackowiak RSJ, Hajnal JV, Woods RP, Mazziotta JC, Shipp S, Zeki S. Area V5 of the human brain: evidence from a combined study using positron emission tomography and magnetic resonance imaging. Cereb Cortex. 1993;3:79–94. doi: 10.1093/cercor/3.2.79. [DOI] [PubMed] [Google Scholar]
- 77.Woods RP, Cherry SR, Mazziotta JC. Rapid automated algorithm for aligning and reslicing PET images. J Comput Assist Tomogr. 1992;16:620–633. doi: 10.1097/00004728-199207000-00024. [DOI] [PubMed] [Google Scholar]
- 78.Yoshioka T, Levitt JB, Lund JS. Independence and merger of thalamocortical channels within macaque monkey primary visual cortex: anatomy of interlaminar projections. Vis Neurosci. 1994;11:467–489. doi: 10.1017/s0952523800002406. [DOI] [PubMed] [Google Scholar]
- 79.Zeki SM. Uniformity and diversity of structure and function in rhesus monkey prestriate visual cortex. J Physiol (Lond) 1978a;277:273–290. doi: 10.1113/jphysiol.1978.sp012272. [DOI] [PMC free article] [PubMed] [Google Scholar]
- 80.Zeki SM. The third visual complex of rhesus monkey prestriate cortex. J Physiol (Lond) 1978b;277:245–272. doi: 10.1113/jphysiol.1978.sp012271. [DOI] [PMC free article] [PubMed] [Google Scholar]