

Abstract
We investigated the modulation of the skeletal muscle L-type Ca2+ channel/dihydropyridine receptor in response to insulin-like growth factor-1 receptor (IGF-1R) activation in single extensor digitorum longus muscle fibers from adult C57BL/6 mice. The L-type Ca2+ channel activity in its dual role as a voltage sensor and a selective Ca2+-conducting pore was recorded in voltage-clamp conditions. Peak Ca2+current amplitude consistently increased after exposure to 20 ng/ml IGF-1 (EC50 = 5.6 ± 1.8 nm). Peak IGF-1 effect on current amplitude at −20 mV was 210 ± 18% of the control. Ca2+ current potentiation resulted from a shift in 13 mV of the Ca2+ current–voltage relationship toward more negative potentials. The IGF-1-induced facilitation of the Ca2+ current was not associated with an effect on charge movement amplitude and/or voltage distribution. These phenomena suggest that the L-type Ca2+ channel structures involved in voltage sensing are not involved in the response to the growth factor. The modulatory effect of IGF-1 on L-type Ca2+ channel was blocked by tyrosine kinase and PKC inhibitors, but not by a cAMP-dependent protein kinase inhibitor. IGF-1-dependent phosphorylation of the L-type Ca2+ channel α1 subunit was demonstrated by incorporation of [γ-32P]ATP to monolayers of adult fast-twitch skeletal muscles. IGF-1 induced phosphorylation of a protein at the 165 kDa band, corresponding to the L-type Ca2+ channel α1 subunit. These results show that the activation of the IGF-1R facilitates skeletal muscle L-type Ca2+ channel activity via a PKC-dependent phosphorylation mechanism.
Keywords: insulin-like growth factor, calcium channel, skeletal muscle, muscle fiber, phosphorylation
IGF-1 is a peptide structurally related to proinsulin and has a primary role in promoting the differentiation and growth of skeletal muscle, effects that occur in a relatively slow time scale (delayed effects) (Florini et al., 1996). Manipulation of IGF-1 expression in vivo and in vitro provides fundamental clues about its action on skeletal muscle growth and differentiation (DeVol et al., 1990; Vandenburgh et al., 1991; Coleman et al., 1995). In addition to the delayed effects on cellular trophism, it has been shown that IGF-1 stimulates Ca2+ influx in clonal pituitary and neuroblastoma cell lines (Kleppisch et al., 1992; Selinfreund and Blair, 1994). Although IGF-1 also exerts potent trophic and developmental effects on skeletal muscle (Cohick and Clemmons, 1993), modulatory effects of IGF-1 on skeletal muscle Ca2+ channels have not been studied.
Because of the role of Ca2+ ions in mediating and/or triggering short- and long-lasting cellular responses (Berridge, 1993), it is relevant to identify the signaling pathway linking trophic factor receptor activation and voltage-gated Ca2+ channel function. In skeletal muscle the L-type Ca2+channel, a dihydropyridine-sensitive subtype, serves in its dual role as a voltage sensor and a pore-conducting Ca2+ ion pathway. Both functions reside in the α1 subunit, resulting from the expression of the α1S gene (Tanabe et al., 1987). The L-type Ca2+ channel, as a voltage sensor, releases Ca2+ from the sarcoplasmic reticulum as a result of interaction with the ryanodine receptor (RYR1) (Meissner, 1995; Delbono and Meissner, 1996). As a pore-conducting pathway for Ca2+ ions, the L-type channel may participate in the activation of long-lasting intracellular signaling cascades, relevant for muscle fiber differentiation and trophism at different stages of ontogenic development. Phosphorylation potentiates Ca2+ influx through voltage-gated Ca2+ channels (Sculptoreanu et al., 1993). Intracellular Ca2+ elevations have been involved in sustained kinase activation and signaling to the nucleus with consequent modulation of gene expression (Nishizuka, 1995). The force of muscle contraction can be modified according to the duration and frequency of stimulation. During single twitches, contraction is not dependent on extracellular Ca2+, and the L-type Ca2+ channels may function only as voltage sensors. However, prolonged or repetitive contractions are dependent on extracellular Ca2+ and are sensitive to L-type Ca2+ channel antagonists (Kotsias et al., 1986;Dulhunty et al., 1988; Sculptoreanu et al., 1993). Ca2+ entry through this channel is thought to replenish intracellular Ca2+ (Oz et al., 1991). Also, a phosphorylation-dependent potentiation of this current increased contractile force (Schmid et al., 1985; Arreola et al., 1987;Huerta et al., 1991).
In the present work we determined whether the skeletal muscle L-type Ca2+ channel dihydropyridine receptor is a potential target for the IGF-1R, based on the observation that tyrosine kinase-linked receptors promote phosphorylation of diverse cellular proteins and that the L-type Ca2+ channel undergoes phosphorylation at defined consensus sequences (see below). In this paper we report the novel finding that the L-type Ca2+ channel can be phosphorylated in adult living skeletal muscle by Ca2+-independent protein kinase C (PKC) isoforms on IGF-1R activation.
MATERIALS AND METHODS
Single skeletal muscle fiber isolation. Single extensor digitorum longus (EDL) muscle fibers from 14-month-old C57BL/6 mice were used. Mice were obtained from the National Center for Toxicological Research (Jefferson, AK). Animals were housed in a pathogen-free area at The Bowman Gray School of Medicine (BGSM; Winston-Salem, NC) until the day of experimentation. Animal handling and procedures followed an approved protocol by the Animal Care and Use Committee of BGSM. Muscles were dissected after the mice were decapitated. Anesthesia was not provided because the effects of anesthetics on the specific endpoints of our research are not characterized. In addition, procedures were optimized to minimize animal pain or discomfort. Electrophysiological recordings were performed within 5 hr of muscle dissection. Single fibers were dissected in “dissecting solution” and transferred to the recording chamber containing “mounting solution.” Fibers with a small radius (30–40 μm), representing 61 ± 5% (n = 10 EDL muscles) of the muscle fiber population, were selected to reduce nonuniformities in the voltage clamp of the T tubule membrane.
Monolayer of skeletal muscle preparation for phosphorylation studies. White (fast-twitch) leg muscles were dissected and rinsed in a modified Ringer’s solution (see Solutions and Materials) at room temperature. Whole muscles were transferred to a dissecting solution (described below), and multiple monolayers of skeletal muscle were dissected under a stereoscope. Connective tissue was removed carefully without damaging the cells. Skeletal muscle fiber monolayers were sectioned into smaller fragments of ∼500 μm length to facilitate the exchange of intracellular constituents. Short muscle monolayers were stored in a phosphate-free solution similar to the intracellular solution used for Ca2+ current recording (see below). The following protease inhibitors were added to the phosphate-free solution and solubilization buffer: phenylmethylsulfonyl fluoride (0.2 mm), aprotinin (100 nm), leupeptin (1 μm), pepstatin (1 μm), and diisopropyl fluorophosphate (1 mm).
L-type Ca2+ channel α1 subunit phosphorylation. Phosphorylation studies were performed, using conditions optimized in previous studies (O’Callahan et al., 1988;Chang et al., 1991). Muscle monolayers were preincubated for 20 min at room temperature in phosphate-free solution and for another 15 min in the same solution to which 50 μCi of [γ-32P]ATP (specific activity of 10 Ci/mmol) was added. The phosphorylation reaction was initiated by adding IGF-1 to a final concentration of 20 ng/ml for 20 min and was stopped with two volumes of stop buffer containing (in mm) 50 HEPES-NaOH, pH 7.4, 50 NaF, and 20 EDTA plus protease inhibitors. The radiolabeled muscle fibers were washed three times with phosphate-free and low Ca2+buffer (see below) and were homogenized in a Thomas Tissue grinder (Hand homogenizer) 3431-E20 (A. H. Thomas, Philadelphia, PA) with 20 hand strokes. Protein concentration of the homogenate was estimated by Coomassie protein assay, using bovine serum albumin as the protein calibration standard. The homogenate was mixed with an equal volume of 2× sample buffer containing 62.5 mm Tris-HCl, 2% SDS, 100 mm DTT, 10% glycerol, and 0.02% bromophenol blue. The sample prepared for sodium dodecyl sulfate (SDS) gel electrophoresis was boiled for 5 min at 95°C, cooled for 5 min, and centrifuged in a microfuge at 5000 rpm for 3 min. Gradient electrophoresis was performed in a 5–15% SDS polyacrylamide gel, stained with Coomassie blue, and destained to visualize the proteins. From a 200 mg pool of skeletal muscle monolayers, 0.8–1.6 μg of protein was obtained. In all of the experiments, 100 μg protein/lane was loaded. SDS-PAGE 42,699–200,000 (Bio-Rad, Richmond, CA) was used as a high molecular range standard. Protein molecular weight calculation was performed by logarithmic extrapolation. The gel was incubated with 10% glycerol for 2 hr and dried at 55°C for 2 hr under vacuum. Gels were subjected to autoradiography, using Kodak X-Omat film and Cronex enhancing screens for 3 d. For quantitation of protein phosphorylation in films, the average density of pixels across the band width was integrated over the band height with an optical scanner. For this analysis a Pdi image system, together with Quantity One 2.6 software (New York, NY), was used. The magnitude of protein phosphorylation was expressed as the integral of the optical density (O.D. × mm2).
L-type Ca2+ channel α1 subunit antibody coupling to Sepharose 4B and immunoprecipitation. For antibody coupling to Sepharose 4B, 100 mg of freeze-dried cyanogen bromide-activated Sepharose 4B powder was suspended in 5 ml of ice-cold 1 mm HCl for 15 min and then washed four times with 5 ml of ice-cold 1 mm HCl. The final aliquot of 1 mmHCl was aspirated from the beads, and then the beads were transferred immediately to mouse monoclonal antibody specific for L-type Ca2+ channel α1 subunit (Chemicon, Temecula, CA). A total of 100 ml of monoclonal antibody was mixed previously with 4× coupling buffer containing 0.1 mNaHCO3, pH 8.3, and 0.5 m NaCl to facilitate the coupling of antibody to the beads and to yield a volume of 0.5 ml of beads. The beads in antibody solution were mixed in an end-over-end mixer overnight at 4°C. The beads were centrifuged at low speed, transferred to a buffer with blocking agent (0.2m glycine, pH 8.0), and mixed for 16 hr at 4°C to block the remaining active groups. To remove the excess uncoupled ligand, we washed the adsorbent alternately with high pH coupling buffer and a low pH acetate buffer solution five times. The low pH buffer solution contained 0.1 m acetate and 0.5 m NaCl, pH 4.0. Antibody/Sepharose 4B beads were stored at 4°C in PBS buffer in the presence of 1 mm sodium azide. Muscle fibers were phosphorylated as described before but homogenized in 25 mmNaKPO4 (20 mm Na2HPO4plus 5 mm KH2PO4), 20 mm NaF, and 0.1% digitonin to prevent dephosphorylation during immunoprecipitation (Gutierrez et al., 1991). The antibody/Sepharose 4B beads were washed five times with incubation buffer consisting of (in mm) 25 NaKPO4, 20 NaF, and 200 NaCl with 0.1% digitonin and 1 mg/ml bovine serum albumin; then the beads were incubated with muscle homogenate (2 mg of protein equivalent of muscle homogenate was added to 200 ml of Sepharose 4B beads) at 4°C overnight. The beads were washed three times with incubation buffer, and the immunoprecipitated proteins were eluted by boiling the beads in SDS sample buffer before analysis by SDS gel electrophoresis, immunoblot, and autoradiography. The extent of immunoprecipitation was estimated from an analysis of the supernatant in SDS-PAGE.
Muscle fiber voltage-clamp, ionic current, and charge movement recording. EDL fibers were voltage-clamped, using the double Vaseline gap technique at a holding potential (Vh) of −90 mV, as described previously (Delbono, 1992). This technique has been used for adult skeletal muscle voltage clamp in the present work because it was demonstrated that the double Vaseline gap resulted in an improvement in the frequency response, compensation for external series resistance, and compensation for the complex impedance of the current-passing pathway, as compared with other potentiometric methods (Hille and Campbell, 1976). Since these initial reports, the double Vaseline gap technique has been used for charge movement and ICa recordings in mature amphibian and mammalian fibers (Hui and Chandler, 1990; Delbono, 1992). For voltage-clamp recordings a muscle fiber was mounted in the recording chamber. Two Vaseline strands separated a central pool, equilibrated with the “external solution,” from lateral compartments, equilibrated with the “internal solution.” Glass bridges containing agar equilibrated in 1 m-KCl provided electrical connections between each compartment, and separate wells were filled with 3 m KCl and fit with Ag-AgCl pellets. Command pulses referred to ground were applied at the central pool. The current was injected into one of the end pools via a variable gain feedback amplifier. The negative input of the amplifier was connected to the other end pool. Passive muscle membrane properties were measured according to Irving et al. (1987). Temperature was maintained at 22°C throughout the experiments and monitored with a thermistor probe positioned close to the fiber in the middle pool.
For charge movement recording, 1 μm nifedipine was preferred over divalent cations such as Co2+ and/or Cd2+. We found the use of nifedipine less deleterious to the fiber than the use of Co2+ and/or Cd2+ at the concentrations required to block the ionic current completely (2 and 1 mm). We selected a procedure to block the ionic current with less deleterious effect on the integral of the charge movement and on the passive membrane properties. Nifedipine induced a decrease in the integral of the charge movement recorded 1 hr after complete blockade of the ionic conductance, which was 15 ± 4.2% of control (n = 7). The decrease induced by the combination of Co2+and Cd2+ was 31 ± 2.4% (n = 7). Co2+ plus Cd2+ also promoted a higher increase in the holding current than nifedipine. The range of increase was 20–35 nA (n = 7) and −5–20 nA (n = 8), respectively. Membrane current during a voltage pulse (P) initially was corrected by analog subtraction of linear components. The remaining linear components were subtracted digitally by automated scaling of control pulses, which were −¼ of P (Bezanilla, 1986; Delbono et al., 1991).
The inward Ca2+ current (ICa)–voltage relationship was fit to the following equation:
| Equation 1 |
where V is the membrane potential,Vr is the extrapolated reversal potential,V1/2 is the half-activation potential, F is the Faraday constant, R is the gas constant, and T is the absolute temperature (296°K).
For the analysis of the voltage dependence of charge movement, the following equation was used:
| Equation 2 |
where Vm is the membrane potential,Vr is the extrapolated reversal potential,Qmax is the maximum charge andV1/2Q is the charge movement half-activation potential, F is the Faraday constant, R is the gas constant, T is the absolute temperature (296°K), and z is the effective valence.
Cell capacitance was monitored throughout the experiments by applying brief hyperpolarizing pulses from a holding potential of −90 to −110 mV for 25 msec. Cell capacitance, expressed in F (Faraday), was calculated from the integral of the current transients and the amplitude of the voltage step. The specific membrane capacity, expressed in F/cm2, represents the cell capacitance normalized to the fiber cross-sectional area.
For data acquisition a personal computer was used. D–A and A–D conversions were done with a Digidata 1200 acquisition board and interface (Axon Instruments, Foster City, CA). Stimulation protocols are detailed in Results for each group of experiments. Currents were sampled at 5–10 kHz according to the stimulation protocol and filtered at 0.3 of the sampling frequency (−3 dB point) with a four-pole Butterworth low-pass filter (Frequency Devices, Haverhill, MA). Membrane currents were normalized to membrane capacitance (amperes per farad).
A dose–reponse curve was obtained by a nonlinear least-squares fit of a four-parameter function, using a nonlinear curve-fitting procedure (SigmaPlot, Jansen, San Rafael, CA), where:
| Equation 3 |
with I being the initial level and F the final saturating level (Selinfreund and Blair, 1994). Experimental data are expressed as mean ± SEM.
Solutions and materials. The extracellular solution forICa and charge movement recording contained (in mM): 150 TEA (tetraethylammonium hydroxide) CH3SO3 (methanesulfonic acid), 2 CaCl2, 2 MgCl2, 5 TEA HEPES, 0.001 tetrodotoxin, 1 9-anthracenecarboxylic acid, and 1 3,4-diaminopyridine. For charge movement recording, 1 μmnifedipine (Sigma, St. Louis, MO) was added from a stock prepared in ethanol and handled in the dark. The intracellular solution contained (in mm) 120 Na-glutamate, 15 Na2-EGTA, 3 Mg-ATP, 5 Na2-phosphocreatine, 10 Na-HEPES, and 10 glucose, pH 7.4, at 300 mOsm. The modified Ringer’s solution contained (in mm) 145 NaCl, 5 KCl, 2.5 CaCl2, 1 MgSO4, 10 Na-HEPES, and 10 glucose. The dissecting solution contained (in mm) 95 K2SO4, 10 MgCl2, 0.4 CaCl2, and 10 Na-HEPES. The mounting solution contained (in mm) 150 K-glutamate, 2 MgCl2, 1 K2-EGTA, and 10 K-HEPES. The phosphate-free solution contained (in mm) 98 K-glutamate, 0.1 K2-EGTA, 0.0082 CaCl2, 5.5 MgCl2, 5.0 glucose, and 5.0 HEPES-KOH. The pH was adjusted to 7.4 in all of the solutions. Osmolarity was fixed to 300 mOsm. GF-109203X was kindly provided by Dr. Linda McPhail (Department of Biochemistry, BGSM). Human recombinant IGF-1 was purchased from Research Biochemicals (Natick, MA). Phorbol-12-myristate, 13-acetate (PMA), 4α-phorbol, genistein, PKC inhibitor peptide 19-36, daidzein, and herbimycin A were all purchased from Calbiochem (La Jolla, CA). cAMP-dependent protein kinase A inhibitor 5-24 and fura-2 pentapotassium salt were purchased from Peninsula (Belmont, CA) and Molecular Probes (Eugene, OR), respectively. The anti-phosphotyrosine antibody 4G10 was purchased from Upstate Biotechnology (Lake Placid, NY).
Statistical analysis. Data were analyzed by paired and unpaired Student’s t test, one-way ANOVA with Student–Newman–Keuls test, as indicated for each group of experiments.
RESULTS
IGF-1 increases Ca2+ current through L-type Ca2+ channels
The activity of the dihydropyridine-sensitive Ca2+ channel was recorded with Ca2+ as the charge carrier. Ca2+channels were activated repetitively by 60 msec test depolarizations to −10 or −20 mV from a holding potential (Vh) of −90 mV. Despite the lower IGF-1-induced ICa (calcium current) potentiation at −20 than at −30 mV, repetitive single-pulse stimulation was performed at −20 mV, because 60 msec pulses at −30 mV evoked smaller currents in control conditions (see below). Ca2+channel activity was studied in paralyzed single muscle fibers. Fibers were immobilized by strong myoplasmic Ca2+ chelation with 15 mm EGTA added to the internal solution. Simultaneous intracellular Ca2+ concentration measurements were performed in a group of experiments, using a 50 μm concentration of the high-affinity Ca2+ indicator fura-2. The peak myoplasmic Ca2+ concentration in 15 mm EGTA was 108 ± 11 nm (n = 7). These results did not differ significantly from separate control studies (without EGTA) (117 ± 15 nm, n = 7;p > 0.05). In these experimental conditions the preparation was stable and maintained the sarcolemmal electrical properties for >1 hr. The holding current ranged from −5 to 20 nA, and ICa amplitude and charge movement (Q) were within 92 ± 2.8% (n = 30) of the initial values 1 hr after the fiber was voltage-clamped in control experiments (without exposure to IGF-1). Muscle fiber capacitance, calculated from the integral of the current transients and the amplitude of the voltage step, and the specific membrane capacity did not change significantly throughout the experiment. Specific membrane capacity at the beginning of the experiments (switch from current-clamp to voltage-clamp mode) was 6.8 ± 0.4 F/cm2, whereas at the end its value was 6.5 ± 0.7 F/cm2 (n = 30). IGF-1 was diluted to a final concentration of 20 ng/ml in the external solution and was applied to the muscle fiber by completely exchanging the bathing solution three times in 30 sec. Because the IGF-1R binds IGF-1 with high affinity and IGF-II and insulin with lower affinity (De Pablo et al., 1990), we tested the effect of insulin and IGF-II onIca amplitude. Both insulin and IGF-II failed to promote Ica potentiation at 20 ng/ml. The ratio between peak ICa amplitude in the presence and absence of insulin or IGF-II at 15 min after adding the factor was 0.96 ± 0.11 (n = 5; p > 0.5) and 0.95 ± 0.16 (n = 6; p > 0.5), respectively. These results are in agreement with previous publications in which insulin was two orders of magnitude less potent than IGF-1, and IGF-II was completely ineffective in modulating the electrical properties of GH4C1 cells and cerebellar granular cells (Selinfreund et al., 1994). The IGF-1 concentration used in this study was within the range known to promote muscle cell proliferation and differentiation in vitro (Allen et al., 1985) and to increase ICa in clonal pituitary cells (Selinfreund and Blair, 1994). Single depolarizing pulses were applied to the fiber every 30 sec, and the peakICa amplitude during the pulse was computed. Corrected ICa values to membrane capacitance were normalized to the maximum amplitude at the end of the pulse and averaged (Fig. 1A). A complete solution exchange with the same bathing solution (Fig.1A) was performed systematically as a control before IGF-1 application. Peak ICa amplitude consistently increased within the first 30 sec after exposure to the growth factor, reaching a maximum effect in 5–7 min and persisting after its removal (c). Peak IGF-1 effect onICa amplitude was 2.1 ± 0.18 times the control. The IGF-1 effect on peak Ica continued up to 30 min after its removal from the bathing solution. At that time the effect was sustained in 1.9 ± 0.25 of the control. Brief hyperpolarizing pulses elicited by 25 msec pulses fromVh to −110 mV showed no significant changes in sarcolemmal linear capacitive transient as an indication of the lack of alterations in the membrane passive properties throughout the experiment. The values corresponding to the first and second capacitive transients are 6.6 and 6.4 F/cm2, respectively. Figure 1B illustrates the IGF-1-mediatedICa potentiation within the period indicated in Figure 1A. A sequence of repetitive pulses before the drug application (b) was used as the baseline for data normalization. The initial upper deflection, followed by two downward deflections, corresponds to charge movement ICaduring fiber depolarization and tail current after repolarization, respectively. A clear and significant effect onICa amplitude during the pulse and on the tail current was detected after IGF-1 application (b) and removal (c). The effect of IGF-1 on ICapotentiation is dose-dependent. Figure 2shows the normalized peak Ica–IGF-1 concentration relationship. Experimental points were fit to Equation 3(see Materials and Methods), giving an EC50 value of 5.6 ± 1.8 nm (n = 6).
Fig. 1.
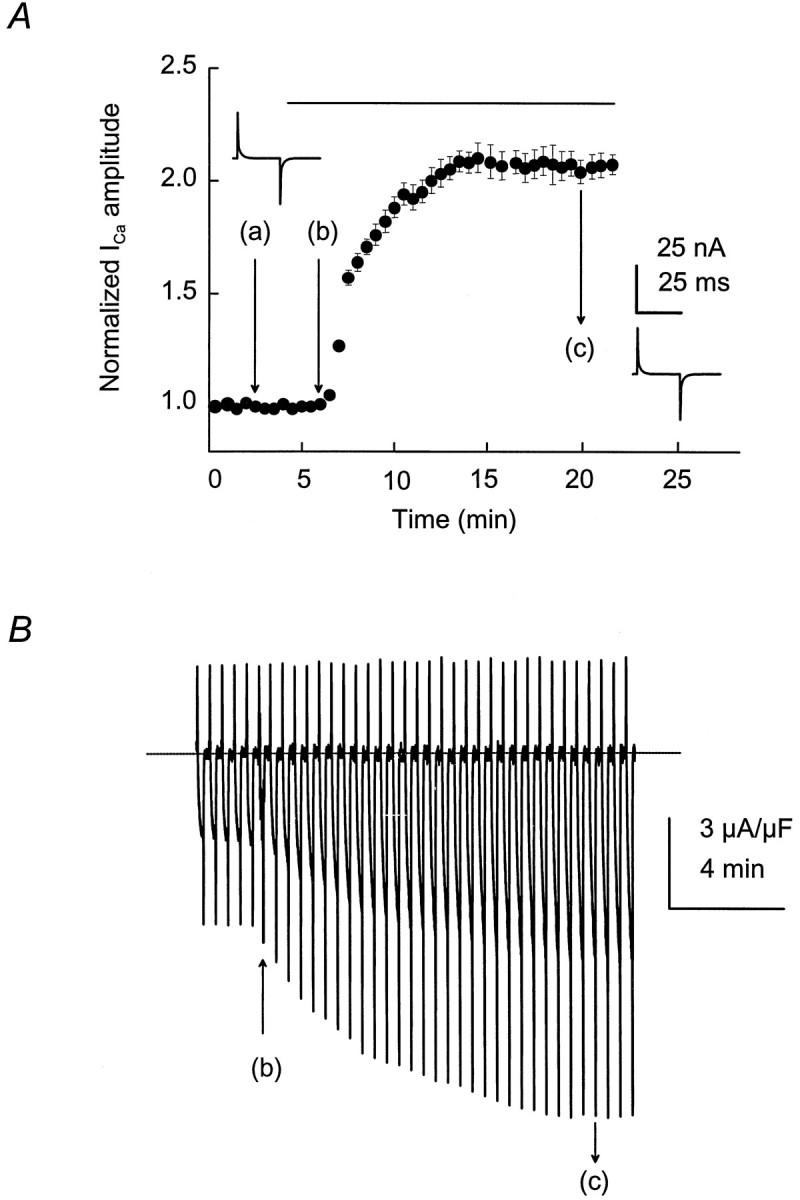
Time course of IGF-1-inducedICa potentiation in single skeletal muscle fibers. A, ICa was elicited by 60 msec depolarizing test pulses from aVh of −90 to −20 mV every 30 sec. A complete solution exchange with the same bathing solution was used as a control (a). IGF-1 (20 ng/ml) was applied inb and removed in c. Bothinsets illustrate the capacitive transient current in response to brief hyperpolarizations to −110 mV at time 0 and at 15 min after adding IGF-1 to the bathing solution. B, IGF-1-induced ICa potentiation during the time indicated in A. IGF-1 application and removal are depicted by arrows at b andc, respectively. The interruptedline indicates the baseline current.
Fig. 2.

IGF-1 induces ICapotentiation in a dose-dependent manner. ICawas elicited by 60 msec depolarizing test pulses from aVh of −90 to −20 mV every 30 sec. Increasing concentrations of IGF-1 were added to the muscle fiber. Data for individual fibers were fit to Equation 3 (see Materials and Methods). Average values for six complete experiments and fitting to mean values for each IGF-1 concentration are included in the plot.
These experiments support the concept that IGF-1R activation triggers an intracellular and/or membrane signaling cascade having the L-type Ca2+ channel as a target. It also can be postulated that the time course of the growth factor effect may result from a process of phosphorylation and dephosphorylation in which kinase activation and phosphatase activity result from IGF-1 binding to its specific tyrosine kinase-linked receptor. The lack of effect on charge movement, together with a potentiation ofICa, seems to exclude the possibility that IGF-1 alters the voltage sensor. These findings also suggest that phosphorylation of Ca2+ channel structures involved in Ca2+ permeation are a likely coupling mechanism to the IGF-1R. To test these concepts further, we assessed the role of protein kinases on L-type Ca2+ channel voltage-sensing function.
IGF-1 facilitates ICa activation without affecting the voltage sensor
The voltage distribution for ICa was studied, using 250 msec pulses, from a Vh = −90 mV, with 10 mV increments, from −80 to +30 mV. The voltage distribution for ICa was studied in control (before adding IGF-1) and 15 min after starting the incubation in IGF-1, a time at which a plateau for ICapotentiation was reached (see Fig. 1A). Figure3A showsICa control traces from −40 mV (threshold forICa activation) to 10 mV (saturating potential). The voltage distribution for ICa amplitude is similar to that described previously for mammalian skeletal muscle fibers (Delbono, 1992; Delbono et al., 1995). After exposure to IGF-1,ICa was potentiated significantly at negative voltages (−40 to −10 mV). Figure 3B also showsICa potentiation of the tail current amplitude. Tail current amplitudes, measured during the repolarization immediately after voltage-clamp steps, at −20 mV were −4.1 ± 0.51 and −8.3 ± 0.64 μA/μF in control and IGF-1, respectively (n = 12; p < 0.01). Tail current amplitudes at −30 mV were −1.3 ± 0.1 and −4.8 ± 0.03 μA/μF in control and IGF-1, respectively (n = 12;p < 0.01). Experiments in control and in response to IGF-1 were not significantly different from 0 to 30 mV. Results are consistent with measurements of tail currents over a voltage range applied after a constant depolarizing pulse. Tail current amplitudes at −20 mV were −4.7 ± 0.62 and −7.9 ± 0.43 μA/μF in control and IGF-1, respectively (n = 12;p < 0.01). Tail current amplitudes at −30 mV were −1.7 ± 0.14 and −5.2 ± 0.08 μA/μF in control and IGF-1, respectively (n = 12; p < 0.01). The voltage dependence of ICapotentiation is shown in Figure 3C, where control (filled circles) and IGF-1 (open circles) experiments were plotted (n = 20).ICa amplitude during the pulse was augmented twofold at −20 mV and fourfold at −30 mV. At −20 mV, the values for control and IGF-1 were −1.4 ± 0.03 and −2.9 ± 0.05 μA/μF, respectively, and at −30 mV the values were −0.5 ± 0.06 and −2.1 ± 0.07 μA/μF, respectively (p < 0.01). Gmax andV1/2 were obtained by fitting theIca–voltage relationship to Equation 1 (see Materials and Methods). Gmax was potentiated significantly in approximately fourfold, and ICapotentiation resulted from a shift in 13 mV of theICa–voltage relationship toward more negative potentials in response to IGF-1 (Table1).
Fig. 3.

IGF-1 facilitates ICaactivation. ICa was elicited by 250 msec depolarizations from a Vh of −90 mV, with 10 mV increments, from −80 to +30 mV. ICawas recorded in a range of membrane potentials (from −40 to +10 mV), before (A) and after exposure to IGF-1 (15 min; B). Offsets were imposed to the traces to better observe tail current amplitude. The interrupted lineindicates the baseline current. C, PeakICa–V relationship in control (filled circles) and in IGF-1 (open circles). Experimental points (mean ± SEM) were fit to Equation 1 included in Materials and Methods (n = 20; p < 0.01 from −40 to −10 mV).
Table 1.
Average of best-fit parameters describing the voltage dependence of Ca2+ current and charge movement
| Gmax (nS/nF) | V1/2(mV) | Qmax (pC/nF) | V1/2Q(mV) | zQ | |
|---|---|---|---|---|---|
| Control | 55 ± 6.3 | −18.8 ± 2.1 | 10.6 ± 2.2 | −45.5 ± 3.8 | 2.1 ± 0.1 |
| IGF-1 | 245 ± 39 | −32.2 ± 2.8 | 11.9 ± 2.7 | −45.7 ± 4.1 | 2.1 ± 0.2 |
| (*) | (*) |
Differences between Gmax andV1/2 in control and IGF-1 were statistically significant (p < 0.01).
Values are expressed as mean ± SEM.
To determine whether IGF-1 alters L-type Ca2+channel pore-conducting function as well as the voltage sensor, we performed a series of experiments after Ca2+conductance was blocked with 1 μm nifedipine. Figure4 illustrates charge movement traces from −70 to −10 mV in control (A) and after exposure to IGF-1 for 15 min (B; n = 15). Charge movement became measurable at −80 to −70 mV and saturated at −10 to 0 mV for both groups. The threshold values for charge movement were similar in both conditions, −70 ± 3.2 and −72 ± 2.9 mV (p > 0.5) in control and in IGF-1, respectively. IGF-1 did not change the voltage distribution significantly for the integral of the charge movement at the beginning of the pulse (charge ON; Fig. 4C). Experimental points were fit to Equation 2 (see Materials and Methods). The lack of statistically significant effect on Qmax,V1/2Q, and zQvalues (Table 1; p > 0.5) supports the concept that IGF-1 does not alter the voltage sensor.
Fig. 4.

IGF-1 does not alter the voltage sensor. Charge movement is in response to 120 msec duration pulses at the voltages indicated on the right. Charge movement traces are shown in control (A) and after exposure to IGF-1 for 15 min (B). The interrupted lineindicates the baseline current. C, Voltage distribution of the integral of the charge movement at the beginning of the pulse (charge ON) in control (filled circles) and in IGF-1 (open circles). Data points were fit to Equation 2detailed in Materials and Methods (n = 15;p > 0.5).
A potential effect of IGF-1 on the dihydropyridine-sensitive fraction of charge movement was explored. Ica was blocked completely with 2 mm Co2+ and 1 mm Cd2+, and 20 ng/ml IGF-1 was added subsequently. Charge movement parameters were measured 15 min after adding IGF-1 or the same volume of vehicle to the bathing solution.Qmax values in the presence and absence of IGF-1 were 8.8 ± 1.1 and 8.3 ± 1.5 pC/nF, respectively (not statistically significant). V1/2Q values in both experimental conditions were −44.8 ± 5.1 and −45.5 ± 4.4 mV, respectively (not statistically significant; p > 0.5; n = 10). The lack of effect of IGF-1 on the dihydropyridine-sensitive fraction of charge movement was confirmed by using 0.1 mm tetracaine as a ICablocker (Lamb, 1986) in a different set of experiments.Qmax values in the presence and absence of IGF-1 were 9.2 ± 1.4 and 8.9 ± 1.5 pC/nF, respectively (not statistically significant; p > 0.5).V1/2Q values in both experimental conditions were −43.4 ± 4.6 and −44.1 ± 3.7 mV (not statistically significant; n = 10).
IGF-1 promotes a facilitation of the channel activation that is manifest in a shift of the Ica–Vrelationship toward more negative potentials. This phenomenon is not associated with changes in the effective valence, suggesting that the transitions governing the movement of charged particles in the voltage sensor are not regulated by IGF-1. In summary, IGF-1-mediatedICa potentiation occurs via a direct effect on the structures involved in Ca2+ ion permeation, facilitating the channel activation, and not via an effect on the voltage sensor.
IGF-1-induced ICa potentiation is mediated by Ca2+-independent PKC isoforms
Tyrosine kinase activity, which is associated with the IGF-1R, suggests that the mechanism of interaction with other sarcolemmal proteins such as the L-type Ca2+ channel is via a phosphorylation mechanism. Phosphorylation sites for several protein kinases have been identified in skeletal muscle L-type Ca2+ channels but not for tyrosine kinase. This prompted us to explore the pathway for IGF-1-induced phosphorylation of the L-type Ca2+ channel α1 subunit underlyingICa up-modulation.
Figure 5 shows the lack of IGF-1 effect on ICa amplitude after muscle fiber incubation in an intracellular solution containing the tyrosine kinase inhibitor genistein (100 μm) (open circles) for 15–20 min. Neither genistein nor DMSO (used as a vehicle) had obvious deleterious effects on the sarcolemmal passive properties or onICa amplitude more than a slight expected run-down (Fig. 5A). In Figure 5 the lack of IGF-1 effect in the presence of genistein is compared with the profile of the IGF-1-mediated ICa potentiation shown in Figure1A (interrupted line). The magnitude ofICa enhancement in single-pulse experiments is illustrated in Figure 4B. ICatraces in control (c) and after exposure to IGF-1 (filled circles) are used as a reference for Figure5, C and D. C shows a slight decrease in ICa amplitude after exposure to genistein plus IGF-1 (open circle), as compared with control (c) (genistein alone). Peak ICa in control and 15 min after exposure to IGF-1 (in the presence of genistein) was −3.5 ± 0.11 and −2.9 ± 0.32 μA/μF (n = 15; p > 0.5), respectively. To ensure that the functional effect of genistein was not an structural effect, we tested the inactive analog daidzein. PeakICa in control and 15 min after exposure to IGF-1 (in the presence of 10 μm daidzein) was −3.5 ± 0.27 and −6.3 ± 0.35 μA/μF (n = 8;p > 0.5), respectively. The involvement of tyrosine kinase in current potentiation was confirmed by the enzyme inhibitor herbimycin A. Peak ICa in control and 15 min after exposure to IGF-1 (in the presence of 2 μmherbimycin A) was −4.1 ± 0.25 and −3.9 ± 0.32 μA/μF (n = 8; p > 0.5), respectively.
Fig. 5.

Tyrosine kinase and PKC inhibitors preclude IGF-1-induced potentiation of skeletal muscleICa. A, Lack of IGF-1 effect on ICa amplitude after muscle fiber incubation in an intracellular solution containing 100 μmgenistein (open circles) or 50 nm GF-109203X (filled diamonds) for 15–20 min before exposure to IGF-1. The effect of IGF and genistein or GF-109203X are compared with the effect of IGF-1 alone (dashed line, repeated from Fig. 1A). B–D,ICa in control (c) and after exposure to IGF-1 (filled circle), genistein (open circle), or GF-109203X (filled diamond). The interrupted line indicates the baseline current.
The blockade exerted by genistein and herbimycin A on IGF-1-mediatedICa potentiation does not necessarily imply that a direct tyrosine kinase-mediated phosphorylation of the L-type Ca2+ channel operates in the whole muscle fiber. Kinases located downstream in the signaling cascade may mediate IGF-1R L-type Ca2+ channel α1 subunit interaction. Because the experiments were performed in conditions of strong myoplasmic Ca2+ chelation, the possibility of Ca2+- and calmodulin-dependent kinases and Ca2+-dependent PKC isoforms phosphorylation was minimized.
IGF-1-evoked L-type Ca2+ potentiation is mediated by PKC
We focused the following group of experiments on the elucidation of a potential role of cAMP-dependent protein kinase and PKC in inter-receptor signaling. It has been demonstrated that the compound GF-109203X, used at low concentrations (10–50 nm), acts as a specific PKC inhibitor. The IC50 is 10 nm for PKC, 2 μm for cAMP-dependent protein kinase, and >60 μm for tyrosine kinase activity (Toullec et al., 1991). Therefore, 50 nm GF-109203X was used to investigate a PKC-mediated L-type Ca2+ channel phosphorylation. Cells were preincubated with 50 nm GF-109203X for 10–15 min before IGF-1 was applied. Figure 5A shows the lack of effect of IGF-1 when a muscle fiber was pretreated with the PKC inhibitor (filled diamonds). Figure 5Dillustrates two pulses from a complete run of repetitive depolarizations to −20 mV in control (c) and IGF-1-treated tissues (filled diamond). The magnitude of the decline in the current amplitude was no more than that expected for run-down (see above). ICa amplitudes in control and after exposure to IGF-1, both determined in the presence of GF-109203X, were −3.9 ± 0.21 and −3.4 ± 0.28 μA/μF (n = 10), respectively. ControlICa in the presence of GF-109203X did not differ significantly from the control in the absence of the compound. The complete abolition of IGF-mediated ICaenhancement suggests that Ca2+-independent PKC isoforms phosphorylate the Ca2+ channel and that the cAMP-dependent protein kinase is not involved in the inter-receptor signaling cascade. This point was corroborated by using PKC 19-36, a specific pseudosubstrate inhibitor of PKC with an IC50 for PKC of 15 μm (House and Kemp, 1987). A muscle fiber was incubated in 50 μm PKC(19-36) for 10–15 min before exposure to IGF-1. ICa amplitudes in control and IGF-1-treated fibers, both in the presence of the PKC inhibitor peptide, were −4.1 ± 0.51 and −3.7 ± 0.48 μA/μF (n = 7), respectively. Control experiments were performed with the internal solution containing the PKC inhibitor vehicle alone (acetic hydroxide). The ratio between peakICa amplitude in the vehicle plus IGF-1 and peakICa in the vehicle alone was 1.9 ± 0.28 (n = 5), demonstrating that the vehicle, by itself, did not inhibit PKC phosphorylation.
PKC activation enhances skeletal muscleICa
To determine whether PKC-induced phosphorylation is feasible in adult whole mouse skeletal muscle fibers, the preparation used in these studies, we performed a group of experiments that used phorbol esters. Phorbol esters as PKC agonists have been used widely to promote PKC-dependent ion channel phosphorylation in other cells (Yang and Tsien, 1993). Figure 6Ashows the time course of ICa potentiation induced by 50 nm PMA (filled circles). No significant changes in the passive sarcolemmal properties were detected throughout the experiment, as demonstrated by the lack of changes in the capacitive transients recorded at the beginning and at the end of the experiment (insets). The time course of the PMA effect was very similar to that recorded in the presence of IGF-1 (see Fig.1A). No current potentiation was recorded in the presence of the vehicle (DMSO; data not shown). As a control, 1 μm 4α-phorbol 12,13-didecanoate (4α-PDD), an inactive phorbol ester analog, was used. No ICapotentiation was detected in the presence of 4α-PDD, as shown in Figure 6A (filled triangles). The change in ICa amplitude induced by 4α-PDD, as compared with control (without the drug), was 0.96 ± 0.11 (n = 5). The vehicle (DMSO) did not modify calcium current amplitude (data not shown). The PMA effect onICa amplitude decreased with time. At 50 min after the start of the incubation in 50 nm PMA, peakICa was 0.98 ± 0.11 (n = 6) of the control. The reduction in current amplitude may reflect PKC degradation and the requirement for rephosphorylation to maintain a higher level of channel activity. To determine whether PKC degradation accounts for the decline in PMA effect on ICaamplitude, we tested IGF-1 in the same preparation. PMA was washed out several times, and the muscle fiber was incubated in 20 ng/ml IGF-1. Peak ICa in IGF-1 was 0.97 ± 0.09 (n = 6) of the control (in PMA; p > 0.5).
Fig. 6.

Time course of PKC-dependent phosphorylation of the L-type Ca2+ channel α1 subunit.A, PMA-induced ICapotentiation (filled circles) and lack of effect of the inactive 4α-PDD analog (filled triangle). Both insets illustrate the linear capacitive transient current in response to hyperpolarizations to −110 mV at time 0 and at 15 min of exposure to PMA.ICa in control (B) and in PMA (C; after 15 min exposure) were elicited by 250 msec depolarizations from a Vh of −90 mV, with 10 mV increments. The interrupted line indicates the baseline current.
Figure 6, B and C, illustrates the voltage dependence of PMA-induced ICa potentiation. Similar to the effect induced by IGF-1, a shift in 15 mV of theIca–V relationship was recorded in the presence of PMA. V1/2 value was −17.3 ± 2.2 and −32.2 ± 4.1 mV in control and PMA, respectively. The shift in V1/2 was not associated with changes in the voltage distribution for the charge movement as shown for IGF-1.V1/2Q in control and PMA was −44.3 ± 2.7 and −43.5 ± 2.9 mV, respectively (n = 10).
Phosphorylation of the L-type Ca2+ channel α1 subunit dependence on IGF-1R activation
Biochemical experiments were performed to ascertain whether tyrosine kinase- and PKC-dependent phosphorylation underlies theICa potentiation in response to IGF-1R activation described above. To this aim, we developed a technique to induce phosphorylation of the L-type Ca2+ channel via IGF-1R activation in mature skeletal muscle fibers. The preservation of functionally viable muscle fibers was a key factor to explore the IGF-1R–Ca2+ channel signaling. Living short monolayers of adult skeletal muscle fibers were exposed to an ATP-depleting solution, loaded with [γ-32P]ATP, and subsequently stimulated with IGF-1 (see Materials and Methods). Figure7 shows a 5–15% SDS polyacrylamide gel in which the high molecular weight standard (A) and 100 μg of muscle proteins (B) have been loaded. Figure 7C is a Western blot analysis of muscle proteins with a monoclonal antibody specific for the L-type Ca2+channel α1 subunit (see Materials and Methods). A single band at 165 kDa demonstrates the specificity of the antibody against the α1 subunit. Figure 6D shows the lack of the 165 kDa band in the supernatant after immunoprecipitation of the Ca2+ channel α1 subunit is induced with the monoclonal antibody. Figure 7E corresponds to an autoradiography of the gel that shows protein phosphorylation in the pellet (immunoprecipitation) 15 min after the addition of 20 ng/ml IGF-1. These results were repeated in five muscle preparations from five mice. These studies demonstrate that IGF-1 induces phosphorylation of the L-type Ca2+ channel α1 subunit.
Fig. 7.

IGF-1-dependent phosphorylation of the skeletal muscle L-type Ca2+ channel α1 subunit.A, High molecular weight standard (42,699–200,000).B, SDS polyacrylamide gradient gel (5–15%) electrophoresis of 100 μg of skeletal muscle proteins.C, Western blot analysis of the L-type Ca2+ channel α1 subunit, using a monoclonal antibody. D, Electrophoresis of the muscle proteins supernatant after immunoprecipitation of the L-type Ca2+ channel α1 subunit.E, Autoradiography of the pellet after IGF-1-induced phosphorylation and immunoprecipitation of the L-type Ca2+ channel α1 subunit.
Figure 8A shows the time course of the L-type Ca2+ channel α1 subunit phosphorylation. At time 0, a light band can be detected that represents a phosphorylation independent of the activation of the IGF-1R cascade. At 5 min of exposure to 20 ng/ml IGF-1, the signal increased and reached a peak at 15 min. At 30 min the signal slightly decreased. To quantitate the time course and magnitude of the L-type Ca2+ channel phosphorylation, we scanned autoradiographs, and the signals were expressed as the integral of the optical density corresponding to each band (see Materials and Methods). The magnitudes of the channel phosphorylation (in optical density, O.D. × mm2) were 0.31 ± 0.02, 0.63 ± 0.05, 2.33 ± 0.16, and 2.31 ± 0.21 at 0, 5, 15, and 30 min of exposure to IGF-1, respectively. Differences in the optical density were significant when zero, 5, and 15–30 min points were compared (paired t test, n = 6; p < 0.005; one-way ANOVA, p = 0.005). However, differences between signals at 15 and 30 min were not statistically significant (ANOVA, p > 0.5). The lack of statistically significant differences at 15 and 30 min was confirmed by a Student–Newman–Keuls test. The ratio of the Ca2+channel phosphorylation at the peak of IGF-1 activity (15–30 min) over control (time 0) was 7.5 ± 0.52 (n = 5). These results are in close agreement with the time course of theICa potentiation described above (see Fig.1A).
Fig. 8.

L-type Ca2+ channel α1 subunit phosphorylation dependence on IGF-1R activation. Optical scanning of autoradiographs depicting phosphorylation of the 165 kDa band corresponding to the L-type Ca2+ channel α1 subunit. Phosphorylation was induced with 20 ng/ml IGF-1 on monolayers of adult fast-twitch skeletal muscles fibers incubated in 50 μm [γ-32P]ATP (specific activity of 10 Ci/mmol) and electrophoresed on SDS polyacrylamide gels.A, Time course of the L-type Ca2+channel α1 subunit phosphorylation in control (time 0, before adding IGF-1) and 5, 15, and 30 min after adding 20 ng/ml IGF-1 to the bathing solution. B, Phosphorylation of the L-type Ca2+ channel α1 subunit after 15 min incubation in 20 ng/ml IGF-1 and inhibition of IGF-1-dependent channel phosphorylation by preincubation in 100 μmgenistein for 15 min. C, IGF-1-dependent phosphorylation of the L-type Ca2+ channel α1 subunit, inhibition of channel phosphorylation by preincubation in 50 μm protein kinase C inhibitor peptide 19-36 for 15 min, and channel phosphorylation after incubation in PMA for 15 min.
To explore further the involvement of tyrosine kinase in L-type Ca2+ channel α1 subunit phosphorylation, we preincubated muscle fibers in 100 μm genistein for 15–20 min. Figure 8B shows an almost complete inhibition of the IGF-1-dependent Ca2+ channel phosphorylation by genistein. The ratio of the IGF-1-induced phosphorylation over IGF-1-induced phosphorylation in cells preincubated in genistein was 4.4 ± 0.22 (n = 5). These results provide support for the concept that the activation of tyrosine kinase phosphorylation cascade is required to enhance ICa through the dihydropyridine-sensitive Ca2+ channel.
The involvement of Ca2+-independent PKC isoform(s) has been supported by a complete suppression of the IGF-1-dependentICa potentiation by PKC inhibitors (see Fig. 5). Figure 8C shows a strong inhibition of the 165 kDa band phosphorylation by preincubation in the PKC inhibitor peptide 19-36. The ratio of the IGF-1-induced phosphorylation over IGF-1-induced phosphorylation in cells preincubated in the PKC inhibitor peptide 19-36 was 4.3 ± 0.31 (n = 5). The phosphorylation remaining after the PKC inhibitor has been used may correspond to channel phosphorylation through IGF-1-independent pathways. Figure8C shows the effect of the PKC activator PMA on L-type Ca2+ channel α1 subunit phosphorylation. The ratio of the PMA-induced phosphorylation over IGF-1-induced phosphorylation in cells preincubated in the PKC inhibitor peptide 19-36 was 5.1 ± 0.41 (n = 5). These experiments also demonstrate that the molecule phosphorylated in response to IGF-1R activation corresponds to that phosphorylated by the phorbol ester PMA. An additional series of experiments did not support a role for cAMP-dependent protein kinase in IGF-1 signaling. The ratio of the phosphorylation in control (before adding IGF-1) over IGF-1-induced phosphorylation in cells preincubated with the PKC inhibitor peptide 19-36 was 0.96 ± 0.05 (n = 6). The cAMP-dependent protein kinase A inhibitor 5-24 (IC50, 0.8 μm; Scott et al., 1985) did not inhibit further the effect of the PKC inhibitor peptide 19-36 on IGF-1-induced phosphorylation. The ratio of the IGF-1-induced phosphorylation in PKC inhibitor over phosphorylation in PKC plus 10 μm PKA inhibitor was 0.89 ± 0.18. Moreover, the magnitude of inhibition of the IGF-1-mediated Ca2+ channel phosphorylation with the cAMP-dependent protein kinase A inhibitor 5-24 was not statistically significant. The ratio of the IGF-1-dependent phosphorylation over phosphorylation in cells preincubated in 10 μm PKA inhibitor was 0.95 ± 0.12 (n= 8).
In summary, the interaction between the L-type Ca2+channel and the IGF-1R is not mediated primarily by tyrosine kinase. Other protein kinases such as Ca2+-independent PKC isoforms are activated secondarily, promoting phosphorylation of the skeletal muscle L-type Ca2+ channel α1 subunit.
DISCUSSION
In this work we found that IGF-1R modulates the skeletal muscle L-type Ca2+ channel α1 subunit via a phosphorylation mechanism involving a tyrosine kinase and Ca2+-independent PKC isoform(s). The dihydropyridine-sensitive L-type Ca2+ channel is the only high-voltage-activated Ca2+ channel expressed in adult mammalian muscle. Thus, the IGF-1-mediatedICa potentiation recorded in single skeletal muscle corresponds to the enhancement of multiple units of the same Ca2+ channel class (dihydropyridine-sensitive, L-type). IGF-1 induced a 13 mV shift in theIca–V relationship toward more negative potentials. Potentiation and changes in the voltage dependence of ICa were not associated with alterations in the maximum charge movement and voltage distribution. A plausible mechanism that may account for these results is that L-type Ca2+ channel α1 subunit phosphorylation facilitates relatively uncharged transitions leading to the opening of the channel that occur after the movement of the voltage-sensing particles.
The interaction between IGF-1R and L-type Ca2+channel in skeletal muscle and native neurons, cells in which IGF-1 exerts potent trophic and developmental effects, has not been explored. A tyrosine kinase-dependent phosphorylation of the L-type Ca2+ channel in response to IGF-1 stimulation has been reported in clonal pituitary and neuronal cells (Kleppisch et al., 1992; Selinfreund and Blair, 1994). However, the lack of consensus sequence in the L-type Ca2+ channel for tyrosine kinase phosphorylation suggested to us that IGF-1R exerts a modulatory effect on the Ca2+ channel α1 subunit through an indirect pathway, as demonstrated for skeletal muscle in the present study.
Other trophic factors such as insulin and epidermal growth factor induce a long-term potentiation of Ca2+ channels in clonal pituitary cells (Meza et al., 1994). Despite the fact that the mechanism for this long-term effect is not clear, the increase inICa density suggests alterations in gene expression or changes in L-type Ca2+ turnover. The long-term modulation clearly differs from the rapid regulation exerted by IGF-1R activation on the L-type Ca2+ channel described in this work. Unfortunately, IGF-1-dependent long-term modulation of Ca2+ channels cannot be explored in mature skeletal muscle, because cells in culture undergo a process of dedifferentiation.
Phosphorylation sites for PKC, cAMP-dependent, and Ca2+–calmodulin-dependent protein kinase in the L-type Ca2+ channel α1 and β subunits have been identified (Jahn et al., 1988; O’Callahan et al., 1988; Chang et al., 1991; Rotman et al., 1995), but not for tyrosine kinase. In this work we found no modulatory effect on L-type Ca2+ channels when PKC was inhibited, supporting the concept that the channel is not modulated directly by tyrosine kinase. Although it is not known if the channel is phosphorylated on ser/thr or tyr residues, it is likely that autophosphorylated IGF-1R activates a second messenger such as PKC via phospholipase C-γ (Nishibe et al., 1990; Nishizuka, 1995), and PKC phosphorylates the L-type Ca2+ channel. In summary, our results differ from previous studies in which Ca2+ channels are modulated in terms of seconds to a few minutes and require a sequential activation of two protein kinases.
It has been demonstrated that purified and reconstituted Ca2+ channels are activated by phosphorylation of their subunits (Flockerzi et al., 1986; Hymel et al., 1988; Nunoki et al., 1989). Although Ca2+ channels can be phosphorylated in colchicine-treated myotubes (Sculptoreanu et al., 1993) or in membranes extracted from mature muscle, in the present study channel phosphorylation has been induced by activation of the tyrosine kinase-linked IGF-1 receptor in vivo and in adult fast-twitch muscle, before tissue grinding.
Cultured myotubes from embryonic rat skeletal muscles exhibit a voltage- and frequency-dependent potentiation of L-type Ca2+ currents that is caused by a left shift in the voltage dependence of channel activation toward more negative potentials and that requires cyclic AMP-dependent protein kinase phosphorylation (Sculptoreanu et al., 1993). These investigations reported that phosphorylation induced a potentiation of the L-type Ca2+ current at negative voltages, which is similar to the results of our studies. However, some differences between both works have to be emphasized: (1) we used freshly dissociated muscle fibers from 14-month-old rats instead of colchicine-treated cultured myotubes, (2) we induced current potentiation by IGF-1R activation instead of using high rates of sarcolemmal depolarization, (3) the frequency of fiber stimulation used in the present work (one pulse every 30 sec) did not induce current potentiation (as shown in Fig.1A, before exposure to IGF-1) and did not enhance Ca2+ current in myotubes, and (4) the use of a pseudosubstrate inhibitor of PKC did not occlude the stimulation-dependent ICa potentiation in myotubes in contrast to a complete inhibition of the current potentiation in adult muscle fibers. In summary, PKC- and cAMP-dependent protein kinase participate as second messengers in cell signaling, depending on the specific trigger. An example of this is the L-type Ca2+ channel phosphorylation by cAMP-dependent protein kinase in response to high-frequency sarcolemmal stimulation or by PKC in response to IGF-1R activation.
Although the effect of ICa enhancement on sarcolemmal excitation–sarcoplasmic reticulum Ca2+release–contraction coupling has been excluded during single twitches, it is likely that during prolonged or repetitive depolarizations current enhancement has a role (for review, see Melzer et al., 1995). This theory is based on a series of reports supporting a phosphorylation-dependent potentiation of contractile force and on the detrimental effect of L-type Ca2+ channel antagonists during prolonged muscle activation (see above). Also, it is likely that the increase in Ca2+ influx promoted by IGF-1R activation is related to sarcolemmal–nuclear signaling and ultimately to gene expression.
The development of a technique to study the incorporation of radiolabeled ATP into the L-type Ca2+ channel α1 subunit in living adult muscle fibers provides important evidence for a role of tyrosine kinase and PKC on Ca2+ channel phosphorylation. Two Ca2+-dependent (PKC-α and PKC-β) and two Ca2+-independent (PKC-ε and PKC-θ) PKC isoforms have been identified in rat skeletal muscles (Yamada et al., 1995). In our recording conditions only Ca2+-independent kinases potentially are involved in this signaling cascade, because high Ca2+ buffer concentrations completely prevent increases in myoplasmic Ca2+ concentration. Therefore, the participation of the Ca2+-dependent PKC isoforms (PKC-α and PKC-β) cannot be ruled out in physiological conditions. To elucidate the role of Ca2+-dependent PKC isoforms in ion channel phosphorylation, experiments in stretched fibers and free Ca2+ movement are required. It has been demonstrated that insulin increases the membrane-associated immunoreactive Ca2+-independent PKC isoforms in rat muscles (Yamada et al., 1995). Because PKC-θ expression was found to be restricted to the sarcolemmal fraction in the neuromuscular junction (Hilgenberg and Miles, 1995), it is unlikely that this PKC isoform phosphorylates the L-type Ca2+ channel, which is widely expressed at the T tubule membrane. Thus, it is likely that the PKC-ε isoform is involved in Ca2+ channel α1 subunit phosphorylation on IGF-1R activation. Although the L-type Ca2+ channel α1 subunit is phosphorylated by PKC, phosphorylation by secondarily activated kinases (i.e., tyrosine kinase) cannot be ruled out completely.
In summary, this work demonstrates that, in addition to long-term effects of IGF-1 on skeletal muscle, a direct modulation of the L-type Ca2+ channel operates in matured tissue in a shorter time period via a phosphorylation mechanism involving tyrosine kinase and PKC.
Footnotes
This work was supported by National Institutes of Health/National Institute on Aging Grants K01 AG00692, R29AG13934, P60-AG 10484, and T-32 AG00182 and indirectly from the Muscular Dystrophy Association. We are very grateful to Dr. William E. Sonntag for helpful comments on this work.
Correspondence should be addressed to Dr. Osvaldo Delbono, Department of Internal Medicine, Gerontology, The Bowman Gray School of Medicine, Medical Center Boulevard, Winston-Salem, NC 27157.
REFERENCES
- 1.Allen RE, Dodson MV, Luiten LS, Boxhorn LK. A serum-free medium that supports the growth of cultured skeletal muscle satellite cells. In Vitro Cell Dev Biol. 1985;21:636–640. doi: 10.1007/BF02623296. [DOI] [PubMed] [Google Scholar]
- 2.Arreola J, Calvo J, Garcia MC, Sanchez JA. Modulation of calcium channels of twitch skeletal muscle fibres of the frog by adrenaline and cyclic adenosine monophosphate. J Physiol (Lond) 1987;393:307–330. doi: 10.1113/jphysiol.1987.sp016825. [DOI] [PMC free article] [PubMed] [Google Scholar]
- 3.Berridge MJ. Inositol triphosphate and calcium signaling. Nature. 1993;361:315–325. doi: 10.1038/361315a0. [DOI] [PubMed] [Google Scholar]
- 4.Bezanilla F. Voltage-dependent gating. Gating current measurement and interpretation. In: Latorre R, editor. Ionic channels in cells and model systems. Plenum; New York: 1986. pp. 37–52. [Google Scholar]
- 5.Chang CF, Gutierrez LM, Mundiña-Weilenmann C, Hosey MM. Dihydropyridine-sensitive calcium channels from skeletal muscle. J Biol Chem. 1991;25:16395–16400. [PubMed] [Google Scholar]
- 6.Cohick WS, Clemmons DR. The insulin-like growth factors. Annu Rev Physiol. 1993;55:131–153. doi: 10.1146/annurev.ph.55.030193.001023. [DOI] [PubMed] [Google Scholar]
- 7.Coleman ME, DeMayo F, Yin KC, Lee HM, Geske R, Montgomery C, Schwartz RJ. Myogenic vector expression of insulin-like growth factor I stimulates muscle cell differentiation and myofiber hypertrophy in transgenic mice. J Biol Chem. 1995;20:12109–12116. doi: 10.1074/jbc.270.20.12109. [DOI] [PubMed] [Google Scholar]
- 8.Delbono O. Calcium current activation and charge movement in denervated mammalian skeletal muscle fibers. J Physiol (Lond) 1992;451:187–203. doi: 10.1113/jphysiol.1992.sp019160. [DOI] [PMC free article] [PubMed] [Google Scholar]
- 9.Delbono O, Meissner G. Sarcoplasmic reticulum Ca2+ release in rat slow- and fast-twitch muscles. J Membr Biol. 1996;151:123–130. doi: 10.1007/s002329900063. [DOI] [PubMed] [Google Scholar]
- 10.Delbono O, García J, Appel SH, Stefani E. Calcium current and charge movement of mammalian muscle: action of amyotrophic lateral sclerosis immunoglobulins. J Physiol (Lond) 1991;444:723–742. doi: 10.1113/jphysiol.1991.sp018903. [DOI] [PMC free article] [PubMed] [Google Scholar]
- 11.Delbono O, O’Rourke K, Ettinger WH. Excitation–contraction uncoupling in aged single human skeletal muscle fibers. J Membr Biol. 1995;148:211–222. doi: 10.1007/BF00235039. [DOI] [PubMed] [Google Scholar]
- 12.De Pablo F, Scott LA, Roth J. Insulin and insulin-like growth factor I in early development: peptides, receptors, and biological events. Endocr Rev. 1990;11:558–577. doi: 10.1210/edrv-11-4-558. [DOI] [PubMed] [Google Scholar]
- 13.DeVol DL, Rotwein P, Sadow JL, Novakofski J, Bechtel PJ. Activation of insulin-like growth factor gene expression during work-induced skeletal muscle growth. Am J Physiol. 1990;259:E89–E95. doi: 10.1152/ajpendo.1990.259.1.E89. [DOI] [PubMed] [Google Scholar]
- 14.Dulhunty AF, Gage PG. Effects of extracellular calcium concentration and dihydropyridines on contraction in mammalian skeletal muscle. J Physiol (Lond) 1988;399:63–80. doi: 10.1113/jphysiol.1988.sp017068. [DOI] [PMC free article] [PubMed] [Google Scholar]
- 15.Flockerzi V, Oeken H-J, Hofmann F, Pelzer D, Cavalié A, Trautwein W. Purified dihydropyridine-binding site from skeletal muscle T-tubules is a functional calcium channel. Nature. 1986;323:66–68. doi: 10.1038/323066a0. [DOI] [PubMed] [Google Scholar]
- 16.Florini JR, Ewton DZ, Coolican SA. Growth hormone and insulin growth factor system in myogenesis. Endocr Rev. 1996;17:481–517. doi: 10.1210/edrv-17-5-481. [DOI] [PubMed] [Google Scholar]
- 17.Gutierrez LM, Brawley RM, Hosey MM. Dihydropyridine-sensitive calcium channels from skeletal muscle. I. Roles of subunits in channel activity. J Biol Chem. 1991;266:16387–16394. [PubMed] [Google Scholar]
- 18.Hilgenberg L, Miles K. Developmental regulation of a protein kinase C isoform localized in the neuromuscular junction. J Cell Sci. 1995;108:51–61. doi: 10.1242/jcs.108.1.51. [DOI] [PubMed] [Google Scholar]
- 19.Hille B, Campbell DT. An improved Vaseline gap voltage clamp for skeletal muscle fibers. J Gen Physiol. 1976;67:265–293. doi: 10.1085/jgp.67.3.265. [DOI] [PMC free article] [PubMed] [Google Scholar]
- 20.House C, Kemp BE. Protein kinase C contains a pseudosubstrate prototype in its regulatory domain. Science. 1987;238:1726–1728. doi: 10.1126/science.3686012. [DOI] [PubMed] [Google Scholar]
- 21.Huerta M, Muniz J, Trujillo X, Lomeli J. Adrenergic modulation of the K+ contractures in tonic skeletal muscle fibers of the frog. Jpn J Physiol. 1991;41:851–860. doi: 10.2170/jjphysiol.41.851. [DOI] [PubMed] [Google Scholar]
- 22.Hui CS, Chandler WK. Intramembranous charge movement in frog cut twitch fibers mounted in a double Vaseline gap chamber. J Gen Physiol. 1990;96:257–297. doi: 10.1085/jgp.96.2.257. [DOI] [PMC free article] [PubMed] [Google Scholar]
- 23.Hymel L, Striessnig J, Glossmann H, Schindler H. Purified skeletal muscle 1,4-dihydropyridine receptor forms phosphorylation-dependent oligomeric calcium channels in planar bilayers. Proc Natl Acad Sci USA. 1988;85:4290–4294. doi: 10.1073/pnas.85.12.4290. [DOI] [PMC free article] [PubMed] [Google Scholar]
- 24.Irving M, Maylie J, Sizto NL, Chandler WK. Simultaneous monitoring of changes in Mg concentrations in frog cut twitch fibers containing antipyrylazo III. J Gen Physiol. 1987;93:585–608. doi: 10.1085/jgp.93.4.585. [DOI] [PMC free article] [PubMed] [Google Scholar]
- 25.Jahn H, Nastainczyk W, Rohrkasten A, Schneider T, Hofmann F. Site-specific phosphorylation of the purified receptor for calcium channel blockers by cAMP- and cGMP-dependent protein kinases, protein kinase C, calmodulin-dependent protein kinase II, and casein kinase II. Eur J Biochem. 1988;178:535–542. doi: 10.1111/j.1432-1033.1988.tb14480.x. [DOI] [PubMed] [Google Scholar]
- 26.Kotsias BA, Muchnik S, Obejero Paz CA. Co2+, low Ca2+, and verapamil reduce mechanical activity in rat skeletal muscles. Am J Physiol. 1986;250:C40–C46. doi: 10.1152/ajpcell.1986.250.1.C40. [DOI] [PubMed] [Google Scholar]
- 27.Kleppisch T, Klinz FJ, Hescheler J. Insulin-like growth factor I modulates voltage-dependent Ca2+ channels in neuronal cells. Brain Res. 1992;591:283–288. doi: 10.1016/0006-8993(92)91709-n. [DOI] [PubMed] [Google Scholar]
- 28.Lamb G. Components of charge movement in rabbit skeletal muscle. The effects of tetracaine and nifedipine. J Physiol (Lond) 1986;376:85–100. doi: 10.1113/jphysiol.1986.sp016143. [DOI] [PMC free article] [PubMed] [Google Scholar]
- 29.Meissner G. Ryanodine receptor/Ca2+ release channels and their regulation by endogenous effectors. Annu Rev Physiol. 1995;56:485–508. doi: 10.1146/annurev.ph.56.030194.002413. [DOI] [PubMed] [Google Scholar]
- 30.Melzer W, Herrmann-Frank A, Lüttgau HC. The role of Ca2+ ions in excitation–contraction coupling of skeletal muscle fibers. Biochim Biophys Acta. 1995;1241:59–116. doi: 10.1016/0304-4157(94)00014-5. [DOI] [PubMed] [Google Scholar]
- 31.Meza U, Avila G, Felix R, Gomora JC, Cota G. Long-term regulation of calcium channels in clonal pituitary cells by epidermal growth factor, insulin, and glucocorticoids. J Gen Physiol. 1994;104:1019–1038. doi: 10.1085/jgp.104.6.1019. [DOI] [PMC free article] [PubMed] [Google Scholar]
- 32.Nishibe S, Walh MI, Hernandez-Sotomayor SM, Tonk NK, Rhee SG, Carpenter G. Increase of the catalytic activity of phospholipase C-χ1 by tyrosine phosphorylation. Science. 1990;250:1253–1256. doi: 10.1126/science.1700866. [DOI] [PubMed] [Google Scholar]
- 33.Nishizuka Y. Protein kinase C and lipid signaling for sustained cellular responses. FASEB J. 1995;9:484–496. [PubMed] [Google Scholar]
- 34.Nunoki K, Florio F, Catterall WA. Activation of purified calcium channels by stoichiometric protein phosphorylation. Proc Natl Acad Sci USA. 1989;86:6816–6820. doi: 10.1073/pnas.86.17.6816. [DOI] [PMC free article] [PubMed] [Google Scholar]
- 35.O’Callahan CM, Ptasienski J, Hosey MM. Phosphorylation of the 165 kDa dihydropyridine/phenylalkylamine receptor from skeletal muscle by protein kinase C. J Biol Chem. 1988;263:17342–17349. [PubMed] [Google Scholar]
- 36.Oz M, Frank GB. Decrease in the size of tetanic responses produced by nitrendipine or by extracellular calcium ion removal without blocking twitches or action potentials in skeletal muscle. J Pharmacol Exp Ther. 1991;257:575–581. [PubMed] [Google Scholar]
- 37.Rotman EI, Murphy BJ, Catterall WA. Sites of selective cAMP-dependent phosphorylation of the L-type calcium channel α1 subunit from intact rabbit skeletal muscle myotubes. J Biol Chem. 1995;270:16371–16377. doi: 10.1074/jbc.270.27.16371. [DOI] [PubMed] [Google Scholar]
- 38.Schmid A, Renaud JF, Lazdunski M. Short-term and long-term effects of β-adrenergic effectors and cyclic AMP on nitrendipine-sensitive voltage-dependent Ca2+ channels of skeletal muscle. J Biol Chem. 1985;260:13041–13046. [PubMed] [Google Scholar]
- 39.Scott JD, Fischer EH, De Maille JG, Krebs EG. Identification of an inhibitory region of the heat-stable protein inhibitor of the cAMP-dependent protein kinase. Proc Natl Acad Sci USA. 1985;82:4379–4383. doi: 10.1073/pnas.82.13.4379. [DOI] [PMC free article] [PubMed] [Google Scholar]
- 40.Sculptoreanu A, Scheuer T, Catterall WA. Voltage-dependent potentiation of L-type Ca2+ channels due to phosphorylation by cAMP-dependent protein kinase. Nature. 1993;364:240–243. doi: 10.1038/364240a0. [DOI] [PubMed] [Google Scholar]
- 41.Selinfreund RH, Blair LAC. Insulin-like growth factor-1 induces a rapid increase in calcium currents and spontaneous membrane activity in clonal pituitary cells. Mol Pharmacol. 1994;45:1215–1220. [PubMed] [Google Scholar]
- 42.Tanabe T, Takeshima H, Mikami A, Flockerzi V, Takahashi H, Kangawa K, Kojima M, Matsuo H, Hirose T, Numa S. Primary structure of the receptor for calcium channel blockers from skeletal muscle. Nature. 1987;328:313–318. doi: 10.1038/328313a0. [DOI] [PubMed] [Google Scholar]
- 43.Toullec D, Pianetti P, Coste H, Bellevergue P, Grand-Perret T, Ajakane M, Baudet V, Boissin P, Boursier E, Loriolle F, Duhamel L, Charon D, Kirilovsky J. The bisindolylmaleimide GF 109203X is a potent and selective inhibitor of protein kinase C. J Biol Chem. 1991;266:15771–15781. [PubMed] [Google Scholar]
- 44.Vandenburgh HH, Karlisch P, Shansky J, Feldstein R. Insulin and IGF-1 induce pronounced hypertrophy of skeletal myofibers in tissue culture. Am J Physiol. 1991;260:C475–C484. doi: 10.1152/ajpcell.1991.260.3.C475. [DOI] [PubMed] [Google Scholar]
- 45.Yamada K, Avignon A, Standaert ML, Cooper R, Spencer B, Farese RV. Effects of insulin on the translocation of protein kinase C-θ and other protein kinase C isoforms in rat skeletal muscles. Biochem J. 1995;308:177–180. doi: 10.1042/bj3080177. [DOI] [PMC free article] [PubMed] [Google Scholar]
- 46.Yang J, Tsien RW. Enhancement of N- and L-type calcium channel currents by protein kinase C in frog sympathetic neurons. Neuron. 1993;10:127–136. doi: 10.1016/0896-6273(93)90305-b. [DOI] [PubMed] [Google Scholar]