

Abstract
Adenosine A1 receptors induce an inhibition of adenylyl cyclase via G-proteins of the Gi/o family. In addition, simultaneous stimulation of A1 receptors and of receptor-mediated activation of phospholipase C (PLC) results in a synergistic potentiation of PLC activity. Evidence has accumulated that Gβγ subunits mediate this potentiating effect. However, an A1 receptor-mediated increase in extracellular glutamate was suggested to be responsible for the potentiating effect in mouse astrocyte cultures. We have investigated the synergistic activation of PLC by adenosine A1 and α1 adrenergic receptors in primary cultures of astrocytes derived from different regions of the newborn rat brain. It is reported here that (1) adenosine A1 receptor mRNA as well as receptor protein is present in astrocytes from all brain regions, (2) A1receptor-mediated inhibition of adenylyl cyclase is of similar extent in all astrocyte cultures, (3) the A1 receptor-mediated potentiation of PLC activity requires higher concentrations of agonist than adenylyl cyclase inhibition and is dependent on the expression level of A1 receptor, and (4) the potentiating effect on PLC activity is unrelated to extracellular glutamate.
Taken together, our data support the notion that βγ subunits are the relevant signal transducers for A1 receptor-mediated PLC activation in rat astrocytes. Because of the lower affinity of βγ, as compared with α subunits, more βγ subunits are required for PLC activation. Therefore, only in cultures with higher levels of adenosine A1 receptors is the release of βγ subunits via Gi/o activation sufficient to stimulate PLC. It is concluded that variation of the expression level of adenosine A1 receptors may be an important regulatory mechanism to control PLC activation via this receptor.
Keywords: inhibitory G-protein, βγ subunits, inositol phosphates, rat astrocytes, phospholipase C, adenosine A1receptor coupling, RT-PCR, receptor binding
Cultured astrocytes are known to express adenosine A1 and A2 receptors (van Calker et al., 1979). In glial cells, adenosine regulates the synthesis of cytokines and prostaglandins (Fiebich et al., 1996a,b) and has effects on glial cell proliferation (Ayane et al., 1989; Gebicke-Härter et al., 1996). Although A1 and A2 subtypes were distinguished originally by their differential effects on adenylyl cyclase (van Calker et al., 1978b, 1979), more recent findings have revealed coupling of adenosine receptors to other signal transduction systems, including phospholipase C (PLC) (for review, see Fredholm et al., 1994;Williams, 1995). Activation of PLC leads to the formation of inositol 1,4,5-trisphosphate and diacylglycerol (Berridge, 1993). PLCβ isoenzymes are target enzymes for α subunits from the Gq-protein family (Lee et al., 1992). However, PLCβ isozymes also can be activated by G-protein βγ subunits (Sternweiss and Smrcka, 1992; Wu et al., 1993). Although βγ subunits have long been thought to play only a passive role and serve essentially as a membrane anchor for α subunits, it has become obvious that they are involved actively in a number of signal transduction events (for review, see Sternweiss, 1994; Müller and Lohse, 1995). However, higher concentrations of βγ subunits than α subunits are required to activate PLCβ or other target enzymes, i.e., the affinity of α subunits for their target enzymes is much higher (10- to 100-fold) than those of βγ subunits (Birnbaumer, 1992; Park et al., 1993;Sternweiss, 1994; Bygrave and Roberts, 1995; Müller and Lohse, 1995).
Very often the coupling of adenosine A1 receptors to PLCβ is synergistic, with the stimulation evoked by other receptors like α1 adrenergic receptors (El-Etr et al., 1989; Biber et al., 1996), histamine H1 receptors (Dickenson and Hill, 1993), muscarinic receptors (Biden and Browne, 1993), or thyrotropin receptors (Okajima et al., 1995). There are, however, also reports suggesting direct activation of PLC by adenosine A1receptors (Gerwins and Fredholm, 1992b; Freund et al., 1994). Two alternative mechanisms have been put forward to explain the stimulatory action of adenosine A1 receptors on PLCβ: the synergistic effect of A1 receptor agonists in primary astrocyte cultures from embryonic mouse striatum (El-Etr et al., 1989) was hypothesized to be caused by an adenosine A1receptor-mediated inhibition of astrocytic glutamate uptake and subsequent increase of extracellular glutamate, resulting in stimulation of inositol phosphate (IP) accumulation via metabotropic glutamate receptors (El-Etr et al., 1992). On the other hand, effects of A1 receptor agonists in various cell lines may be mediated by βγ subunits of Gi-proteins (Akbar et al., 1994; Freund et al., 1994).
In this study the potentiation of PLC activation via A1receptors after stimulation of α1 adrenergic receptors was investigated in cultured astrocytes derived from distinct regions of the rat brain. In contrast to the mechanism postulated for mouse astrocytes, the effect in rat astrocytes was unrelated to an increase of extracellular glutamate. Our data support the hypothesis of a βγ subunit-mediated PLC activation and, furthermore, give evidence that coupling of adenosine A1 receptors to PLC and/or adenylyl cyclase is determined by the expression level of the receptor.
MATERIALS AND METHODS
Materials
Reagents were purchased from the following sources: cyclopentyladenosine (CPA), phenylephrine (PE), glutamate, 8-cyclopentyl-1,3-dipropylxanthine (DPCPX),l-trans-pyrrolidine-2,4-dicarbolic acid (PDC), pertussis toxin (PTX), mastoparan, and isoproterenol from Research Biochemicals (RBI, Natick, MA); cyclic AMP-RIA Kit from Immuno Biological Laboratories (IBL); and [3H]glutamate from American Radiolabeled Chemicals (ARC, St. Louis, MO); all were distributed by Biotrend (Köln, Germany). DMEM and glutamate-pyruvate-transaminase (GPT) were obtained from Sigma (Deisenhofen, Germany), fetal calf serum and [3H]DPCPX from Boehringer Mannheim (Mannheim, Germany), scintillation fluid (Rotiszint Ecoplus) from Roth (Karlsruhe, Germany), Dowex anion exchanger (Formiate Form AG 1 × 8) from Bio-Rad (München, Germany), [3H]-myo-inositol from Amersham-Buchler (Braunschweig, Germany), and Moloney-murine leukemia virus reverse transcriptase (M-MLV RT) and 0.1 m DTT from Life Technologies (Eggenstein, Germany). RNase inhibitor, 5× RT buffer, 10× PCR buffer, and Taq polymerase were obtained from Pharmacia (Freiburg, Germany).
Cell cultures
Astrocyte cultures were established as described previously (Gebicke-Härter et al., 1989). In brief, rat brains were dissected out of newborn Wistar rat pups (<1 d), and various regions (cortex, hippocampus, striatum, tegmentum, thalamus, and cerebellum) were isolated. Brain tissues were dissociated gently by trituration in Dulbecco’s PBS and filtered through a cell strainer (70 μm ∅, Falcon, Oxnard, CA) into DMEM. After two washing steps (200 ×g for 10 min), cells were seeded into 24-well dishes (Falcon; 5 × 10⁵ cells/well) or 6-well dishes (Falcon; 2 × 10⁶ cells/well) for second messenger determination and glutamate uptake experiments or RNA extraction, respectively. For preparation of membranes, cells were grown in single dishes (Falcon, 10 cm ∅) (8 × 10⁶ cells/dish). Cultures were maintained for 4 weeks in DMEM containing 10% fetal calf serum with 0.01% penicillin and 0.01% streptomycin in a humidified atmosphere (5% CO2) at 37°C. Culture medium was changed on the second day after preparation and every 6 d thereafter.
Cyclic AMP determination
Four-week-old cultures were washed three times with 500 μl of incubation buffer containing (in mm): 118 NaCl, 4.7 KCl, 3 CaCl, 1.2 MgSO4, 1.2 KH2PO4, 0.5 EDTA, 10 glucose, and 20 HEPES, pH 7.4. Then cells were stimulated at 37°C in the same buffer with the β receptor agonist isoproterenol (1 μm) in the presence or absence of CPA. After 10 min, the buffer was removed and the reaction stopped by the addition of 400 μl of ice-cold ethanol (70%). Dishes were incubated on ice for 30 min, and the supernatants were harvested. For each sample 10 μl was dried in a speed vac centrifuge (Bachhofer, Reutlingen, Germany) and redissolved in 500 μl of sample buffer (cAMP-RIA Kit, IBL). Cyclic AMP levels were determined according to the manufacturer’s protocol.
Inositol phosphate determination
Four-week-old cultures were labeled for 24 hr with 1 μCi [3H]-myo-inositol in 250 μl of culture medium. After three washings with 500 μl of incubation buffer, cells were incubated for 15 min at 37°C in the same buffer supplemented with 10 mm LiCl and stimulated for 20 min with the α1 receptor agonist phenylephrine (100 μm) in the presence or absence of CPA. The reaction was stopped by the addition of ice-cold TCA (100% w/v) up to a final concentration of 10% TCA. Dishes were incubated on ice for 30 min. Separation of inositol phosphates was performed on Dowex anion exchange columns (Formiate Form AG 1 × 8) as described previously (van Calker et al., 1987). In brief, TCA was extracted with diethylether (3 times), and samples were neutralized to pH 7 with 5 mmdisodium tetraborate. Samples were loaded on Dowex columns and after two washing steps (10 ml water; 10 ml of 50 mm disodium tetraborate/60 mm ammonium formate), inositol phosphates were eluted with 2 ml of 1 m ammonium formate and 0.1m formic acid. Samples were mixed with 6 ml of liquid scintillation fluid and counted. Determinations were performed in triplicate.
Determination of glutamate uptake
Four-week-old cultures were incubated for 1 hr in serum-free DMEM without glutamine. Then cells were washed twice with 500 μl of incubation buffer and maintained at 37°C for 15 min in the same buffer supplemented with 10 mm LiCl in the presence or absence of PDC. Glutamate uptake was initiated by the addition of a 10-fold concentrated glutamate solution (final concentration 100 μm) containing [3H]glutamate (0.05 μCi/well) in the presence or absence of PE and/or CPA. The reaction was terminated after 20 min by the addition of 1 ml of ice-cold incubation buffer, followed by two washing steps within 30 sec. Cells were lysed in 0.5 m NaOH and 0.1% Triton X-100 (500 μl/well); [3H]glutamate uptake was determined by liquid scintillation counting. Determinations were performed in triplicate.
mRNA extraction
Cells were lysed in guanidinium isothiocyanate/mercaptoethanol (GTC) solution (250 μl/well). Two samples were pooled, and total RNA was extracted according to Chomczynski and Sacchi (1987).
Reverse transcriptase-polymerase chain reaction (RT-PCR)
Reverse transcription. Total RNA (1 μg) was transcribed into cDNA in a final volume of 25 μl containing 0.5 μl of M-MLV RT (Life Technologies), 0.5 μl of RNase inhibitor (Pharmacia), 1 μl of random hexamers (2.5 nm), 9 μl of H2O, 5 μl of 5× buffer (Pharmacia), 4 μl of DTT (0.1m), and 5 μl of deoxynucleosidetriphosphates (dNTPs) (2.5 mm). After 10 min of incubation at 30°C and 60 min at 42°C, the reaction was stopped by heating at 95° for 5 min. Potential contaminations by genomic DNA were checked for by running the reactions without RT and using S12 primers in subsequent PCR amplifications. Only RNA samples that showed no bands after that procedure were used for further investigations.
Polymerase chain reaction. For PCR amplifications, the following reagents were added to 1 μl of the RT reaction: 4 μl of 25 mm MgCl, 5 μl of 10× PCR buffer (Pharmacia), 4 μl of 10 mm dNTPs, 35 μl of H2O, 0. 5 μl of each primer, and 0.125 μl of Taq polymerase (Pharmacia). PCR conditions were as follows: 1 min denaturation at 94°C, 1 min primer annealing, and 1.5 min amplification at 72°C. PCR was terminated by an incubation at 72°C for 7 min.
Sequences of oligonucleotide primer pairs and PCR conditions were as follows: adenosine A1 receptor (Mahan et al., 1991), number 55 5′-ATTG-CCTTGGTCTCTGTGC and number 690 5′-CAGCTCCTTCCCGTAG-TAC, annealing temperature 59°C for 35 cycles. S12 ribosomal protein (Ayane et al., 1989), number 49 5′-ACGTCAACACTGCTCTACA and number 360 5′-CTTTGCCATAGTCCTTAAC, annealing temperature 56°C for 29 cycles. The plateau phase of the PCR reaction was not reached under these PCR conditions.
Quantification of PCR products. Amplified cDNAs were separated on ethidium bromide-stained agarose gels and analyzed by a gel imaging system (One-DeScan; MWG Biotech, München, Germany). Arbitrary units of adenosine A1 receptor mRNA were correlated to arbitrary units of S12 mRNA (= 100%) of the same sample. Results are given as mean ± SD from nine RNA probes, which were obtained from three independent cell preparations with three independent RNA extractions each.
Preparation of membranes
Preparation of membranes from cells was based on a protocol for membrane preparation from various tissues as described by Lohse et al. (1987). Cells from five dishes were harvested in 2 ml of ice-cold lysis buffer (5 mm Tris and 2 mm EDTA, pH 7.4) and homogenized (2 × 15 sec) with an Ultraturrax. The homogenate was centrifuged for 10 min at 1000 × g (4°C), and the resulting supernatant was spun for 40 min at 50,000 ×g (4°C). The membrane pellet was resuspended in 50 mm Tris, pH 7.4, frozen in liquid nitrogen, and stored at −80°C. Protein concentration was determined with a Bradford method (Bio-Rad).
Saturation experiments
The saturation experiments with [3H]DPCPX as described by Lohse et al. (1987) were adopted to a 96-well microplate format. Membranes (35–45 μg of membrane protein) from astrocyte cultures derived from different brain areas were incubated in a total volume of 200 μl in 96-well microplates with filter bottoms (Millipore filtration system MultiScreen MAFC, Bedford, MA). The assay buffer (50 mm Tris/HCl, pH 7.4) contained seven different radioligand concentrations ranging from 0.1 to 4 nm. Nonspecific binding was determined in the presence of 100 μm (R)-phenylisopropyladenosine (R-PIA). Samples were incubated at room temperature, and the reaction was terminated after 3 hr by filtration through the filter bottom of the wells. Filters were washed four times with 250 μl of assay buffer, and the microplates were dried at 40°C for 30 min. Then 20 μl of liquid scintillation fluid was added to each well, and the plates were counted in a microplate β counter (Wallac Microbeta, Turku, Finland).
RESULTS
Effects of adenosine A1 receptor activation on agonist-induced IP formation and cyclic AMP production in astrocytes cultured from various brain areas
Depending on the brain region from which the astrocyte cultures were prepared, stimulation with the α1 adrenergic agonist PE increased the formation of IPs 1.5- to threefold (Fig.1a). As reported recently for hippocampal astrocytes (Biber et al., 1996), this IP formation was potentiated in some but not all astrocyte cultures by costimulation of adenosine A1 receptors with agonists like CPA (Fig. 1a,b) and (R)-PIA (data not shown), which had no effects on their own. This effect was antagonized (rightward shift of the concentration–response curve) by 100 nm DPCPX (data not shown), as already reported for hippocampal astrocyte cultures (Biber et al., 1996).
Fig. 1.

a, Effect of CPA on phenylephrine-stimulated IP formation. Primary astrocyte cultures were established from various brain regions and stimulated with 100 μm PE ± 1 μm CPA. IP control levels (100%) in unstimulated cells ranged from 1060 ± 70 to 2200 ± 180 cpm, depending on the brain region. Shown is the increase caused by the addition of PE ± CPA. CPA alone had no effect (IP levels between 1130 ± 83 and 2310 ± 210 cpm, depending on the brain region). Data given are mean ± SD. b, Comparison of the potentiating effect of CPA in astrocytes from different brain regions. The formation of inositol phosphates induced by 100 μm phenylephrine (100%) ranged from 2300 ± 180 to 4880 ± 640 cpm. The columns indicate the relative increase over the phenylephrine effect caused by 100 nm CPA. Data given are mean ± SD. ★★, Significantly higher as compared with striatum, cerebellum, or whole brain; p < 0.01 (Student’s ttest). st, Striatum (n = 12);co, cortex (n = 12);hi, hippocampus (n = 12);th, thalamus (n = 6);te, tegmentum (n = 4);ce, cerebellum (n = 4);wb, whole brain (n = 7).n, Number of experiments.
Potentiating effects of A1 receptor agonists were found in cultures from hippocampus, cortex, thalamus, tegmentum, and whole brain. No potentiation was found in cultures from striatum and cerebellum (Fig. 1a,b). The maximal potentiating effect of 1 μm CPA was in the same order of magnitude (approximately twofold) in cultures from cortex, hippocampus, thalamus, and tegmentum, whereas cultures from whole brain exhibited less pronounced potentiation (∼1.4-fold) (Fig. 1b). Moreover, we found EC50 values for the potentiating effect of CPA of ∼100 nm (exemplified for cortical cultures in Fig.2a) in cultures from hippocampus, cortex, thalamus, and tegmentum but a five- to 10-fold higher EC50 value for the potentiating effect of CPA in cultures from whole brain (data not shown).
Fig. 2.

Comparison of the concentration–response curves of CPA (a) of the potentiation of PE-induced IP accumulation and (b) of the inhibitory effect on the isoproterenol-induced cyclic AMP formation in astrocyte cultures from rat cortex. Data are given as a percentage of (a) effect of PE (100 μm; 2960 ± 240 cpm = 100%) and (b) effect of isoproterenol (1 μm; 52 ± 8 pmol/well = 100%). Values are mean of three independent experiments ± SD.
However, these regional differences were not found when the inhibitory effect of adenosine A1 receptors on the formation of cyclic AMP was measured. Inhibition of cyclic AMP production was measured in astrocyte cultures in which β receptor-mediated stimulation of adenylyl cyclase was induced by isoproterenol (1 μm). The extent of this stimulation was comparable in astrocytes from all brain areas. The resulting cyclic AMP accumulation was inhibited by the adenosine A1 receptor agonist CPA (Fig.2b). This inhibitory effect of CPA was antagonized (rightward shift of the concentration–response curve) by the A1 selective antagonist DPCPX (100 nm; data not shown), indicating the involvement of an adenosine A1receptor as already shown by van Calker et al. (1978a,b, 1979). Figure2b exemplifies for cortical astrocytes that the IC50 value for CPA was ∼10 nm and that a maximal inhibitory effect was achieved at a concentration of 100 nm CPA. Higher concentrations of CPA did not increase further the inhibitory action of CPA. Similar concentration–response curves for CPA were found in cell cultures prepared from the other brain regions, with maximal inhibitory effects of 40–70% at a concentration of 100 nm CPA (Table 1).
Table 1.
Inhibitory effect of 100 nm CPA on the isoproterenol (1 μm)-induced synthesis of cyclic AMP in astrocyte cultures from various brain regions
| Striatum | Cortex | Hippocampus | Thalamus | Tegmentum | Cerebellum | Whole brain |
|---|---|---|---|---|---|---|
| 45 ± 12 | 57 ± 10 | 51 ± 8 | 64 ± 15 | 54 ± 12 | 42 ± 15 | 43 ± 12 |
Control levels of cyclic AMP in unstimulated cells, 0.5 ± 0.4 pmol cyclic AMP/well; CPA (100 nm), 0.6 ± 0.4 pmol cyclic AMP/well; isoproterenol (1 μm), from 48 ± 13 to 65 ± 14 pmol cyclic AMP/well (= 100%), depending on the brain region. Data are given as the percentage of maximal stimulation by isoproterenol and as mean of three independent experiments ± SD.
Influence of extracellular glutamate and inhibition of glutamate uptake on the potentiating effect of CPA
To identify a potential role of glutamate in the adenosine-mediated potentiation of IP response, we tested the effect of extracellular glutamate, the effects of its degradation with GPT, and the effects of the inhibition of glutamate uptake by the selective uptake inhibitor PDC (1 mm). Stimulation of tegmental cultures with glutamate (100 μm) led only to a very small accumulation of IPs of ∼20% over basal level, and costimulation with PE and glutamate did not induce a comparable IP accumulation as was found after costimulation of PE and CPA (Fig. 3). Similar results were obtained when these experiments were performed in the presence of 1 mm PDC to inactivate the astrocytic glutamate uptake system (data not shown). Pronounced IP accumulation in response to glutamate was found in other cultures, including those that did not show any potentiating effect with CPA (data not shown). Moreover, degradation of extracellular glutamate and inhibition of glutamate uptake had no effect on the potentiating effect of CPA (Fig.3). Exemplified for tegmental cultures (Fig. 3), similar results were found in cultures from cortex, hippocampus, and thalamus.
Fig. 3.

Effect of glutamate (GLU) (100 μm) on IP levels of unstimulated cells (control) and PE-stimulated (100 μm) cells, and effect of GPT (10 U/ml) and PDC (1 mm) on the potentiating effect of CPA (100 nm) of the PE-induced formation of inositol phosphates in cultures from tegmentum. Experiments with glutamate were performed in the presence of 1 mm PDC to avoid the uptake of glutamate. Basal level of unstimulated cells (control), 1651 ± 14 cpm = 100%. The effect of PE (2641 ± 32 cpm) was unaffected by treatment with GPT (2635 ± 51 cpm) or PDC (2689 ± 86 cpm). GPT was used in the presence of 1 mm pyruvate (O’Brien and Fischbach, 1986; El-Etr et al., 1992). Similar results with GPT and PDC were obtained in all cultures with potentiating effect. Values are given as mean ± SD from three independent experiments.
Effect of PE, CPA, and PDC on glutamate uptake in astrocyte cultures from tegmentum
Incubation with glutamate for 20 min led to a pronounced glutamate uptake into astrocytes cultured from rat tegmentum. Neither PE nor CPA nor the combination of both compounds affected glutamate uptake (Table2), but glutamate uptake was inhibited effectively by PDC (Table 2).
Table 2.
Effects of PE, CPA, and PDC on glutamate uptake in astrocytes from tegmentum
| PE (100 μm) | CPA (100 nm) | PE + CPA | PDC (1 mm) |
|---|---|---|---|
| 98 ± 6 | 94 ± 8 | 90 ± 4 | 18 ± 4 |
Glutamate uptake was determined in incubation buffer supplemented with 10 mm LiCl in the presence or absence of PDC. Reaction was initiated by addition of a glutamate solution containing [3H]glutamate and stopped after 20 min (for details, see Material and Methods). Data are percentages of glutamate uptake from unstimulated cells (4230 ± 370 cpm = 100%) and given as mean ± SD from three independent experiments.
Influence of PTX and mastoparan on IP formation in astrocyte cultures from various brain regions
To elucidate the role of Gi/o-proteins in the CPA-induced potentiation of IP production, we performed experiments with pertussis toxin and mastoparan. Pertussis toxin (400 ng/ml for 18 hr), which inhibits the action of Gi/o-proteins, completely abolished the potentiating effect of CPA (1 μm), whereas the PE-induced (100 μm) IP formation was unaffected (Fig.4). Mastoparan activates Gi/o-proteins in a manner comparable to receptor-mediated activation (Higashijima et al., 1990). Stimulation of astrocyte cultures with mastoparan (1 mm) for 1 hr led to an approximately fourfold increased accumulation of IPs, as compared with controls. This mastoparan-induced IP formation was of similar magnitude in all cultures, independent of the brain region from which the astrocytes had been cultured, as exemplified in Figure 4 for cultures that show (tegmentum) and do not show (striatum) a potentiating effect of CPA.
Fig. 4.
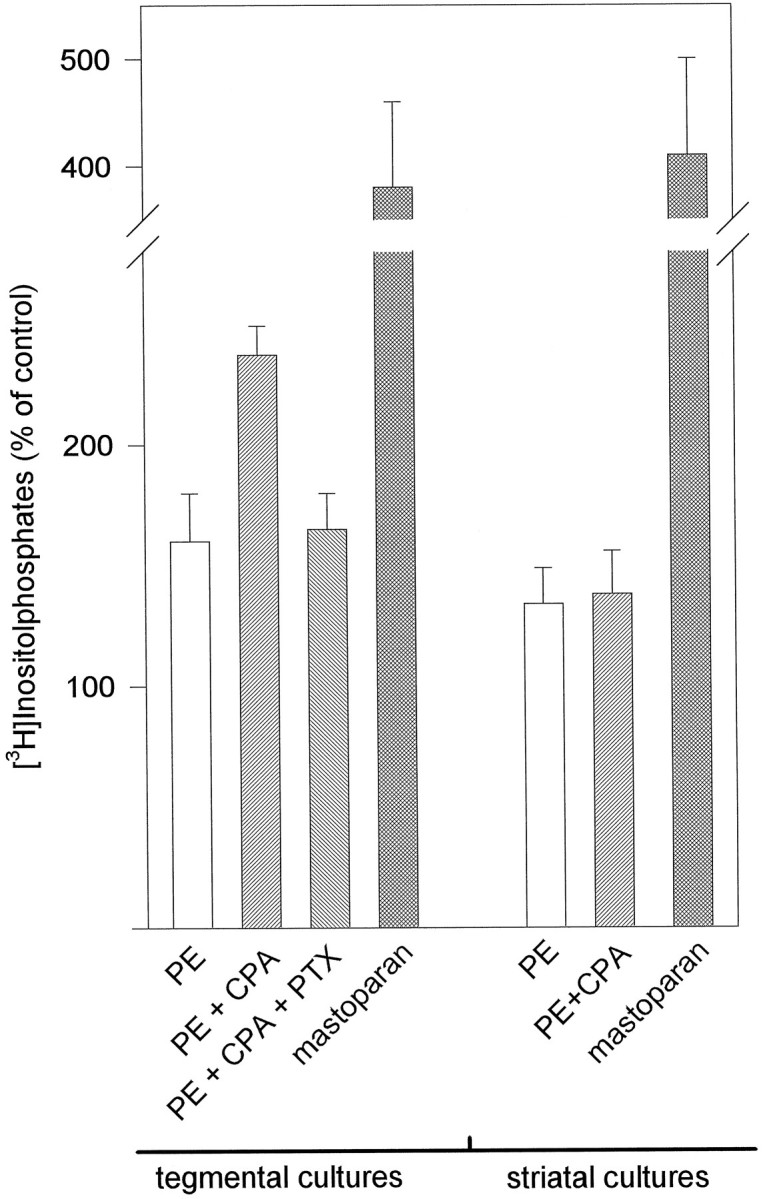
Effect of inhibition and activation of Gi/o-proteins by PTX (400 ng/ml) and mastoparan (1 mm) in cultures from tegmentum and striatum. CPA-induced (1 μm) potentiation of PE-stimulated (100 μm) IP accumulation in cultures from tegmentum was abolished completely by PTX treatment. Similar results were obtained in cultures from cortex, hippocampus, and thalamus. Stimulation with mastoparan induced a comparable IP accumulation of approximately fourfold, as compared with controls in cultures from tegmentum and striatum. Similar results were found in all other culture types. Control levels of unstimulated cells (1367 ± 112 cpm for tegmental cultures, 1429 ± 156 cpm for striatal cultures = 100%) and PE-induced IP accumulation in tegmental cultures were not affected by PTX treatment. Values are given as mean ± SD from three independent experiments.
Expression of adenosine A1 receptor mRNA in astrocyte cultures from various brain areas
Adenosine A1 receptor mRNA in astrocyte cultures was examined by RT-PCR, using primers specific for rat adenosine A1 receptor cDNA (Mahan et al., 1991) and S12 cDNA as internal standards (Appel et al., 1995). Adenosine A1receptor mRNA was present in astrocyte cultures from all brain regions (Fig. 5a). The levels of adenosine A1 receptor mRNA, however, differed substantially among the brain areas examined (Fig. 5a). mRNA concentrations were markedly higher in cultures from hippocampus, cortex, thalamus, and tegmentum (Fig. 5b). Low expression of adenosine A1 receptor mRNA was found in cultures from striatum, cerebellum, and whole brain (Fig. 5b).
Fig. 5.

Semiquantitative determination of A1receptor mRNA expression in astrocytes cultured from different brain regions. Total RNA was reverse-transcribed, and receptor cDNAs were quantified by the use of ribosomal protein S12 cDNA as the internal standard (for details, see Materials and Methods). a, RT-PCR products using adenosine A1 receptor primers (top panel) or primers for S12 (bottom panel). RNA was prepared from astrocyte cultures derived from striatum (st), cortex (co), hippocampus (hi), thalamus (th), tegmentum (te), cerebellum (ce), and whole brain (wb). The bright band in marker lanes is 800 bp. b, Shown is adenosine A1 receptor cDNA quantified with a gel analytics program. Arbitrary units of adenosine A1 cDNA were normalized to S12 cDNA (= 100%). st, Striatum; co, cortex;hi, hippocampus; th, thalamus;te, tegmentum; ce, cerebellum;wb, whole brain. Values are given as mean of nine experiments ± SD. ★, p < 0.05; ★★,p < 0.01; significantly higher as compared with striatum, cerebellum, or whole brain (Student’s ttest).
[3H]DPCPX binding in membranes from astrocyte cultures from various brain areas
Saturation experiments with the specific A1 receptor radioligand [3H]DPCPX (Lohse et al., 1987) to membranes derived from primary astrocyte cultures from various brain regions were performed to determine the amount of A1receptor protein. Specific radioligand binding was found in astrocytic membranes with kDa values between 0.5 and 1.2 nm, irrespective of the brain region from which the astrocytes had been cultured. A binding curve for membranes obtained from thalamic cultures is shown exemplarily in Figure 6. Computer analysis of this experiment yielded a kDa value of 0.8 nm and aBmax value of 28 fmol/mg.Bmax values (∼25 fmol/mg) measured in membranes obtained from cultures with potentiating adenosine A1 receptor effect were significantly higher, as compared with the Bmax values (∼14 fmol/mg) obtained from whole brain cultures (Fig. 7). Saturation experiments with membranes derived from striatal and cerebellar astrocyte cultures revealed only very low receptor numbers near the detection limit, where reliable determinations were problematic. If any specific binding was detected, Bmax values were in the range ≤ 5 fmol/mg.
Fig. 6.

Isotherm binding of [3H]DPCPX to membranes derived from thalamic cultures with total binding (•) and nonspecific binding (□), which was defined with 100 μm (R)-PIA. Pointsrepresent the mean of triplicate samples or duplicate samples for total binding or nonspecific binding, respectively. Computer analysis of this experiment yielded a kDa value of 0.8 nm and aBmax value of 28 fmol/mg. Similar results were obtained in three independent experiments.
Fig. 7.

A1 adenosine receptor density in membranes prepared from astrocyte cultures derived from different brain regions. Bmax values were determined in saturation binding experiments with the antagonist [3H]DPCPX. Astrocytes from cortex (co), hippocampus (hi), thalamus (th), and tegmentum (te) showed significantly higher receptor density than membranes from astrocytes from whole brain (wb). Values are mean of three experiments ± SEM. ★, Significantly higher, as compared with whole brain; p < 0.05, Student’s ttest. In astrocytes from striatum (st) and cerebellum (ce) only very low receptor numbers near the detection limit (Bmax values ≤ 5 fmol/mg) were found. Thus, a reliable determination of these values was not feasible.
Effect of chronic treatment of cultures from cerebellum with the A1 receptor antagonist carbamazepine
Chronic treatment with A1 receptor antagonists like theophylline (Lupica et al., 1991) and carbamazepine (Marangos et al., 1987) is known to upregulate the number of receptors in brain. Upregulation of A1 receptors with carbamazepine (50 μm) leads to an A1 receptor-mediated potentiation of IP accumulation in cerebellar cultures, which did not exhibit this effect before (Table 3).
Table 3.
Effect of chronic carbamazepine (50 μm) treatment on the potentiating effect in cultures from cerebellum
| Cerebellar cultures | Cerebellar cultures + carbamazepine (50 μm) | |
|---|---|---|
| PE + CPA (1 μm) | 120 ± 15 | 158 ± 22 |
| PE + CPA (10 μm) | 117 ± 18 | 210 ± 28 |
Data are given as percentage (mean ± SD) of the effect of PE (100 μm) (4590 ± 367 cpm for untreated cultures and 4476 ± 218 cpm for carbamazepine-treated cultures = 100%). Similar results were obtained in three independent experiments.
DISCUSSION
Adenosine caused a pronounced potentiation of PE-mediated IP accumulation in most astrocyte cultures established from different parts of the rat brain (cortex, hippocampus, thalamus, and tegmentum). This effect is mediated by adenosine A1 receptors, as has been shown previously for hippocampal astrocyte cultures (Biber et al., 1996). The extent of the adenosine-mediated poten- tiation in hippocampal, cortical, thalamic, and tegmental cultures was of similar magnitude (approximately twofold), whereas astrocytes cultivated from other brain regions or from total brain showed no or little synergistic effects on A1 receptor activation. Because CPA alone had no effect on IP accumulation and astrocyte cultures from cerebellum showed the most pronounced IP accumulation on PE stimulation but no potentiation by A1 adenosinergic costimulation, it is concluded that IP formation induced by PE is necessary but not sufficient for an A1 receptor-mediated increase in IP accumulation. It is not clear why A1receptor-mediated activation of PLC very often occurs synergistically with other receptors. In DDT1 MF-2 smooth muscle cells an increase in intracellular calcium is required for the adenosine-induced potentiation of IP formation, which has led to the speculation that this elevated intracellular calcium enables the manifestation of an otherwise latent A1 receptor-stimulated pathway (Schachter et al., 1992).
In mouse astrocytes it was shown that glutamate is implicated in activation of PLC by adenosine. In our hands, no evidence points to a role of extracellular glutamate for the potentiating effect of adenosine. Enzymatic degradation of extracellular glutamate or inhibition of glutamate uptake had no effect on IP accumulation induced by CPA. In addition, cultures from tegmentum showed no significant potentiation of PE-induced IP accumulation by 100 μmglutamate even in the presence of the glutamate uptake inhibitor PDC. However, a pronounced synergistic effect on costimulation with PE and 1 μm CPA was observed in these cultures. On the other hand, we found marked glutamate-induced IP accumulation in cultures from other brain regions (e.g., striatum), which did not correlate with A1 receptor-induced potentiation (our unpublished results). Moreover, results from glutamate uptake experiments indicate that CPA did not inhibit astrocytic glutamate uptake in these cultures. It is, therefore, concluded that an increase in extracellular glutamate is not responsible for the adenosine A1 receptor-induced potentiation of IP formation in primary astrocyte cultures from rat brain. It is known that adenosine effects on the IP system in the same brain region may differ from one species to another (Alexander et al., 1989) and that astrocytes cultivated from embryonic or neonatal brain may exhibit differences in the expression of a variety of receptors (Hans-son, 1990). Such differences may explain the results on adenosine-mediated PLC stimulation revealed in astrocyte cultures from mouse and rat brain.
Like others (El-Etr et al., 1992; Dickenson and Hill, 1993; Akbar et al., 1994; Freund et al., 1994), we found that PTX completely abolished A1 receptor potentiation of PLC activity, confirming an active role of Gi/o-proteins in this process. There is no evidence that α subunits of Gi/o-proteins have any effects on PLC (Neer, 1995), but it is widely accepted that βγ subunits are the signal transducers for the PTX-sensitive PLC stimulation mediated by Gi/o-proteins (Zhu and Birnbaumer, 1996). Hence, the adenosinergic potentiation of IP formation in rat astrocyte cultures most probably is attributable to an activation of PLCβ through βγ subunits. This contention is supported by the following findings.
Saturation experiments with the specific A1 receptor radioligand [3H]DPCPX revealed different levels of receptor in cells of different origin. These radioligand binding data correlated with receptor mRNA levels indicating that the content of A1 receptor protein corresponds with the expression of A1 receptor mRNA. Stimulation of adenosine A1receptors resulted in a concentration-dependent inhibition of cyclic AMP production with an IC50 value of ∼10 nmCPA and a maximal inhibition of ∼50% at 100 nm CPA in astrocytes derived from all brain regions, irrespective of the level of mRNA and A1 receptor protein. In contrast, the potentiating effect on PLC was found only in cultures with higher levels of adenosine A1 receptors. In addition, CPA concentrations for EC50 values (∼100 nm) and maximal potentiating effect (at 1 μm CPA) were 10-fold higher than those for inhibition of cyclic AMP production, suggesting that the coupling of adenosine A1 receptors to adenylyl cyclase is more efficient than their coupling to PLCβ.
These observations strongly suggest that the potentiation of IP accumulation is a Gβγ-mediated effect. Indeed, the affinity of βγ subunits for their target enzymes is much lower (10–100 fold), as compared with α subunits (Birnbaumer, 1992; Park et al., 1993;Sternweiss, 1994; Müller and Lohse, 1995). Thus, more βγ subunits are necessary to activate PLCβ than α subunits to inhibit adenylyl cyclase. Additional experiments with mastoparan, the Gi/o-protein-activating peptide, verified that βγ-mediated PLC activation occurs with approximately similar efficacy in astrocyte cultures from all brain regions. This documents that in all cell types sufficient Gi/o-protein is available to release βγ subunits for a substantial PLCβ response.
A compelling explanation for the striking correlation between the magnitude of the synergistic effect of A1 receptor activation and the levels of A1 receptor is, therefore, that at low receptor levels such as in striatal or cerebellar cultures the extent of release of βγ subunits is not sufficient for activation of PLCβ. However, because of the higher affinity of α subunits for their target enzymes, even low levels of A1receptors appear to be sufficient to mediate an inhibition of adenylyl cyclase.
Taken together, the data lead us to conclude that the ability of adenosine A1 receptors to activate PLCβ and to potentiate the formation of IPs is determined by the expression level of the receptor in the cell. This conclusion is in accordance with results obtained in other systems: M2 muscarinic receptors expressed in Chinese hamster ovary (CHO) cells inhibited adenylyl cyclase and stimulated PLC, and both effects were PTX-sensitive. However, the inhibitory action on adenylyl cyclase was independent of the receptor level, whereas the stimulatory action on PLC depended on increased expression of the receptor in the cell (Ashkenazi et al., 1987). DDT1 MF-2 cells, which show an A1agonist-mediated potentiation of bradykinin-evoked (Gerwins and Fredholm, 1992a) and ATP-evoked (Gerwins and Fredholm, 1992b) IP accumulation, have high levels of adenosine A1 receptors (Gerwins and Fredholm, 1991). In these cells the coupling of A1 receptors to PLC was less efficient than the inhibitory coupling of A1 receptors to adenylyl cyclase (Gerwins and Fredholm, 1991, 1992a). Similarly, efficient inhibitory coupling to adenylyl cyclase and less efficient potentiation of PLC activity also was found for A1 receptors transfected into CHO cells (Freund et al., 1994) and for other Gi/o-protein receptors like α2 adrenergic receptors (Cotecchia et al., 1990), serotonin 5-HT1A receptors (Raymond et al., 1992), and D2 dopamine receptors (Vallar et al., 1992). In preliminary experiments we have shown that upregulation of adenosine A1receptors in cells with very low receptor levels (cerebellum) gives rise to the potentiating effect seen in other cultures. This observation supports the notion that alterations of receptor expression might be an important mechanism for differential regulation of receptor-mediated signaling to separate effector enzymes.
G-protein βγ subunits not only stimulate PLC but also can activate several types of adenylyl cyclases, modify K+ and Ca2+ channels, and play an important role in receptor desensitization (for review, see Müller and Lohse, 1995). It is, therefore, possible that adenosine A1receptors via βγ-mediated signaling could regulate effector systems other than adenylyl cyclase and that this regulation is determined by receptor expression. Interestingly, human adenosine A1receptor mRNA occurs in two splice variants that encode for the same receptor but differ markedly in their efficacy of translation (Ren and Stiles, 1994a,b). It is tempting to speculate that one reason for this subtle regulation could be that the amount of A1 receptors not only determines the intensity of one given signal but also, via βγ subunit-mediated signaling, controls the degree of cross-talk to and desensitization of other signal-transducing systems (Bygrave and Roberts, 1995).
In summary, we have shown that, in primary astrocyte cultures from neonatal rat brain, A1 receptors couple to two different signal transduction systems. The A1receptor-mediated stimulation of PLC is independent of extracellular glutamate, and, in contrast to coupling of the receptor to adenylyl cyclase, there is a strict correlation between PLC coupling and the level of adenosine A1 receptors. It is concluded that G-protein βγ subunits are the signal transducers for the A1 signal to PLC and that the magnitude of this signal is determined by the expression of the receptor in the cell.
Footnotes
This work was supported by Deutsche Forschungsgemeinschaft Grants Ca 115/1-5/2-5 and Ge 486/6-1/9-1. We gratefully acknowledge the valuable help in statistical calculations by G. Spraul and skillful technical assistance by C. Adamovic.
Correspondence should be addressed to Dr. Dietrich van Calker, Department of Psychiatry, University of Freiburg, Hauptstrasse 5, D-79104 Freiburg, Germany.
REFERENCES
- 1.Akbar M, Okajima F, Tomura H, Shimegi S, Kondo Y. A single species of A1 adenosine receptor expressed in Chinese hamster ovary cells not only inhibits cAMP accumulation but also stimulates phospholipase C and arachidonic acid release. Mol Pharmacol. 1994;45:1036–1042. [PubMed] [Google Scholar]
- 2.Alexander SPH, Kendall DA, Hill SJ. Differences in the adenosine receptors modulating inositol phosphates and cyclic AMP accumulation in mammalian cerebral cortex. Br J Pharmacol. 1989;98:1241–1248. doi: 10.1111/j.1476-5381.1989.tb12670.x. [DOI] [PMC free article] [PubMed] [Google Scholar]
- 3.Appel K, Buttini M, Sauter A, Gebicke-Härter PJ. Cloning of rat interleukin-3 receptor β-subunit from cultured microglia and its mRNA expression in vivo. J Neurosci. 1995;15:5800–5809. doi: 10.1523/JNEUROSCI.15-08-05800.1995. [DOI] [PMC free article] [PubMed] [Google Scholar]
- 4.Ashkenazi A, Winslow JW, Peralta EG, Peterson GL, Schimerlik MI, Capon DJ, Ramachandran J. An M2 muscarinic receptor subtype coupled to both adenylyl cyclase and phosphoinositide turnover. Science. 1987;238:672–675. doi: 10.1126/science.2823384. [DOI] [PubMed] [Google Scholar]
- 5.Ayane M, Nielsen P, Köhler G. Cloning and sequencing of mouse ribosomal protein S12 cDNA. Nucleic Acids Res. 1989;17:6722–6728. doi: 10.1093/nar/17.16.6722. [DOI] [PMC free article] [PubMed] [Google Scholar]
- 6.Berridge MJ. Inositol trisphosphate and calcium signalling. Nature. 1993;361:315–325. doi: 10.1038/361315a0. [DOI] [PubMed] [Google Scholar]
- 7.Biber K, Walden J, Gebicke-Härter PJ, Berger M, van Calker D. Carbamazepine inhibits the potentiation by adenosine analogues of agonist-induced inositol phosphate formation in hippocampal astrocyte cultures. Biol Psychiatry. 1996;40:563–567. doi: 10.1016/0006-3223(96)00031-5. [DOI] [PubMed] [Google Scholar]
- 8.Biden TJ, Browne CL. Cross-talk between muscarinic- and adenosine-receptor signalling in the regulation of cytosolic free Ca2+ and insulin secretion. Biochem J. 1993;293:721–728. doi: 10.1042/bj2930721. [DOI] [PMC free article] [PubMed] [Google Scholar]
- 9.Birnbaumer L. Receptor to effector signaling through G-proteins: roles for βγ dimers as well as α subunits. Cell. 1992;71:1069–1072. doi: 10.1016/s0092-8674(05)80056-x. [DOI] [PubMed] [Google Scholar]
- 10.Bygrave FL, Roberts HR. Regulation of cellular calcium through signaling cross-talk involves an intricate interplay between the actions of receptors G-proteins and second messengers. FASEB J. 1995;9:1297–1303. doi: 10.1096/fasebj.9.13.7557019. [DOI] [PubMed] [Google Scholar]
- 11.Chomczynski P, Sacchi N. Single-step method of RNA isolation by acid guanidinium thiocyanate-phenol-chloroform extraction. Anal Biochem. 1987;162:156–159. doi: 10.1006/abio.1987.9999. [DOI] [PubMed] [Google Scholar]
- 12.Cotecchia S, Kolbika BK, Daniel KW, Nolan RD, Lapentina EY, Caron MG, Lefkowitz RJ, Regan JW. Multiple second messenger pathways of α-adrenergic receptor subtypes expressed in eukaryotic cells. J Biol Chem. 1990;265:63–69. [PubMed] [Google Scholar]
- 13.Dickenson JM, Hill SJ. Adenosine A1-receptor stimulated increases in intracellular calcium in the smooth muscle cell line DDT1 MF-2. Br J Pharmacol. 1993;108:85–92. doi: 10.1111/j.1476-5381.1993.tb13444.x. [DOI] [PMC free article] [PubMed] [Google Scholar]
- 14.El-Etr M, Cordier J, Glowinski J, Premont N. A neuroglial cooperativity is required for the potentiation by 2-chloroadenosine of the muscarinic-sensitive phospholipase C in the striatum. J Neurosci. 1989;9:1473–1480. doi: 10.1523/JNEUROSCI.09-05-01473.1989. [DOI] [PMC free article] [PubMed] [Google Scholar]
- 15.El-Etr M, Marin P, Tence M, Delumeau JC, Cordier J, Glowinski J, Premont N. 2-Chloroadenosine potentiates the α1-adrenergic activation of phospholipase C through a mechanism involving arachidonic acid and glutamate in striatal astrocytes. J Neurosci. 1992;12:1363–1369. doi: 10.1523/JNEUROSCI.12-04-01363.1992. [DOI] [PMC free article] [PubMed] [Google Scholar]
- 16.Fiebich BF, Biber K, Gyufko K, Berger M, Bauer J, van Calker D. Adenosine A2b-receptors mediate an increase in interleukin (IL)-6 mRNA and IL-6 protein synthesis in human astroglioma cells. J Neurochem. 1996a;66:1426–1431. doi: 10.1046/j.1471-4159.1996.66041426.x. [DOI] [PubMed] [Google Scholar]
- 17.Fiebich BF, Biber K, Lieb K, van Calker D, Berger M, Bauer J, Gebicke-Härter P. Cyclo-oxygenase-2 expression in rat microglia is induced by adenosine A2a receptors. Glia. 1996b;18:152–160. doi: 10.1002/(SICI)1098-1136(199610)18:2<152::AID-GLIA7>3.0.CO;2-2. [DOI] [PubMed] [Google Scholar]
- 18.Fredholm BB, Abbrachio MP, Burnstock G, Daly JW, Harden KT, Jacobson KA, Leff P, Williams M. VI. Nomenclature and classification of purinoceptors. Pharmacol Rev. 1994;46:143–156. [PMC free article] [PubMed] [Google Scholar]
- 19.Freund S, Ungerer M, Lohse MJ. A1 adenosine receptors expressed in CHO cells couple to adenylyl cyclase and to phospholipase C. Naunyn Schmiedebergs Arch Pharmacol. 1994;350:49–56. doi: 10.1007/BF00180010. [DOI] [PubMed] [Google Scholar]
- 20.Gebicke-Härter PJ, Bauer J, Schobert A, Northoff H. Lipopolysaccharide free conditions in primary astrocyte cultures allow growth and isolation of microglial cells. J Neurosci. 1989;9:183–194. doi: 10.1523/JNEUROSCI.09-01-00183.1989. [DOI] [PMC free article] [PubMed] [Google Scholar]
- 21.Gebicke-Härter PJ, Christoffel F, Timmer J, Northoff H, Berger M, van Calker D. Both adenosine A1 and A2 receptors are required to stimulate microglial proliferation. Neurochem Int. 1996;29:37–42. [PubMed] [Google Scholar]
- 22.Gerwins P, Fredholm BB. Glucocorticoid receptor activation leads to up-regulation of adenosine A1 receptors and down-regulation of adenosine A2 responses in DDT1 MF2 smooth muscle cells. Mol Pharmacol. 1991;40:149–155. [PubMed] [Google Scholar]
- 23.Gerwins P, Fredholm BB. Stimulation of adenosine A1-receptors and bradykinin receptors which act via different G-proteins synergistically raises inositol 1,4,5-trisphosphate and intracellular free calcium in DDT1 MF-2 smooth muscle cells. Proc Natl Acad Sci USA. 1992a;89:7330–7334. doi: 10.1073/pnas.89.16.7330. [DOI] [PMC free article] [PubMed] [Google Scholar]
- 24.Gerwins P, Fredholm BB. ATP and its metabolite adenosine act synergistically to mobilize intracellular calcium via the formation of inositol 1,4,5-trisphosphate in a smooth muscle cell line. J Biol Chem. 1992b;267:16081–16087. [PubMed] [Google Scholar]
- 25.Hansson E. Regional heterogeneity among astrocytes in the central nervous system. Neurochem Int. 1990;16:237–245. doi: 10.1016/0197-0186(90)90097-d. [DOI] [PubMed] [Google Scholar]
- 26.Higashijima T, Burnier J, Ross E. Regulation of Gi and Go by mastoparan-related amphilic peptides and hydrophobic amines. J Biol Chem. 1990;265:14176–14186. [PubMed] [Google Scholar]
- 27.Lee CH, Park D, Wu D, Rhee SG, Simon MI. Members of the Gqα subunit gene family activate PLCβ isozymes. J Biol Chem. 1992;267:16044–16047. [PubMed] [Google Scholar]
- 28.Lohse MJ, Klotz K-N, Lindenborn-Fotinos J, Reddington M, Schwabe U, Olsson RA. 8-Cyclopentyl-1,3-dipropylxanthine (DPCPX)—a selective high affinity antagonist radioligand for A1 adenosine receptors. Naunyn Schmiedebergs Arch Pharmacol. 1987;336:204–210. doi: 10.1007/BF00165806. [DOI] [PubMed] [Google Scholar]
- 29.Lupica CR, Berman RF, Jarvis MF. Chronic theophylline treatment increases adenosine A1, but not A2, receptor binding in the rat brain: an autoradiographic study. Synapse. 1991;9:95–102. doi: 10.1002/syn.890090203. [DOI] [PubMed] [Google Scholar]
- 30.Mahan LC, McVittie LD, Smyk-Randall EM, Nakata H, Monsma FJ, Gerfen CR, Sibley DR. Cloning and expression of an A1 adenosine receptor from rat brain. Mol Pharmacol. 1991;40:1–7. [PubMed] [Google Scholar]
- 31.Marangos PJ, Montgomery P, Weiss SRB, Patel J, Post RM. Persistent upregulation of brain adenosine receptors in response to chronic carbamazepine treatment. Clin Neuropharmacol. 1987;10:443–448. doi: 10.1097/00002826-198710000-00006. [DOI] [PubMed] [Google Scholar]
- 32.Müller S, Lohse MJ. The role of G-protein beta gamma subunits in signal transduction. Biochem Soc Trans. 1995;23:141–148. doi: 10.1042/bst0230141. [DOI] [PubMed] [Google Scholar]
- 33.Neer EJ. Heterotrimeric G-proteins: organizers of transmembrane signals. Cell. 1995;80:249–257. doi: 10.1016/0092-8674(95)90407-7. [DOI] [PubMed] [Google Scholar]
- 34.O’Brien RJ, Fischbach GD. Modulation of embryonic chick motoneuron glutamate sensitivity by interneurons and agonists. J Neurosci. 1986;6:3290–3296. doi: 10.1523/JNEUROSCI.06-11-03290.1986. [DOI] [PMC free article] [PubMed] [Google Scholar]
- 35.Okajima F, Tomura H, Sho K, Akbar M, Madjid MA, Kondo Y. Intracellular cross-talk between thyrotropin receptor and A1 adenosine receptor in regulation of phospholipase C and adenylate cyclase in COS-7 cells transfected with their receptor genes. Biochem J. 1995;306:709–715. doi: 10.1042/bj3060709. [DOI] [PMC free article] [PubMed] [Google Scholar]
- 36.Park D, Jhon D-Y, Lee C, Lee KH, Rhee SG. Activation of phospholipase C isozymes by G-protein beta gamma subunits. J Biol Chem. 1993;268:4573–4576. [PubMed] [Google Scholar]
- 37.Raymond JR, Albers FJ, Middleton JP. Functional expression of human 5-HT 1A receptors and differential coupling to second messengers in CHO cells. Naunyn Schmiedebergs Arch Pharmacol. 1992;346:127–137. doi: 10.1007/BF00165293. [DOI] [PubMed] [Google Scholar]
- 38.Ren H, Stiles GL. Characterization of human A1 adenosine receptor gene. J Biol Chem. 1994a;269:3104–3110. [PubMed] [Google Scholar]
- 39.Ren H, Stiles GL. Post-translational mRNA processing as a mechanism for regulation of human A1 adenosine receptor expression. Proc Natl Acad Sci USA. 1994b;91:4864–4866. doi: 10.1073/pnas.91.11.4864. [DOI] [PMC free article] [PubMed] [Google Scholar]
- 40.Schachter JB, Ivins JK, Pittman RN, Wolfe BB. Competitive regulation of phospholipase C responses by cAMP and calcium. Mol Pharmacol. 1992;41:577–586. [PubMed] [Google Scholar]
- 41.Sternweiss PC. The active role of beta gamma in signal transduction. Curr Opin Cell Biol. 1994;6:198–203. doi: 10.1016/0955-0674(94)90136-8. [DOI] [PubMed] [Google Scholar]
- 42.Sternweiss PC, Smrcka AV. Regulation of phospholipase C by G-proteins. Trends Biochem Sci. 1992;17:502–506. doi: 10.1016/0968-0004(92)90340-f. [DOI] [PubMed] [Google Scholar]
- 43.Vallar L, Muca C, Magni M, Albert P, Bunzow J, Meldolesi J, Civelli O. Differential coupling of dopamine D2 receptors expressed in different cell types. J Biol Chem. 1992;265:10320–10326. [PubMed] [Google Scholar]
- 44.van Calker D, Müller M, Hamprecht B. Adrenergic α- and β-receptors expressed by the same cell type in primary cultures of perinatal mouse brain. J Neurochem. 1978a;30:713–718. doi: 10.1111/j.1471-4159.1978.tb10776.x. [DOI] [PubMed] [Google Scholar]
- 45.van Calker D, Müller M, Hamprecht B. Adenosine inhibits the accumulation of cyclic AMP in cultured brain cells. Nature. 1978b;276:839–841. doi: 10.1038/276839a0. [DOI] [PubMed] [Google Scholar]
- 46.van Calker D, Müller M, Hamprecht B. Adenosine regulates via two different types of receptors the accumulation of cyclic AMP in cultured brain cells. J Neurochem. 1979;33:999–1005. doi: 10.1111/j.1471-4159.1979.tb05236.x. [DOI] [PubMed] [Google Scholar]
- 47.van Calker D, Assmann K, Greil W. Stimulation by bradykinin, angiotensin II, and carbachol of the accumulation of inositol phosphates in PC-12 pheochromocytoma cells: differential effects of lithium ions on inositol mono- and polyphosphates. J Neurochem. 1987;49:1379–1385. doi: 10.1111/j.1471-4159.1987.tb01003.x. [DOI] [PubMed] [Google Scholar]
- 48.Williams M. Purinoceptors in central nervous system function. In: Bloom FE, Kupfer DJ, editors. Psychopharmacology: the fourth generation of progress. Raven; New York: 1995. pp. 643–655. [Google Scholar]
- 49.Wu D, Katz A, Simon MI. Activation of PLC β2 by the α and βγ subunits of trimeric GTP-binding proteins. Proc Natl Acad Sci USA. 1993;90:5297–5301. doi: 10.1073/pnas.90.11.5297. [DOI] [PMC free article] [PubMed] [Google Scholar]
- 50.Zhu X, Birnbaumer L. G-protein subunits and the stimulation of phospholipase C by Gs- and Gi-coupled receptors: lack of receptor selectivity of Gα and the evidence for a synergistic interaction between Gβγ and the α subunit of a receptor-activated G-protein. Proc Natl Acad Sci USA. 1996;93:2827–2831. doi: 10.1073/pnas.93.7.2827. [DOI] [PMC free article] [PubMed] [Google Scholar]