

Abstract
Alzheimer’s disease (AD) is associated with defects in mitochondrial function. Mitochondrial-based disturbances in calcium homeostasis, reactive oxygen species (ROS) generation, and amyloid metabolism have been implicated in the pathophysiology of sporadic AD. The cellular consequences of mitochondrial dysfunction, however, are not known. To examine these consequences, mitochondrially transformed cells (cybrids) were created from AD patients or disease-free controls. Mitochondria from platelets were fused to ρ0 cells created by depleting the human neuroblastoma line SH-SY5Y of its mitochondrial DNA (mtDNA). AD cybrids demonstrated a 52% decrease in electron transport chain (ETC) complex IV activity but no difference in complex I activity compared with control cybrids or SH-SY5Y cells. This mitochondrial dysfunction suggests a transferable mtDNA defect associated with AD. ROS generation was elevated in the AD cybrids. AD cybrids also displayed an increased basal cytosolic calcium concentration and enhanced sensitivity to inositol-1,4,5-triphosphate (InsP3)-mediated release. Furthermore, they recovered more slowly from an elevation in cytosolic calcium induced by the InsP3 agonist carbachol. Mitochondrial calcium buffering plays a major role after this type of perturbation. β-amyloid (25–35) peptide delayed the initiation of calcium recovery to a carbachol challenge and slowed the recovery rate. Nerve growth factor reduced the carbachol-induced maximum and moderated the recovery kinetics. Succinate increased ETC activity and partially restored the AD cybrid recovery rate. These subtle alterations in calcium homeostasis and ROS generation might lead to increased susceptibility to cell death under circumstances not ordinarily toxic.
Keywords: Alzheimer’s disease, mitochondria, calcium, neurodegeneration, reactive oxygen species, nerve growth factor, β-amyloid
Alzheimer’s disease (AD) is a devastating, progressive dementia accounting for 50% of all dementias (Greenburg, 1994). Some factors contributing to AD include β-amyloid precursor protein (APP) mutations, ApoE genotype, transmembrane proteins S182 and STM2, reduced glucose transport, excitotoxins, head trauma, and deficiencies in mitochondrial cytochrome c oxidase (COX or complex IV) activity (Parker et al., 1990b, 1994a,b; Parker, 1991;Chandrasekaran et al., 1992; Kish et al., 1992; Mutisya et al., 1994;Mattson, 1995; Yanker, 1996; Davis et al., 1997). The idea of a mitochondrial component to neurodegenerative diseases is not new, and it has also been proposed for Parkinson’s disease and Guam Parkinsonism/Dementia Complex (Parker et al., 1990a, 1994a; Beal, 1995). The complex IV lesion resembles other electron transport chain (ETC) defects known to produce Leber’s neuropathy and neuropathy–ataxia–retinitis pigmentosa (Singh et al., 1989; Goto et al., 1990; Shoffner et al., 1990; Howell et al., 1991; Ortiz et al., 1993). In vivo complex IV inhibition with azide causes defects in learning and memory and alters hippocampal potentiation (Bennett et al., 1992, 1996). COX dysfunction also increases free radicals, reduces energy stores, and disturbs amyloid metabolism (Gabuzda et al., 1994; Mutisya et al., 1994; Smith et al., 1996; Davis et al., 1997). COX dysfunction is associated with Down’s syndrome; many Down’s syndrome patients develop AD (Prince et al., 1994; Busciglio and Yanker, 1995). Mutations in mitochondrial COX genes also seem to segregate with late-onset AD (Davis et al., 1996, 1997).
Whether the mitochondrial defect resulting in decreased COX activity is a primary causative factor or a downstream effect of other factors remains unknown. Nevertheless, knowledge of the functional consequences of mitochondrial dysfunction is important for understanding the basis of selective neuronal vulnerability (Beal, 1995). Mitochondrial defects and decreased COX activity seem to be upstream relative to the selective neuronal loss in AD (Davis et al., 1997).
A novel technique for studying diseases associated with mitochondria was described by King and Attardi (1989). Mitochondrial DNA (mtDNA)-depleted cells, termed ρ0, were prepared by ethidium bromide treatment, and then these cells were repopulated with exogenous mitochondria (King and Attardi, 1989). These cytoplasmic hybrids (cybrids) enable in vitro comparison of mitochondrial differences (Johns, 1996). Miller et al. (1996) produced ρ0 cells starting from the human SH-SY5Y neuroblastoma line. Exogenous mitochondria were introduced by fusing human platelets with ρ0 cells (Swerdlow et al., 1996). Although complex I activity was comparable in the SH-SY5Y cells and in the AD and control cybrids, complex IV activity in the AD cybrids was reduced (Glasco et al., 1995).
Using these cybrids, we examined the functional consequences of a mitochondrial complex IV defect associated with AD. The complex IV defect has subtle consequences, including an elevation in AD cybrid cytosolic calcium and a net difference in carbonyl cyanidem-chlorophenylhydrazone (CCCP) releaseable mitochondrial calcium stores. The most pronounced difference is a delay in the calcium recovery rate of the AD cybrids after stimulation with the inositol-1,4,5-triphosphate (InsP3)-inducing agonist carbachol.
MATERIALS AND METHODS
Materials. ATP, ADP, and AMP standards for HPLC were prepared from Sigma (St. Louis, MO) reagents. A dimethylsulfoxide (DMSO) stock of CCCP (10 mm; Sigma) was used. The dilution factor for the DMSO stock was 1:1000. Thus, the DMSO concentration in the working solutions was small, and any effect it might have should be minimal. A carbachol chloride stock (10 mm; Sigma) was made in Tyrode’s solution, pH 7.3. The HEPES/Krebs/Ringer’s solution buffer (HKRB) consisted of the following: 20 mm HEPES, 103 mm NaCl, 4.77 mm KCl, 0.5 mmCaCl2, 1.2 mm MgCl2, 1.2 mm KH2PO4, 25 mm NaHCO3, and 15 mm glucose in sterile water titrated to pH 7.3. The succinate stock (5 mm; Sigma) was created in sterile HKRB. Mouse nerve growth factor (NGF) (2.5S) was obtained from Dr. Gene Johnson at the University of Washington (St. Louis, MO); a 10 μg/ml NGF stock was made in unbuffered saline. The amyloid β-protein (25–35) (lot no. B01028) and control amyloid β-protein (35–25) (lot no. SL817) were obtained from Bachem (King of Prussia, PA). A 0.5 mmaqueous-based stock solution of each amyloid β-protein was prepared 1–2 hr before experimentation; dilution of the stock solution in medium was performed to achieve a working 40 μmconcentration of amyloid β-protein (Mattson et al., 1992).
Cell culture preparation. mtDNA-deficient ρ0cells, derived from the human SH-SY5Y neuroblastoma line, were obtained from MitoKor Corporation (San Diego, CA). The ρ0 cells have no detectable mtDNA, no cyanide-inhibitable oxygen utilization, and no detectable complex I or cytochrome c oxidase activity; they are auxotrophic for pyruvate (Miller et al., 1996). ρ0 cells were repopulated with platelet mitochondria from either control or AD patients through fusion in the presence of polyethylene glycol (Davis et al., 1997). Untransformed cells were killed through withdrawal of pyruvate from the culture medium (Miller et al., 1996; Swerdlow et al., 1996). The surviving cells were termed mitochondrial cybrids (i.e., cytoplasmic hybrids).
AD and control cybrids were grown in DMEM (Life Technologies, Grand Island, NY) supplemented with 10% fetal bovine serum (Hyclone, Logan, UT). Cells were plated onto uncoated glass-bottom microwells (MatTek Corporation, Ashland, MA) for the calcium studies, T75 tissue culture flasks (Costar Corporation, Cambridge, MA) for the HPLC analysis, or 96-well tissue culture plates (Nunc, Roskilde, Denmark) for the reactive oxygen species (ROS) assays.
Enzymatic assays and determination of total cellular protein. Complex I (NADH:ubiquinone oxidoreductase) was determined as described previously using the short chain ubiquinone analog coenzyme Q1 (Eisai Pharmaceuticals, Tokyo, Japan) (Mutisya et al., 1994). Complex IV activities were determined as described earlier (Parker et al., 1990b, 1994b; Swerdlow et al., 1996). All enzymatic activities are expressed as values normalized to total cellular protein (Lowry Protein Assay; Pierce, Rockford, Illinois).
Adenine nucleotide measurement by HPLC ATP, ADP, and AMP levels of the cybrids were measured using anion-exchange HPLC (Meghji et al., 1989). Recovery of the adenine nucleotide contents from cells was in excess of 90% (Shryock et al., 1986). Cells were harvested from confluent T75 flasks with an 80% HPLC grade methanol (J. T. Baker Chemical Company, Phillipsburg, NJ) and 0.5 mm EGTA (Sigma) solution at 70–75°C. The extract was then centrifuged, and the supernatant removed. Extracts were evaporated to dryness using a vacuum desiccator. Samples were reconstituted in HPLC grade water. An equal volume of a 1:4 mixture of heptane (Sigma) and freon (J. T. Baker) solution was added to each sample. Samples were then vortexed for 2 min and centrifuged to separate aqueous and organic layers. The upper aqueous layer contained the compounds of interest, whereas the lower one contained unwanted lipids and organic solvents.
For each sample, a 100 μl volume was injected into a weak anion-exchange column (Beckman 4.6 × 250 mm ZO; Beckman Instruments, San Ramon, CA). Buffer A was a 5 mmNH4H2PO4 aqueous-based solution; buffer B was a 750 mmNH4H2PO4 solution. Each buffer was titrated to pH 4.0 with solid sulfamic acid and passed through a 0.22 μm filter. The gradient was linear from 0 to 100% of buffer B in 30 min, followed by a 3 min hold at 100% of buffer B, and then a gradual reversal to 100% of buffer A for column reequilibration. The total flow rate was 1.6 ml/min. Complete run time was 64 min, and the analysis was completed at ambient temperature. A dry-packed precolumn preceded the main analytical column. The absorbance of the column effluent was measured at 254 nm by a Beckman System Gold Chromatographer. The autosampler used to inject the samples was a Beckman model 506.
Nucleotide and nucleoside standards were prepared and run through the column to confirm peak identification. Quantitation of compounds was attained by comparing the integrated areas of the sample peaks with those of the standards. The bioenergetic state of the cell was calculated using the following equation: [(ATP + 0.5 × ADP)/(ATP + ADP + AMP)] (Ankarcrona et al., 1995).
ROS assay. The ROS assay was modified from previously described techniques (Rosenkranz et al., 1992; Trayner et al., 1995;Miller et al., 1996; Swerdlow et al., 1996). Cells were plated at a density of 100,000 cells/well in 96-well tissue culture plates and allowed to grow for 24 hr in DMEM supplemented with 10% fetal bovine serum. The medium was then removed, and the cells were rinsed twice in HKRB. Cells were then incubated in a 30 μm solution of 2′,7′-dichlorodihydrofluorescein diacetate (H2DCFDA) (Molecular Probes, Eugene, OR) for 2 hr during which time they were shielded from light. Cells were again washed twice with HKRB, and then cells in each well were incubated in 200 μl of HKRB at 37°C for 60 min. The H2DCFDA fluorescence resulting from interaction of the dye with ROS was read using a Fluoroskan II (Flow Laboratories, McLean, VA) with the excitation and emission wavelengths set at 485 and 538 nm, respectively.
Immediately after measurement of the H2DCFDA fluorescence, a quantitative lactate dehydrogenase (LDH) absorbance assay was performed using a commercial LDH assay kit according to the manufacturer’s recommendations (Promega, Madison, WI). In brief, the assay involves cell lysis, release of LDH, and a 30 min coupled enzymatic assay resulting in the conversion of a tetrazolium salt into a red formazan product. Absorbance was read at 490 nm on an automated microplate reader, model EL311sx (Bio-Tek Instruments, Winooski, VT). The LDH absorbance assay has been demonstrated to correlate with total cell number (Moravec, 1994; Rhodes, 1996). The ratio of the H2DCFDA fluorescence to the LDH absorbance was taken as the extent of ROS generation normalized to cell number.
Measurement of cytosolic calcium. Cells were washed twice in HKRB and loaded with 16 μm fura-2 AM (Molecular Probes), 0.0833% pluronic F-127 (Molecular Probes), and 1% fetal bovine serum for 30 min at 37°C. Then, the cells were washed twice again in buffer and incubated at 37°C for 30 min, thereby permitting the cells to hydrolyze completely the AM ester. Afterward, the cells were ready for calcium imaging. During the entire loading process and thereafter, the cells were shielded from ambient light.
Cytosolic calcium was measured using the fluorescent dye fura-2. Cells were imaged using a Zeiss Axiovert inverted microscope equipped with a 20× objective (Carl Zeiss, Thornwood, NY) and C-Imaging version 2.0 software (Compix, Mars, PA). Excitation of the cells was performed at 340 nm for the bound form and 380 nm for the unbound form; emission was measured by a photomultiplier at 510 nm (a 10 nm bandpass). Excitation by the 100 W Hg lamp was attenuated with a 1.0 neutral density filter. Sampling frequency was performed at 1 Hz to avoid excessive bleaching of the fluorescent dye. Field diaphragms on the illumination and sampling ports served to minimize background fluorescence. Regions of interest (n) were defined to include one to three cells and excluded any area not covered by a cell.
Calcium concentrations were computed from fluorescence intensity ratios using the following equation (Grynkiewicz et al., 1985):
where R is the Fbound at 340nm/Funbound at 380nm,Rmin is the ratio when all the dye is unbound to calcium, and Rmax is the ratio when all the dye is maximally bound to calcium. Rmin was determined using a 2 mm EGTA solution and found to be 0.55. In a similar fashion, an Rmax of 3.3 was determined using a 50 μm digitonin solution. TheKd of 220 nm was computed using a calcium calibration buffer kit (Molecular Probes), and all experiments were conducted at 20–22°C. Cells were perfused with HKRB containing 0.5 mm [Ca2+], pH 7.3.
Estimation of cytosolic calcium recovery rates. To determine the cytosolic calcium recovery rate after carbachol stimulation, the fluorescence ratio (r = Fbound at 340nm/Funbound at 380nm) decay was analyzed as a function of time. Linear regression was performed to achieve a best fit line to the ratio decay starting from the carbachol-induced maximum fluorescence ratio and spanning the data to one of three endpoints as follows: (1) the point at which the cell achieved a stable fluorescence ratio baseline if the cell returned to an elevated baseline; (2) the point at which the cell attained the prestimulus fluorescence ratio if it recovered to such an extent; or (3) the endpoint during a 10 min calcium microfluorimetry recording period if the cell failed to achieve either a stable baseline or the prestimulus value. In this process, the slope (dR/dt) was computed. Experimental values are reported as the mean ± SEM. Mean Pearson correlation coefficients for the linear regression in each group were 0.874 ± 0.020 (SH-SY5Y), 0.973 ± 0.003 (control cybrid), and 0.903 ± 0.008 (AD cybrid).
RESULTS
Cybrid lines were created using mitochondria derived from four patients clinically diagnosed with AD and eight disease-free, age-matched controls. Individuals in the AD group met the National Institute of Neurological Communicative Disorders and Stroke and the Alzheimer’s Diseases and Related Disorders Association criteria for probable AD (McKhann et al., 1984). None of the AD patients were believed to have alternative diagnoses to explain their dementia, and none displayed autosomal dominant, familial forms of AD. Controls underwent numerous neuropsychological evaluations and were found to be dementia-free. Neither the AD nor control subjects had related systems degenerations, drug-induced dementia, or an alternative neurodegenerative disorder. Participation of AD and control subjects as donors of mtDNA was approved by the Institutional Review Board.
In this sample, AD and control subjects were of comparable age and had similar complex I activity (i.e., for both age and complex I activity,p ≫ 0.05 in unpaired t tests of AD and control subjects); however, the AD subjects had a 52% decrease in complex IV activity (p < 0.003; unpairedt test) compared with controls. Table 1details the ETC activities of the cybrid cells derived from the 12 subjects. This series was selected randomly from a larger one that also displayed a similar decrease in complex IV activity associated with AD subjects (Davis et al., 1997).
Table 1.
Attributes of Alzheimer’s disease and disease-free, age-matched subjects
| Patient | Age (years) | Patient (gender) | Complex I activity (nmol · min−1 · mg−1) | Complex IV activity [1/(sec × mg)] |
|---|---|---|---|---|
| Disease-free control 1 | 78 | Male | 39.6 | 0.0954 |
| Disease-free control 2 | 51 | Female | 34.9 | 0.0620 |
| Disease-free control 3 | 46 | Female | 40.9 | 0.0727 |
| Disease-free control 4 | 68 | Female | 29.6 | 0.0625 |
| Disease-free control 5 | 70 | Male | 38.9 | 0.0785 |
| Disease-free control 6 | 77 | Female | 35.7 | 0.0656 |
| Disease-free control 7 | 54 | Female | 29.2 | 0.0790 |
| Disease-free control 8 | 76 | Male | 35.7 | 0.0889 |
| Alzheimer’s disease 1 | 67 | Male | 30.5 | 0.0174 |
| Alzheimer’s disease 2 | 71 | Male | 35.0 | 0.0571 |
| Alzheimer’s disease 3 | 77 | Male | 35.3 | 0.0485 |
| Alzheimer’s disease 4 | 81 | Male | 33.4 | 0.0213 |
The subjects are identified by disease or disease-free and number, and each subject’s age (years), gender (male/female), complex I activity (nmol · min−1 · mg−1), and complex IV activity (sec−1/mg) are listed.
Cytosolic calcium
Resting or basal cytosolic calcium concentrations were determined for the SH-SY5Y cell line and the AD and control cybrids under two experimental conditions (Fig. 1). For the calcium experiments performed on the cybrids, the results are expressed as the means from four AD or eight control cybrid lines. The mean for each cybrid line is based on multiple, independent observations of single regions of interest. Regions of interest used for fluorescence imaging each contained approximately one to three cells and excluded acellular areas. For the SH-SY5Ys, basal cytosolic calcium in a saline buffer was 132 ± 11 nm (mean ± SEM;n = 11), and control cybrids in saline buffer had a cytosolic calcium concentration of 143 ± 12 nm(n = 8; three to four observations per control cybrid line). AD cybrids, however, had a significantly elevated value of 192 ± 10 nm (n = 4; eight to nine observations per cybrid line) (Fig. 1) (p < 0.05), compared with either the control cybrids or the parent SH-SY5Y cell line as evaluated by Fisher’s protected least significant difference (PLSD) ANOVA (StatView version 4.51; Abacus Concepts, Berkeley, CA).
Fig. 1.

Basal cytosolic calcium concentrations for SH-SY5Y cells and control and AD cybrids were measured under two different conditions. Calcium was measured using fura-2, and values represent the mean of the SH-SY5Y cells, four AD cybrid lines, and eight control cybrid lines. An asterisk indicates a statistically significant difference (p < 0.05) between values indicated by the brackets. Under saline buffer conditions, AD cybrids demonstrated elevated cytosolic calcium compared with either the SH-SY5Y line or the control cybrids. NGF caused a reduction in cytosolic calcium for the AD cybrids but an elevation for the SH-SY5Y cells.
Exposure of the cell lines to 10 ng/ml of 2.5S NGF for 24 hr increased the cytosolic calcium of the SH-SY5Y cells relative to the equivalent cell type in a saline-buffered medium (Fig. 1) (p < 0.05; unpaired t test). Exposure of the AD cybrids to NGF, however, decreased cytosolic calcium to 134 ± 16 nm (n = 4; four to five observations per AD cybrid line) compared with the AD cybrids in saline-buffered medium (Fig. 1) (p < 0.05; unpaired t test). Treatment of SH-SY5Y cells with 40 μm Aβ(25–35), a biologically active domain of the amyloid β-protein, for 1 hr resulted in an elevation of cytosolic calcium to 195 ± 35 nm (n = 6;p < 0.025). Similar amyloid treatments in control and AD cybrids resulted in no statistically significant differences as compared with AD and control cybrids under saline buffer conditions. Finally, exposure of all the cell lines to 40 μmAβ(35–25), an inactive control, for 1 hr resulted in no changes in cytosolic calcium concentrations.
Cellular energy state
Basal ATP, ADP, and AMP levels were measured in the SH-SY5Ys and cybrids to determine whether complex IV deficiencies of AD cybrids resulted in differences in the bioenergetic status of the cells. Energy quotient values (i.e., [ (ATP + 0.5 × ADP)/(ATP + ADP + AMP) ]) for the cell lines were as follows: SH-SY5Y = 0.64 ± 0.06 (mean ± SEM; n = 4); AD cybrid = 0.66 ± 0.05 (n = 4); and control cybrid = 0.64 ± 0.02 (n = 6), where n is the number of HPLC samples for the SH-SY5Ys and the number of cybrid lines analyzed for the ADs and controls (Fig. 2). The HPLC results are based on multiple, replicative experiments in which each AD cell line was analyzed twice, the parent SH-SY5Y cells were analyzed four times, and six of eight control cybrid lines were analyzed once. Thus, the basal bioenergetic states of the SH-SY5Ys and the AD and control cybrids were similar (i.e., all p values ≫ 0.05 by Fisher’s PLSD ANOVA). Hence, under basal conditions, mtDNA from AD patients has a minimal impact on cellular energy stores in this cybrid model system.
Fig. 2.

Basal energy quotients (i.e., [(ATP + 0.5 × ADP)/(ATP + ADP + AMP)]) were measured using anion-exchange HPLC. Energy quotients for all cell types were comparable.
Basal ROS production
Basal ROS production was assessed for the AD and control cybrid cell lines to determine the impact of a complex IV deficiency on ROS production. AD and control cybrid ROS production was computed as the quotient of the relative H2DCFDA fluorescence over the cell number normalization factor of LDH absorbance. The mean values for all AD and control cybrid lines were 15.1 ± 0.3 (mean ± SEM;n = 4) and 11.1 ± 0.2 (n = 8), respectively (Fig. 3). These ROS values are based on multiple, replicative experiments of each cybrid line. Thus, AD cybrids with their complex IV defect demonstrated a 36% increase in basal ROS production (p < 0.05; unpaired ttest).
Fig. 3.

Cellular ROS production was determined as the ratio of DCFDA fluorescence normalized per cell number by the LDH absorbance. Under basal conditions, AD cybrid lines showed an increased production of ROS (*p < 0.05).
Basal mitochondrial calcium sequestration
With significant differences in basal cytosolic calcium concentrations and ROS but none in the basal bioenergetic states between AD and control cybrids, we assessed the amount of calcium sequestered in mitochondria. Cells were exposed to 10 μmCCCP, a protonophore that dissipates the mitochondrial membrane potential, releases sequestered mitochondrial calcium stores, and irreversibly prevents mitochondrial calcium uptake. Rapid application of CCCP to cells incubated in HKRB caused the fluorescence ratio of bound to unbound fura-2 to increase transiently in both the AD and control cybrids (Fig. 4A). The CCCP-induced ratio maxima for the AD and control cybrids were 1.75 ± 0.034 (n = 4) and 1.72 ± 0.060 (n = 8), respectively. In terms of calcium concentrations rather than fluorescence ratios, the CCCP-induced peaks in cytosolic calcium in the AD and control cybrids were 369 ± 13 nm (n = 4) and 361 ± 38 nm (n = 8), respectively (Fig.4B). Both the fura ratios and the cytosolic calcium values are based on five to six observations for each AD cybrid line and three to four observations for each control cybrid line. The difference between the CCCP-induced cytosolic calcium peak of the cell and its basal cytosolic calcium concentration is attributable, at least in part, to release of calcium sequestered in the mitochondria of the cell. Therefore, because the AD cybrids have a higher basal cytosolic concentration but an overall CCCP-induced cytosolic calcium peak comparable to the control cybrids, the AD cybrid mitochondria may carry a smaller load of sequestered calcium than the control cybrid mitochondria (p < 0.01; unpaired ttest). The addition of CCCP to cells that had not been loaded with fura-2 resulted in no change in intrinsic fluorescence.
Fig. 4.

Cytosolic calcium after a CCCP stimulus.A, Both AD and control cybrid lines in a saline buffer were challenged with 10 μm CCCP in HKRB at the point indicated by the arrow. These traces are representative fura-2-based fluorescence ratios as a function of time for single regions of interest. CCCP-induced calcium elevations were transient. Only prestimulus baselines and subsequent stimulated calcium elevations to respective maxima are shown in these truncated traces.B, The CCCP-induced peak calcium levels for the AD (n = 4) and control (n = 8) cybrid lines were comparable; however, the amount of calcium sequestered in the mitochondria is actually the difference between the CCCP-induced calcium maximum and the basal cytosolic calcium concentration. Although CCCP-induced peaks are comparable between AD and control cybrids, the basal calcium concentration of AD cybrids is greater than control. Note the difference in prestimulus fura ratios indicative of the substantial basal cytosolic calcium difference between ADs and controls in A. Thus, under basal conditions, AD cybrid mitochondria sequester less calcium (p < 0.01).
Mitochondrial-based cytosolic calcium recovery kinetics
In the SH-SY5Y and cybrid cell lines, carbachol, an InsP3-inducing cholinergic agonist, causes a transient elevation in cytosolic calcium followed by a recovery generally to a stable baseline (either to a basal, prestimulus level or a somewhat elevated calcium concentration) over a time period of ∼10 min. Examination of calcium handling in the cybrid lines after a carbachol challenge revealed substantial differences. In particular, the derivatives of the fura fluorescence ratio (d(Fbound at 340nm/Funbound at 380nm)/dt) recoveries differed substantially between AD cybrids and controls. The recovery slopes of the AD and control cybrids are −0.00055 ± 0.000054 sec−1 (mean ± SEM; n= 4) and −0.0046 ± 0.00015 sec−1(n = 8), respectively (Fig. 5) (p < 0.01; unpaired t test). Figure5 illustrates the recovery slopes for each of four AD and eight control cell lines as indicated by a circle. Each circlerepresents a mean of six to seven observations per control cell line and six to eight observations per AD cell line. The error bars in Figure 5 indicate a range of ±2 SD. The apparently narrow distribution of recovery slopes within either the group of AD cybrid lines or the controls coupled with the obvious intergroup (i.e., ADs vs controls) differences (Fig. 5) prompted the statistical pooling of recovery slopes within groups for the remainder of the analysis.
Fig. 5.

Cytosolic calcium recovery slopes after a carbachol stimulus. Four AD cybrid lines and eight control lines were stimulated with 100 μm carbachol, and the mean fura fluorescence recovery slope after attainment of peak fluorescence for each cell line is depicted by a circle. Each AD cybrid line indicated by the circle is based on six to eight observations; each control line is the mean of six to seven observations. The error bars indicate ±2 SD from the overall group mean. The recovery slopes of the AD cybrid and control groups differ substantially (*p < 0.01; unpaired t test).
Representative fura-2 fluorescence ratio (Fbound at 340nm/ Funbound at 380nm) traces as a function of time after a carbachol stimulus are illustrated in Figures6A, 7A, and8A. Peak cytosolic calcium concentrations after stimulation with 100 μm carbachol for the cell lines were as follows: SH-SY5Y = 401 ± 26 nm(n = 12); AD cybrid = 428 ± 11 nm (n = 28); and control cybrid = 381 ± 14 nm (n = 28). Here and for the remainder of Results, n represents the number of regions of interest; approximately equal numbers of interest regions were examined per AD or control cybrid line in multiple, replicative experiments. Carbachol has approximately the same initial effect on cytosolic calcium in the SH-SY5Ys and control cybrids; however, the carbachol-induced peak in the AD cybrids was slightly elevated compared with control cybrids (p = 0.014; unpairedt test).
Fig. 6.
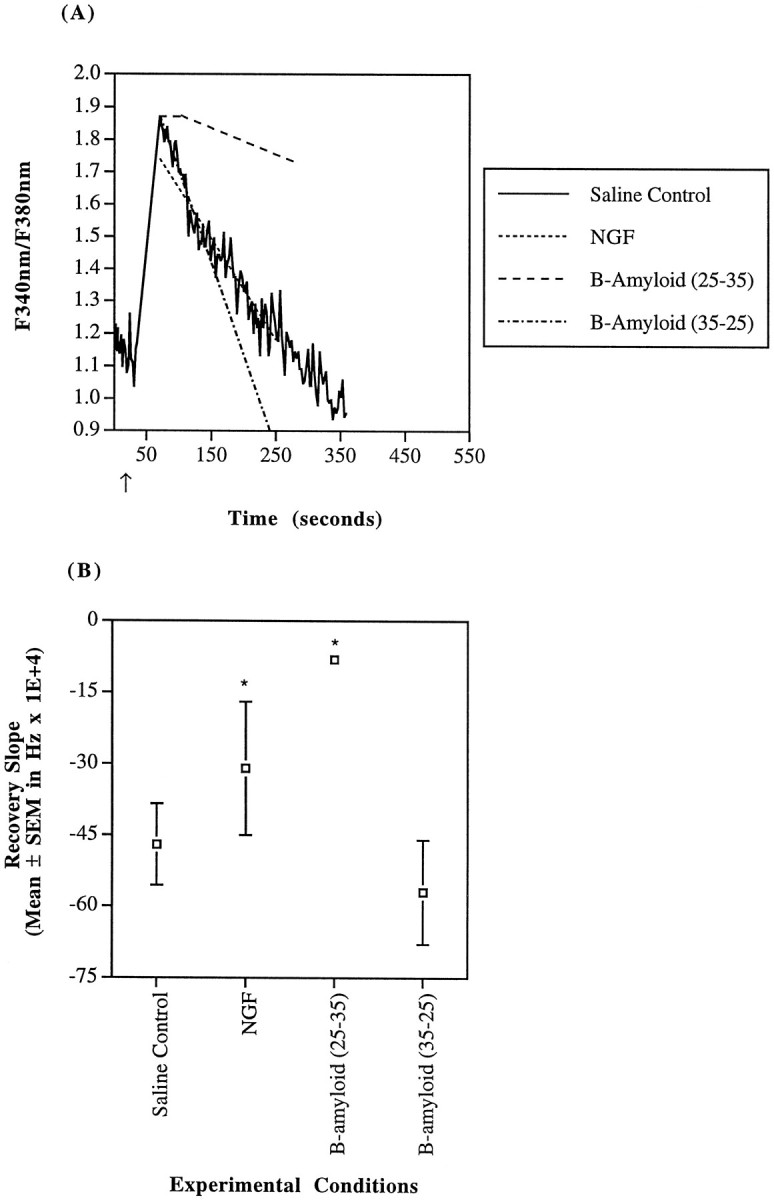
SH-SY5Y calcium recovery kinetics after a carbachol stimulus. A, SH-SY5Y cells were challenged with 100 μm carbachol (indicated by arrow) in a saline buffer (—). As noted, cells were uninhibited (actualsolid line trace), pretreated with NGF (10 ng/ml of 2.5S for 24 hr), or exposed to β-amyloid (25–35) or its control (35–25) peptide at 40 μm for 1 hr before stimulus. The trace was recorded during carbachol stimulation of a single region of interest incubated in saline buffer (i.e., 1–3 cells) and is representative of the whole. Both average recovery slope and calcium maximum for NGF-treated cells (- - -) were reduced. β-amyloid (25–35)-exposed cells (– – –) demonstrated delayed onset of recovery (note the initial plateau) and a decreased recovery slope. β-amyloid (35–25) incubation (– · – · –) had no significant effect compared with saline control. B, Mean recovery derivatives of the fura-2 fluorescence ratio (d(Fbound at 340nm/Funbound at 380nm)/dt) until attainment of a stable baseline are depicted. Recovery in the presence of either NGF or β-amyloid (25–35) was significantly slowed (*p < 0.05).
Fig. 7.

Control cybrid calcium recovery kinetics after a carbachol stimulus. A, Control cybrids were challenged with 100 μm carbachol (indicated by arrow) in a saline buffer, and as noted, some were also exposed to the following before stimulus: 10 ng/ml of 2.5S NGF for 24 hr (- - -), 40 μm β-amyloid (25–35) for 1 hr (– – –), or 40 μm β-amyloid (35–25) for 1 hr (– · – · –). The solid line trace (—) is a representative single region of interest (i.e., 1–3 cells) fura-2 ratio recording of control cybrids incubated in a saline buffer responding to a carbachol stimulus. Thelines are indicative of the mean recovery slopes for the control cybrids under particular pharmacological conditions. Again, note the decreased calcium peak with NGF treatment and the delayed initiation of recovery in β-amyloid (25–35)-treated control cybrids.B, Recovery derivatives of the fura-2 fluorescence ratio (d(Fbound at 340nm/Funbound at 380nm)/dt) until attainment of a stable baseline are detailed. Control cybrid recovery was reduced with both NGF and β-amyloid (25–35) treatment (*p < 0.05).
Fig. 8.
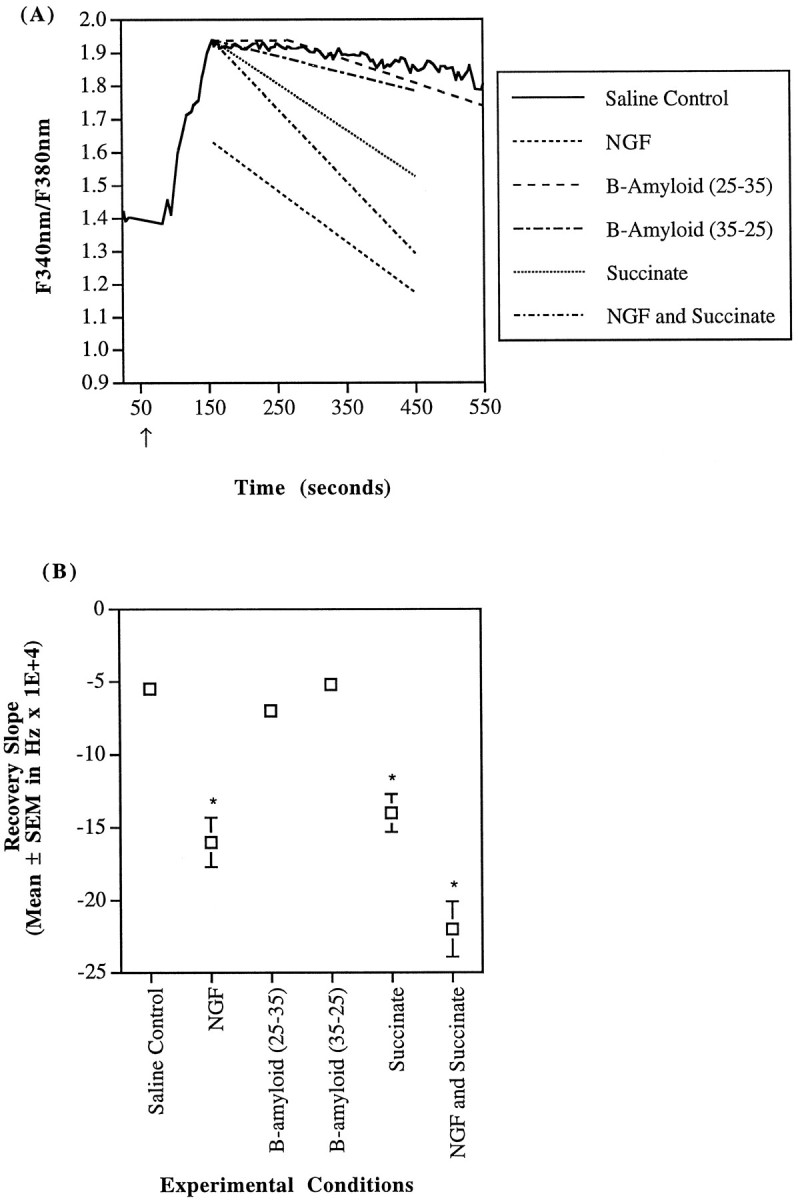
AD cybrid calcium recovery kinetics after a carbachol stimulus. A, AD cybrids with reduced complex IV activity were challenged with 100 μm carbachol in a saline buffer (—), and some were also exposed to other pharmacological agents such as 10 ng/ml of NGF (- - -), 40 μmβ-amyloid (25–35) (– – –), 40 μm β-amyloid (35–25) (– · – · –), 5 mm succinate (· · ·), or NGF and succinate (– · – · –). The trace represents fura fluorescence ratio measurements of a single region of interest (i.e., 1–3 cells) stimulated with carbachol. The other lines are indicative of the mean recovery slopes for the AD cybrids under particular pharmacological conditions. Again, NGF treatment alone significantly reduced the carbachol-induced calcium peak, and β-amyloid (25–35) exposure delayed the initiation of recovery (note the initial plateau recovery response). The carbachol-induced peak calcium concentration in the AD cybrids is slightly larger than in controls (p < 0.05); AD recovery kinetics are much slower than controls (Fig. 6A) (p < 0.05). B, Recovery derivatives of the fura-2 fluorescence ratio until attainment of a stable baseline are detailed. AD cybrid recovery was not significantly reduced by either β-amyloid (25–35) or β-amyloid (35–25). NGF alone was able to increase the recovery rate by 186%. Similarly, succinate increased the recovery kinetics by 165%. Succinate and NGF combined resulted in a 313% increase in the calcium recovery rate (*p < 0.05).
Although the initial cytosolic calcium maxima induced by carbachol were only slightly different, the rate of recovery of cytosolic calcium to a stable baseline was much slower in the AD cybrids as compared with the control cybrids or the SH-SY5Ys (both p values < 0.0001 by Fisher’s PLSD ANOVA). The derivatives of the fluorescence ratio (d(Fbound at 340nm/Funbound at 380nm)/dt) recoveries were the following: AD = −0.00055 ± 0.000046 sec−1 (n = 28); control = −0.0046 ± 0.00018 sec−1 (n = 55); and SH-SY5Y = −0.0047 ± 0.00086 sec−1 (n = 8). All slopes were of comparably good fit as indicated by similar Pearson correlation coefficients. These uninhibited, saline control recovery rates are depicted graphically in Figures 6, 7, 8. After carbachol exposure, the cytosolic calcium recovery occurred at a rate 88% slower in the AD cybrids than in either of the other two cell types.
Cytosolic calcium recovery kinetics after NGF treatment
NGF has been shown to stabilize intracellular calcium and may have a therapeutic effect in AD (Mattson et al., 1993b; Olson, 1993). To examine the effect of NGF on calcium handling in these cells, they were treated with 10 ng/ml of 2.5S nerve growth factor for 24 hr. Exposure to NGF decreased the overall carbachol-induced cytosolic calcium peak in all cell types. The carbachol-induced calcium maxima for NGF-treated cells were as follows: SH-SY5Y = 366 ± 34 nm(n = 4); AD cybrid = 309 ± 21 nm(n = 17); and control cybrid = 357 ± 14 nm (n = 14).
The reduction in peak calcium with NGF exposure was not the only change in cellular calcium handling. NGF-treated SH-SY5Y cells demonstrated a decrease in the fluorescence recovery slope to −0.0031 ± 0.0014 (n = 4) (p = 0.013 by Fisher’s PLSD ANOVA) (Fig. 6). Similarly, the recovery slope for NGF-treated control cybrids decreased to −0.0020 ± 0.00014 (n = 37) sec−1(p < 0.0001) (Fig. 7). AD cybrids treated with NGF, however, experienced an increase in the recovery slope to −0.0016 ± 0.00017 sec−1(n = 16) (p = 0.0016) (Fig.8). Taken together, the decrease in calcium maxima and the similarity of calcium recovery rates between control and AD cybrids indicate that NGF moderated cellular calcium handling mechanisms.
Cytosolic calcium recovery kinetics after β-amyloid exposure
β-amyloid has been linked to disturbances in calcium homeostasis, mitochondrial dysfunction and AD (Mattson et al., 1992;Gabuzda et al., 1994; Yanker, 1996). Therefore, the interaction of β-amyloid with calcium handling in AD mitochondrial cybrids with a known ETC dysfunction, control cybrids, and SH-SY5Y cells was examined. All cell lines were exposed to 40 μm β-amyloid (25–35) or its control β-amyloid (35–25) for 1 hr before carbachol challenge. This concentration of β-amyloid (25–35) has previously been shown to destabilize neuronal calcium homeostasis (Mattson et al., 1992). With either peptide, the overall carbachol-induced peak was the same as for saline control conditions. Exposure to the active β-amyloid (25–35) resulted in a delay in the initiation of calcium recovery in all cell types. The mean delays in initiation of calcium recovery were as follows: SH-SY5Y = 32 ± 19 sec (n = 6); AD cybrids = 108 ± 13 sec (n = 52); and control cybrids = 27 ± 8 sec (n = 40) (Figs. 6A, 7A,8A). The delay in initiation of calcium recovery observed in the AD cybrids is much greater than in either the SH-SY5Y cells or the control cybrids (p < 0.0001 by Fisher’s PLSD ANOVA).
As for the recovery slopes after initiation of calcium recovery, active β-amyloid (25–35) slowed the rate of recovery in both the SH-SY5Y cells and the control cybrids but had no statistically significant effect on the AD cybrids (Figs. 6B,7B, 8B). After the horizontal phase of the fluorescence response, which has a slope of zero, the recovery slope for the remainder of the response of the β-amyloid (25–35)-treated SH-SY5Y cells was reduced by 83% to −0.00081 ± 0.00018 sec−1 (n = 6). For β-amyloid (25–35)-treated control cybrids, the recovery slope was reduced by 76% to −0.0011 ± 0.000065 sec−(n = 40). In all of the cell lines, the control β-amyloid (35–25) did not affect either the initiation of recovery or the recovery rate after initiation (Figs. 6, 7, 8).
Effect of the complex II substrate succinate on the recovery rate
The relationship between reduced ETC activity and cellular handling of calcium was examined further by attempting to increase ETC activity. Excess succinate, a substrate for complex II, has been shown to support ETC activity (Kane et al., 1975; Melnick and Schiller, 1985;Hekman et al., 1988; Takehara et al., 1995). Therefore, the effect of 5 mm succinate on mitochondrial calcium buffering was examined in mitochondrial-defective AD cybrid lines.
Succinate treatment improved the rate of recovery in cytosolic calcium after a carbachol challenge. The recovery slope for the uninhibited AD cybrids in the presence of succinate was −0.0014 ± 0.00013 sec−1 (n = 37), whereas that of the ADs without succinate was only −0.00055 ± 0.000046 sec−1 (n = 28) (Fig. 8). Hence, the recovery rate in succinate-treated AD cybrids occurred 165% more quickly than in untreated AD cybrids (p = 0.0005; Fisher’s PLSD ANOVA). Succinate addition along with NGF further improved the rate of recovery of AD cybrids by 313% relative to saline-buffered ones (p < 0.0001;n = 28) (Fig. 8).
DISCUSSION
Decreased mitochondrial complex IV activity has definite functional consequences in terms of calcium handling and ROS production. Basal cytosolic calcium values in the SH-SY5Y cells and control cybrids were consistent with values reported previously (Naarala et al., 1993). Thus, the process of creating the cybrid lines by itself did not alter normal cytosolic calcium. The elevation in basal cytosolic calcium exhibited by the AD cybrids must result from mitochondrial dysfunction.
As for the increased ROS production in AD cybrids, cells with complex I dysfunction have demonstrated increased ROS production (Swerdlow et al., 1996). Elevated calcium, which was observed in the AD cybrids, has been shown to increase free radicals (Dykens, 1994). Inhibition of complex IV increases ROS production in SH-SY5Ys (Miller et al., 1996). Others have reported increased ROS production or damage in tissues from AD patients (Richardson, 1993; Zhou et al., 1995; Richardson et al., 1996; Smith et al., 1996). Mitochondrial function, calcium homeostasis, and ROS production seem intimately associated, and an imbalance of one of these may have grave consequences (Beal, 1992).
Resting mitochondrial calcium reportedly is ∼200 nm, and perturbations have been shown to raise this concentration (Rizzuto et al., 1992). Previous research has demonstrated mitochondrial site specificity for CCCP (Thayer and Miller, 1990; Friel and Tsien, 1994;Buttgereit and Brand, 1995; Park et al., 1996). Because the intramitochondrial calcium concentration is usually larger than that in the cytosol, CCCP application causes a transient increase in cytosolic calcium and a decrease in mitochondrial calcium (Biscoe et al., 1989;Simpson and Russell, 1996). We observed an increase in cytosolic calcium with CCCP exposure to all of our cell lines.
Mitochondria contributed to the buffering of an ∼400 nmCa2+ transient induced by carbachol in SH-SY5Ys and cybrid lines. InsP3 agonists increase cytosolic calcium through release of intracellular stores and influx (Drummond and Fay, 1996; Simpson et al., 1996; Babcock et al., 1997). Mitochondria play a major role in regulation and return to homeostasis after such a perturbation (Rizzuto et al., 1994; Jouaville et al., 1995; Simpson and Russell, 1996). In fact, mitochondrial calcium rapidly and transiently increases after agonist-induced InsP3 generation (Rizzuto et al., 1994). The carbachol-induced peak calcium transient is comparable to the 450–550 nm Ca2+ range at which mitochondria are believed to play a buffering role in dorsal root ganglion neurons or chromaffin cells (Werth and Thayer, 1994;Herrington et al., 1996). Mitochondria can rapidly and significantly accumulate calcium from intra- or extracellular sources; they limit the exposure of a cell to high cytosolic calcium levels (Duchen et al., 1990; White and Reynolds, 1995).
The source and amount of the calcium, proximity of the perturbation relative to the mitochondria, the mediator of calcium release, the temporal behavior of the calcium change, and the overall bioenergetic state of a cell seem to influence the extent of mitochondrial buffering (Ghosh and Greenberg, 1995; White and Reynolds, 1995; Drummond and Fay, 1996). For instance, rapid uptake and modulation of InsP3-mediated calcium by mitochondria depends on the proximity of the mitochondria to the releasing channels (Camacho and Lechleiter, 1993; Rizzuto et al., 1993; Jouaville et al., 1995). InsP3-mediated calcium release is buffered more effectively by mitochondria than increases caused by other stimuli (Donnadieu and Bouruignon, 1996; Simpson and Russell, 1996; Sheehan et al., 1997). Mitochondria in the SH-SY5Y cells and the cybrids derived from them contributed to the basal homeostasis and buffering of InsP3-mediated perturbations.
AD cybrids seldom attained a timely recovery to prestimulus cytosolic calcium levels. This delayed recovery could increase cytosolic, mitochondrial, and nuclear calcium, alter cellular excitability and signaling, and ultimately lead to apoptosis (Nicotera and Orrenius, 1992; Brini et al., 1993, 1994; Richter, 1993; Dykens, 1994; Ghosh and Greenberg, 1995; Oshimi and Miyazaki, 1995; Khan et al., 1996; Simpson and Russell, 1996; Tong et al., 1996).
Fibroblasts from AD patients have decreased calcium uptake and increased calcium content (Peterson et al., 1985; Peterson and Goldman, 1986). AD fibroblasts have an increased cytosolic calcium response to InsP3 formation agonists (Peterson et al., 1986, 1988;Huang et al., 1991; McCoy et al., 1993; Etcheberrigaray et al., 1994;Ito et al., 1994). These reports are consistent with enhancement of InsP3-mediated calcium release in AD cybrids. Kumar et al. (1994) demonstrated decreased calcium uptake in mitochondria from AD fibroblasts. That report is consistent with our observation that AD cybrid mitochondria carry a smaller load of sequestered calcium, as demonstrated by the CCCP experiments. The enhanced calcium release mediated by InsP3 along with the elevated basal cytosolic calcium and decreased mitochondrial calcium sequestration suggest that other cellular components (e.g., endoplasmic reticulum) are playing a larger role in calcium handling in the AD cybrids.
SH-SY5Y cells and control cybrids exposed to β-amyloid (25–35) exhibited decreased recovery rates comparable to those of uninhibited AD cybrids. APP has already been shown to decrease complex IV activity and cause other mitochondrial abnormalities (Askanas et al., 1996). The fact that β-amyloid (25–35) exposure did not produce an additive effect in the AD cybrids suggests that maximal complex IV-induced delay in calcium recovery may be attained with the 52% decrease. Moreover, the amyloid metabolism of these complex IV inhibited cells may already be altered in a manner adverse to calcium handling (Gabuzda et al., 1994) (R. E. Davis, unpublished data).
NGF partially rectified the calcium handling problems demonstrated by the AD cybrids. NGF protects neurons against hypoxic, hypoglycemic, and excitotoxic damage in vitro and ischemia in vivo(Cheng and Mattson, 1991; Shigeno et al., 1991; Mattson and Cheng, 1993; Mattson et al., 1993a,c). SH-SY5Y cells possess functional trkA receptors; NGF can differentiate SH-SY5Y cells (Baker et al., 1989;Poluha et al., 1995). NGF may stabilize calcium homeostasis by altering calcium binding proteins, modifying receptor function, restoring mitochondrial transmembrane potential, inducing Bcl-2, and preventing release of cytochrome c from mitochondria, or a host of other mechanisms (Thoenen and Barde, 1980; Mattson et al., 1993c; Kluck et al., 1997; Yang et al., 1997).
The delayed calcium recovery inherent in the AD cybrids was partially rectified by succinate addition. The recovery observed with succinate could result from a partial restoration of mitochondrial membrane potential or increased ATP production. The effect of succinate provides compelling evidence of a link between mitochondrial buffering and function. This is surprising given the comparable basal bioenergetics of the cybrids; however, similar basal bioenergetic states do not preclude the possibility that AD cybrids might fail to keep up under conditions of high energy demand. Treatment with NGF and succinate produced a further improvement in calcium recovery kinetics, indicating that they are not working solely via identical mechanisms. This study is the first to demonstrate mitochondrial-based functional consequences associated with AD in the context of a neuronal-like cell and the transferability of these consequences with the mitochondrial cybrid model.
These studies add weight to the connection between mitochondrial dysfunction and AD (Arispe et al., 1994; Cotman et al., 1994; Huang et al., 1994; Mattson, 1994). Sustained changes in cytosolic calcium and ROS production related to mitochondrial impairment could serve as a final common pathway for the neuropathological changes observed in AD (Gotz et al., 1994; Khachaturian, 1994; Beal, 1996). Excess calcium can damage cellular proteins and membranes through protease activation, endonuclease induction, and ROS production. It can also diminish early gene expression and inactivate irreversibly key enzymes (Lai et al., 1988; Siman and Noszek, 1988; Carroll et al., 1992; Lipton et al., 1993; Verity, 1993; Khodarev and Ashwell, 1996). ROS could damage mtDNA, which is prone to mutation (Beal, 1995).
Mitochondrial dysfunction has also been reported to alter amyloid metabolism. Azide-induced COX inhibition has been shown to change the processing of the APP and induce production of an amyloidogenic derivative of APP (Gabuzda et al., 1994). Hence, mitochondrial dysfunction could contribute to the amyloidosis observed in AD. Amyloidosis could further destabilize calcium homeostasis and facilitate excitotoxicity (Mattson et al., 1992; Yanker, 1996). Moreover, ultrastructural damage to the Golgi apparatus and mitochondria is observed with exposure to β-amyloid (Behl et al., 1994a,b). Expression of a presenilin-1 mutation linked to an autosomal dominant form of AD exaggerates calcium responses to carbachol and enhances apoptotic vulnerability to β-amyloid (Guo et al., 1996). Thus, familial forms of AD associated with presenilin-1 or β-amyloid mutations and sporadic forms of AD with mitochondrial dysfunction and mtDNA defects seem to exhibit similar calcium homeostasis disturbances that may lead to a common AD neuropathology.
Whether mtDNA defects in genes encoding for complex IV are a proximal or distal event in late-onset AD is unclear at present (Davis et al., 1997). Nevertheless, mitochondrial dysfunction and its functional consequences probably contribute to the pathogenesis of sporadic AD, which likely results from numerous causes (St. George-Hyslop et al., 1990). Neuronal survival may depend on a delicate balance between nuclear and mitochondrial genome stability, mitochondrial function, calcium homeostasis, ROS production, amyloid metabolism, and cell signaling (Mattson, 1995; Beal, 1996; Yanker, 1996).
Footnotes
We thank Dr. Scott R. Vandenberg, Director of Neuropathology, and Dr. George E. Vandenhoff, Diabetes Core Laboratory, University of Virginia. The ρ0 cells were a gift of MitoKor Corporation (San Diego). Special thanks also to Drs. John A. Jane and Gregory A. Helm of the University of Virginia Department of Neurosurgery for advice, guidance, encouragement, and support.
Correspondence should be addressed to Dr. J. B. Tuttle, Box 230, Health Sciences Center, University of Virginia, Charlottesville, VA 22908.
REFERENCES
- 1.Ankarcrona M, Dypbukt JM, Bonfoco E, Zhivotovsky B, Orrenius S, Lipton SA, Nicotera P. Glutamate-induced neuronal death: a succession of necrosis or apoptosis depending on mitochondrial function. Neuron. 1995;15:961–973. doi: 10.1016/0896-6273(95)90186-8. [DOI] [PubMed] [Google Scholar]
- 2.Arispe N, Pollard HB, Rojas E. The ability of amyloid β-protein [AβP (1–40)] to form Ca2+ channels provides a mechanism for neuronal death in Alzheimer’s disease. Ann NY Acad Sci. 1994;747:256–265. doi: 10.1111/j.1749-6632.1994.tb44414.x. [DOI] [PubMed] [Google Scholar]
- 3.Askanas V, McFerrin J, Baque S, Alvarez RB, Sarkozi E, Engel WK. Transfer of beta-amyloid precursor protein gene using adenovirus vector causes mitochondrial abnormalities in cultured normal human muscle. Proc Natl Acad Sci USA. 1996;93:1314–1319. doi: 10.1073/pnas.93.3.1314. [DOI] [PMC free article] [PubMed] [Google Scholar]
- 4.Babcock DF, Herrington J, Goodwin PC, Park YB, Hille B. Mitochondrial participation in the intracellular Ca2+ network. J Cell Biol. 1997;136:833–844. doi: 10.1083/jcb.136.4.833. [DOI] [PMC free article] [PubMed] [Google Scholar]
- 5.Baker DL, Reddy UR, Pleasure D, Thorpe CL, Evens AE, Cohen PS, Ross AH. Analysis of nerve growth factor receptor expression in human neuroblastoma and neuroepithelioma cell lines. Cancer Res. 1989;49:4142–4146. [PubMed] [Google Scholar]
- 6.Beal MF. Does impairment of energy metabolism result in excitotoxic neuronal death in neurodegenerative disease? Ann Neurol. 1992;31:119–130. doi: 10.1002/ana.410310202. [DOI] [PubMed] [Google Scholar]
- 7.Beal MF. Aging, energy, and oxidative stress in neurodegenerative diseases. Ann Neurol. 1995;18:357–366. doi: 10.1002/ana.410380304. [DOI] [PubMed] [Google Scholar]
- 8.Beal MF. Mitochondria, free radicals, and neurodegeneration. Curr Opin Neurobiol. 1996;6:661–666. doi: 10.1016/s0959-4388(96)80100-0. [DOI] [PubMed] [Google Scholar]
- 9.Behl C, Davis JB, Klier FG, Schubert D. Amyloid β protein induces necrosis rather than apoptosis. Brain Res. 1994a;645:253–264. doi: 10.1016/0006-8993(94)91659-4. [DOI] [PubMed] [Google Scholar]
- 10.Behl C, Davis JB, Lesley R, Schubert D. Hydrogen peroxide mediates amyloid β protein toxicity. Cell. 1994b;77:817–827. doi: 10.1016/0092-8674(94)90131-7. [DOI] [PubMed] [Google Scholar]
- 11.Bennett MC, Diamond DM, Stryker SL, Parks JK, Parker WD. Cytochrome oxidase inhibition: a novel animal model of Alzheimer’s disease. J Geriatr Psychiatry Neurol. 1992;5:93–101. doi: 10.1177/002383099200500206. [DOI] [PubMed] [Google Scholar]
- 12.Bennett MC, Mlady GW, Fleshner M, Rose GM. Synergy between chronic corticosterone and sodium azide treatments in producing a spatial learning deficit and inhibiting cytochrome oxidase activity. Proc Natl Acad Sci USA. 1996;93:1330–1334. doi: 10.1073/pnas.93.3.1330. [DOI] [PMC free article] [PubMed] [Google Scholar]
- 13.Biscoe TJ, Duchen MR, Eisner DA, O’Neill SC, Valdeolmillos M. Measurement of intracellular Ca2+ in dissociated type I cells of rabbit carotid body. J Physiol (Lond) 1989;416:421–434. doi: 10.1113/jphysiol.1989.sp017769. [DOI] [PMC free article] [PubMed] [Google Scholar]
- 14.Brini M, Murgia M, Pasti L, Picard D, Pozzan T, Rizzuto R. Nuclear Ca2+ concentration measured with specifically targeted recombinant aequorin. EMBO J. 1993;12:4813–4819. doi: 10.1002/j.1460-2075.1993.tb06170.x. [DOI] [PMC free article] [PubMed] [Google Scholar]
- 15.Brini M, Marsault R, Bastianutto C, Pozzan T, Rizzuto R. Nuclear targeting of aequorin. Cell Calcium. 1994;16:259–268. doi: 10.1016/0143-4160(94)90089-2. [DOI] [PubMed] [Google Scholar]
- 16.Busciglio J, Yankner BA. Apoptosis and increased generation of reactive oxygen species in Down’s syndrome neurons in vitro. Nature. 1995;378:776–779. doi: 10.1038/378776a0. [DOI] [PubMed] [Google Scholar]
- 17.Buttgereit F, Brand MD. A hierarchy of ATP-consuming processes in mammalian cells. Biochem J. 1995;312:163–167. doi: 10.1042/bj3120163. [DOI] [PMC free article] [PubMed] [Google Scholar]
- 18.Camacho P, Lechleiter JD. Increased frequency of calcium waves in Xenopus laevis oocytes that express a calcium-ATPase. Science. 1993;260:226–229. doi: 10.1126/science.8385800. [DOI] [PubMed] [Google Scholar]
- 19.Carroll JM, Toral-Barza L, Gibson G. Cytosolic free calcium and gene expression during chemical hypoxia. J Neurochem. 1992;59:1836–1843. doi: 10.1111/j.1471-4159.1992.tb11017.x. [DOI] [PubMed] [Google Scholar]
- 20.Chandrasekaran K, Stoll J, Giordano T, Atack JR, Matocha MF, Brady DR, Rapoport SI. Differential expression of cytochrome oxidase (COX) genes in different regions of monkey brain. J Neurosci Res. 1992;32:415–423. doi: 10.1002/jnr.490320313. [DOI] [PubMed] [Google Scholar]
- 21.Cheng B, Mattson MP. NGF and bFGF protect rat hippocampal and human cortical neurons against hypoglycemic damage by stabilizing calcium homeostasis. Neuron. 1991;7:1031–1041. doi: 10.1016/0896-6273(91)90347-3. [DOI] [PubMed] [Google Scholar]
- 22.Cotman CW, Whittemore ER, Watt JA, Anderson AJ, Loo DT. Possible role of apoptosis in Alzheimer’s disease. Ann NY Acad Sci. 1994;747:36–49. doi: 10.1111/j.1749-6632.1994.tb44400.x. [DOI] [PubMed] [Google Scholar]
- 23.Davis RE, Miller S, Herrnstadt C, Ghosh S, Fahy E, Galasko D, Thal LJ, Parker WD. Specific point mutations in mitochondrial cytochrome oxidase genes are associated with sporadic Alzheimer’s disease. Neurology. 1996;46:A276. [Google Scholar]
- 24.Davis RE, Miller S, Herrnstadt C, Ghosh SS, Fahy E, Shinobu L, Galasko D, Thal LJ, Beal MF, Howell N, Parker WD. Mutations in mitochondrial cytochrome c oxidase genes segregate with late-onset Alzheimer’s disease. Proc Natl Acad Sci USA. 1997;94:4564–4569. doi: 10.1073/pnas.94.9.4526. [DOI] [PMC free article] [PubMed] [Google Scholar] [Retracted]
- 25.Donnadieu E, Bouruignon LYW. Ca2+ signaling in endothelial cells stimulated by bradykinin–Ca2+ measurement in the mitochondria and the cytosol by confocal microscopy. Cell Calcium. 1996;20:53–61. doi: 10.1016/s0143-4160(96)90050-0. [DOI] [PubMed] [Google Scholar]
- 26.Drummond RM, Fay FS. Mitochondria contribute to Ca2+ removal in smooth muscle cells. Pflügers Arch. 1996;431:473–482. doi: 10.1007/BF02191893. [DOI] [PubMed] [Google Scholar]
- 27.Duchen MR, Valdeolmillos M, O’Neill SC, Eisner DA. Effects of metabolic blockade on the regulation of intracellular calcium in dissociated mouse sensory neurons. J Physiol (Lond) 1990;424:411–426. doi: 10.1113/jphysiol.1990.sp018074. [DOI] [PMC free article] [PubMed] [Google Scholar]
- 28.Dykens JA. Isolated cerebral and cerebellar mitochondria produce free radicals when exposed to elevated Ca2+ and Na+: implications for neurodegeneration. J Neurochem. 1994;63:584–591. doi: 10.1046/j.1471-4159.1994.63020584.x. [DOI] [PubMed] [Google Scholar]
- 29.Etcheberrigaray R, Gibson GE, Alkon DL. Molecular mechanisms of memory and the pathophysiology of Alzheimer’s disease. Ann NY Acad Sci. 1994;747:244–255. doi: 10.1111/j.1749-6632.1994.tb44413.x. [DOI] [PubMed] [Google Scholar]
- 30.Friel DD, Tsien RW. An FCCP-sensitive Ca2+ store in bullfrog sympathetic neurons and its participation in stimulus-evoked changes in [Ca2+]. J Neurosci. 1994;14:4007–4024. doi: 10.1523/JNEUROSCI.14-07-04007.1994. [DOI] [PMC free article] [PubMed] [Google Scholar]
- 31.Gabuzda D, Busciglio J, Chen LB, Matsudaira P, Yanker BA. Inhibition of energy metabolism alters the processing of amyloid precursor protein and induces a potentially amyloidogenic derivative. J Biol Chem. 1994;269:13623–13628. [PubMed] [Google Scholar]
- 32.Ghosh A, Greenberg ME. Calcium signaling in neurons: molecular mechanisms and cellular consequences. Science. 1995;268:239–247. doi: 10.1126/science.7716515. [DOI] [PubMed] [Google Scholar]
- 33.Glasco S, Miller SW, Thal LJ, Davis RE. Alzheimer’s disease cybrids manifest a cytochrome oxidase defect. Soc Neurosci Abstr. 1995;21:387.6. [Google Scholar]
- 34.Goto Y, Nonaka I, Horai S. A mutation in the tRNA (Leu) (UUR) gene associated with the MELAS subgroup of mitochondrial encephalomyopathies. Nature. 1990;348:651–653. doi: 10.1038/348651a0. [DOI] [PubMed] [Google Scholar]
- 35.Gotz ME, Kunig G, Riederer P, Youdim MBH. Oxidative stress: free radical production in neural degeneration. Pharmacol Ther. 1994;63:37–122. doi: 10.1016/0163-7258(94)90055-8. [DOI] [PubMed] [Google Scholar]
- 36.Greenburg MS. Handbook of neurosurgery, 3rd Ed. Greenberg Graphics; Lakeland, FL: 1994. [Google Scholar]
- 37.Grynkiewicz G, Poenie M, Tsien RY. A new generation of Ca2+ indicators with greatly improved fluorescence properties. J Biol Chem. 1985;260:3440–3450. [PubMed] [Google Scholar]
- 38.Guo Q, Furukawa K, Sopher BL, Pham DG, Xie J, Robinson N, Martin GM, Mattson MP. Alzheimer’s PS-1 mutation perturbs calcium homeostasis and sensitizes PC12 cells to death induced by amyloid β-peptide. NeuroReport. 1996;8:379–383. doi: 10.1097/00001756-199612200-00074. [DOI] [PubMed] [Google Scholar]
- 39.Hekman C, Matsuno-Yagi A, Hatefi Y. Energy-induced modulation of the kinetics of oxidative phosphorylation and reverse electron transfer. Biochemistry. 1988;27:7559–7565. doi: 10.1021/bi00419a057. [DOI] [PubMed] [Google Scholar]
- 40.Herrington J, Park YB, Babcock DF, Hille B. Dominant role of mitochondria in clearance of large Ca2+ loads from rat adrenal chromaffin cells. Neuron. 1996;16:219–228. doi: 10.1016/s0896-6273(00)80038-0. [DOI] [PubMed] [Google Scholar]
- 41.Howell N, Kubacka I, Xu M, McCullough DA. Leber hereditary optic neuropathy: involvement of the mitochondrial ND1 gene and evidence for an intragenic suppressor mutation. Am J Hum Genet. 1991;48:935–942. [PMC free article] [PubMed] [Google Scholar]
- 42.Huang HM, Toral-Barza L, Thaler H, Tofel-Grehl B, Gibson GE. Inositol phosphates and intracellular calcium after bradykinin stimulation in fibroblasts from young, normal aged, and Alzheimer donors. Neurobiol Aging. 1991;12:469–473. doi: 10.1016/0197-4580(91)90075-u. [DOI] [PubMed] [Google Scholar]
- 43.Huang HM, Martins R, Gandy S, Etcheberrigaray R, Ito E, Alkon DL, Blass J, Gibson G. Use of cultured fibroblasts in elucidating the pathophysiology and diagnosis of Alzheimer’s disease. Ann NY Acad Sci. 1994;747:225–244. doi: 10.1111/j.1749-6632.1994.tb44412.x. [DOI] [PubMed] [Google Scholar]
- 44.Ito E, Kotaro O, Etcheberrigaray R, Nelson TJ, McPhie DL, Tofel-Grehl B, Gibson GE, Alkon DL. Internal Ca2+ mobilization is altered in fibroblasts from patients with Alzheimer disease. Proc Natl Acad Sci USA. 1994;91:534–538. doi: 10.1073/pnas.91.2.534. [DOI] [PMC free article] [PubMed] [Google Scholar]
- 45.Jouaville LS, Ichas F, Holmuhamedov EL, Camacho P, Lechleiter JD. Synchronization of calcium waves by mitochondrial substrates in Xenopus laevis oocytes. Nature. 1995;377:438–441. doi: 10.1038/377438a0. [DOI] [PubMed] [Google Scholar]
- 46.Johns DR. The other human genome: mitochondrial DNA and disease. Nat Med. 1996;2:1065–1068. doi: 10.1038/nm1096-1065. [DOI] [PubMed] [Google Scholar]
- 47.Kane JJ, Murphy ML, Bissett JK, deSoyza N, Doherty JE, Straub KD. Mitochondrial function, oxygen extraction, epicardial S-T segment changes, and tritiated digoxin distribution after reperfusion of ischemic myocardium. Am J Cardiol. 1975;36:218–224. doi: 10.1016/0002-9149(75)90530-5. [DOI] [PubMed] [Google Scholar]
- 48.Khachaturian ZS. Calcium hypothesis of Alzheimer’s disease and brain aging. Ann NY Acad Sci. 1994;747:1–11. doi: 10.1111/j.1749-6632.1994.tb44398.x. [DOI] [PubMed] [Google Scholar]
- 49.Khan AA, Soloski MJ, Sharp AH, Schilling G, Sabatini DM, Li S-H, Ross CA, Snyder SH. Lymphocyte apoptosis: mediation by increased type 3 inositol 1,4,5-trisphosphate receptor. Science. 1996;273:503–507. doi: 10.1126/science.273.5274.503. [DOI] [PubMed] [Google Scholar]
- 50.Khodarev NN, Ashwell JD. An inducible lymphocyte nuclear Ca2+/Mg2+-dependent endonuclease associated with apoptosis. J Immunol. 1996;156:922–931. [PubMed] [Google Scholar]
- 51.King MP, Attardi G. Human cells lacking mtDNA: repopulation with exogenous mitochondria by complementation. Science. 1989;246:500–503. doi: 10.1126/science.2814477. [DOI] [PubMed] [Google Scholar]
- 52.Kish SJ, Bergeron C, Rajput A, Dozic S, Mastrogiacomo F, Chang LJ, Wilson JM, DiStefano LM, Nobrega JN. Brain cytochrome oxidase in Alzheimer’s disease. J Neurochem. 1992;59:776–779. doi: 10.1111/j.1471-4159.1992.tb09439.x. [DOI] [PubMed] [Google Scholar]
- 53.Kluck RM, Bossy-Wetzel E, Green DR, Newmeyer DD. The release of cytochrome c from mitochondria: a primary site for Bcl-2 regulation of apoptosis. Science. 1997;275:1132–1136. doi: 10.1126/science.275.5303.1132. [DOI] [PubMed] [Google Scholar]
- 54.Kumar U, Dunlop D, Richardson JS. Mitochondria from Alzheimer’s fibroblasts show decreased uptake of calcium and increased sensitivity to free radicals. Life Sci. 1994;54:1855–1860. doi: 10.1016/0024-3205(94)90142-2. [DOI] [PubMed] [Google Scholar]
- 55.Lai JCK, DiLorenzo JC, Sheu KFR. Pyruvate dehydrogenase complex is inhibited in calcium-loaded cerebrocortical mitochondria. Neurochem Res. 1988;13:1043–1048. doi: 10.1007/BF00973148. [DOI] [PubMed] [Google Scholar]
- 56.Lipton SA, Choi YB, Pan ZH, Lei SZ, Chen HS, Sucher NJ, Loscalzo J, Singel DJ, Stamler JS. A redox-base mechanism for the neuroprotective and neurodestructive effects of nitric oxide and related nitroso-compounds. Nature. 1993;364:626–632. doi: 10.1038/364626a0. [DOI] [PubMed] [Google Scholar]
- 57.Mattson MP. Calcium and neuronal injury in Alzheimer’s disease. Ann NY Acad Sci. 1994;747:51–76. [PubMed] [Google Scholar]
- 58.Mattson MP. Degenerative and protective signaling mechanisms in the neurofibrillary pathology of AD. Neurobiol Aging. 1995;16:447–463. doi: 10.1016/0197-4580(94)00182-z. [DOI] [PubMed] [Google Scholar]
- 59.Mattson MP, Cheng B. Growth factors protect neurons against excitotoxic/ischemic damage by stabilizing calcium homeostasis. Stroke. 1993;24:I136–I140. [PubMed] [Google Scholar]
- 60.Mattson MP, Cheng B, Davis D, Bryant K, Lieberburg I, Rydel RE. β-Amyloid peptides destabilize calcium homeostasis and render human cortical neurons vulnerable to excitotoxicity. J Neurosci. 1992;12:376–389. doi: 10.1523/JNEUROSCI.12-02-00376.1992. [DOI] [PMC free article] [PubMed] [Google Scholar]
- 61.Mattson MP, Cheng B, Smith-Swintosky VL. Neurotrophic factor-mediated protection from excitotoxicity and disturbances in calcium and free radical metabolism. Semin Neurosci. 1993a;5:295–307. [Google Scholar]
- 62.Mattson MP, Rydel RE, Lieberburg I, Smith-Swintosky VL. Altered calcium signaling and neuronal injury: stroke and Alzheimer’s disease as examples. Ann NY Acad Sci. 1993b;679:1–21. doi: 10.1111/j.1749-6632.1993.tb18285.x. [DOI] [PubMed] [Google Scholar]
- 63.Mattson MP, Zhang Y, Bose S. Growth factors prevent mitochondrial dysfunction, loss of calcium homeostasis, and cell injury, but not ATP depletion in hippocampal neurons deprived of glucose. Exp Neurol. 1993c;121:1–13. doi: 10.1006/exnr.1993.1066. [DOI] [PubMed] [Google Scholar]
- 64.McCoy KR, Mullins RD, Newcomb TG, Ng GM, Pavlinkova G, Polinsky RJ, Nee LE, Sisken JE. Serum- and bradykinin-induced calcium transients in familial Alzheimer’s fibroblasts. Neurobiol Aging. 1993;14:447–455. doi: 10.1016/0197-4580(93)90103-i. [DOI] [PubMed] [Google Scholar]
- 65.McKhann G, Drachman D, Folstein M, Katzman R, Price D, Stadlan EM. Clinical diagnosis of Alzheimer’s disease: report of the NINCDS–ADRDA Work Group under the auspices of Department of Health and Human Services Task Force on Alzheimer’s disease. Neurology. 1984;34:939–944. doi: 10.1212/wnl.34.7.939. [DOI] [PubMed] [Google Scholar]
- 66.Meghji P, Tuttle JB, Rubio R. Adenosine formation and release by embryonic chick neurons and glia in cell culture. J Neurochem. 1989;53:1852–1860. doi: 10.1111/j.1471-4159.1989.tb09252.x. [DOI] [PubMed] [Google Scholar]
- 67.Melnick RL, Schiller CM. Effect of phthalate esters on energy coupling and succinate oxidation in rat liver mitochondria. Toxicology. 1985;34:13–27. doi: 10.1016/0300-483x(85)90075-7. [DOI] [PubMed] [Google Scholar]
- 68.Miller SW, Davis RE, Trimmer PA, Parker WD. Creation and characterization of mitochondrial DNA depleted cell lines with “neuronal-like” properties. J Neurochem. 1996;67:1897–1907. doi: 10.1046/j.1471-4159.1996.67051897.x. [DOI] [PubMed] [Google Scholar]
- 69.Moravec R. Total cell quantitation using the cytotox 96 non-radioactive cytotoxicity assay. Promega Notes. 1994;45:11–12. [Google Scholar]
- 70.Mutisya EM, Bowling AC, Beal MF. Cortical cytochrome oxidase activity is reduced in Alzheimer’s disease. J Neurochem. 1994;63:2179–2184. doi: 10.1046/j.1471-4159.1994.63062179.x. [DOI] [PubMed] [Google Scholar]
- 71.Naarala J, Nykvist P, Tuomala M, Savolainen K. Excitatory amino acid-induced slow biphasic responses of free intracellular calcium in human neuroblastoma cells. FEBS Lett. 1993;330:222–226. doi: 10.1016/0014-5793(93)80278-3. [DOI] [PubMed] [Google Scholar]
- 72.Nicotera P, Orrenius S. Ca2+ and cell death. Ann NY Acad Sci. 1992;648:17–27. doi: 10.1111/j.1749-6632.1992.tb24520.x. [DOI] [PubMed] [Google Scholar]
- 73.Olson L. NGF and the treatment of Alzheimer’s disease. Exp Neurol. 1993;124:5–15. doi: 10.1006/exnr.1993.1167. [DOI] [PubMed] [Google Scholar]
- 74.Ortiz RG, Newman NJ, Shoffner JM, Kaufman AE, Koontz DA, Wallace DC. Variable retinal and neurologic manifestations in patients harboring the mitochondrial DNA 8993 mutation. Arch Ophthalmol. 1993;111:1525–1530. doi: 10.1001/archopht.1993.01090110091031. [DOI] [PubMed] [Google Scholar]
- 75.Oshimi Y, Miyazaki S. Fas antigen-mediated DNA fragmentation and apoptotic morphologic changes are regulated by elevated cytosolic Ca2+ level. J Immunol. 1995;154:599–609. [PubMed] [Google Scholar]
- 76.Park YB, Herrington J, Babcock DF, Hille B. Ca2+ clearance mechanisms in isolated rat adrenal chromaffin cells. J Physiol (Lond) 1996;492:329–346. doi: 10.1113/jphysiol.1996.sp021312. [DOI] [PMC free article] [PubMed] [Google Scholar]
- 77.Parker WD. Cytochrome oxidase deficiency in Alzheimer’s disease. Ann NY Acad Sci. 1991;640:59–64. doi: 10.1111/j.1749-6632.1991.tb00191.x. [DOI] [PubMed] [Google Scholar]
- 78.Parker WD, Boyson SJ, Luder AS, Parks JK. Evidence for a defect in NADH:ubiquinone oxidoreductase (complex I) in Huntington’s disease. Neurology. 1990a;40:1231–1233. doi: 10.1212/wnl.40.8.1231. [DOI] [PubMed] [Google Scholar]
- 79.Parker WD, Filley CM, Parks JK. Cytochrome oxidase deficiency in Alzheimer’s disease. Neurology. 1990b;40:1302–1303. doi: 10.1212/wnl.40.8.1302. [DOI] [PubMed] [Google Scholar]
- 80.Parker WD, Mahr NJ, Filley CM, Parks JK, Hughes D, Young DA, Cullum CM. Reduced platelet cytochrome c oxidase activity in Alzheimer’s disease. Neurology. 1994a;44:1086–1090. doi: 10.1212/wnl.44.6.1086. [DOI] [PubMed] [Google Scholar]
- 81.Parker WD, Parks J, Filley CM, Kleinschmidt-DeMasters BK. Electron transport chain defects in Alzheimer’s disease brain. Neurology. 1994b;44:1090–1096. doi: 10.1212/wnl.44.6.1090. [DOI] [PubMed] [Google Scholar]
- 82.Peterson C, Goldman JE. Alterations in calcium content and biochemical processes in cultured skin fibroblasts from aged and Alzheimer donors. Proc Natl Acad Sci USA. 1986;83:2758–2762. doi: 10.1073/pnas.83.8.2758. [DOI] [PMC free article] [PubMed] [Google Scholar]
- 83.Peterson C, Gibson GE, Blass JP. Altered calcium uptake in cultured skin fibroblasts from patients with Alzheimer’s disease. N Engl J Med. 1985;312:1063–1064. doi: 10.1056/NEJM198504183121618. [DOI] [PubMed] [Google Scholar]
- 84.Peterson C, Ratan RR, Shelanski ML, Goldman JE. Cytosolic free calcium and cell spreading decrease in fibroblasts from aged and Alzheimer donors. Proc Natl Acad Sci USA. 1986;83:7999–8001. doi: 10.1073/pnas.83.20.7999. [DOI] [PMC free article] [PubMed] [Google Scholar]
- 85.Peterson C, Ratan RR, Shelanski M, Goldman JE. Altered response of fibroblasts from aged and Alzheimer donors to drugs that elevate free calcium. Neurobiol Aging. 1988;9:261–266. doi: 10.1016/s0197-4580(88)80063-0. [DOI] [PubMed] [Google Scholar]
- 86.Poluha W, Poluha DK, Ross AH. TrkA neurogenic receptor regulates differentiation of neuroblastoma cells. Oncogene. 1995;10:185–189. [PubMed] [Google Scholar]
- 87.Prince J, Jia S, Bave U, Anneren G, Oreland L. Mitochondrial enzyme deficiencies in Down’s syndrome. J Neural Transm Park Dis Dement Sect. 1994;8:171–181. doi: 10.1007/BF02260938. [DOI] [PubMed] [Google Scholar]
- 88.Rhodes R. Cell titer 96 non-radioactive cell proliferation assays and cytotox 96 non-radioactive cytotoxicity assay. Promega Notes. 1996;59:50–51. [Google Scholar]
- 89.Richardson JS. Free radicals in the genesis of Alzheimer’s disease. Ann NY Acad Sci. 1993;695:73–76. doi: 10.1111/j.1749-6632.1993.tb23031.x. [DOI] [PubMed] [Google Scholar]
- 90.Richardson JS, Zhou Y, Kumar U. Free radicals in the neurotoxic actions of β-amyloid. Ann NY Acad Sci. 1996;777:362–367. doi: 10.1111/j.1749-6632.1996.tb34446.x. [DOI] [PubMed] [Google Scholar]
- 91.Richter C. Pro-oxidants and mitochondrial Ca2+: their relationship to apoptosis and oncogenesis. FEBS Lett. 1993;325:104–107. doi: 10.1016/0014-5793(93)81423-w. [DOI] [PubMed] [Google Scholar]
- 92.Rizzuto R, Simpson AWM, Brini M, Pozzan T. Rapid changes of mitochondrial Ca2+ revealed by specifically targeted recombinant aequorin. Nature. 1992;358:325–327. doi: 10.1038/358325a0. [DOI] [PubMed] [Google Scholar]
- 93.Rizzuto R, Brini M, Murgia M, Pozzan T. Microdomains with high Ca2+ close to IP3-sensitive channels that are sensed by neighboring mitochondria. Science. 1993;262:744–747. doi: 10.1126/science.8235595. [DOI] [PubMed] [Google Scholar]
- 94.Rizzuto R, Bastianutto C, Brini M, Murgia M, Pozzan T. Mitochondrial Ca2+ homeostasis in intact cells. J Cell Biol. 1994;126:1183–1194. doi: 10.1083/jcb.126.5.1183. [DOI] [PMC free article] [PubMed] [Google Scholar]
- 95.Rosenkranz AR, Schmaldienst S, Stuhlmeier KM, Chen W, Knapp W, Zlabinger GJ. A microplate assay for the detection of oxidative products using 2′,7′-dichlorofluorescin-diacetate. J Immunol Methods. 1992;156:39–45. doi: 10.1016/0022-1759(92)90008-h. [DOI] [PubMed] [Google Scholar]
- 96.Sheehan J, Swerdlow RH, Parker WD, Miller SW, Davis RE, Tuttle JB. Altered calcium homeostasis in cells transformed by mitochondria from individuals with Parkinson’s disease. J Neurochem. 1997;68:1221–1233. doi: 10.1046/j.1471-4159.1997.68031221.x. [DOI] [PubMed] [Google Scholar]
- 97.Shigeno T, Mima T, Takaura K, Graham DI, Kato G, Hashimoto Y, Furukawa S. Amelioration of delayed neuronal death in the hippocampus by nerve growth factor. J Neurosci. 1991;11:2914–2919. doi: 10.1523/JNEUROSCI.11-09-02914.1991. [DOI] [PMC free article] [PubMed] [Google Scholar]
- 98.Shoffner JM, Lott MT, Lezza AM, Seibel P, Ballinger SW, Wallace DC. Myoclonic epilepsy and ragged-red fiber disease (MERRF) is associated with a mitochondrial DNA tRNA (Lys) mutation. Cell. 1990;61:931–937. doi: 10.1016/0092-8674(90)90059-n. [DOI] [PubMed] [Google Scholar]
- 99.Shryock JC, Rubio R, Berne R. Extraction of adenine nucleotides from cultured endothelial cells. Anal Biochem. 1986;159:73–81. doi: 10.1016/0003-2697(86)90309-x. [DOI] [PubMed] [Google Scholar]
- 100.Siman R, Noszek JC. Excitatory amino acids activate calpain I and induce structural protein breakdown in vivo. Neuron. 1988;1:279–287. doi: 10.1016/0896-6273(88)90076-1. [DOI] [PubMed] [Google Scholar]
- 101.Simpson PB, Russell JT. Mitochondria support inositol 1,4,5-trisphosphate-mediated Ca2+ waves in cultured oligodendrocytes. J Biol Chem. 1996;271:33493–33501. doi: 10.1074/jbc.271.52.33493. [DOI] [PubMed] [Google Scholar]
- 102.Simpson PB, Nahorski SR, Challiss RAJ. Agonist-evoked Ca2+ mobilization from stores expressing 1,4,5-trisphosphate receptors and ryanodine receptors in cerebellar granule neurones. J Neurochem. 1996;67:364–373. doi: 10.1046/j.1471-4159.1996.67010364.x. [DOI] [PubMed] [Google Scholar]
- 103.Singh G, Lott MT, Wallace DC. A mitochondrial DNA mutation as a cause of Leber’s hereditary optic neuropathy. N Engl J Med. 1989;320:1300–1305. doi: 10.1056/NEJM198905183202002. [DOI] [PubMed] [Google Scholar]
- 104.Smith MA, Perry G, Richey PL, Sayre LM, Anderson VE, Beal MF, Kowall N. Oxidative damage in Alzheimer’s. Nature. 1996;382:120–121. doi: 10.1038/382120b0. [DOI] [PubMed] [Google Scholar]
- 105.St. George-Hyslop PH, Haines JL, Farrer LA, Polinsky R, Broeckhovens C, Goate A, McLachlan DRC, Orr H, Bruni AC, Sorbi S, Rainero I, Foncin JF, Pollen D, Cantu JM, Tupler R, Voskresenkaya N, Mayeux R, Growdon J, Fried VA, Myers RH, Nee L, Backhovens H, Martins JJ, Rossor M, Owen MJ, Mullan M, Percy ME, Karlinsky H, Rich S, Heston L, Montesi M, Mortilla M, Nacmias N, Gusella JF, Hardy JA. Genetic linkage studies suggest that Alzheimer’s disease is not a single homogeneous disorder. Nature. 1990;347:194–197. doi: 10.1038/347194a0. [DOI] [PubMed] [Google Scholar]
- 106.Swerdlow RH, Parks JK, Miller SW, Tuttle JB, Trimmer PA, Sheehan JP, Bennett JP, Jr, Davis RE, Parker WD., Jr Origin and functional consequences of the complex I defect in Parkinson’s disease. Ann Neurol. 1996;40:663–671. doi: 10.1002/ana.410400417. [DOI] [PubMed] [Google Scholar]
- 107.Takehara Y, Kanno T, Yoshioka T, Inoue M, Utsumi K. Oxygen-dependent regulation of mitochondrial energy metabolism by nitric oxide. Arch Biochem Biophys. 1995;323:27–32. doi: 10.1006/abbi.1995.0005. [DOI] [PubMed] [Google Scholar]
- 108.Thayer SA, Miller RJ. Regulation of the intracellular free calcium concentration in single rat dorsal root ganglion neurones in vitro. J Physiol (Lond) 1990;425:85–115. doi: 10.1113/jphysiol.1990.sp018094. [DOI] [PMC free article] [PubMed] [Google Scholar]
- 109.Thoenen H, Barde YA. Physiology of nerve growth factor. Physiol Rev. 1980;60:1284–1335. doi: 10.1152/physrev.1980.60.4.1284. [DOI] [PubMed] [Google Scholar]
- 110.Tong JX, Eichler ME, Rich KM. Intracellular calcium levels influence apoptosis in mature sensory neurons after trophic factor deprivation. Exp Neurol. 1996;138:45–52. doi: 10.1006/exnr.1996.0045. [DOI] [PubMed] [Google Scholar]
- 111.Trayner ID, Rayner AP, Freeman GE, Farzaneh F. Quantitative multiwell myeloid differentiation assay using dichlorodihydrofluorescein diacetate (H2DCF-DA) or dihydrorhodamine 123 (H2R123). J Immunol Methods. 1995;186:275–284. doi: 10.1016/0022-1759(95)00152-z. [DOI] [PubMed] [Google Scholar]
- 112.Verity MA. Mechanisms of phospholipase A2 activation and neuronal injury. Ann NY Acad Sci. 1993;679:110–120. doi: 10.1111/j.1749-6632.1993.tb18292.x. [DOI] [PubMed] [Google Scholar]
- 113.Werth JL, Thayer SA. Mitochondria buffer physiological calcium loads in cultured rat dorsal root ganglion neurons. J Neurosci. 1994;14:348–356. doi: 10.1523/JNEUROSCI.14-01-00348.1994. [DOI] [PMC free article] [PubMed] [Google Scholar]
- 114.White RJ, Reynolds IJ. Mitochondria and Na+/Ca2+ exchange buffer glutamate-induced calcium loads in cultured cortical neurons. J Neurosci. 1995;15:1318–1328. doi: 10.1523/JNEUROSCI.15-02-01318.1995. [DOI] [PMC free article] [PubMed] [Google Scholar]
- 115.Yang J, Liu X, Bhalla K, Kim CN, Ibrado AM, Cai J, Peng TI, Jones DP, Want X. Prevention of apoptosis by Bcl-2: release of cytochrome c from mitochondria block. Science. 1997;275:1129–1132. doi: 10.1126/science.275.5303.1129. [DOI] [PubMed] [Google Scholar]
- 116.Yanker BA. Mechanisms of neuronal degeneration in Alzheimer’s disease. Neuron. 1996;16:921–932. doi: 10.1016/s0896-6273(00)80115-4. [DOI] [PubMed] [Google Scholar]
- 117.Zhou Y, Richardson JS, Mombourquette MJ, Weil JA. Free radical formation in autopsy samples of Alzheimer and control cortex. Neurosci Lett. 1995;195:89–92. doi: 10.1016/0304-3940(94)11787-j. [DOI] [PubMed] [Google Scholar]