

Abstract
The role of transporters in clearing free glutamate from the synaptic cleft was studied in rat CA1 hippocampal neurons cultured on glial microislands. The time course of free glutamate in the cleft during a synaptic event was estimated by measuring the extent to which the rapidly dissociating AMPA receptor antagonist kynurenate (KYN) was replaced by glutamate during a synaptic response. Dose inhibition of the AMPA receptor EPSC by KYN was less than predicted by the equilibrium affinity of the antagonist, and the rise time of AMPA receptor miniature EPSCs (mEPSCs) was slowed by KYN. Both results indicated that KYN dissociated from AMPA receptors and was replaced by synaptically released transmitter. When transporters were blocked byd,l-threo-β-hydroxyaspartic acid (THA) or Li+, the mEPSC rise time in the presence of KYN was slowed further, indicating that transporters affect the glutamate concentration in the first few hundred microseconds of the synaptic response.
The glutamate transient necessary to cause these effects was determined by developing a detailed kinetic model of the AMPA receptor. The model replicated the effects of KYN on the amplitude and rise time of the synaptic responses when driven by glutamate transients that were similar to previous estimates (Clements et al., 1992; Clements, 1996). The effects of THA were replicated by slowing and enlarging the slower phase of the dual component transient by about 20% or by prolonging the single component by almost 40%. Because transport is too slow to account for these effects, it is concluded that transporters buffer glutamate in the synaptic cleft.
Keywords: glutamate transporters; AMPA receptor; kinetic model; cultured hippocampal neurons; buffered diffusion; miniature EPSC; kynurenate; d,l-threo-β-hydroxyaspartic acid (THA)
At most excitatory synapses in the CNS, synaptic vesicles fuse with the presynaptic membrane and release the transmitter glutamate, which diffuses across the cleft and activates postsynaptic receptors. Unlike acetylcholine at the neuromuscular junction (NMJ) (Eccles et al., 1942), glutamate is not enzymatically broken down in the cleft, yet evidence suggests that most of the free glutamate is cleared from the cleft very rapidly (Trussell and Fischbach, 1989;Hestrin, 1992, 1993; Trussell et al., 1993), perhaps within 1 msec (Clements et al., 1992). Theoretically, such rapid clearance might be accomplished by diffusion alone (Ogston, 1955; Eccles and Jaeger, 1958;Wahl et al., 1996), but roles for other mechanisms have not been excluded. A recent report suggested that binding to transporters might speed the clearance of free glutamate (Tong and Jahr, 1994b). In hippocampal neurons, blocking transporters does not change the time course of the AMPA receptor EPSC (Hestrin et al., 1990; Isaacson and Nicoll, 1993; Sarantis et al., 1993; Tong and Jahr, 1994b; Mennerick and Zorumski, 1995) unless receptor desensitization is blocked (Mennerick and Zorumski, 1995). Under certain experimental conditions, however, blocking transporters has been shown to increase the amplitude of the EPSC (Hestrin et al., 1990; Tong and Jahr, 1994b) and the miniature EPSC (mEPSC) (Tong and Jahr, 1994b). Because the transport cycle is very slow (∼20 sec−1; Wadiche et al., 1995) compared with the AMPA receptor mEPSC rise time, uptake itself is probably not fast enough to affect mEPSC amplitude. It has been proposed, therefore, that during the first millisecond of the synaptic response, buffering by a large number of transporters helps clear free glutamate from the cleft (Tong and Jahr, 1994b).
The time course of glutamate in the cleft of hippocampal synapses has been estimated by analyzing the nonequilibrium inhibition of the NMDA receptor EPSC by a low-affinity NMDA receptor antagonist (Clements et al., 1992). This approach was limited by the relatively slow kinetics of the NMDA receptor and, therefore, was unable to determine the shape of the glutamate transient during the first few hundred microseconds. In the present study, the size and shape of the synaptic glutamate transient is determined with greater accuracy than previous estimates by exploiting the fast kinetics of AMPA receptor synaptic responses. A kinetic model of the AMPA receptor, based on responses in excised patches, is developed to estimate the glutamate transient necessary to produce the observed effects of a low-affinity antagonist on synaptic responses. Finally, the model is used together with synaptic data to estimate the effect of transporters on the shape of the glutamate transient. The results indicate that transporters buffer the free glutamate concentration in the cleft during the first few hundred microseconds of a synaptic response. Thus, transporters may limit the extent to which glutamate spills over from one synapse to another.
MATERIALS AND METHODS
Tissue culture. All experiments were performed on CA1 hippocampal neurons dissociated from 1- to 3-d postnatal rats and maintained in cell culture on collagen/poly-d-lysine “micro dots” (Segal and Furshpan, 1990; Bekkers and Stevens, 1991;Diamond and Jahr, 1995). Cells were recorded from after 7–17 d in culture.
Electrophysiology. All recordings (Axopatch-1D; Axon Instruments, Foster City, CA) were obtained with low-resistance [Rtip (for whole cells), 0.8–2 MΩ;Rtip (for patches), 1.5–2 MΩ] pipettes (Corning 0010; World Precision Instruments, Sarasota, FL) pulled on a two-stage vertical puller (Narishige, Sea Cliff, NY). In whole-cell recordings, series resistances were 1.5–4 MΩ and were compensated 80–100%. All recordings were made at a holding potential of −70 mV (corrected for a −10 mV junction potential). Whole-cell recordings of autaptic EPSCs, evoked with 0.5 msec voltage jumps to 0 mV, were sampled at 20 kHz and filtered at 5 kHz (four-pole Bessel filter in the Axopatch). The stimulus artifact preceding the EPSC was reduced by subtracting responses evoked with all postsynaptic receptors blocked. The residual artifact preceding the onset of the EPSC was blanked (see Fig. 4, insets). Recordings from excised patches were sampled at 20–50 kHz and filtered at 5 kHz. Recordings for Schild analysis were sampled at 1 kHz and filtered at 500 Hz. Recordings of mEPSCs were sampled at 20 kHz and filtered at 5 kHz by an eight pole Bessel filter (with the Axopatch filter set to 20 kHz). The 20–80% rise time of the recording system (with the eight pole Bessel filter), measured by making a voltage step under voltage clamp with an electrode in the bath, was 25 μsec (data not shown). All data were acquired using software (AxoBASIC, Axon Instruments) developed in the laboratory and run on a 486 DX personal computer.
Fig. 4.

KYN, but not NBQX, is replaced by glutamate during a synaptic response. Solid lines indicate the expected block of the EPSC without antagonist unbinding, according to the assumptions described in the text. Circles indicate normalized EPSC charge transfer recorded in different concentrations of NBQX (filled circles; n = 11) or KYN (open circles; n = 10; only four different KYN concentrations were tested in any one cell). Synaptic currents were integrated to determine the charge transfer and normalized to the response in the absence of antagonist. Similar results were obtained by measuring EPSC amplitude directly. EPSCs were recorded under conditions of low release probability (1 mmCa/1 mm Mg or 3 mm Ca/1 mm Mg/5 μm Cd; no differences, other than peak amplitude, were observed between these two conditions) to reduce the possibility of multivesicular release (Tong and Jahr, 1994a). Left inset, EPSCs recorded in the presence of 0, 30, 100, 300, and 1000 nm NBQX. Right inset, EPSCs recorded from a different cell in the presence of 0, 100, 200, 1000, and 3000 μm KYN.
Solutions. Patch pipettes were filled with (in mm) 140 potassium gluconate (for evoked EPSC experiments and patch experiments) or cesium methanesulfonate (for mEPSC experiments), 10 NaCl, 6.23 CaCl2, 2 MgCl2, 10 EGTA, pCa 7, 2 K2ATP (Calbiochem, San Diego, CA), 0.2 Na2GTP (Calbiochem), and 10 HEPES, adjusted to pH 7.4 with KOH, and filtered (0.2 μm) before freezing and again immediately before use. There was no apparent difference in AMPA receptor kinetics (as measured in excised patches) with gluconate or methanesulfonate in the pipette (data not shown). The control extracellular solution contained (in mm) 160 NaCl, 3 KCl, 3 CaCl2, 1 MgCl2, 5 HEPES, 0.05 picrotoxin (RBI, Natick, MA), and 0.05d-2-amino-5-phosphonopentanoic acid (Tocris Cookson, St. Louis, MO), adjusted to pH 7.4 with NaOH and 320 mOsm with NaCl. The Li+-based extracellular solution was identical to this, except that 170 mm LiCl was added in place of NaCl and KCl. In the experiments involving the transporter blockerd,l-threo-β-hydroxyaspartic acid (THA), which also acts as an NMDA receptor agonist (Tong and Jahr, 1994b), 0.001 mm 7-chlorokynurenic acid (RBI), an NMDA receptor glycine site antagonist (Kemp et al., 1988), was added to all extracellular solutions. 2,3-Dihydroxy-6-nitro-7-sulfamoyl-benzo(F)quinoxaline (NBQX; a gift from Novo Nordisk) was added from a 10 mmDMSO-based stock. THA, kynurenic acid (KYN; RBI), kainic acid (KA; RBI), and l-glutamate (l-glu) were added directly on the day of the experiment. For all Schild analyses and mEPSC experiments, 0.001 mm tetrodotoxin (TTX; Calbiochem) was added to all extracellular solutions. Unless noted otherwise, all reagents were from Sigma (St. Louis, MO).
Solution delivery. The recording chamber was constantly superfused at a low rate (1 ml min−1) with control extracellular solution. During whole-cell experiments, microdots were superfused with solutions delivered via an array of gravity-fed flow pipes (400 μm diameter) positioned 100–200 μm from the dot. During patch recordings, control and l-glu-containing solutions were constantly delivered through square, four barrel (2 × 2) glass tubing (Vitro Dynamics, Rockaway, NJ) pulled to a tip width of 100 μm/barrel. The solution flow created a sharp interface between solutions delivered through neighboring barrels. Solution changes were made by rapidly moving the tubing with a piezoelectric bimorph (Vernitron, Bedford, OH) such that the solution interface traversed the width of the patch pipette tip. This technique achieved 20–80% solution exchange times of ∼100 μsec at the tip of the pipette (see Fig. 8C).
Fig. 8.

A kinetic model to mimic AMPA receptor behavior.A, Autaptically evoked AMPA receptor EPSC from a cultured CA1 hippocampal neuron (see Materials and Methods). EPSC amplitudes in this cell were unusually small. B, Markov model used to reproduce AMPA receptor kinetics observed in patch experiments. Two binding sites were configured to be equal and independent. Rates were as follows [units are μm−1 msec−1 (forka and kb) or msec−1]: ka, 0.0133; k−a, 6.24;kb, 0.03325;k−b, 5.985;k−1, 0.020;k2, 0.65;k−2, 0.018;k3, 1;k−3, 3; α, 1.1; and β, 5.7.k1 was set (0.361) to satisfy microscopic reversibility. C, l-Glu (10 mm)-evoked current in an outside-out patch excised from the same neuron as in A. The top trace shows the junction potential change caused by the solution exchange across the open tip of the electrode after patch breakdown (see Materials and Methods). In the patch response, artifacts from the voltage pulse to the piezo have been blanked. D, Simulated response to a brief 10 mm pulse of glutamate, similar to the experiment shown in C. E, l-Glu-evoked responses in an outside-out patch. Five traces are superimposed, each with a different interval (20, 50, 100, 150, and 200 msec) between the end of an initial long (70 msec) application of 10 mml-glu and the beginning of a subsequent brief (4 msec) application.F, Simulated responses to a long (50 msec) pulse ofl-glu, followed at varying intervals by brief (4 msec) pulses, similar to the experiment shown in E.
mEPSCs arising at synapses on the dendrites can be filtered by the dendritic cable such that the apparent mEPSC, recorded at the soma, is slower than the actual conductance (Bekkers and Stevens, 1996). To minimize the effects of cable filtering, we attempted to record events arising only close to or on the cell body. To “evoke” mEPSCs, a Ba2+/high K+ solution [containing (in mm) 93 NaCl, 70 KCl, 5 BaCl, 5 HEPES, 0.05 picrotoxin, and 0.001 TTX] was focally applied via pressure (1–3 psi for 0.25–1 sec) from a Picospritzer (General Valve, Fairfield, NJ) through a patch pipette directed at the soma. This technique greatly increased the mEPSC frequency for 30–60 sec (Fig.1A), presumably because the elevated K+ depolarized the presynaptic terminals, allowing the entry through calcium channels of Ba2+, which increases quantal release (Silinsky, 1978; Tang et al., 1994). The puff was administered while saline was applied to the entire microdot through a large flow barrel arranged orthogonally to the puffer pipette; care was taken to choose cells with very few processes “downstream” of the puffer pipette. The inclusion of dye in the puffer pipette (not done during recordings) indicated that the spatial extent of the puff could be confined to a portion of the cell body. In addition, the puffed solution was removed quickly by the strong flow from the pipes, so that mEPSCs occurring ≥1 sec after the puff were recorded in the solution delivered through the pipes (Fig.1A). This arrangement allowed recordings of mEPSCs evoked by the same puffer pipette in the presence of different solutions delivered through the array of flow pipes. Although it was not known how many synapses were activated, the effects of cable filtering were clearly diminished; mEPSCs evoked by a puff onto the soma exhibited faster rise times than those evoked by a puff directed onto a distal dendrite (Fig. 1B).
Fig. 1.
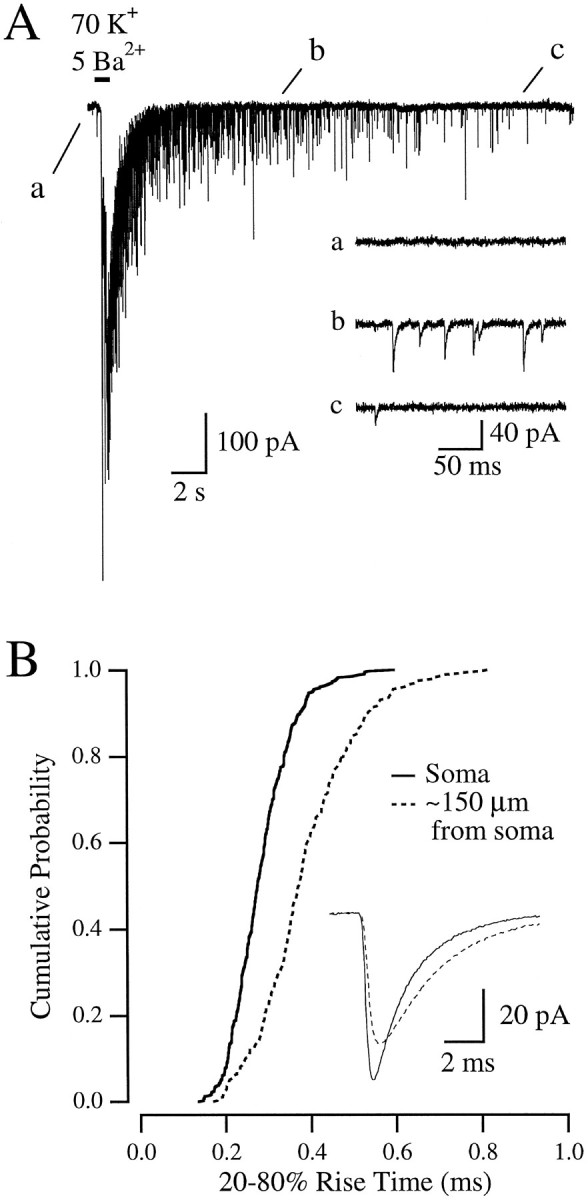
Focally evoked mEPSCs. A, Response to a single puff of Ba/K solution. The large inward current, which persists for several seconds after the puff, was attributable primarily to summation of AMPA receptor-mediated synaptic events, as it was greatly reduced by 5 μm NBQX (data not shown).Inset, Portions of the larger trace, from the areas indicated by letters, displayed on a faster time scale.B, Cumulative probability histogram of rise times of mEPSCs evoked at the soma (solid line;n = 341) or ∼150 μm out along a dendrite (dotted line; n = 363).Inset, Averages of events in both conditions.
Characterization of antagonist affinity. Equilibrium inhibition was determined with Schild analysis (Kenakin, 1987) using KA as an agonist (Fig. 2). Six solutions were delivered to the bath simultaneously via the barrel array; solution exchange was accomplished by moving the barrels so that solution from only one barrel at a time superfused the microdot. The efficacy of KA in each of three different concentrations of KYN or NBQX was compared with the EC50 of KA in the absence of antagonist [120 μm (data not shown), similar to previous reports (Patneau and Mayer, 1990, 1991)]. Responses to 120–150 μm KA, in the absence of antagonist, were obtained to determine the half-maximal response in each cell and to confirm that 10 mm KA, the highest concentration used, displaced all of the antagonist (Fig.2A). A log transformation of the ratio of the EC50 in the presence and absence of antagonist (the “dose ratio”) was plotted against antagonist concentration so that thex-intercept corresponded to the equilibrium affinity (KB, i.e., the antagonist concentration at which the EC50 was twice that in the absence of antagonist). This analysis indicated that both antagonists acted in a purely competitive manner, as reflected in the close agreement of the data with lines of unity slope (Fig. 2B, solid lines;Kenakin, 1987). The KB values were 102 nm for NBQX and 177 μm for KYN. Similar estimates of KB were obtained using a nonlinear regression technique (Lew and Angus, 1995; data not shown).
Fig. 2.
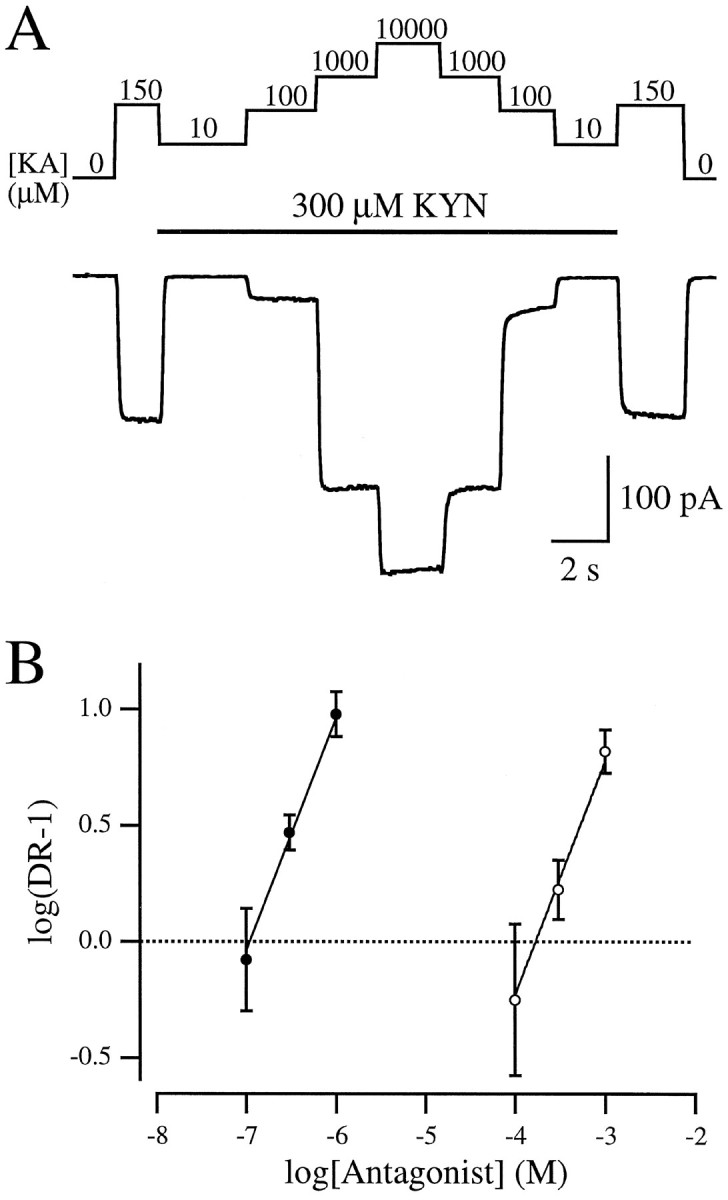
Schild analysis of NBQX and KYN. A, Whole-cell recording of AMPA receptor-mediated responses to different concentrations of KA in the presence of 300 μm KYN. KA (150 μm, approximately an EC50 dose) was applied in the absence of KYN to determine the half-maximal response.B, Schild plot showing the shift in the KA EC50 (the dose ratio) caused by different concentrations of NBQX (filled circles) or KYN (open circles).
Measurement of mEPSC rise time. Because KYN exerted concurrent effects on the size and shape of AMPA receptor mEPSCs (see Results), an algorithm was developed (IGOR Pro; WaveMetrics, Lake Oswego, OR) to measure mEPSC rise time in a way that was robust to changes in amplitude. The raw data were differentiated and smoothed (binomial algorithm, 100 passes), and events were detected using a threshold set by inspecting the smoothed, differentiated trace in the experimental condition in which the slowest rise times were expected. The threshold usually was set to be >10 times the SD of the smooth, differentiated data. Events were ignored if they followed the preceding event by less than 10 msec, to avoid overlapping of the falling phase of one event with the rising phase of another. The positive component of each differentiated event, corresponding to the rising phase of the mEPSC, was fitted with a gaussian function. The goodness of fit (χ2) for each event was calculated; events were omitted from further analysis if their individual χ2 values exceeded the mean by more than 2 SDs.
The algorithm was tested on a simulated data set of 1000 mEPSCs, with randomly distributed rise times, amplitudes, and decays times (Fig.3A, top trace). In the absence of any noise, the 20–80% rise time of each event was determined directly with a level detection algorithm (IGOR). Although the smoothing operation widened the gaussian component of the differentiated data, it did so in a predictable manner, such that the “actual” 20–80% rise time could be recovered with a simple linear transformation:
(r > 0.999; data not shown). Next, gaussian noise was added to the data set (Fig. 3A, bottom trace), and the estimate of the 20–80% rise time of each noisy event from the algorithm was compared with the rise time determined directly in the absence of noise (Fig. 3B). Because the addition of noise changes the rise time of each event, the ratio of measured to actual rise time would not be unity for every event, even for a perfect algorithm. The scatter about unity (ratio, 1.03 ± 0.24; Fig.3B) was greater for smaller events, but there was no significant bias toward overestimating or underestimating the actual rise time (linear regression, p > 0.1).
Fig. 3.

Measuring mEPSC rise times. A, Part of a simulated file containing 1000 mEPSCs, each with randomly chosen time courses (sum of rising and decaying exponentials, each with randomly selected time constants) and amplitudes (30 ± 15 pA). The bottom panel shows the same events as the top panel, but with gaussian noise added. B, Test of how well the algorithm measured the rise times of the simulated mEPSCs. The rise time of each noisy event, as measured by the algorithm, was divided by the rise time measured directly in the absence of noise. This ratio was then plotted versus the amplitude of the event, measured in the absence of noise (see Materials and Methods). C, mEPSCs recorded from a cultured CA1 hippocampal neuron.D, Cumulative probability histogram of amplitudes of mEPSCs recorded from the same cell as in C, at −50 mV (dashed line; n = 739) and −100 mV (solid line; n = 781).E, Cumulative probability histogram of 20–80% rise times of the same events analyzed in D.
The algorithm was then tested on AMPA receptor mEPSCs (1 μm TTX), recorded at −50 and −100 mV (Fig.3C). Because of the change in driving force on the synaptic current (Erev, ∼0 mV), there was a twofold change in the mEPSC amplitude (Fig. 3D), but there was little change in the mEPSC rise time (Fig. 3E). Rapid applications of glutamate to outside-out patches indicated that the activation rate of AMPA receptors was constant between −50 and −100 mV (data not shown), so no change in mEPSC rise was expected. These results indicate that the algorithm accurately measured mEPSC rise time despite large changes in mEPSC amplitude.
Because of bandwidth limitations imposed on the whole-cell recordings by the capacitance of the soma and imperfect series resistance compensation, events with calculated 20–80% rise times <100 μsec were omitted from further analysis. This never resulted in the exclusion of more than 10% of the events.
Kinetic model. To simulate the activation of the AMPA receptor by l-glu and the blockade of this activation by KYN, a Markov-style kinetic model of the AMPA receptor (see Fig.8B) was developed using Simulation Control Program (Simulation Resources, Berrien Springs, MI). Details of the model are given in Results and in the legend of Figure 8.
Noise analysis. The maximal probability of opening (maxPo) for AMPA receptors in an outside-out patch was determined using the method described by Sigworth (1980). Briefly, ≥100 patch responses to a 70 msec application of 10 mm glutamate were recorded at −70 mV. Patches were analyzed only if there was minimal rundown of the response during the experiment. The data were binned such that the range of the mean current I was divided into 100 bins. The relationship between the variance ς2 and I was fitted by the following equation (Sigworth, 1980):
where i is the single-channel current amplitude, andN is the number of functional channels in the patch.
Statistical analysis. Statistics were calculated using StatView (Abacus Concepts, Berkeley, CA) or Prism (GraphPad, San Diego, CA). Comparisons between mEPSC rise time distributions were made with the Mann–Whitney U test to avoid assumptions about distribution shape and to reduce the influence of outliers. The null hypothesis was rejected if p < 0.05. All data are expressed as mean ± SD.
RESULTS
Nonequilibrium inhibition of EPSC by KYN
The experiments described below required a low-affinity (i.e., rapidly dissociating) AMPA receptor antagonist that unbinds the receptor fast enough to be replaced, at a fraction of binding sites, by glutamate released during an EPSC. Replacement was detected by comparing antagonist inhibition of the AMPA receptor EPSC with the inhibition expected at equilibrium. If no antagonist was replaced during a synaptic response, then the efficacy of the antagonist would reflect its equilibrium affinity for the receptor. If, however, the antagonist was replaced by glutamate during a synaptic response, the reduction of the EPSC by the antagonist would be less than predicted by its equilibrium affinity, by an amount dependent on the amplitude and time course of the glutamate concentration transient in the cleft during a synaptic response (Clements et al., 1992).
We compared equilibrium and synaptic inhibition of AMPA receptors by two different purely competitive antagonists (see Materials and Methods), KYN (Perkins and Stone, 1982) and NBQX (Sheardown et al., 1990). Using the equilibrium affinities of both drugs determined with Schild analysis (see Materials and Methods), predictions for the inhibition of the EPSC were made by assuming that: (1) activation of AMPA receptors requires the binding of glutamate to two equal, independent sites; (2) only one of those sites must be bound by antagonist to block activation; and (3) receptors bound by antagonist at the instant of synaptic release remain antagonized for as long as glutamate is present during the response. Under these assumptions, NBQX was predicted to inhibit the EPSC with an IC50 of 42 nm (Fig. 4, solid line), which was indistinguishable from the observed inhibition by NBQX of the EPSC (IC50, 46 nm; Fig. 4, filled circles). This result indicates that, as expected for a very high-affinity antagonist, NBQX did not dissociate significantly in the presence of glutamate during the synaptic response, confirming the third assumption made above. The close agreement between the equilibrium prediction and the observed inhibition, furthermore, lends support to the first two assumptions about the number of binding sites per receptor. In the case of KYN, however, Schild analysis predicted an equilibrium IC50 (73 μm; Fig. 4, solid line) that was lower than the experimentally observed IC50 (148 μm; Fig. 4, open circles), suggesting that for KYN the third assumption was incorrect, i.e., KYN dissociated from AMPA receptors during the EPSC and was replaced at some fraction of sites by synaptically released glutamate.
The effect of KYN on mEPSC rise time
The results illustrated in Figure 4 demonstrate the effects on the EPSC amplitude of KYN dissociation from AMPA receptors during the EPSC. One might also expect that the time to peak of the synaptic response may be slowed in the presence of KYN, because glutamate replacing dissociated KYN would, on average, activate receptors later in the response. KYN caused no change in the rising phase of the EPSC (Fig. 4,right inset), however, probably because the rise time of the EPSC reflects the asynchronous release of synaptic vesicles during an evoked response (Katz and Miledi, 1965; Diamond and Jahr, 1995;Isaacson and Walmsley, 1995) rather than the activation kinetics of AMPA receptors. To investigate the effect of KYN on the time course of the synaptic response in the absence of release asynchrony, we measured the effects of KYN on the rise times of mEPSCs, which reflect the postsynaptic response to single release events.
mEPSCs were collected and analyzed using the techniques described in Materials and Methods. Rise times of 20–80% measured in all of the conditions described below are summarized in Table 1. In control solution, mEPSCs exhibited mean 20–80% rise times of 295 ± 28 μsec and mean amplitudes of 32 ± 13 pA (n= 6). When 200 μm KYN was added to the bath, the mean mEPSC amplitude decreased to 20.6 ± 7.4 pA, and the rise time slowed to 349 ± 42 μsec (n = 6). An example of the effect of KYN on the rise time is shown in Figure5A. Measured across cells, the slowing of the mean rise time was highly significant (p = 0.0004; n = 6; paired t test), but within-cell significance (p < 0.05), although reached in five of six cases (Mann–Whitney U test), was less robust. This was attributable to the large variation in rise time within cells [in control solution, coeffecient of variation (CV) = 0.40 ± 0.055; n = 6]. When the mEPSCs from six cells were combined and compared (Mann–Whitney U test), the effect of KYN on the rise time was highly significant (Fig.5C).
Table 1.
Rise times of AMPA receptor mEPSCs
| Control | 60 nm NBQX | 200 μm KYN | |
|---|---|---|---|
| Control | 295 ± 28a | 299 ± 33b | 349 ± 42c |
| 300 μmTHA | – | 291 ± 29d | 382 ± 41e |
| Na+ | – | 296 ± 43f | 352 ± 56g |
| Li+ | – | 292 ± 43h | 411 ± 66i |
Values are in microseconds and reflect mean ± SD of the mean 20–80% rise times in n cells.
an = 6.
bn = 6; p = 0.31 in pairedt test with control.
cn = 6; p = 0.0004 in pairedt test with control.
dn = 5; p = 0.84 in pairedt test with NBQX alone.
en = 6; p = 0.0011 in pairedt test with KYN alone.
fn = 4; Na+/Li+experiments performed on different cells than control/THA experiments.
gn = 4; p = 0.009 in pairedt test with Na+/NBQX.
hn = 4; p = 0.45 in pairedt test with Na+/NBQX.
in = 4; p = 0.024 in pairedt test with Na+/KYN.
Fig. 5.

KYN, but not NBQX, slows the mEPSC rise time.A, Cumulative probability histogram from a single cell. mEPSC rise times in control (solid line;n = 403), 200 μm KYN (dashed line; n = 230), and 60 nm NBQX (dotted line; n = 242) are compared.Inset, Unscaled averages of the rising phase of the events in 200 μm KYN (dashed line) and 60 nm NBQX (dotted line). B, mEPSCs from six cells, combined, in control (solid line;n = 2071) and 60 nm NBQX (dotted line; n = 1294). C, mEPSCs from the same six cells as in B, combined, in control (solid line; n = 2071) and 200 μm KYN (dashed line; n= 1158).
Although our method to measure rise time seemed robust to changes in amplitude (see Materials and Methods, Fig. 3), as an extra precaution mEPSCs were also recorded in the presence of 60 nm NBQX, which reduced the mean mEPSC amplitude to similar levels (21.2 ± 9.1 pA; n = 6) as 200 μm KYN. Because NBQX does not dissociate during a synaptic response (Fig. 4), it would not be expected to affect the mEPSC rise time. The mean mEPSC rise time in 60 nm NBQX was 299 ± 33 μsec, not significantly different from control (p = 0.31; paired t test;n = 6). This lack of significance was also evident when the events from all six cells were combined (Fig. 5B). These results indicated that KYN, but not NBQX, caused a slowing in the mEPSC rise because of the dissociation of KYN from the AMPA receptor during the rising phase of the synaptic response.
Blocking transporters prolongs the glutamate transient
One would predict that the effect of KYN on the mEPSC rise (Fig.5) would be increased if the glutamate transient were made to decay more slowly. Therefore, if transporters were acting to clear free glutamate during the first few hundred microseconds of the synaptic response, blocking transporters in the presence of KYN would prolong the mEPSC rise even further. This prediction was tested first with THA (300 μm), a transported substrate of glutamate transporters that competes with glutamate for the same binding site (Balcar et al., 1977). When THA was applied in the presence of NBQX (Fig. 6A), no significant change in mEPSC rise time (p = 0.84; n = 5; paired t test) or amplitude (p = 0.13; n = 5; paired t test) was observed, a result that was confirmed for the rise times when mEPSCs in five cells were combined and compared (Fig. 6B). The results with NBQX are consistent with previous studies reporting no effect of THA alone on mEPSC time course or amplitude (Tong and Jahr, 1994b;Mennerick and Zorumski, 1995) and suggest that THA exerted no nonspecific effects on other mechanisms underlying the mEPSC rise, e.g., the kinetic properties of the postsynaptic AMPA receptors. By contrast, when THA was applied in the presence of 200 μmKYN (Fig. 6C), the average mEPSC rise time was increased to 382 ± 41 μsec (p = 0.0011;n = 6; paired t test). When six cells were combined, this difference, although small, was highly significant (Fig.6D). To rule out nonspecific effects of THA in the presence of KYN, 1 mm glutamate was applied to outside-out patches in the presence and absence of 300 μm THA, with 200 μm KYN present in all solutions. THA caused no apparent change in the amplitude or shape of the patch responses (two of two patches; data not shown).
Fig. 6.

THA slows the mEPSC rise in the presence of KYN.A, Cumulative probability histogram of mEPSC rise times from a single cell in 60 nm NBQX (solid line) and NBQX plus 300 μm THA (dotted line). B, mEPSC rise times from five cells, combined, in NBQX alone (solid line;n = 1094) and in NBQX and THA (dotted line; n = 890). C, Cumulative probability histogram of mEPSC rise times from the same cell as in A in 200 μm KYN (solid line) and KYN plus 300 μm THA (dotted line). D, mEPSCs from the same six cells as inB, combined, in KYN alone (solid line;n = 1158) and in KYN and THA (dotted line; n = 1059).
Extracellular Li+ blocks transport by acting as a competitive antagonist at the Na+ binding site (Peterson and Raghupathy, 1974). The effect of Li+on glutamate binding to the transporter has not been studied directly, but a previous report suggests that it decreases glutamate binding considerably, with no effect on AMPA receptor kinetics (Tong and Jahr, 1994b). In the present study, Li+ exerted effects on the mEPSC rise (Fig. 7) that were similar to those of THA. In the presence of 60 nm NBQX, Li+had no significant effect on mEPSC rise time (Fig. 7A), either across cells (p = 0.88; n= 4; paired t test) or when all the mEPSCs were combined (Fig. 7B). In 200 μm KYN, however, Li+ prolonged the 20–80% rising phase from 352 ± 56 μsec in control (i.e., Na+ and KYN) to 411 ± 66 μsec (p = 0.024; n= 4; paired t test; Fig. 7C) This difference was also apparent when events from four cells were combined (Fig.7D).
Fig. 7.

Li+ slows the mEPSC rise in the presence of KYN. A, Cumulative probability histogram of mEPSC rise times from a single cell in 60 nm NBQX in Na+ (solid line) and Li+ (dotted line). B, mEPSC rise times from four cells, combined, in NBQX with Na+ (solid line;n = 1017) and Li+ (dotted line; n = 866). C, Cumulative probability histogram of mEPSC rise times from the same cell as in A in 200 μm KYN with Na+ (solid line) and Li+ (dotted line). D, mEPSC rise times from the same six cells as in B, combined, in KYN with Na+ (solid line; n = 1150) and Li+(dotted line; n = 806).
The results with THA and Li+ indicate that blocking transporters affects the synaptic glutamate concentration during the first few hundred microseconds of the synaptic response. Using the data presented thus far, we sought to estimate the time course of glutamate in the synaptic cleft, in the presence and absence of transporter blockers.
One previous estimate of the glutamate transient used a kinetic model of an NMDA receptor to determine how much synaptic glutamate was required to cause the observed replacement by glutamate of the low-affinity antagonist d-aminoadipate (d-AA) during an EPSC (Clements et al., 1992). The best fit to thed-AA dose inhibition of the NMDA receptor EPSC was obtained by driving the model with a glutamate transient that peaked at 1.1 mm and decayed exponentially with a time constant of 1.2 msec. Because the slow rise time of the NMDA receptor EPSC (10–90%, 7.4 msec; Lester et al., 1990) long outlasted the estimated glutamate transient, d-AA caused no change in the EPSC time course, precluding an estimate of transmitter concentration that was accurate to within less than a few hundred microseconds. However, the subtle effect of blocking transporters on AMPA receptor mEPSC rise time observed in the present study (Figs. 6 and 7) suggests that such resolution may be required to quantitate the effects of transporters on synaptic glutamate concentration.
The results described above indicate that KYN slows the rise time of the AMPA receptor mEPSC (Fig. 5). Therefore, in the present study two experimentally determined criteria exist to narrow predictions of the size and shape of the synaptic glutamate transient: (1) inhibition of AMPA receptor EPSC amplitude by KYN (Fig. 4); and (2) the slowing of the mEPSC rise by KYN (Fig. 5). The next step toward generating predictions of AMPA receptor EPSC amplitude and time course was to characterize the interaction of both l-glu and KYN with the AMPA receptor.
Kinetics of AMPA receptor responses in outside-out patches
The kinetics of l-glu binding were studied in outside-out patches, which could be excised from cultured neurons exhibiting autaptic EPSCs (Fig. 8A). Autaptic responses indicated that the cell was excitatory and, therefore, possessed AMPA receptors that have been shown to be kinetically distinct from those on inhibitory neurons (Hestrin, 1993;Livsey et al., 1993). In most experiments, patches were pulled without first attempting to evoke EPSCs; responses in these patches were indistinguishable from those in patches pulled from cells after evoking EPSCs, so data from all patches were pooled. l-Glu was applied to patches via piezoelectrically controlled flow barrels (Lester and Jahr, 1992; see Materials and Methods), resulting in rapid exchange of the solution bathing the patch (20–80% exchange time across the open tip, ≤100 μsec; Fig. 8C, top trace). Ten millimolar l-glu elicited a rapidly developing inward current (20–80% rise time, 129 ± 22 μsec;n = 13; example shown in Fig. 8C) that, in the continued presence of agonist, desensitized with a time constant (τdes) of 10.3 ± 4.1 msec (n= 11) to a steady-state value that was 19 ± 8% of the peak response (n = 11; Fig. 8E). After removal of l-glu, the remaining current relaxed (“deactivated”), with a time constant (τdeact) of 2.0 ± 0.6 msec (n = 16; Fig. 8C). Subsequent application of l-glu at varying intervals demonstrated that AMPA receptors recovered from desensitization with a time constant (τrec) of 61 ± 13 msec (n = 11; Fig. 8E). These figures (Table 2) are in good agreement with previously reported values (Spruston et al., 1995).
Table 2.
Simulated and experimental AMPA receptor kinetic parameters
| Parameter | Data | Stimulation | Data source |
|---|---|---|---|
| MaxPo | 0.57 ± 0.01 | 0.58 | see Results |
| 20–80% rise time (10 mm glu) | 129 ± 22 μsec | 145 μsec | Fig.8 |
| τdeact | 2.0 ± 0.6 msec | 1.94 msec | Fig.8 |
| τdes | 10.3 ± 4.1 msec | 10.1 msec | Fig.8 |
| τrec | 60.6 ± 12.8 msec | 60.1 msec | Fig.8 |
| Steady-state/peak | 0.19 ± 0.08 | 0.19 | Fig.8 |
| EC50 for l-glu | 482 ± 196 μm | 462 μm | Patneau and Mayer (1990) |
| Cooperativity (n) of glu binding | 1.1 | 1.2 | Patneau and Mayer (1990) |
| τreplace (glu vs KYN) | 389 ± 97 μsec | 416 μsec | Fig. 10 |
| Race (glu vs glu/KYN | 8.1 ± 1.9% | 9.0% | Fig. 9 |
Nonstationary noise analysis (Sigworth, 1980; see Materials and Methods) was performed on l-glu-evoked patch responses to estimate the max Po upon bindingl-glu. In four patches (data not shown), the calculated number of channels in the patch varied greatly (range, 247–980); in two patches the single-channel conductance was about 10 pS (9.0 and 12.2), whereas in two others it was much higher (24.8 and 25.0 pS), in agreement with previous studies reporting a range of single-channel conductances (Yamada and Tang, 1993). The value of the single-channel conductance in each patch was not correlated with any differences in the kinetic parameters described above. All four patches exhibited max Po values (0.57 ± 0.01) that were similar to those in patches pulled from CA1 hippocampal pyramidal cell dendrites in slices (0.57; Spruston et al., 1995).
Kinetics of KYN binding and unbinding
The binding rate of KYN, relative to that of l-glu, was measured in a “race” experiment in outside-out patches. The response to 10 mml-glu alone was compared with the response to 10 mml-glu and 10 mm KYN (Fig. 9A). To minimize the effects of displacement and AMPA receptor desensitization, response amplitude was quantified by measuring the slope over the first 100 μsec of the response. Because 10 mm is nearly a saturating concentration for both l-glu and KYN (Patneau and Mayer, 1990; Fig. 4), nearly all of the binding sites were bound rapidly by one or the other. If l-glu bound each of the two sites on each receptor at the same rate as KYN, then l-glu would singly bind 50% of the receptors and doubly bind 25% of the receptors. The initial slope of the response to l-glu plus KYN, then, would be 25% of that to l-glu alone. In eight patches, however, the inclusion of 10 mm KYN reduced the slope of the 10 mml-glu response to 8.1 ± 1.9% of control. If the two binding sites are independent and equal, these data suggest that l-glu was able to bind only 28% of the sites (0.282 = 0.08), indicating that KYN binds the AMPA receptor ∼(1 − 0.28)/0.28 = 2.5 times faster than l-glu.
Fig. 9.

KYN binds AMPA receptors faster thanl-glu. A, Patch responses to 10 mml-glu alone (large response) and 10 mml-glu together with 10 mm KYN (smaller response). Inset, Earliest phase of both responses, displayed on a faster time scale. B, Simulation of AMPA receptor responses under the same conditions as inA. Magnification of the inset is the same as in A.
The replacement of KYN with l-glu was investigated by comparing the response in excised patches to 10 mml-glu in the absence and continuous presence of 1 mm KYN (Fig. 10A). A high concentration of l-glu was used to bind the receptors rapidly and to minimize rebinding of KYN. Assuming two equal, independent binding sites, at equilibrium 1 mm KYN would singly bind 23.8% of the receptors and doubly bind 74.3%, resulting in 98.1% inhibition at the outset of the response (Fig. 4). Accordingly, the initial phase of l-glu response in the presence of 1 mm KYN was a small fraction of control (Fig.10A). Because KYN dissociated from the receptor and was replaced by l-glu, however, the response in KYN (Fig.10A, thick line) grew to nearly the same amplitude as the control response (Fig. 10A, thin line). Scaling of the KYN response to control (Fig. 10A, dotted line) showed that the latter phases of the responses had overlapping time courses, indicating that l-glu and KYN binding reached equilibrium in less than 2 msec. The scaled trace was subtracted from the control trace to obtain the nonequilibrium difference current (Fig. 10B, thick line). The integral of this current (Fig. 10B, dashed line) was fitted by a single exponential (Fig. 10B, thin line) that had a time constant, in five patches, of 389 ± 97 μsec. Because most of the receptors were doubly bound by KYN at the outset, and some rebinding of KYN occurred during the response, this time course reflects a substantial underestimate of the unbinding rate of KYN. However, this result provided an important check for the accuracy of the derived unbinding rate, as described below.
Fig. 10.

KYN dissociates rapidly from the AMPA receptor.A, Patch responses to 10 mml-glu alone (thin solid line) or in the presence of 1 mm KYN (thick solid line). In the second case, KYN was present in both the control andl-glu solutions. The dotted line indicates the response in KYN scaled to the control trace at the conclusion of the glutamate application. B, The thick solid line indicates the arithmetic difference between the control trace and the scaled KYN trace in A. This difference current was integrated, normalized (dashed line), and fitted by a single exponential function (thin line; see Results). C, D, Simulated AMPA receptor responses under the same conditions as in A,B.
An AMPA receptor kinetic model
A Markov-style kinetic model (Fig. 8B) was developed to simulate the activation of the AMPA receptor byl-glu and the blockade of this activation by KYN. This model was patterned after that used by Jonas et al. (1993) to describe AMPA receptor kinetics in patches excised from CA3 pyramidal neurons in slices, with several adjustments to account for the slightly different kinetics observed in the patch responses reported here. Incorporation of previously derived binding and unbinding rates of l-glu (ka and k−a; Jonas et al., 1993) conferred onto the present model a macroscopic affinity forl-glu that was in good agreement with previous reports (Patneau and Mayer, 1990; Jonas and Sakmann, 1992; Table2). Desensitization and gating parameters were adjusted to mimic the time course of activation and deactivation in response to application of l-glu (Fig.8D), the rate and extent of desensitization observed during longer pulses of l-glu (Fig. 8F), recovery from desensitization (Fig. 8F), and maxPo (Table 2). In addition, the model exhibited steady-state desensitization in low concentrations of l-glu (IC50, 6.2 μm; data not shown) that was similar to published values (∼10 μm; Trussell and Fischbach, 1989; Jonas et al., 1993). However, the model exhibited only mild desensitization (∼15%) to brief (1 msec) pulses of glutamate (data not shown) that was less than reported in rat cortical neurons (50%; Hestrin, 1992) and chick auditory neurons (60%; Raman and Trussell, 1995). Although this shortcoming does not affect the present analysis, accurate simulation of AMPA receptor-mediated responses to multiple synaptic stimuli may require a more sophisticated model (e.g.,Raman and Trussell, 1995).
The binding rate of KYN (kb) was set 2.5 times that for l-glu (ka), to reflect the results of the race experiment (Fig. 9); the dissociation rate of KYN (k−b) was set so that the microscopic affinity of KYN (KB =k−b/kb) reflected the results of the Schild analysis described above (Fig.1B). With no further adjustment, the model reproduced the effects of KYN observed in the race (Fig. 9B) and displacement (Fig. 10C,D) experiments described above (see Table 2). The agreement of the model with these last two results and the Schild analysis supports the accuracy of the derived values ofkb and k−b.
Effect of blocking transporters on the synaptic glutamate transient
Using an NMDA receptor model, Clements et al. (1992) was able to reproduce the dose inhibition of the NMDA receptor EPSC byd-AA with a range of simulated synaptic glutamate concentration transients. Those authors approximated the complex analytical expression describing diffusion from within the cleft (Ogston, 1955; Eccles and Jaeger, 1958) with a function that decayed from a peak concentration ([l-glu]peak) with an exponential time course (τdecay). This same simplification was made in the present study, both for convenience and to facilitate comparison with their results. The set of glutamate transients used to drive the AMPA receptor model was restricted to those falling within the general limits set by Clements et al. (1992). Most of these transients, particularly those that were either faster or smaller than the waveform previously found to be optimal (i.e., [l-glu]peak = 1.1 mm, τdecay = 1.2 msec; Clements et al., 1992), reproduced well the dose inhibition of the AMPA receptor EPSC by KYN. The majority, however, resulted in mEPSCs that rose faster than those recorded experimentally, suggesting that, despite the effects of focal stimulation (Fig. 1), the recorded mEPSCs were significantly filtered, perhaps by the somatic membrane (Silver et al., 1992). To account for this, the modeled mEPSCs in “control” and “200 μmKYN” were passed through a single-pole, low-pass digital filter, the cutoff frequency (fc) of which was adjusted until the 20–80% rise time of the control simulated mEPSC (300 μsec; Fig. 11A, bottom panel, thick solid line) approximated that measured experimentally (Table 1). The illustrated transient (Fig. 11A, top panel, solid line) was chosen from among the set of tested transients, because the simulated KYN mEPSC, when passed through the same filter as the control mEPSC (in this case fc = 720 Hz), exhibited a 20–80% rise time that also was close to experimental values (i.e., 345 μsec; Fig. 11A, bottom panel, dotted line). This transient ([l-glu]peak = 1.5 mm; τdecay = 0.4 msec), mimicked the experimentally measured dose inhibition of the AMPA receptor EPSC by KYN (Fig. 11C, shaded region) better (χ2 = 0.090; Fig. 11C, filled circles) than the prediction of Clements et al. (1992) of 1.1 mm/1.2 msec (χ2 = 0.520; not shown) and better than the equilibrium prediction (χ2 = 0.738; Fig.11C, solid line). In fact, the simulated results fitted the experimental results better than a least squares fit to the Hill equation (χ2 = 0.159; not shown).
Fig. 11.

Modeled effects of KYN and THA on AMPA receptor mEPSCs. A, Simulated mEPSCs (bottom panel) evoked by single-component glutamate transients (top panel). All simulated transients reached their peak values in 10 μsec. See Results for amplitudes and decay time constants of transients and for rise times of the simulated mEPSCs. B, Same as A, but for the two-component transients described in Results. C, Simulated dose inhibition by KYN when the model was driven by the transient in A (filled circles) orB (open circles) compared with the experimentally observed dose inhibition (the shaded region represents mean ± SD from Fig. 4) and the equilibrium prediction (solid line, from Fig. 4).D, Mean EPSC amplitudes (±SD; n = 6), normalized, in control, 300 μm THA, 250 μm KYN, and 250 μm KYN plus 300 μm THA (gray bars). Open circles show data from individual cells. Responses in KYN are from same cells as in control; connections between points in THA and points in KYN have been omitted for clarity. Inset, Averaged EPSCs from one cell in each of the four conditions. The smallest response is in the presence of KYN alone.
Depending on the morphological parameters chosen for a modeled synapse, many theoretical estimates of diffusion from within a cleft predict that the transmitter concentration decays with a time course that can be approximated more closely with two exponential components (Clements et al., 1992; Faber et al., 1992; Otis et al., 1996; Wahl et al., 1996). Recently, the dose inhibition of the NMDA receptor EPSC byd-AA (Clements et al., 1992) was modeled using a glutamate transient with a large ([l-glu]peak = 2.7 mm), fast (τdecay = 0.1 msec) component and a smaller ([l-glu]peak = 0.4 mm), slower (τdecay = 2.1 msec) component (Clements, 1996). This waveform, when used to drive the present AMPA receptor model, replicated the dose inhibition by KYN (χ2 = 0.102; data not shown) but overestimated by 75% the slowing of the mEPSC rise in the presence of KYN and predicted a slower mEPSC decay (τ = 3.5 msec) than previously observed in this preparation (τ = 2.1 msec;Diamond and Jahr, 1995). However, a similar transient with a faster second component ([l-glu]peak1 = 3.2 mm; τdecay1 = 0.1 msec; [l-glu]peak2 = 0.525 mm; τdecay2 = 1.0 msec) enabled the model to replicate the effects of KYN on both mEPSC rise time (Fig. 11B; 20–80% rise time, 300 μsec in control, 350 μsec in KYN;fc = 600 Hz) and amplitude (Fig. 11C, open circles; χ2 = 0.145) and to produce an mEPSC decay (τ = 2.2 msec) that reflected experimental values.
Adjustments to either transient described above enabled the model to reproduce the further slowing of the 20–80% mEPSC rise time observed in the presence of KYN and THA. When the decay time constant of the single-component transient was slowed from 400 to 550 μsec, with no change in amplitude (Fig. 11A, top panel, dashed line), the rise time in KYN slowed to 380 μsec (Fig.11A, bottom panel, dashed line), which agreed well with experimental values obtained with KYN and THA (Table 1). The same effect on mEPSC rise was achieved with the dual-component transient by enlarging and prolonging the slow component by about 20% without changing the peak amplitude of the entire transient ([l-glu]peak2 = 0.6 mm; τdecay2 = 1.2 msec; Fig. 11B, dashed lines). Neither change caused a significant increase in mEPSC rise time in the absence of KYN (<10 μsec; data not shown), consistent with the results described above (Table 1).
The two-component transient predicted that, in the presence of KYN, THA would cause an 11% increase in mEPSC amplitude (Fig.11B, bottom panel), compared with a 25% increase with the single-component transient (Fig. 11A, bottom panel). The smaller increase was more consistent with the insignificant change in mEPSC amplitude observed here (p = 0.40; n = 6; pairedt test) and was similar to the effects of THA on evoked EPSCs (Fig. 11D). In the presence of 250 μm KYN, THA caused a small (9 ± 4%;n = 6) yet significant (p < 0.01) increase in the EPSC amplitude compared with KYN alone (Fig.11D). Because the EPSCs were recorded under conditions of low release probability (5 μmCd2+ extracellularly) to minimize interaction between neighboring synapses (Diamond and Jahr, 1995), the discrepancy between the mEPSC and EPSC data is likely attributable to the large variability in mEPSC amplitude (CV = 0.43 ± 0.06;n = 6) masking a small effect. Finally, the two-component transient predicted only a 3% increase in mEPSC amplitude in the presence of THA alone, which was closer than the single-component estimate (8% increase) to the insignificant effects of THA on EPSC amplitude (97 ± 9% of control; p= 0.27; n = 6; Fig. 11C) and mEPSC amplitude (Mennerick and Zorumski, 1994; Tong and Jahr, 1994b; Mennerick and Zorumski, 1995) at room temperature.
DISCUSSION
Clearance of glutamate from the synaptic cleft
The lifetime of the transmitter in the synaptic cleft seems to vary between preparations (Katz and Miledi, 1973; Clements et al., 1992; Barbour et al., 1994; Otis et al., 1996), attributable in part, presumably, to differences in synaptic morphology and the chemical environment within the cleft. The present results suggest, in close agreement with previous reports (Clements et al., 1992; Clements, 1996), that most free glutamate is cleared from the cleft within 1 msec after exocytosis of a synaptic vesicle but at a slower rate than predicted by free diffusion alone (Eccles and Jaeger, 1958; Wahl et al., 1996), unless a small vesicular fusion pore is assumed (<5 nm diameter; Wahl et al., 1996). The disparity between the experimental results and theoretical estimates of free diffusion are consistent with the widely held notion that the synaptic cleft presents, either in its ultrastructure or its contents, obstacles to diffusion that limit the clearance of transmitter (e.g., Katz and Miledi, 1973; Barbour et al., 1994; Clements, 1996).
Glutamate buffering by transporters
The slowing of the mEPSC rise time by THA or Li+ (in the presence of KYN) indicates, independently of any assumptions made for the model, that transporters affect the concentration of glutamate in the synaptic cleft during the first few hundred microseconds of the response. The turnover rate for the human glutamate transporter EAAT2, an analog of which is highly expressed in the rat hippocampus (GLT1; Rothstein et al., 1994), has been estimated to be 10–20 sec−1 (Wadiche et al., 1995), which is much too slow to account for such a rapid effect. It seems likely, therefore, that transporters remove free glutamate from the cleft very quickly primarily by binding, with transport to come later, as proposed in previous reports (Tong and Jahr, 1994b; Wadiche et al., 1995; Takahashi et al., 1996). Although the binding rate of glutamate (G) to transporters (T) has not been measured directly, from this simplified kinetic scheme (M. P. Kavanaugh, personal communication):
and measured values for the apparent affinity (kapp, ∼20 μm; e.g.,Arriza et al., 1994) and the turnover rate (kt), the binding rate (kon) can be inferred to be at least 106m−1sec−1, according to the following equation:
Thus, transporters seem able to bind glutamate fast enough to mediate the rapid buffering effects proposed here.
Another question concerns the fate of a glutamate molecule once it binds to a transporter. If the dissociation rate (koff) of the transporter is very fast (>1 msec−1), then glutamate might unbind from the transporter during the synaptic response and, therefore, remain in or near the cleft for a longer period. An analogous condition exists at the NMJ, where rapidly reversible binding of acetylcholine to postsynaptic nicotinic receptors retards diffusion of the transmitter from the cleft (Katz and Miledi, 1973). If transporters played a similar role at glutamatergic synapses, however, blocking transporters would speed the clearance of glutamate from the cleft, in contradiction to the present results with THA and Li+ (Figs. 6 and7). If glutamate binds the transporter as fast as it binds AMPA receptors (∼107m−1sec−1; Fig. 8B), the dissociation rate of glutamate, according to the equation above, would be less than 200 sec−1. In this case, the binding of glutamate to transporters, over the time course of the mEPSC rise, could be considered largely irreversible.
Effects of buffering on the size and shape of the glutamate transient
The effect of blocking transporters on the glutamate transient was simulated as a slowing of τdecay, with no increase in [l-glu]peak (Fig.11A,B). This manipulation caused only a small change in the size of the modeled mEPSC, consistent with the insignificant effects of THA on mEPSC amplitude observed at room temperature (present results; Tong and Jahr, 1994b; Mennerick and Zorumski, 1995). Because only about two-thirds of the postsynaptic AMPA receptors seem to be activated at the peak of a synaptic event [i.e., 39% of the channels are open at the peak of the modeled mEPSC (Fig. 11B) compared with channel max Po of 0.58 (Table2)], it seems likely that an increased [l-glu]peak would have resulted in a larger measured mEPSC amplitude. The model suggests that, at the peak of the mEPSC, as many as 20% of the receptors are in a singly bound, closed (not desensitized) state, although, given the mild brief pulse desensitization exhibited by the model, this estimate is probably high. Still, the lack of change in mEPSC amplitude in the presence of THA suggests that, at room temperature, buffering by transporters is not fast enough to affect the glutamate concentration peak, which, according to amperometric data (Bruns and Jahn, 1995) and numerical simulations (Wahl et al., 1996), occurs within 60 μsec of vesicle fusion. However, the effects of THA and Li+ on the rise time (Figs. 6 and 7) indicate that significant buffering must occur within about 200 μsec. The buffering is manifested in the model as a speeding of the decay of the concentration transient, implying that transporters decrease the levels of free glutamate in the cleft with a capacity that develops during the falling phase of the glutamate transient.
At 34°C, THA has been shown to increase AMPA receptor mEPSC amplitude (Tong and Jahr, 1994b). Although this effect was attributed to a decrease in receptor affinity at higher temperatures (Tong and Jahr, 1994b), it is also possible that, at physiological temperatures, transporters bind glutamate fast enough to attenuate the peak concentration encountered by the receptors, analogous to the action of acetylcholinesterase at the NMJ. The recent demonstration in hippocampal slices that transporter buffering is more capacious at elevated temperatures (Asztely et al., 1997) lends support to this hypothesis.
Effects on synaptic transmission
The analysis presented here characterizes the rapid effects of transporter blockers in terms of glutamate concentration, a parameter that is useful to determine the degree of postsynaptic receptor occupancy. Other questions relevant to synaptic transmission, however, require an estimate of the actual number of molecules involved. Given a relatively slow transporter cycling rate (Wadiche et al., 1995), a large number of glutamate binding sites would be required to absorb a significant fraction of the 2000–5000 glutamate molecules released from each vesicle (Riveros et al., 1986; Burger et al., 1989; Bruns and Jahn, 1995). The value of this fraction is an important parameter, because the remaining glutamate is presumably free to diffuse out of the cleft, possibly to neighboring synapses. Unfortunately, the number of glutamate molecules bound by transporters cannot be determined directly from the effects on the concentration transient without more detailed characterization of cleft geometry and the relative distribution of transporters and receptors within the cleft. The number of transporters required cannot be estimated without extensive kinetic information about the relative transporter subtype(s), be they neuronal, glial, or both. If this information were incorporated into a three-dimensional Monte Carlo simulation (e.g., Faber et al., 1992;Bartol and Sejnowski, 1993; Wahl et al., 1996), a more complete picture might eventually emerge. Still, a model based on physiological data provides information about, in the present case, an average across a large number of potentially diverse synapses or, in the other extreme (e.g., Liu and Tsien, 1995), a single synapse that may or may not represent the entire population.
Despite these reservations, the present results contribute to an emerging picture of fast synaptic transmission in which transporters play an important role beyond merely maintaining low ambient levels of transmitter. The present results are consistent with recent reports that transporters are capable of decreasing significantly the amount of glutamate permitted to spill over from one synapse and activate presynaptic or postsynaptic receptors at neighboring synapses (Asztely et al., 1997). Transporters may thus be important for enabling postsynaptic AMPA receptors to respond to specific presynaptic signals independently of nearby synaptic activity; this task may be more difficult in the case of NMDA receptors, which are more than 100 times more sensitive to glutamate (Patneau and Mayer, 1990).
Footnotes
This work was supported by National Institutes of Health Grants NS10041 (J.S.D.) and NS21419 (C.E.J.). We thank Susan Amara, Mathew Jones, Michael Kavanaugh, Tom Otis, and Indira Raman for helpful discussions and Mathew Jones and Tom Otis for critically reading this manuscript. We also thank Jacques Wadiche and Michael Kavanaugh for sharing unpublished results and Jeffrey Volk for preparing cell cultures.
Correspondence should be addressed to Dr. Jeffrey S. Diamond, The Vollum Institute, L474, Oregon Health Sciences University, 3181 S.W. Sam Jackson Park Road, Portland, OR 97201-3098.
REFERENCES
- 1.Arriza JL, Fairman WA, Wadiche JI, Murdoch GH, Kavanaugh MP, Amara SG. Functional comparisons of three glutamate transporter subtypes cloned from human motor cortex. J Neurosci. 1994;14:5559–5569. doi: 10.1523/JNEUROSCI.14-09-05559.1994. [DOI] [PMC free article] [PubMed] [Google Scholar]
- 2.Asztely F, Erdemil G, Kullmann DM. Extrasynaptic glutamate spillover in the hippocampus: dependence on temperature and the role of active glutamate uptake. Neuron. 1997;18:281–293. doi: 10.1016/s0896-6273(00)80268-8. [DOI] [PubMed] [Google Scholar]
- 3.Balcar VJ, Johnston GAR, Twitchin B. Stereospecificity of the inhibition of l-glutamate and l-aspartate high affinity uptake in rat brain slices by threo-β-hydroxyaspartic acid. J Neurochem. 1977;28:1145–1146. doi: 10.1111/j.1471-4159.1977.tb10682.x. [DOI] [PubMed] [Google Scholar]
- 4.Barbour B, Keller B, Llano I, Marty A. Prolonged presence of glutamate during excitatory synaptic transmission to cerebellar Purkinje cells. Neuron. 1994;12:1331–1343. doi: 10.1016/0896-6273(94)90448-0. [DOI] [PubMed] [Google Scholar]
- 5.Bartol TM, Sejnowski TJ. Model of the quantal activation of NMDA receptors at a hippocampal synaptic spine. Soc Neurosci Abstr. 1993;19:1515. [Google Scholar]
- 6.Bekkers JM, Stevens CF. Excitatory and inhibitory autaptic currents in isolated hippocampal neurons maintained in cell culture. Proc Natl Acad Sci USA. 1991;88:7834–7838. doi: 10.1073/pnas.88.17.7834. [DOI] [PMC free article] [PubMed] [Google Scholar]
- 7.Bekkers JM, Stevens CF. Cable properties of cultured hippocampal neurons determined from sucrose-evoked miniature EPSCs. J Neurophysiol. 1996;75:1250–1255. doi: 10.1152/jn.1996.75.3.1250. [DOI] [PubMed] [Google Scholar]
- 8.Bruns D, Jahn R. Real-time measurement of transmitter release from single synaptic vesicles. Nature. 1995;377:62–65. doi: 10.1038/377062a0. [DOI] [PubMed] [Google Scholar]
- 9.Burger PM, Mehl E, Cameron PL, Maycox PR, Baumert M, Lottspeich F, De Camilli P, Jahn R. Synaptic vesicles immunoisolated from rat cerebral cortex contain high levels of glutamate. Neuron. 1989;3:715–720. doi: 10.1016/0896-6273(89)90240-7. [DOI] [PubMed] [Google Scholar]
- 10.Clements JD. Transmitter timecourse in the synaptic cleft: its role in central synaptic function. Trends Neurosci. 1996;19:163–171. doi: 10.1016/s0166-2236(96)10024-2. [DOI] [PubMed] [Google Scholar]
- 11.Clements JD, Lester RA, Tong G, Jahr CE, Westbrook GL. The time course of glutamate in the synaptic cleft. Science. 1992;258:1498–1501. doi: 10.1126/science.1359647. [DOI] [PubMed] [Google Scholar]
- 12.Diamond JS, Jahr CE. Asynchronous release of synaptic vesicles determines the time course of the AMPA receptor-mediated EPSC. Neuron. 1995;15:1097–1107. doi: 10.1016/0896-6273(95)90098-5. [DOI] [PubMed] [Google Scholar]
- 13.Eccles JC, Jaeger JC. The relationship between the mode of operation and the dimensions of the junctional regions at synapses and motor end-organs. Proc R Soc Lond [Biol] 1958;148:38–56. doi: 10.1098/rspb.1958.0003. [DOI] [PubMed] [Google Scholar]
- 14.Eccles JC, Katz B, Kuffler SW. Effects of eserine on neuromuscular transmission. J Neurophysiol. 1942;5:211–230. [Google Scholar]
- 15.Faber DS, Young WS, Legendre P, Korn H. Intrinsic quantal variability due to stochastic properties of receptor-transmitter interactions. Science. 1992;258:1494–1498. doi: 10.1126/science.1279813. [DOI] [PubMed] [Google Scholar]
- 16.Hestrin S. Activation and desensitization of glutamate-activated channels mediating fast excitatory synaptic currents in the visual cortex. Neuron. 1992;9:991–999. doi: 10.1016/0896-6273(92)90250-h. [DOI] [PubMed] [Google Scholar]
- 17.Hestrin S. Different glutamate receptor channels mediate fast excitatory synaptic currents in inhibitory and excitatory cortical neurons. Neuron. 1993;11:1083–1091. doi: 10.1016/0896-6273(93)90221-c. [DOI] [PubMed] [Google Scholar]
- 18.Hestrin S, Sah P, Nicoll RA. Mechanisms generating the time course of dual component excitatory synaptic currents recorded in hippocampal slices. Neuron. 1990;5:247–253. doi: 10.1016/0896-6273(90)90162-9. [DOI] [PubMed] [Google Scholar]
- 19.Isaacson JS, Nicoll RA. The uptake inhibitor l-trans-PDC enhances responses to glutamate but fails to alter the kinetics of excitatory synaptic currents in the hippocampus. J Neurophysiol. 1993;70:2187–2191. doi: 10.1152/jn.1993.70.5.2187. [DOI] [PubMed] [Google Scholar]
- 20.Isaacson JS, Walmsley B. Counting quanta: direct measurements of transmitter release at a central synapse. Neuron. 1995;15:875–884. doi: 10.1016/0896-6273(95)90178-7. [DOI] [PubMed] [Google Scholar]
- 21.Jonas P, Sakmann B. Glutamate receptor channels in isolated patches from CA1 and CA3 pyramidal cells of rat hippocampal slices. J Physiol (Lond) 1992;455:143–171. doi: 10.1113/jphysiol.1992.sp019294. [DOI] [PMC free article] [PubMed] [Google Scholar]
- 22.Jonas P, Major G, Sakmann B. Quantal components of unitary EPSCs at the mossy fibre synapse on CA3 cells of rat hippocampus. J Physiol (Lond) 1993;472:615–663. doi: 10.1113/jphysiol.1993.sp019965. [DOI] [PMC free article] [PubMed] [Google Scholar]
- 23.Katz B, Miledi R. The effect of temperature on the synaptic delay at the neuromuscular junction. J Physiol (Lond) 1965;181:656–670. doi: 10.1113/jphysiol.1965.sp007790. [DOI] [PMC free article] [PubMed] [Google Scholar]
- 24.Katz B, Miledi R. The binding of acetylcholine to receptors and its removal from the synaptic cleft. J Physiol (Lond) 1973;231:549–574. doi: 10.1113/jphysiol.1973.sp010248. [DOI] [PMC free article] [PubMed] [Google Scholar]
- 25.Kemp JA, Foster AC, Leeson PD, Priestley T, Tridgett R, Iversen LL, Woodruff GN. 7-Chlorokynurenic acid is a selective antagonist at the glycine modulatory site of the N-methyl-d-aspartate receptor complex. Proc Natl Acad Sci USA. 1988;85:6547–6550. doi: 10.1073/pnas.85.17.6547. [DOI] [PMC free article] [PubMed] [Google Scholar]
- 26.Kenakin TP. Pharmacologic analysis of drug–receptor interaction. Raven; New York: 1987. [Google Scholar]
- 27.Lester RAJ, Clements JD, Westbrook GL, Jahr CE. Channel kinetics determine the time course of NMDA receptor-mediated synaptic currents. Nature. 1990;346:565–567. doi: 10.1038/346565a0. [DOI] [PubMed] [Google Scholar]
- 28.Lester RAJ, Jahr CE. NMDA channel behavior depends on agonist affinity. J Neurosci. 1992;12:635–643. doi: 10.1523/JNEUROSCI.12-02-00635.1992. [DOI] [PMC free article] [PubMed] [Google Scholar]
- 29.Lew MJ, Angus JA. Analysis of competitive agonist-antagonist interactions by nonlinear regression. Trends Pharmacol Sci. 1995;16:328–337. doi: 10.1016/s0165-6147(00)89066-5. [DOI] [PubMed] [Google Scholar]
- 30.Liu G, Tsien RW. Properties of synaptic transmission at single hippocampal synaptic boutons. Nature. 1995;375:404–408. doi: 10.1038/375404a0. [DOI] [PubMed] [Google Scholar]
- 31.Livsey CT, Costa E, Vicini S. Glutamate-activated currents in outside-out patches from spiny versus aspiny hilar neurons of rat hippocampal slices. J Neurosci. 1993;13:5324–5333. doi: 10.1523/JNEUROSCI.13-12-05324.1993. [DOI] [PMC free article] [PubMed] [Google Scholar]
- 32.Mennerick S, Zorumski CF. Glial contributions to excitatory neurotransmission in cultured hippocampal cells. Nature. 1994;368:59–62. doi: 10.1038/368059a0. [DOI] [PubMed] [Google Scholar]
- 33.Mennerick S, Zorumski CF. Presynaptic influence on the time course of fast excitatory synaptic currents in cultured hippocampal cells. J Neurosci. 1995;15:3178–3192. doi: 10.1523/JNEUROSCI.15-04-03178.1995. [DOI] [PMC free article] [PubMed] [Google Scholar]
- 34.Ogston AG. Removal of acetylcholine from a limited volume by diffusion. J Physiol (Lond) 1955;128:222–223. doi: 10.1113/jphysiol.1955.sp005300. [DOI] [PMC free article] [PubMed] [Google Scholar]
- 35.Otis TS, Wu Y-C, Trussell LO. Delayed clearance of transmitter and the role of glutamate transporters at synapses with multiple release sites. J Neurosci. 1996;16:1634–1644. doi: 10.1523/JNEUROSCI.16-05-01634.1996. [DOI] [PMC free article] [PubMed] [Google Scholar]
- 36.Patneau DK, Mayer ML. Structure–activity relationships for amino acid transmitter candidates acting at N-methyl-d-aspartate and quisqualate receptors. J Neurosci. 1990;10:2385–2399. doi: 10.1523/JNEUROSCI.10-07-02385.1990. [DOI] [PMC free article] [PubMed] [Google Scholar]
- 37.Patneau DK, Mayer ML. Kinetic analysis of interactions between kainate and AMPA: evidence for activation of a single receptor in mouse hippocampal neurons. Neuron. 1991;6:785–798. doi: 10.1016/0896-6273(91)90175-y. [DOI] [PubMed] [Google Scholar]
- 38.Perkins MN, Stone TW. An iontophoretic investigation of the actions of convulsant kynurenines and their interaction with the endogenous excitant quinolinic acid. Brain Res. 1982;247:184–187. doi: 10.1016/0006-8993(82)91048-4. [DOI] [PubMed] [Google Scholar]
- 39.Peterson NA, Raghupathy E. Selective effects of lithium on synaptosomal amino acid transport systems. Biochem Pharmacol. 1974;23:2491–2494. doi: 10.1016/0006-2952(74)90249-4. [DOI] [PubMed] [Google Scholar]
- 40.Raman IM, Trussell LO. The mechanism of α-amino-3-hydroxy-5-methyl-4-isoxazolepropionate receptor desensitization after removal of glutamate. Biophys J. 1995;68:137–146. doi: 10.1016/S0006-3495(95)80168-2. [DOI] [PMC free article] [PubMed] [Google Scholar]
- 41.Riveros N, Fiedler J, Lagos N, Munoz C, Orrego F. Glutamate in rat brain cortex synaptic vesicles: influence of the vesicle isolation procedure. Brain Res. 1986;386:405–408. doi: 10.1016/0006-8993(86)90181-2. [DOI] [PubMed] [Google Scholar]
- 42.Rothstein JD, Martin L, Levey AI, Dykes-Hoberg M, Jin L, Wu D, Nash N, Kunkl RW. Localization of neuronal and glial glutamate transporters. Neuron. 1994;13:713–725. doi: 10.1016/0896-6273(94)90038-8. [DOI] [PubMed] [Google Scholar]
- 43.Sarantis M, Ballerini L, Miller B, Silver RA, Edwards M, Attwell D. Glutamate uptake from the synaptic cleft does not shape the decay of the non-NMDA component of the synaptic current. Neuron. 1993;11:541–549. doi: 10.1016/0896-6273(93)90158-n. [DOI] [PubMed] [Google Scholar]
- 44.Segal M, Furshpan EJ. Epileptiform activity in microcultures containing small numbers of hippocampal neurons. J Neurophysiol. 1990;64:1390–1399. doi: 10.1152/jn.1990.64.5.1390. [DOI] [PubMed] [Google Scholar]
- 45.Sheardown MJ, Nielsen EØ, Hansen AJ, Jacobsen P, Honoré T. 2,3-dihydroxy-6-nitro-7-sulfamoyl-benzo(F)quinoxaline: a neuroprotectant for cerebral ischemia. Science. 1990;247:571–574. doi: 10.1126/science.2154034. [DOI] [PubMed] [Google Scholar]
- 46.Sigworth FJ. The variance of sodium current fluctuations at the node of ranvier. J Physiol (Lond) 1980;307:97–129. doi: 10.1113/jphysiol.1980.sp013426. [DOI] [PMC free article] [PubMed] [Google Scholar]
- 47.Silinsky EM. On the role of barium in supporting the asynchronous release of acetylcholine quanta by motor nerve impulses. J Physiol (Lond) 1978;274:157–171. doi: 10.1113/jphysiol.1978.sp012141. [DOI] [PMC free article] [PubMed] [Google Scholar]
- 48.Silver RA, Traynelis SF, Cull-Candy SG. Rapid-time-course miniature and evoked excitatory currents at cerebellar synapses in situ. Nature. 1992;355:163–166. doi: 10.1038/355163a0. [DOI] [PubMed] [Google Scholar]
- 49.Spruston N, Jonas P, Sakmann B. Dendritic glutamate receptors in rat hippocampal CA3 and CA1 pyramidal neurons. J Physiol (Lond) 1995;482:325–352. doi: 10.1113/jphysiol.1995.sp020521. [DOI] [PMC free article] [PubMed] [Google Scholar]
- 50.Takahashi M, Sarantis M, Attwell D. Postsynaptic glutamate uptake in rat cerebellar Purkinje cells. J Physiol (Lond) 1996;497:523–530. doi: 10.1113/jphysiol.1996.sp021785. [DOI] [PMC free article] [PubMed] [Google Scholar]
- 51.Tang C-M, Margulis M, Shi Q-Y, Fielding A. Saturation of postsynaptic glutamate receptors after quantal release of transmitter. Neuron. 1994;13:1385–1393. doi: 10.1016/0896-6273(94)90423-5. [DOI] [PubMed] [Google Scholar]
- 52.Tong G, Jahr CE. Multivesicular release from excitatory synapses of cultured hippocampal neurons. Neuron. 1994a;12:51–59. doi: 10.1016/0896-6273(94)90151-1. [DOI] [PubMed] [Google Scholar]
- 53.Tong G, Jahr CE. Block of glutamate transporters potentiates postsynaptic excitation. Neuron. 1994b;13:1195–1203. doi: 10.1016/0896-6273(94)90057-4. [DOI] [PubMed] [Google Scholar]
- 54.Trussell LO, Fischbach GD. Glutamate receptor desensitization and its role in synaptic transmission. Neuron. 1989;3:209–218. doi: 10.1016/0896-6273(89)90034-2. [DOI] [PubMed] [Google Scholar]
- 55.Trussell LO, Zhang S, Raman IM. Desensitization of AMPA receptors upon multiquantal neurotransmitter release. Neuron. 1993;10:1185–1196. doi: 10.1016/0896-6273(93)90066-z. [DOI] [PubMed] [Google Scholar]
- 56.Wadiche JI, Arriza JL, Amara SG, Kavanaugh MP. Kinetics of a human glutamate transporter. Neuron. 1995;14:1019–1027. doi: 10.1016/0896-6273(95)90340-2. [DOI] [PubMed] [Google Scholar]
- 57.Wahl LM, Pouzat C, Stratford KJ. Monte Carlo simulation of fast excitatory synaptic transmission at a hippocampal synapse. J Neurophysiol. 1996;75:597–608. doi: 10.1152/jn.1996.75.2.597. [DOI] [PubMed] [Google Scholar]
- 58.Yamada KA, Tang C-M. Benzothiadiazides inhibit rapid glutamate receptor desensitization and enhance glutamatergic synaptic currents. J Neurosci. 1993;13:3904–3915. doi: 10.1523/JNEUROSCI.13-09-03904.1993. [DOI] [PMC free article] [PubMed] [Google Scholar]