Abstract
We investigated the information about stimulus velocity inherent in the membrane signals of two types of directionally selective, motion-sensitive interneurons in the fly visual system. One of the cells, the H1-cell, is a spiking neuron, whereas the other, the HS-cell, encodes sensory information mainly by a graded shift of its membrane potential. Using a pseudo-random velocity waveform by which a visual grating is moving along the horizontal axis of the eye, both cell types follow the stimulus velocity at higher precision than in response to a step-like velocity function. To measure how much information about the stimulus velocity is preserved in the cellular responses, we calculated the coherence between the stimulus and the neural signals as a function of stimulus frequency. At frequencies up to ∼10 Hz motion information is well contained in the electrical signals of HS- and H1-cells: For HS-cells the coherence value amounts to ∼70%, and for H1-cells this value is ∼60%. Comparing these values with the coherence expected from a linear encoding reveals that the fidelity of the original stimulus is deteriorated in the neural signal partly by neural noise and partly by the nonlinearity inherent in the process of visual motion detection. The degree to which this nonlinearity contributes to the decrease in coherence depends on the maximum velocity used in the experiments; the smaller the stimulus amplitude, the higher the coherence and, thus, the smaller the nonlinearity in encoding of stimulus motion. All these results are in agreement with model simulations in which visual motion is processed by an array of local motion detectors, the spatially integrated output of which is considered the equivalent of the neural signals of HS- and H1-cells.
Keywords: motion detection, signal-to-noise ratio, reverse reconstruction, reliability, neural coding, dynamical systems
Deciphering the neural code nerve cells are using to signal information within the nervous system represents a major prerequisite for our understanding of the brain in terms of information-processing machinery. In particular it has been questioned to what extent information is represented in the precise time of occurrence of individual action potentials (de Ruyter van Steveninck and Bialek, 1988, 1995; Softky, 1994, 1995; Mainen and Sejnowski, 1995;Gabbiani et al., 1996). This problem has been approached by Bialek and colleagues (Bialek et al., 1991; Bialek and Rieke, 1992) and Rieke et al. (1997) using a spiking motion-sensitive neuron of the fly, the H1-cell, as their experimental system. To analyze the amount of information about the velocity of the moving stimulus inherent in the spike train of the H1-cell, these authors developed the so-called reverse reconstruction technique. Theunissen (1993) and Theunissen et al. (1996) extended this analytical technique to the frequency domain and applied it to wind-sensitive interneurons of the cricket cercal system. Briefly, the technique consists of finding a linear temporal filter to minimize the difference between the real stimulus and the reconstructed stimulus obtained by convolving the neural response with this filter. The degree by which the real and reconstructed stimuli agree with each other can be regarded as a measure of the information about the stimulus in the neural response. In the linear case, such a filter can be calculated rigorously based on the average cross-correlation between repetitive stimulus presentations and the response traces elicited each time.
We applied the reverse reconstruction technique to a certain class of visual interneurons of the fly, the HS-cells, as well as to H1-cells for comparison. As do H1-cells, HS-cells belong to the class of so-called lobula plate tangential cells (LPTCs) of the fly visual system. The LPTCs represent a set of ∼60 fairly large neurons per brain hemisphere, each of which can be identified individually because of its invariant anatomy and characteristic visual response properties (Hausen, 1981, 1982a,b, 1984; Hengstenberg, 1982; Eckert and Dvorak, 1983). There exists one H1-cell and three different HS-cells per lobula plate. The three HS-cells differ by their dendritic arborization in the lobula plate and concomitantly by their receptive field location. With their large dendrites all LPTCs spatially pool the signals of thousands of local, columnar elements arranged in a retinotopic fashion (Borst and Egelhaaf, 1990, 1992; Haag et al., 1992, Borst et al., 1995). Thus they have large receptive fields and respond to visual motion in a directionally selective way (Borst and Egelhaaf, 1989, 1990; Egelhaaf et al., 1989). The tangential cells connect either to other brain areas or, via descending neurons, to thoracic motor centers. From various lines of evidence it is concluded that these cells are involved in the visual course control of the fly (Heisenberg et al., 1978; Geiger and Nässel, 1981, 1982; Hausen and Wehrhahn, 1983, 1990; Egelhaaf and Borst, 1993). The two LPTCs examined in this paper differ from each other in several ways. The H1-cell produces regular action potentials to transfer visual motion information from one lobula plate to the other and responds preferentially to motion from the rear to the front of the eye (Hausen, 1976, 1977; Zaagman et al., 1977; Eckert, 1980). In contrast, HS-cells synapse onto descending neurons and respond to visual motion by a graded shift of their axonal membrane potential. They are maximally excited by motion from the front to the back in front of the eye of the fly and inhibited by motion in the opposite direction (Hausen, 1982a,b; Borst and Haag, 1996; Haag et al., 1997).
Here, we examine the fidelity at which visual motion information is represented in the neural signals of HS- and H1-cells. The comparison between a graded membrane potential and a spiking neuron should allow determination of which of the two coding strategies is superior with respect to their reliability and precision to represent sensory information. We also investigate to what extent the stimulus velocity is encoded in the neural signals of both cell types in a linear way.
MATERIALS AND METHODS
Preparation and setup. Female blowflies (Calliphora erythrocephala) were briefly anesthetized with CO2 and mounted ventral side up with wax on a small preparation platform. The head capsule was opened from behind; the trachea and air sacs, which normally cover the lobula plate, were removed. To eliminate movements of the brain caused by peristaltic contractions of the esophagus, the proboscis of the fly was cut away, and the gut was pulled out. This allowed stable intracellular recordings of up to 45 min. The fly was then mounted in an upright position on a heavy recording table with the stimulus monitors in front of the fly. The fly brain was viewed from behind through a Zeiss dissection scope.
Stimulation. A monitor (Tectronix 608) was placed in front of the fly positioned at an angle of 45° from the frontal midline of the fly. The position of the fly was carefully adjusted using the symmetry of the frontal equatorial pseudo-pupils of both eyes. As seen by the fly, the display had a horizontal angular extent of 42° and a vertical extent of 58°. The stimulus pattern was produced by an image synthesizer (Picasso, Innisfree Inc.) using a frame rate of 200 Hz. The intensity of the pattern was square wave modulated along its horizontal axis. The stimulus grating had a fixed wavelength of 14° and a contrast of 0.70. The mean luminance of the pattern was ∼25 cd/m2. To identify the cells by their visual response properties, cells were first stimulated by the pattern moving back and forth with a square wave velocity profile at a duty cycle of 2 sec. When the actual experiment was started, the stimulus moved at a pseudo-random velocity with a flat spectrum up to ∼20 Hz. The velocity function was calculated using the “gasdev” function from numerical recipes (Press et al., 1988) and was controlled by a computer via a digital-to-analog board (Metrabyte DAS16) at 2 kHz. One stimulus sweep lasted for 40 sec, and a variable number of sweeps (5–20) were presented to each cell during one experiment.
Recording. For intracellular recordings electrodes were pulled on a Brown-Flaming P-97 micropipette puller using thin-wall glass capillaries with a diameter of 1 mm (GC100TF-10; Clark Electromedical Instruments). When filled with 1 m KCl they had resistances of ∼20–30 MΩ. A SEL10-amplifier (NPI Electronics) operated in the bridge mode was used throughout the experiments. Extracellular recordings were made using standard tungsten electrodes with a resistance of ∼5 MΩ. Extracellular signals were bandpass-filtered and subsequently processed by a threshold device delivering a 100 mV pulse of 1 msec duration on each spike detected. To ensure a direct comparison of the signals from HS- and H1-cells, these pulses were left as if recorded intracellularly. The pseudo-analog H1-signals can be directly translated into spike frequencies. With the width and amplitude of the pulses used here, 1 mV corresponds to 10 Hz. For data analysis the output signal of the threshold device as well as the stimulus function controlling the velocity of the pattern was fed to a computer via a 12 bit analog-to-digital converter (Metrabyte DAS16) at a sampling rate of 2 kHz and stored to a hard disk.
Data evaluation. The signals were evaluated off-line by a program written in Turbo-Pascal (Borland) using several routines from numerical recipes (Press et al., 1988). Each continuous 40 sec stretch of the stimulus, s(t), and response function,r(t), was cut into time segments of 4 sec duration [si(t)andri(t), respectively]. Each of these segments, si(t) andri(t), was Fourier-transformed toSi(f) andRi(f), and the cross-correlations and autocorrelations were calculated as the products of the complex functions. To calculate the forward filter,Gfwd, the average cross-correlation was divided by the average autocorrelation of the stimulus (with 〈 〉 denoting the average and * the complex conjugate):
| Equation 1 |
The reverse filter was calculated as the ratio of the average cross-correlation and the average autocorrelation of the response:
| Equation 2 |
Using this filter, the estimated stimulus,Sesti(f), was calculated as the product betweenRi(f) andGrev(f):
| Equation 3 |
The final filter, G(f), between Si(f) andSesti(f) then was calculated by replacing the response segments,Ri(f) in Equation 1 by the estimated stimulus segments,Sesti(f):
| Equation 4 |
Combining Equations 3 and 4, it can be readily seen thatG(f) is equal to the coherence function, γ2:
| Equation 5 |
Throughout this paper, we used Equation 5 to calculate the coherence from all available response and stimulus segments within one experiment. As a control, we additionally divided several experiments in two halves, used the first half to calculate the reverse filter, and calculated the final filter or coherence by applying Equation 4 to the second half of the experiment. This led to identical results (data not shown). In the figures, only amplitude spectra of the complex functions will be shown, i.e., the square root of the sum of the squared real and imaginary parts. We will loosely refer to these amplitude spectra by the same names as the complex functions.
In a perfectly linear, noise-free system, the coherence is expected to equal 1 for all frequencies. To see how the introduction of noise affects the coherence in a linear system, we considered a case in which noise is added to the response after the stimulus is fed through the forward filter. This is expressed in the following equation:
| Equation 6 |
Combining Equations 5 and 6 reveals how the coherence function γ2(f) depends on the ratio of the signal and noise amplitude spectra,snr(f):
| Equation 7 |
We measured the signal and noise spectra in the following way. From the neural signals obtained in response to repeated stimulus presentations, we first calculated the mean response,R(t). To calculate the noise within each stimulus period, we subtracted the mean response from each individual response. We then Fourier transformed the mean response and all individual noise traces to obtain the mean response and noise spectra. As explained above, both HS and H1 signals are represented in the same way and, therefore, were treated identically in our evaluation programs. Having determined the ratio of signal and noise spectra, we then used Equation7 to estimate an expected coherence for a purely linear coding scheme given the signal-to-noise ratio determined experimentally in the way just described. A comparison between the real coherence and the expected one should allow estimation of what extent nonlinear encoding deteriorates the performance.
RESULTS
In a first series of experiments H1- and HS-cells were stimulated by a velocity step in their preferred direction as well as by pseudo-random velocity function moving the pattern in both preferred and null directions with a gaussian white noise spectrum between 0.1 and 10 Hz. The results are shown in Figure 1 in a color-coded way for the HS-cell (Fig. 1a,c) and as a raster plot for the spiking H1-cell (Fig. 1b,d). In contrast to a step-like velocity profile, both cell types displayed a strikingly reliable response when confronted with the pseudo-random motion stimulus each repeated 20 times. HS-cells show virtually identical membrane potential fluctuations in response to the pseudo-random stimulus (Fig. 1a). In contrast, the response to the step-like velocity function contains much more variability than described above (Fig. 1c). Here, the response initially reaches higher levels and decreases to some extent with ongoing stimulation. Thus, in summary, the graded responses of HS-cells to randomly fluctuating stimuli reveal a striking reliability compared with the responses to a pattern moving continuously at a constant velocity. The same holds true for the occurrence of action potentials in the H1-cell in response to a random stimulus velocity (Fig.1b) compared with a step-like velocity profile (Fig.1d).
Fig. 1.
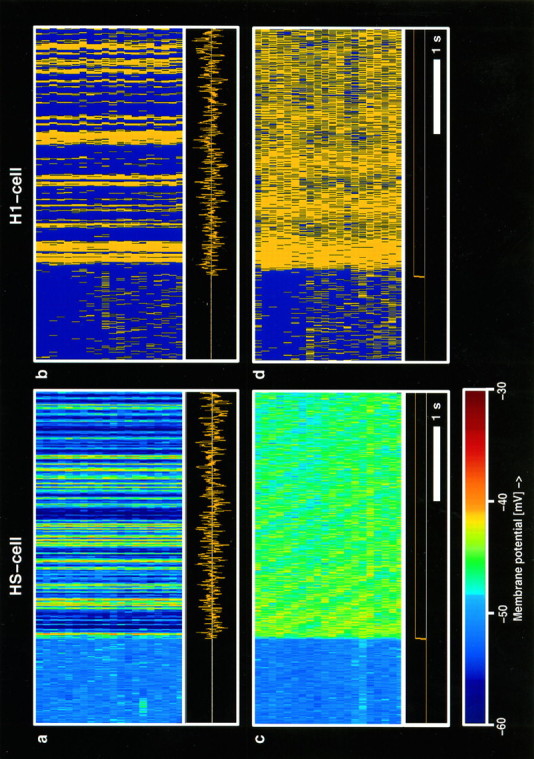
Responses of an HS-cell (left) and an H1-cell (right) to a pseudo-randomly fluctuating (a, b) and a step-like (c, d) velocity profile. Each cell was stimulated 20 times by the stimulus waveform shown at the bottom of each panel. The neural responses are displayed in a color-coded manner using a bin width of 5 msec and are stacked on top of each other. Note the highly regular responses of both cells to the fluctuating stimulus in contrast to the responses when a step-like velocity profile was given. Calibration: 1 sec.
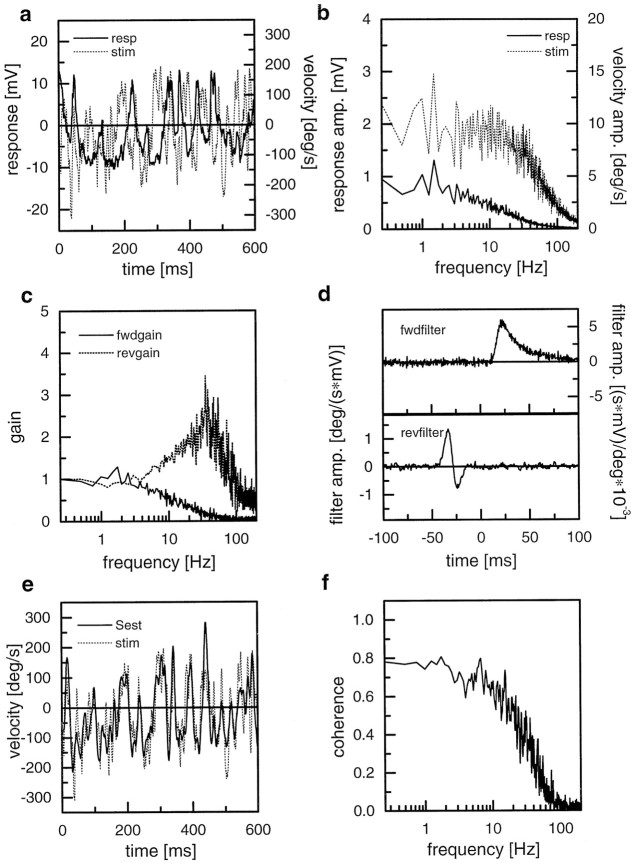
To assess this amount of reliability quantitatively, we applied the reverse reconstruction method (see Materials and Methods). Figure2a shows a 600 msec stretch of the velocity function together with the membrane potential of an HS-cell. Obviously, both signals correlate only vaguely and with a considerable delay between them. In particular, fast deflections of the stimulus functions are not followed by the membrane potential of the cell. Figure 2b shows the amplitude spectra of the stimulus and the response, respectively. The forward gain, i.e., the cross-correlation between stimulus and response normalized by the stimulus power as calculated from this experiment, is shown in Figure2c together with the reverse gain. In Figure2d, the impulse responses of the forward and reverse filters are shown as a function of time. The forward filter resembles a low pass. The reverse filter is reversed in time; i.e., it leads to a backward shift of the convolved signal compared with the original one and seems to have band pass characteristics. This can also be seen in the spectrum of the reverse gain in Figure 2c, which boosts frequencies above 5 Hz. Applying this filter to the membrane response results in a striking improvement of the similarity between stimulus and response (Fig. 2e). Now, the signal as estimated from the response, the so-called estimated stimulus (Sest), follows almost every deflection of the stimulus. Apart from very fast deflections, the estimated stimulus seems to have a high degree of correlation with the original stimulus. This is quantified in the coherence function shown in Figure 2f. Up to 10 Hz, the coherence reaches a value of >0.7. Only at frequencies higher than 30 Hz does the reverse gain become <0.2 and soon approximates 0. Thus, by using a simple linear filter, the information about the pattern velocity can be recruited from the membrane potential of the HS-cell with high precision over a wide frequency range.
Fig. 2.
Reverse reconstruction technique exemplified on a recording from an HS-cell. a, Stimulus and response trace from an individual episode of the experiment. b, Amplitude spectra of the stimulus and the response. c, Forward and reverse gain between stimulus and response as calculated by the ratio of the cross-correlation and the respective autocorrelation (see Materials and Methods for details). d, Impulse responses of the forward and reverse filters. e, Identical stimulus segment as in a, but shown along with the estimated stimulus as calculated by convolving the response with the reverse filter. f, Coherence function between stimulus and response. This can also be understood as the forward gain between stimulus and estimated stimulus.
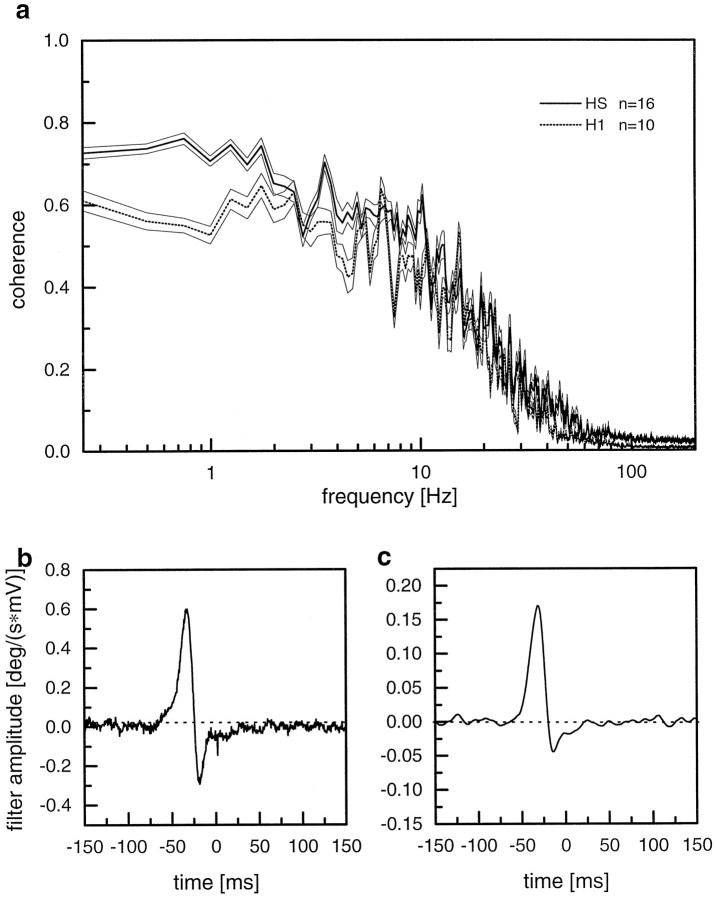
The coherence function as described above was determined in a subsequent set of experiments on 16 HS-cells and 10 H1-cells, all recorded in different flies. Figure 3a shows the result as mean coherence functions for HS- and H1-cells, respectively, together with the reverse filter calculated for both cell types (Fig. 3b,c). For HS-cells, the coherence reaches values of ∼0.6–0.7 in the frequency range between 0.2 and 10 Hz. Then, it falls off rather steeply. The respective values for H1-cells are in general lower by ∼10–20% in the low frequency range and asymptotic to the ones of HS-cells at high frequencies. Thus, motion information is retained in the spike frequency signals of H1-cells with less accuracy than in the graded membrane response of HS-cells. This fact can be explained by the low spontaneous firing frequency of ∼20 Hz found in H1-cells. With a maximum firing rate of up to 250 Hz, this cell offers a wide dynamic range for visual patterns moving along the preferred direction of the cell. However, for pattern motion in the anti-preferred or null direction of the cell, this dynamic range is compressed into only 20 Hz. Thus, H1-cells cannot reliably encode the velocity information for pattern motion in the null direction. Because we used velocity signals that were statistically distributed around a mean level of zero, it is not surprising to find less motion information in the spike train of H1-cells compared with the graded membrane response of HS-cells, which can be shifted in both the depolarizing and hyperpolarizing direction without leading to any immediate ceiling effects. Nevertheless, the reverse filter is strikingly similar for both cell types (compare Fig.3b,c).
Fig. 3.
a, Comparison between the coherence functions of HS- and H1-cells. The data are derived from experiments on 16 different HS-cells and 10 different H1-cells. The graphs show the mean values ± SEM. b, Mean reverse filter for HS-cells as calculated from the same data set as in a.c, Mean reverse filter for H1-cells as calculated from the same data set as in a.
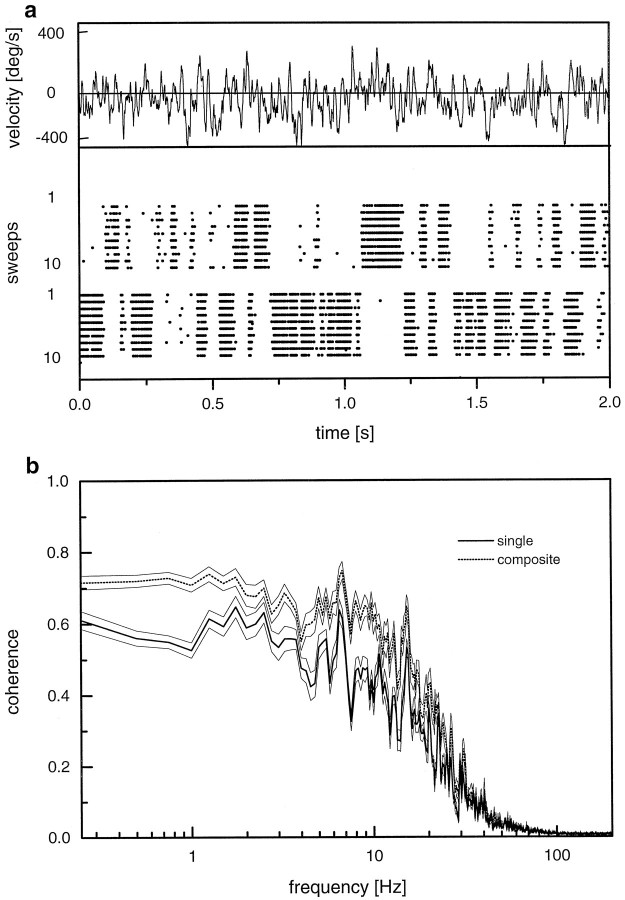
This shortcoming of H1-cells as neural monitors of image velocity has already been realized by Bialek and colleagues in their seminal work on neural coding (Bialek et al., 1991). To overcome this problem, the authors repeated the original stimulus in a mirror-symmetrical way, again recorded the spike train of H1, and combined both signals into a single spike train with positive and negative spikes (“composite signal”). We also applied this technique, and the results of these experiments are shown in Figure 4. In Figure4a, the stimulus is displayed at the top. Beneath that, two scatter plots are shown, one for the original stimulus and another one for the mirrored stimulus. In can be readily seen that all gaps left by the spike trains in response to the original signal are filled by spikes caused by the mirror signal. When we combined these signals into one containing upward and downward deflections of unitary amplitude and applied the same data evaluation as before, the coherence function as shown in Figure 4b was obtained. For comparison, the coherence function as obtained from single H1-cells is also plotted (same data as in Fig. 3). The coherence function using the composite signal is substantially elevated compared with the one from single H1 signals and becomes as high as the one of HS-cells. Thus, when the stimulus range is limited to motion along the preferred direction of the cells, the spiking H1-cell encodes motion information with about the same accuracy as does the graded membrane response of HS-cells.
Fig. 4.
a, Stimulus waveform and scatter plot of the spike responses of an H1-cell to the original (top 10 lines) and mirror-symmetrical stimulus (bottom 10 lines). Note complete absence of spikes during those stimulus periods when the pattern moves into the null direction of the H1-cell. These gaps are precisely filled when the direction of the stimulus is reversed. b, Coherence functions for single H1-cells and twin pairs of H1-cells in which the response consists of positive and negative spikes derived from the original and reversed stimulus periods, respectively. Note the increased coherence for the composite response. Data represent the mean ± SEM derived from experiments on 10 different H1-cells.
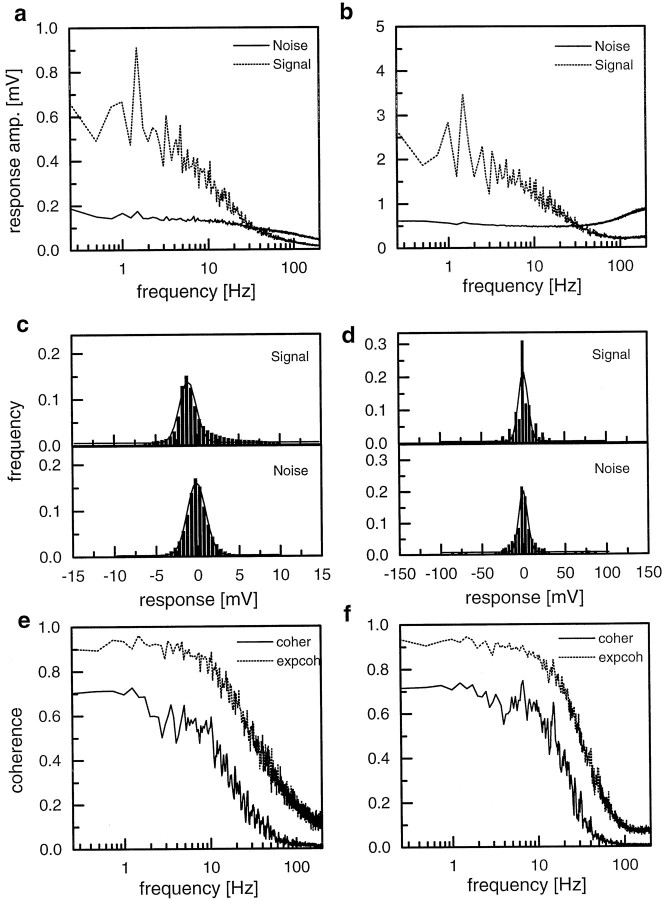
Despite the high levels of coherence found between the stimulus velocity and the neural signals in HS- and H1-cells, there still remains a gap of at least 20% even in the low frequency range. In principle, any deviation from a 100% level can be caused by two different facts: noise and nonlinear encoding. To decide which of these is the prime reason for the failure to reach a 100% coherence, we calculated the signal (i.e., the mean response) and the noise spectra in response to repeated stimulus presentations in an independent set of experiments. These are shown in Figure 5, aand b, for HS- and H1-cells, respectively, together with the signal and noise distributions (Fig. 5c,d). As explained in Materials and Methods, one can calculate from the signal-to-noise spectra a coherence function as expected from linear encoding principles. In other words, given a completely linear system, these are the expected coherence functions given the particular signal-to-noise ratios. The expected coherence functions are shown in Figure 5,e and f. From the same experimental data set in which the signal and noise spectra were derived, we again calculated the real coherence functions in the way described before. These functions are also plotted in the graphs of Figure 5, e andf. As one can see, noise alone cannot fully account for difference of the measured coherences and a 100% level. Although the coherence functions expected from a linear encoding are settled at ∼0.9 for frequencies <10 Hz, the neural coherence functions reach only ∼0.7, similar to what has been found in the experiments described above. The consequence of this finding is that about one-third of the missing accuracy can be accounted for by the statistical fluctuations inherent in the neural signals, whereas the remaining two-thirds have to be attributable to nonlinear encoding. This is true for HS- as well as H1-cells.
Fig. 5.
a, b, Signal and noise spectra derived from HS-cells (a) and H1-cells (b). In the case of H1-cells, the response consisted of positive and negative spikes derived from the original and reversed stimulus periods, respectively. c, d, Signal (top) and noise (bottom) distributions derived from the data shown in a and b, respectively. The solid lines represent gaussian functions fitted to the data. e, f, Coherence functions as measured from HS-cells (e) and H1-cells (f) together with the coherences as expected from the signal-to-noise spectra shown in a andb, respectively. Data represent the mean results derived from experiments in different flies on 6 HS-cells and 10 H1-cells.
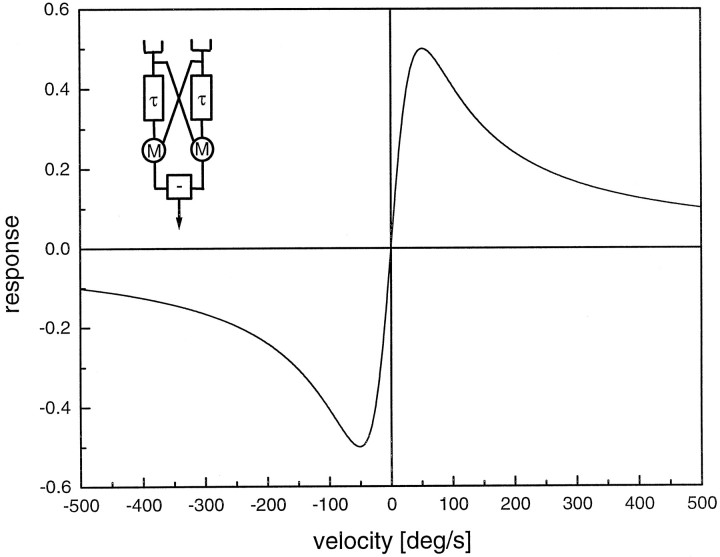
The high coherence value found in motion-sensitive neurons studied here is at first glance amazing, because directionally selective motion detection is known to be an inherently nonlinear process (Reichardt, 1961, 1987; Poggio and Reichardt, 1973; Zaagman et al., 1978; Borst and Egelhaaf, 1989, 1993). In general, the signals delivered by a motion detector are unlike a speedometer and do not exhibit a linear dependence on stimulus velocity. Under steady-state conditions, the detector response, R, depends on the stimulus conditions in the following way:
| Equation 8 |
This function is shown Figure 6, together with a sketch of the detector model. The motion detector consists of two subunits, the output signals of which become subtracted to form the final response. Within each subunit, the local luminance value is low-pass-filtered and multiplied with the instantaneous value measured at a neighboring location. In Equation 8, the variable ω denotes the circular frequency, i.e., 2π times the ratio of the pattern velocity and the spatial pattern wavelength, ΔI the contrast, Θ(ω) the phase response of the filter, Δϕ the sampling base of the motion detector, and λ the spatial pattern wavelength. Using a first-order low-pass filter with a time constant, τ, of 50 msec, the response is maximum for a temporal frequency of 1/(2πτ) ≈ 3 Hz (Borst and Bahde, 1986), which corresponds to a pattern velocity of 128°/sec for a pattern with a spatial wavelength λ of 16°. As predicted from correlation type motion detectors, the steady-state velocity dependence of fly LPTCs as well as of the fly optomotor response exhibits a maximum at a temporal frequency between 1 and 10 Hz and declines toward zero for lower and higher velocities (Götz, 1972; Hausen, 1982a;Buchner, 1984).
Fig. 6.
Nonlinear steady-state velocity dependence of a correlation type of motion detector. The detector model is shown in theinset and consists of two mirror-symmetrical subunits, the outputs of which are subtracted to give the final response. In each subunit, the local luminance value is low-pass-filtered (t) and multiplied (M) with the instantaneous value measured at a neighboring location. The response is maximum for a grating moving at a velocity that results in a temporal modulation of the input channels of 1/(2πτ). Here, the spatial pattern wavelength amounts to 16° and the time constant τ of the detector is 50 msec.
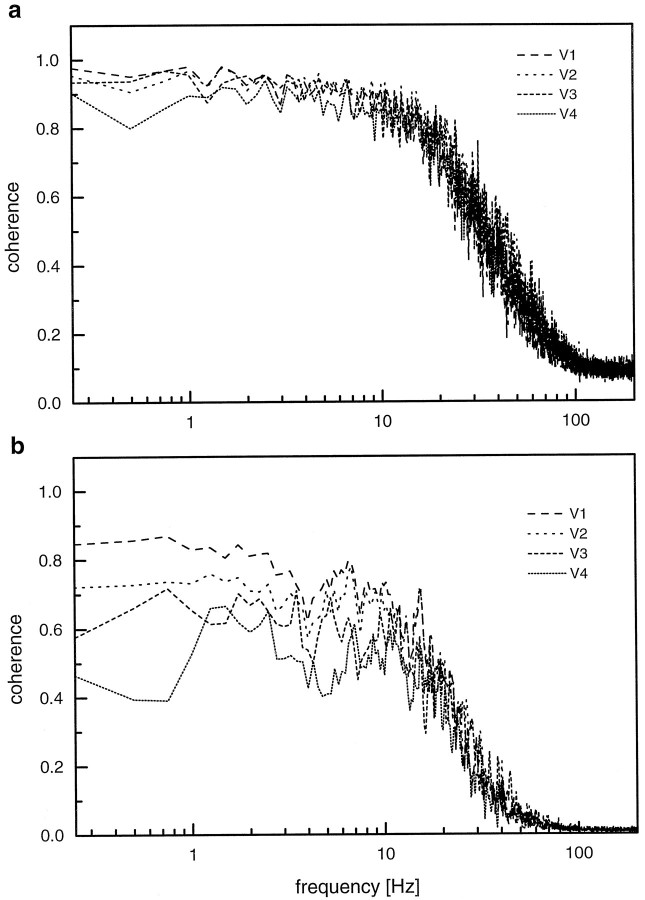
Considering this velocity dependence, it becomes obvious that for small velocity amplitudes the function can well be linearized around zero. Thus, it is to be expected that for small stimulus amplitudes, a fairly linear response behavior can be assumed, and, as a consequence, high coherence values are to be expected, mainly limited by the noise of the system. To examine this point, we studied the velocity encoding in H1-cells again using pseudo-random stimuli but with various maximum pattern velocities. The expected coherence functions are shown in Figure 7a. For all maximum pattern velocities tested, these functions are similar to each other. This is attributable to a similar signal-to-noise level found under the various stimulus conditions. The measured coherence functions are shown in Figure7b. These differ from each other significantly. Highest coherence values are found at the smallest maximum stimulus velocity. Here, the coherence function comes closest to the optimal coherence, as expected from the signal-to-noise ratios, measured in the same experiment. With higher stimulus velocities, the coherence becomes smaller. Under these stimulus conditions, the missing coherence must be largely attributed to nonlinear encoding. Thus, as expected from a directionally selective motion detection system, the nonlinearity in the system increases with increasing stimulus amplitudes and leads to a decreased coherence.
Fig. 7.
a, Expected coherence functions as determined from the signal and noise spectra measured in response to four different stimulus spectra (V1–V4) with the following mean amplitudes in the frequency range between 0.25 and 30 Hz: V1, 4.4°/sec; V2, 8.7°/sec;V3, 11.2°/sec; and V4 14.3°/sec.b, Measured coherence functions as determined from the same experiments as used in a. Data represent the mean results derived from experiments on five different H1-cells. The signals of H1-cells consisted of positive and negative spikes derived from the original and reversed stimulus periods, respectively. Note that in a, expected coherence functions are virtually identical because of the rather invariable signal-to-noise ratios, whereas in b, measured coherences decrease substantially with increasing maximum pattern velocity. The signals of H1-cells consisted of positive and negative spikes derived from the original and reversed stimulus periods, respectively.
The main conclusion from the experiments described above is that for small maximum velocities, the motion detection system reacts in a rather linear way, and therefore, the coherence between stimulus and response is deteriorated substantially by noise. Using higher stimulus amplitudes, the nonlinearities of the motion detection process play an increasingly major role. To study the response properties of the motion detection process independently, we performed a model study in which we simulated an artificial motion detection system and mimicked the different experimental conditions as closely as possible. The simulation consisted of a sine grating (spatial wavelength, 16°; 80% contrast) that was moved using various stimulus waveforms including pseudo-random stimuli as well as pure sinusoids. Pattern motion was detected by an array of 32 elementary motion detectors of the correlation type (sampling base Δϕ = 1°; time constant τ = 50 msec). Each motion detector was simulated as shown in Figure 6,inset. The output signals of all 32 motion detectors were spatially averaged and contaminated by a variable amount of noise. Stimulus and response functions were evaluated using exactly the same routines that were used for data analysis. Each simulation run lasted 4096 msec. Twenty runs were used to calculate the reverse filter. In the next 20 runs, the estimated stimulus was calculated from each stimulus. We then determined the gain between the real and estimated stimuli, which is equivalent to the coherence function (see Materials and Methods).
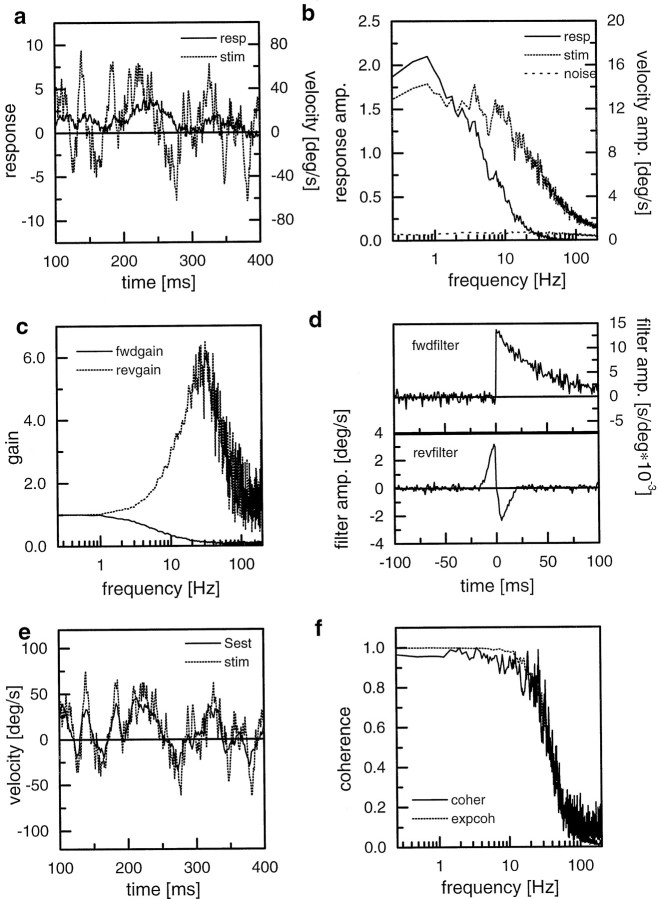
Figure 8 summarizes the results obtained from such a simulation using a maximum stimulus velocity of 80°, which corresponds to a maximum temporal luminance modulation at the input of 5 Hz. In Figure 8a, an example segment of the stimulus and the response is shown. The response can be seen to follow the stimulus only poorly. Most importantly, the response does not follow at all fast deflections in the stimulus and, thus, seems to represent a low-pass-filtered version of the stimulus. In Figure8b, stimulus, response, and noise amplitude spectra are displayed. The stimulus has a flat spectrum and declines at >20 Hz. The response spectrum, in accordance with the visual inspection of Figure 8a, declines at lower frequencies. The noise spectrum used in this example is rather flat and amounts to 5% of the response amplitude. It should be noted that the response amplitude was determined after subtraction of the noise. In Figure 8c, the forward and reverse gains are shown (see Materials and Methods for more details). The forward gain represents the spectrum of a low-pass filter, whereas the reverse filter reveals bandpass characteristics amplifying the frequency band between 10 and 50 Hz. The impulse responses of the forward and reverse filters are shown in Figure8d. Note the simple exponential decay of the forward filter and the on–off shape of the reverse filter, both properties as expected from the respective spectra. In Figure 8e, the same stimulus segment that was shown in Figure 8a is shown again but this time together with the estimated stimulus instead of the original response. The coherence between the stimulus and response is shown in Figure 8f, together with the coherence expected to form a linear system given the signal-to-noise spectrum used here.
Fig. 8.
Simulation study on an array of local correlation-type motion detectors being stimulated by a moving sine grating. a, Example segment of the velocity function (stim) and the spatially integrated detector output (resp). b, Stimulus, response, and noise spectra derived from 20 simulation runs. c, Forward gain (fwdgain) and reverse gain (revgain) as calculated by dividing the cross-correlation between stimulus and response (response and stimulus) by the autocorrelation of the stimulus (response), respectively.d, Impulse responses of the forward filter (fwdfilter) and the reverse filter (revfilter). e, Same stimulus segment as in a, together with the estimated stimulus as derived from convolving the response with the reverse filter. f, Coherence function (coher) between the stimulus and the response together with the coherence expected (expcoh) from the signal and noise spectra assuming that the noise is additive to the response.
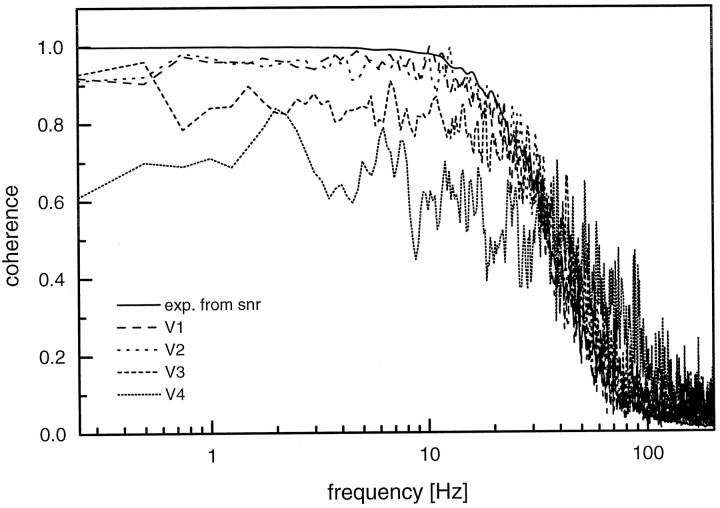
Using this simulation design, we varied the maximum stimulus velocity from 80 to 640°/sec in exponential steps of two and determined the coherence functions, again using a noise level of 5% of the response amplitude (Fig. 9). The highest coherence is found forv = 80°/sec, i.e., the smallest velocity. In this case, the coherence function is almost identical to the coherence function expected from a linear system. For higher maximum velocities, the coherence function decreases to values of roughly 60%. This is similar to what was observed in the experiments (compare with Fig.7).
Fig. 9.
Expected coherence (exp. from snr) together with the measured coherence obtained from simulations using four different stimulus spectra (V1–V4) with the following mean amplitudes in the frequency range between 0.25 and 30 Hz: V1, 9.1°/sec; V2, 18.4°/sec;V3, 35.7°/sec; and V4, 72.6°/sec. All other parameters are identical to the ones used for the simulation shown in Figure 8.
DISCUSSION
In this paper, we investigated the amount of information about the stimulus velocity inherent in the neural signals of two types of motion-sensitive interneurons of the fly visual system, the HS-cell and the H1-cell. When the cells were stimulated by a dynamic instead of a step-like velocity profile, we found an amazing reliability in the neural responses (Fig. 1) strongly reminiscent of what has been described for cortical cells in response to current injection (Mainen and Sejnowski, 1995) or sensory stimulation (Bair and Koch, 1996). Calculating the coherence between stimulus and response, we found that HS-cells represent the motion information with a higher fidelity than do H1-cells. This fact can be explained by the low spontaneous firing frequency of H1-cells, which offers only a limited dynamic range for encoding stimulus motion that inhibits the H1-cell. When this limitation of the H1-cell is compensated for by combining the responses to preferred and null direction stimuli, both cell types perform in an incredibly similar way. Both HS- and H1-cells reveal an astonishingly high degree of precision by which they encode stimulus velocity. This surprising finding is explained by the quasi-linear input–output relationship of the motion-detecting system when small stimulus amplitudes are used. Accordingly, when using larger stimulus velocities, the coherence function decreases in both cell types.
A close look at the forward and reverse filters found by respective correlations reveals that the best linear filters describing the transformation from the stimulus into the response and vice versa are low-pass and bandpass filters, respectively. The forward filter has been determined previously for H1-cells in a different way. Using a brief motion pulse to stimulate the cells, Srinivasan (1983) and de Ruyter van Steveninck and Bialek (1995) measured the impulse response of the cell directly. These results agree well with our findings that a simple low-pass filter represents the best linear description of the transformation of the stimulus into the cellular response. In a noise-free system, the reverse filter should simply compensate the effect of the forward filter completely and, thus, be equivalent to a deconvolution. However, because at high stimulus frequencies noise contributes in a significant amount to the response amplitudes, the reverse filter cuts off this frequency range and thus turns into a bandpass filter. The reverse filters found here for HS- and H1-cells are almost identical to each other (Fig. 3b,c).
Calculating the optimal filter leading from the stimulus to the estimated stimulus results in a mathematical expression that is the product of the Fourier transforms of the forward and reverse filters and, thus, is identical to the coherence function between stimulus and response. This coherence equals 1 only for a completely linear system and under noise-free circumstances. Using single scalar values of stimulus and response instead of functional values as is the case here, the coherence can be regarded as measure of how much all the value pairs xi and yi scatter around a linear regression line (Theunissen, 1993). The coherence can be smaller than 1 for two, not mutually exclusive, reasons. First, the coherence value can be deteriorated by noise, and second, it can be decreased by a nonlinear coding of the stimulus in the response. We have derived an expected coherence for a given signal-to-noise ratio under the assumption that the noise is additive to the response and completely independent of stimulus and response. We found that in both cell types under study, the suboptimal performance can be attributed in part to the noise and in part to nonlinear encoding. Which of the two sources dominates depends on the maximum stimulus velocity.
The assumption of additive noise can be critically tested by measuring the noise with and without stimulation. Here, preliminary experiments revealed that, in accordance with our assumption, the noise spectra are almost identical when the neurons are stimulated by a moving visual pattern or when the pattern is at rest (J. Haag and A. Borst, unpublished observations). This is in partial agreement with measurements on the H1-cell, in which the noise was found to increase slightly with increasing overall activity (Warzecha, 1994). In the same study, the reliability of HS- and H1-cells was compared, too. However, significant differences with respect to the stimulation and analysis techniques do not allow for a comparison with the results presented here.
Despite their response characteristic of being graded potential neurons, HS-cells house various voltage- and ion-gated currents in their membranes (Borst and Haag, 1996, Haag et al., 1997). Under certain circumstances, these currents can lead to the generation of action potentials of variable amplitude in these cells and have been shown to amplify the neural responses to high-frequency synaptic input signals (Haag and Borst, 1996). By additional manipulation of the resting membrane potential via injection of hyperpolarizing currents of various amounts, these cells can be turned from the normal mixed response mode into almost purely spiking cells or, by strong hyperpolarizations, into purely graded cells. Comparing the information content under these various conditions, thus, allows us to ask to what degree these fast membrane processes contribute to more accurate encoding compared with a purely spiking or a purely graded response mode. Thus, our future work is directed toward the connection between biophysics and coding performance, which ultimately should lead to a functional understanding of distinct membrane parameters found in these cells.
Footnotes
We are grateful to T. Martin for excellent technical assistance, V. Gauck for critically reading this manuscript, and J. P. Miller and F. Theunissen for stimulating discussions at early stages of this work.
Correspondence should be addressed to Dr. Alexander Borst, Friedrich-Miescher-Laboratorium der Max-Planck-Gesellschaft, Spemannstrasse 37-39, D-72076 Tuebingen, Germany.
REFERENCES
- 1.Bair W, Koch C. Temporal precision of spike trains in extrastriate cortex of the behaving macaque monkey. Neural Comput. 1996;8:1185–1202. doi: 10.1162/neco.1996.8.6.1185. [DOI] [PubMed] [Google Scholar]
- 2.Bialek W, Rieke F, de Ruyter van Steveninck R, Warland D. Reading a neural code. Science. 1991;252:1854–1857. doi: 10.1126/science.2063199. [DOI] [PubMed] [Google Scholar]
- 3.Bialek W, Rieke F. Reliability and information transmission in spiking neurons. Trends Neurosci. 1992;15:428–434. doi: 10.1016/0166-2236(92)90005-s. [DOI] [PubMed] [Google Scholar]
- 4.Borst A, Bahde S. What kind of movement detector is triggering the landing response of the housefly? Biol Cybern. 1986;55:59–69. [Google Scholar]
- 5.Borst A, Egelhaaf M. Principles of visual motion detection. Trends Neurosci. 1989;12:297–306. doi: 10.1016/0166-2236(89)90010-6. [DOI] [PubMed] [Google Scholar]
- 6.Borst A, Egelhaaf M. Direction selectivity of fly motion-sensitive neurons is computed in a two-stage process. Proc Natl Acad Sci USA. 1990;87:9363–9367. doi: 10.1073/pnas.87.23.9363. [DOI] [PMC free article] [PubMed] [Google Scholar]
- 7.Borst A, Egelhaaf M. In vivo imaging of calcium accumulation in fly interneurons as elicited by visual motion stimulation. Proc Natl Acad Sci USA. 1992;89:4139–4143. doi: 10.1073/pnas.89.9.4139. [DOI] [PMC free article] [PubMed] [Google Scholar]
- 8.Borst A, Egelhaaf M. Detecting visual motion: theory and models. In: Miles FA, Wallman J, editors. Visual motion and its role in the stabilization of gaze. Elsevier; Amsterdam: 1993. pp. 3–27. [PubMed] [Google Scholar]
- 9.Borst A, Haag J. The intrinsic electrophysiological characteristics of fly lobula plate tangential cells: I. Passive membrane properties. J Computat Neurosci. 1996;3:313–336. doi: 10.1007/BF00161091. [DOI] [PubMed] [Google Scholar]
- 10.Borst A, Egelhaaf M, Haag J. Mechanisms of dendritic integration underlying gain control in fly motion-sensitive interneurons. J Computat Neurosci. 1995;2:5–18. doi: 10.1007/BF00962705. [DOI] [PubMed] [Google Scholar]
- 11.Buchner E. Behavioural analysis of spatial vision in insects. In: Ali MA, editor. Photoreception and vision in invertebrates. Plenum; New York: 1984. pp. 561–621. [Google Scholar]
- 12.de Ruyter van Steveninck R, Bialek W. Real-time performance of movement-sensitive neuron in the blowfly visual system: coding and information transfer in short spike sequences. Proc R Soc Lond [Biol] 1988;234:379–414. [Google Scholar]
- 13.de Ruyter van Steveninck R, Bialek W. Reliability and statistical efficiency of a blowfly movement-sensitive neuron. Philos Trans R Soc Lond [Biol] 1995;348:321–340. [Google Scholar]
- 14.Eckert H. Functional properties of the H1-neurone in the third optic ganglion of the blowfly, Phaenicia. J Comp Physiol. 1980;135:29–39. [Google Scholar]
- 15.Eckert H, Dvorak DR. The centrifugal horizontal cells in the lobula plate of the blowfly Phaenicia sericata. J Insect Physiol. 1983;29:547–560. [Google Scholar]
- 16.Egelhaaf M, Borst A. A look into the cockpit of the fly: visual orientation, algorithms, and identified neurons. J Neurosci. 1993;13:4563–4574. doi: 10.1523/JNEUROSCI.13-11-04563.1993. [DOI] [PMC free article] [PubMed] [Google Scholar]
- 17.Egelhaaf M, Borst A, Reichardt W. Computational structure of a biological motion detection-detection system as revealed by local detector analysis in the fly’s nervous system. J Opt Soc Am A. 1989;6:1070–1087. doi: 10.1364/josaa.6.001070. [DOI] [PubMed] [Google Scholar]
- 18.Gabbiani F, Metzner W, Wessel R, Koch C. From stimulus encoding to feature extraction in weakly electric fish. Nature. 1996;384:564–567. doi: 10.1038/384564a0. [DOI] [PubMed] [Google Scholar]
- 19.Geiger G, Nässel DR. Visual orientation behaviour of flies after selective laser beam ablation of interneurones. Nature. 1981;293:398–399. doi: 10.1038/293398a0. [DOI] [PubMed] [Google Scholar]
- 20.Geiger G, Nässel DR. Visual processing of moving single objects and wide-field patterns in flies: behavioural analysis after laser-surgical removal of interneurons. Biol Cybern. 1982;44:141–149. [Google Scholar]
- 21.Götz KG. Principles of optomotor reactions in insects. Bibl Ophthal. 1972;82:251–259. [PubMed] [Google Scholar]
- 22.Haag J, Borst A. Amplification of high-frequency synaptic inputs by active dendritic membrane processes. Nature. 1996;379:639–641. [Google Scholar]
- 23.Haag J, Egelhaaf M, Borst A. Dendritic integration of motion information in visual interneurons of the blowfly. Neurosci Lett. 1992;140:173–176. doi: 10.1016/0304-3940(92)90095-o. [DOI] [PubMed] [Google Scholar]
- 24.Haag J, Theunissen F, Borst A (1997) The intrinsic electrophysiological characteristics of fly lobula plate tangential cells. II. Active membrane properties. J Computat Neurosci, in press. [DOI] [PubMed]
- 25.Hausen K. Functional characterization and anatomical identification of motion sensitive neurons in the lobula plate of the blowfly Calliphora erythrocephala. Z Naturforsch [C] 1976;31:629–633. [Google Scholar]
- 26.Hausen K (1977) Struktur, Funktion und Konnektivität bewegungsempfindlicher Interneurone im dritten optischen Neuropil der Schmeiβfliege Calliphora erythrocephala. PhD thesis, University of Tuebingen.
- 27.Hausen K. Monocular and binocular computation of motion in the lobula plate of the fly. Verh Dtsch Zool Ges. 1981;74:49–70. [Google Scholar]
- 28.Hausen K. Motion sensitive interneurons in the optomotor system of the fly. I. The horizontal cells: structure and signals. Biol Cybern. 1982a;45:143–156. [Google Scholar]
- 29.Hausen K. Motion sensitive interneurons in the optomotor system of the fly. II. The horizontal cells: receptive field organization and response characteristics. Biol Cybern. 1982b;46:67–79. [Google Scholar]
- 30.Hausen K. The lobula-complex of the fly: structure, function and significance in visual behaviour. In: Ali MA, editor. Photoreception and vision in invertebrates. Plenum; New York: 1984. pp. 523–559. [Google Scholar]
- 31.Hausen K, Wehrhahn C. Microsurgical lesion of horizontal cells changes optomotor yaw response in the blowfly Calliphora erythocephala. Proc R Soc Lond [Biol] 1983;219:211–216. [Google Scholar]
- 32.Hausen K, Wehrhahn C. Neural circuits mediating visual flight control in flies. II. Separation of two control systems by microsurgical brain lesions. J Neurosci. 1990;10:351–360. doi: 10.1523/JNEUROSCI.10-01-00351.1990. [DOI] [PMC free article] [PubMed] [Google Scholar]
- 33.Heisenberg M, Wonneberger R, Wolf R. Optomotor-blind (H31)—a Drosophila mutant of the lobula plate giant neurons. J Comp Physiol. 1978;124:287–296. [Google Scholar]
- 34.Hengstenberg R. Common visual response properties of giant vertical cells in the lobula plate of the blowfly Calliphora. J Comp Physiol [A] 1982;149:179–193. [Google Scholar]
- 35.Mainen ZF, Sejnowski TJ. Reliability of spike timing in neocortical neurons. Science. 1995;268:1503–1506. doi: 10.1126/science.7770778. [DOI] [PubMed] [Google Scholar]
- 36.Poggio T, Reichardt W. Considerations on models of movement detection. Kybernetik. 1973;13:223–227. doi: 10.1007/BF00274887. [DOI] [PubMed] [Google Scholar]
- 37.Press WH, Flannery BP, Teukolsky SA, Vetterling WT. Numerical recipes in C. The art of scientific computing, pp 1–735. Cambridge UP; Cambridge, UK: 1988. [Google Scholar]
- 38.Reichardt W. Autocorrelation, a principle for the evaluation of sensory information by the central nervous system. In: Rosenblith WA, editor. Sensory communication. MIT; New York: 1961. pp. 303–317. [Google Scholar]
- 39.Reichardt W. Evaluation of optical motion information by movement detectors. J Comp Physiol [A] 1987;161:533–547. doi: 10.1007/BF00603660. [DOI] [PubMed] [Google Scholar]
- 40.Rieke F, Warland D, de Ruyter van Steveninck R, Bialek W. Spikes. Exploring the neural code. pp 1–393. MIT; Cambridge, MA: 1997. [Google Scholar]
- 41.Softky W. Sub-millisecond coincidence detection in active dendritic trees. Neuroscience. 1994;38:13–41. doi: 10.1016/0306-4522(94)90154-6. [DOI] [PubMed] [Google Scholar]
- 42.Softky WR. Simple codes versus efficient codes. Curr Opin Neurobiol. 1995;5:239–247. doi: 10.1016/0959-4388(95)80032-8. [DOI] [PubMed] [Google Scholar]
- 43.Srinivasan MV. The impulse response of a movement-detecting neuron and its interpretation. Vision Res. 1983;23:659–663. doi: 10.1016/0042-6989(83)90073-1. [DOI] [PubMed] [Google Scholar]
- 44.Theunissen F. An investigation of sensory coding principles using advanced statistical techniques. PhD dissertation, University of California at Berkeley; 1993. [Google Scholar]
- 45.Theunissen F, Roddey JC, Stufflebeam S, Clague H, Miller JP. Information theoretic analysis of dynamical encoding by four primary sensory interneurons in the cricket cercal system. J Neurophysiol. 1996;75:1345–1364. doi: 10.1152/jn.1996.75.4.1345. [DOI] [PubMed] [Google Scholar]
- 46.Warzecha A-K (1994) Reliability of neural information processing in the motion pathway of the blowflies Calliphora erythrocephala and Lucilia cuprina. PhD dissertation, University of Tuebingen.
- 47.Zaagman WH, Mastebroek HAK, Buyse T, Kuiper JW. Receptive field characteristics of a directionally selective movement detector in the visual system of the blowfly. J Comp Physiol. 1977;116:39–50. [Google Scholar]
- 48.Zaagman WH, Mastebroek HAK, Kuiper JW. On the correlation model: performance of a movement detecting neural element in the fly visual system. Biol Cybern. 1978;31:163–168. doi: 10.1007/BF00337002. [DOI] [PubMed] [Google Scholar]


