

Abstract
In the present study, we investigated changes in regional cerebral blood flow (rCBF) in humans during the progression from relaxed wakefulness through slow wave sleep (SWS). These changes were examined as a function of spindle (12–15 Hz) and δ (1.5–4.0 Hz) electroencephalographic (EEG) activity of SWS. rCBF was studied with positron emission tomography (PET) using the H215O bolus method. A maximum of six 60 sec scans were performed per subject during periods of wakefulness and stages 1–4 of SWS, as determined by on-line EEG monitoring. Spectral analysis was performed off-line on the EEG epochs corresponding to the scans for computation of activity in specific frequency bands. The relationship between EEG frequency band activity and normalized rCBF was determined by means of a voxel-by-voxel analysis of covariance. δ activity covaried negatively with rCBF most markedly in the thalamus and also in the brainstem reticular formation, cerebellum, anterior cingulate, and orbitofrontal cortex. After the effect of δ was removed, a significant negative covariation between spindle activity and the residual rCBF was evident in the medial thalamus. These negative covariations may reflect the disfacilitation and active inhibition of thalamocortical relay neurons in association with δ and spindles, as well as the neural substrates underlying the progressive attenuation of sensory awareness, motor responsiveness, and arousal that occur during SWS. δ activity covaried positively with rCBF in the visual and auditory cortex, possibly reflecting processes of dream-like mentation purported to occur during SWS.
Keywords: reticular formation, thalamus, visual cortex, EEG, PET, consciousness
Across the sleep–wake cycle, the brain undergoes fundamental changes in activity that are associated with different levels and states of consciousness. These changes have been studied extensively in nonhuman mammals. During the passage from wakefulness into slow-wave sleep (SWS), neurons in the brainstem reticular activating system, including noradrenergic and cholinergic cells, decrease their firing rate (for review, see Steriade and McCarley, 1990). As a result, thalamic neurons undergo disfacilitation and become slightly hyperpolarized, tending to change their firing mode from single spikes to rhythmic bursts (for review, see Steriade and Deschênes, 1984; Steriade and Llinás, 1988; Steriade and McCarley, 1990; McCormick, 1992). In addition, GABAergic neurons of the thalamic reticular nucleus fire in prolonged bursts, directly hyperpolarizing the thalamocortical cells onto which they project and entraining them into a spindle rhythmicity (12–14 Hz) during stage 2 and a δ rhythmicity (1–4 Hz) during subsequent stages 3–4 SWS (Steriade et al., 1994).
In humans, the importance of the brainstem reticular activating system in the maintenance of wakefulness and cortical activation has been documented in cases of lesions in comatose patients (for review, seePlum and Posner, 1980; Jones, 1994). It is also known that the integrity of thalamocortical circuits is important for the elaboration of spindle and δ electroencephalographic (EEG) activity, which normally characterizes mammalian SWS (Lugaresi et al., 1986;Guilleminault et al., 1993; Weisz et al., 1995; for review, see Jones, 1994). The changes that occur in these systems with natural sleep progression, however, remain to be explored.
Neuroimaging techniques now allow direct assessment of cerebral hemodynamics and metabolism, providing a noninvasive approach to the study of sleep physiology in humans. Global decreases of cerebral blood flow (CBF) (Sakai et al., 1980; Meyer et al., 1987; Madsen, 1991c), oxygen metabolism (Madsen, 1991b,c), and glucose metabolism (Buchsbaum et al., 1989; Maquet et al., 1990, 1992) have been reported during different stages of SWS, as compared with waking. With the use of positron emission tomography (PET), a regional decrease in glucose metabolism in the thalamus was found to be significantly greater than the global decrease (Maquet et al., 1990, 1992). During rapid eye movement (REM) sleep, compared with waking, no significant global changes in CBF and oxygen metabolism (Madsen, 1991c) or glucose metabolism (Buchsbaum et al., 1989; Maquet et al., 1990) have been documented, whereas significant regional increases have been reported in several limbic and cortical areas, including the visual cortex (Buchsbaum et al., 1989; Maquet et al., 1990, 1996; Madsen et al., 1991a).
In this study, we sought further understanding of the neural substrates that underlie the generation and maintenance of SWS and associated EEG activity in normal humans. We thus examined regional CBF (rCBF) changes using PET with the H215O bolus technique in the progression from wake through stages of SWS. Normalized rCBF was correlated with δ and spindle EEG activity using a voxel-by-voxel analysis of covariance.
Preliminary results from this work have been published previously in abstract form (Hofle et al., 1995).
MATERIALS AND METHODS
Subjects and experimental design. Eighteen healthy volunteers (11 males and 7 females; mean age 25.1 years) participated in this study. They were asked to limit their sleep to 4 hr (from 2 to 6 A.M.) the night before the study and thus could be considered slightly sleep-deprived, as has been the case in previous PET studies (Maquet et al., 1990, 1996). Subjects were also instructed not to take any alcohol, coffee, or tea for at least 24 hr before the experiment. The study was approved by the local ethics committee, and subjects gave written informed consent.
Subjects were asked to report to the lab at 7:30 P.M., when they were fitted with electrodes for EEG, electro-oculogram (EOG), and electromyogram (EMG) (see below). In an initial sham study, subjects (n = 18) lay supine in the scanner, and an intravenous catheter was taped to the wrist (not inserted in the vein) for simulation of the PET experiment, including mock bolus injections during sleep. In this way, each subject was allowed to become acquainted with the recording situation before the actual PET study and to withdraw from the study if unable to sleep under the experimental conditions. In the actual PET studies, each subject lay on a bed, with the head restrained in a customized head-holder and an intravenous line in the left antecubital vein.
For data acquisition, ambient lighting was dimmed, and subjects were asked to close their eyes and relax. The EEG/PET studies extended from ∼10 P.M. to 1 A.M. (see Fig. 1B).
Fig. 1.

EEG during wake and sleep stages when scans were performed after H215O injections.A, EEG samples taken from actual scan periods showing typical patterns for each state or stage (wake, stage 2, and stages 3–4 SWS), according to which injections were performed.B, Hypnogram of a typical study, showing scans in one subject during different state–stages of sleep and wake.C, Spectra of EEG epochs (from A) showing typical peaks in α, ς, and δ bands (marked bybars) during each stage, respectively. D, Average frequency band activity ( ± SEM) for α, ς, and δ, respectively, across wake, drowsy, and sleep stages 1 through 4 SWS for all subjects (n = 6) and scans (n = 32). C, D, Values taken from P3 electrode and EEG activity expressed in arbitrary amplitude units; SEM. 22:00, 10 P.M.; 23:00, 11 P.M.; 24:00, midnight; 1:00, 1 A.M.
Eleven volunteers performed satisfactorily in the sham study and proceeded to the actual PET study. A maximum of six rCBF scans were obtained for each subject. Scans were acquired throughout the sleep–wake cycle, with the aim to obtain at least one scan in each of the major sleep–wake state–stages. By visual assessment of the EEG on the computer monitor, the following state–stages were identified (according to Rechtschaffen and Kales, 1968): quiet wakefulness, determined by the presence of α (∼8–12 Hz) in the EEG; stage 2 SWS, characterized by the presence of sleep spindles (∼12–14 Hz); and stages 3–4 SWS, distinguished by a large percentage of δ waves (∼1–4 Hz) (see Fig. 1A). This classification was performed on-line by the investigators, and once a wake state or sleep stage was established, the H215O bolus injection was performed within 2 min.
The analysis presented here was based on data obtained in the six subjects who were able to reach at least stage-2 sleep during the PET study. These subjects were three males and three females, all right-handed, with a mean age of 24.2 years.
EEG recording and analysis. Scalp electrodes were placed over the left hemisphere using the international 10–20 system. EEG was recorded from F3, CZ, P3, and O1 referential to A2. Bipolar recordings of EOG and EMG (from the chin) were obtained. The resistance was <10 kOhm for all electrodes.
GRASS amplifiers were used for polygraphic recording, and the output was sent to a computer equipped with software for on-line digitalization, recording, and display of signals (Rhythm software; Stellate Systems, Montréal, Québec, Canada). Data were stored at a sampling rate of 256 Hz for subsequent off-line spectral analysis (Rhythm software, Stellate Systems). EEG was filtered below 0.3 and above 100 Hz, EOG was filtered below 0.3 and above 30 Hz, and EMG was filtered below 10 and above 100 Hz.
EEG records from PET studies were scored according to standardized criteria (Rechtschaffen and Kales, 1968). Spectra were obtained for each 60 sec scan. Most 60 sec EEG epochs were artifact-free (32 cases); however, EEG and CBF data were eliminated in the two cases in which movement artifacts occurred. Activity (expressed in arbitrary amplitude units) was determined in the 60 sec epochs in the following bands: (1) δ (1.5–4.0 Hz), (2) θ (4.5–8.0 Hz), (3) α (8.5–11.5 Hz), (4) ς (12.0–15.0 Hz), (5) β (18.0–30.0 Hz), and (6) γ (30.5–57.0 Hz). With the spectral analysis used here, EEG activity could not be measured in the recently characterized “slow oscillation” range of <1 Hz (Steriade et al., 1994). For the present analysis, data from P3–A2 leads were used for statistical analysis. A Spearman ranked correlation test was performed between activity in α, ς, and δ bands and sleep–wake stages, to characterize the relationship of each band with sleep progression.
Measurement and localization of rCBF. PET scans were obtained using a Scanditronix PC-2048B 8-ring, 15-slice tomograph, with the 9 cm axial field-of-view covering the brain from approximatelyz = 48 to z = −44 mm. Using the H215O bolus technique (Raichle et al., 1983), counts were measured during a 60 sec scan after a 40 mCi H215O bolus injection. Arterial blood samples were not drawn to minimize disturbances to natural sleep; hence absolute values of CBF were not calculated in this study. Because linear relationship exists between PET counts and CBF, the counts can be used as direct indices of CBF for each scan in the absence of arterial sampling (Herscovitch et al., 1983).
For each subject, high-resolution T1-weighted magnetic resonance images (MRIs) (160 contiguous sagittal slices, 1 mm thick) were obtained from a Philips Gyroscan ACS (1.5T). PET count images were reconstructed with an 18 mm Hanning filter and normalized for differences in global CBF by means of ratio normalization, i.e., the counts at each voxel (three-dimensional image element) were divided by the mean counts calculated across all brain voxels (Fox et al., 1988). All results reported in this paper refer to these normalized, or relative, rCBF values. Finally, the images were co-registered with individual MRIs (Woods et al., 1993) and transformed into a standardized stereotaxic space (Talairach and Tournoux, 1988) by means of an automated feature-matching algorithm (Collins et al., 1994).
Statistical analysis of rCBF and EEG changes. The data set consisted of normalized rCBF obtained in six subjects, scanned five or six times each, yielding a total of 32 rCBF volumes and corresponding EEG data. The relationship between normalized rCBF and absolute EEG activity was assessed by means of analysis of covariance (Sokal and Rohlf, 1981), with subjects as a main effect and EEG activity obtained for each scan as a covariate (for complete analysis description, seePaus et al., 1996). Subject effects were removed, and the parameter of interest was the slope of the rCBF/EEG activity linear regression. At statistic map was calculated that assessed whether the slope of the regression at a given three-dimensional image element (voxel) was significantly different from zero. The size of a voxel was 1.34 × 1.72 × 1.5 mm in x, y, and zdimensions, respectively. The degrees of freedom of the estimate of the SD (ς) were increased by pooling ς across all brain voxels, so that the t statistic distribution was normal and the tvalues were equivalent to Z scores. The presence of significant focal changes was tested by a method based on three-dimensional Gaussian random field theory, which corrects for the multiple comparisons involved in searching across a volume (Worsley et al., 1992). Values equal to or exceeding a criterion oft = 4.5 were deemed statistically significant (p < 0.00001; two-tailed, uncorrected). Correcting for multiple comparisons, a t value of 4.5 yields a false-positive rate of 0.06 in 600 resolution elements (each of which has dimensions of 18 × 18 × 7.7 mm), constituting the scanned volume of the whole brain.
RESULTS
On-line EEG recording allowed determination of sleep stage according to the predominant patterns of α for relaxed wake, spindles for stage 2, and δ for stage 3–4 (Fig.1A). In six subjects, the bolus injections delivered during these EEG patterns and stages (Fig.1B) were performed successfully without arousing them. Six scans were obtained in wake, seven in drowsy, two in stage 1, nine in stage 2, four in stage 3, and four in stage 4 SWS (for a total of 32 scans across six state–stages). Spectral analysis revealed typical peaks of α, ς (spindles), and δ activity in the scanned epochs for relaxed wake, stage 2, and stage 3–4, respectively (Fig.1C). Across scans and subjects, the average frequency band activity varied systematically for α, ς, and δ in the progression from relaxed wake through drowsy and stages 1–4 SWS (across six state–stages) (Fig. 1D). As an indicator of the wake state, α activity (8.5–11.5 Hz) was found to decrease nonsignificantly with sleep as reflected in a negative correlation of α with one (wake) through six (stage 4 SWS) state–stages (r = −0.29, NS) (Fig. 1D). ς band activity (12–15 Hz) increased in the early stages of sleep to be maximal in stage 2 and decreased slightly in stages 3–4 SWS, having an overall positive correlation with state–stage (r = 0.43; p < 0.01). δ activity (1.5–4.0 Hz) increased progressively in the passage from wake through the stages of SWS, reaching its maximum in stage 4 SWS, and having a significant positive correlation with state–stage (r = 0.77;p < 0.01). To examine regional blood flow changes as a function of SWS EEG activity, normalized rCBF was examined first as a function of δ activity and subsequently as a function of ς activity after the effect of δ was removed.
In an analysis of covariance, the largest significant decrease in normalized rCBF as a function of δ was found in the thalamus, centered over the midline-medial thalamus (Table 1, Fig.2). In addition, a significant negative peak was present in the pontomesencephalic tegmentum on the right side (Table 1). Significant negative covariations were also found in the cerebellar hemispheres, the left temporal muscle, and two regions of the cerebral cortex, namely the anterior cingulate and orbitofrontal cortices (Fig.2, Table 1).
Table 1.
Significant changes in rCBF as a function of δ activity
| Structure | Side | Coordinates (mm) | |||
|---|---|---|---|---|---|
| x | y | z | t | ||
| Negative covariations (normalized rCBF decreases) | |||||
| Anterior cingulate cortex (BA 24) | Midline | 0 | 36 | 22 | −5.4 |
| Anterior cingulate cortex (BA 24/32) | Midline | 1 | 42 | −3 | −4.6 |
| Orbitofrontal cortex (BA 11) | Right | 13 | 15 | −21 | −4.4 |
| Medial thalamusa | Midline | 0 | −16 | 6 | −13.6 |
| Pontomesencephalic tegmentum | Right | 5 | −33 | −21 | −4.8 |
| Cerebellar hemisphere (Crus I posterior)b | Left | −32 | −74 | −36 | −8.9 |
| Cerebellar hemisphere (Crus I posterior) | Right | 39 | −62 | −38 | −7.6 |
| Base of pons | Midline | 0 | −33 | −39 | −4.5 |
| Temporalis muscle | Left | −51 | 39 | −27 | −5.5 |
| Positive covariations (normalized rCBF increases) | |||||
| Medial (calcarine/cuneus) occipital cortex (BA 17/18)c | Right | 12 | −80 | 14 | 7.5 |
| Medial (calcarine) occipital cortex (BA 17) | Left | −13 | −73 | 6 | 7.5 |
| Posterior superior temporal gyrus (BA 22) | Left | −54 | −26 | 3 | 6.1 |
| Inferior parietal lobule (BA 40) | Left | −40 | −47 | 22 | 4.9 |
| Pericentral cortex (BA 3/4) | Left | −44 | −11 | 26 | 5.0 |
| Anterior middle temporal gyrus (BA 21) | Left | −40 | −9 | −22 | 4.8 |
| Anterior middle temporal gyrus (BA 21) | Right | 40 | −14 | −28 | 4.5 |
Standard stereotaxic coordinates (Talairach and Tournoux, 1988) are given for the local maxima, as indicated by the highestt statistic, within an area of significant negative (t < −4.5) or positive (t > 4.5) covariation between normalized rCBF and absolute activity in the δ frequency band (1.5–4.0 Hz). x, Distance to right (+) or left (−) of the midsagittal line; y, distance anterior (+) or posterior (−) to the anterior commissure; z, distance above (+) or below (−) the intercommissural line. For cortical locations, Brodmann’s cytoarchitectonic areas are given (BA).aPeak depicted in Figure 2(top).bAccording to Schmahmann et al. (1996).cPeak depicted in Figure 3. rCBF, Regional cerebral blood flow.
Fig. 2.
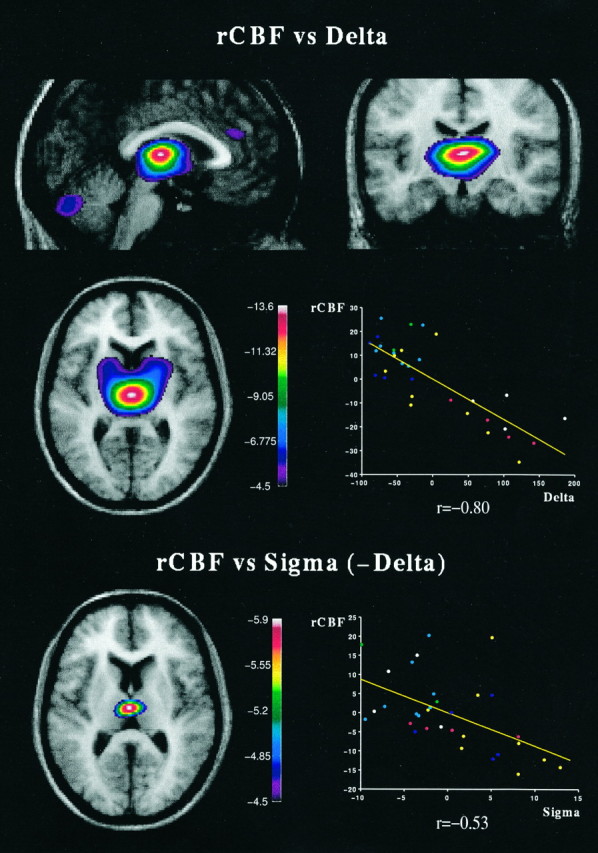
Normalized rCBF decreases as a function of δ and ς (spindle) EEG activity. The merged rCBF/MRIs indicate the location of maximal significant negative covariation between normalized rCBF and δ or ς activity, with the range of t values for the PET data coded by color scale. Top, rCBF versus δ. Maximal significant negative covariation of rCBF as a function of δ activity, centered over the thalamus and shown in the sagittal, coronal, and horizontal planes; also evident, anterior cingulate and cerebellum. Image sections are centered at the following coordinates (Talairach and Tournoux, 1988): x = 0 mm,y = −16 mm, z = 6 mm.Bottom, rCBF versus ς (−δ). Maximal significant negative covariation of rCBF as a function of ς after removing the effect of δ, centered over midline-medial thalamus. Image sections are centered at the following coordinates (Talairach and Tournoux, 1988):x = −1 mm, y = −16 mm,z = 9 mm. The scatterplots shown beside the PET/MRIs illustrate the nature of the covariations by plotting the residuals of normalized rCBF, obtained in the thalamus, against the residuals of absolute δ activity after the effect of subject (top) was removed, or the residuals of absolute ς activity after the effect of subject and δ (bottom) were removed. For this purpose, the rCBF values were extracted from an 8-mm-radius spherical volume-of-interest centered over the medial thalamus. Each point represents one scan/subject, and the line is the linear regression. Dotsin the plot are color-coded: blue = wake,cyan = drowsy, green = stage 1,yellow = stage 2, red = stage 3, white = stage 4. rCBF, Regional cerebral blood flow.
A highly significant positive covariation between normalized rCBF and δ activity was found in several cortical regions, most particularly the visual cortex in both hemispheres (Fig. 3, Table 1). Other maxima of positive covariation were found in the cortex, including the posterior superior temporal gyrus on the left side (Fig.3, Table 1). This locus was centered over the temporal plane (BA 22) and did not appear to include the primary auditory cortex in Heschl’s transverse gyri. Another focus was located near the latter one, in the inferior parietal lobule (supramarginal gyrus, BA 40, Table 1). Other loci of positive covariation were centered over the left central sulcus [BA (3/4)] and bilaterally in the anterior middle temporal gyri (BA 21).
Fig. 3.

Normalized rCBF increases as a function of δ activity. The merged rCBF/MRIs indicate the location of maximal positive significance for normalized rCBF and δ covariation, centered in the primary visual cortex bilaterally, showing also the left secondary auditory cortex (Table 1). Image sections are centered at the following coordinates (Talairach and Tournoux, 1988): x= 11 mm, y = −80 mm, z = 14 mm. Thescatterplot shown beside the images illustrates the nature of the covariation by plotting the residuals of normalized rCBF, obtained in the visual cortex (volume-of-interest,r = 8 mm) against the residuals of absolute δ activity after the effect of subject was removed. See Figure 2 for details. rCBF, Regional cerebral blood flow.
To assess contributions to changes in normalized rCBF by ς (spindles), further regressions were performed to remove (in addition to the subject effect) the activity in the δ frequency band. In this case, the only significant covariation between such residuals of normalized rCBF and ς was localized in the thalamus and restricted to the midline-medial thalamus (Fig. 2B).
The relationship between mean number of non-normalized counts in the entire scanned volume of the brain and δ EEG activity was examined in an attempt to assess possible global changes in brain activity during sleep. This correlation was found to be nonsignificant (r = 0.267; p = 0.14).
DISCUSSION
This study demonstrates a significant decrease in normalized rCBF in several subcortical and cortical regions as a function of EEG δ activity in the progression from waking through SWS. The negative covariation between rCBF and δ was largest in the thalamus, where a significant negative correlation was also found for spindling (ς) after the effect of δ activity was removed, suggesting a marked disfacilitation and inhibition of the thalamus in association with δ activity and spindles of SWS. In contrast to a decrease in some cortical areas, a significant increase in normalized rCBF was found in visual and other cortical regions as a function of δ activity, possibly revealing the cortical substrate of dream-like imagery during SWS.
Methodological considerations
The aim of the present study was to examine regional changes in brain activity as a function of EEG SWS patterns. For this purpose, we analyzed normalized rCBF values based on radioactivity counts, because these values are directly proportional to regional differences that are superimposed on any generalized change in global blood flow. Such values are standardly used in studies of regional activation and have been applied in other sleep–wake studies (Maquet et al., 1996). Moreover, by using normalized values of glucose cerebral metabolic rate (CMRglu), regional changes were found to be superimposed on global CMRglu decreases during SWS (Maquet et al., 1990). Previous studies measuring absolute CBF also reported global decreases in blood flow during SWS (Madsen and Vorstrup, 1991) that were parallel to those reported for glucose metabolism (Maquet et al., 1990, 1992). On the other hand, earlier studies had shown slight increases in global CBF during SWS (Mangold et al., 1955). A recent PET study in humans found no significant change in global CBF (Andersson et al., 1995). In the present study, no significant correlation was found between mean brain counts and δ activity, also suggesting a lack of significant change in global CBF. A lack of change may be the result of the relatively brief duration of SWS episodes that occurred during the PET experiment, and also the sampling in the early part of the night when global blood flow changes seem to be minimal (Hajak et al., 1994). Nevertheless, our results indicate that superimposed on any possible global CBF changes, differential regional changes in CBF occur during SWS that reflect differential regional changes in brain activity during that state.
The present results using analysis of covariance confirmed our preliminary results of significant changes in normalized rCBF between waking, stage 2, and stages 3–4 sleep obtained in the same group of subjects, with the more common subtraction method (Hofle et al., 1995). Because sleep stages are defined by EEG activity, however, and it is this activity that reflects the electrophysiological changes that occur during sleep, rCBF was examined here as a function of δ and spindle wave activity. δ activity varied in a continuous manner across sleep stages and thus was used as the main covariate. ς, reflecting spindling, also varied continuously, but in a different manner from δ, reflecting the maximal occurrence of spindles in the early stages of sleep, and thus was examined after the effect of δ was removed.
Negative covariation of rCBF with δ or ς
Our data show a highly significant decrease in normalized rCBF in the thalamus, as a function of δ activity, and in a more restricted region of the thalamus, as a function of spindling. These results concur with previous PET studies in which significant decreases in normalized rCMRglu had been found in the thalamus, in association with stages 2 and 3–4 of SWS (Maquet et al., 1990, 1992).
There is considerable evidence to suggest that excitatory neurotransmission is associated with increased rCBF, in part through mediation by local nitric oxide release, and thus that increases or decreases in excitatory neurotransmission would be reflected by increases or decreases in rCBF (Knowles et al., 1989; Northington et al., 1992; Iadecola, 1993; Paus et al., 1995; Gjedde, 1997). Decreases in CBF have also been shown as a result of pharmacological stimulation of GABAA receptors, suggesting that inhibitory postsynaptic neurotransmission may be associated with decreases in rCBF (Roland and Friberg, 1988; Roland, 1993; Gjedde, 1997). Hence, the rCBF decrease observed here in the thalamus could reflect the disfacilitation of thalamocortical relay neurons by decreased excitatory input from the brainstem reticular activating system but also the active inhibition from GABAergic thalamic reticularis cells (Steriade et al., 1994).
Neurons of the brainstem reticular activating system have been shown to decrease their firing rate before the onset of SWS in animals (Steriade and McCarley, 1990), changes that might be reflected in the rCBF decreases seen here in the pontomesencephalic tegmentum of humans during SWS. This decrease in excitatory neurotransmission would result in a disfacilitation of the thalamic neurons, particularly the nuclei of the diffuse thalamocortical projection system, onto which neurons of the brainstem reticular formation, including glutamatergic, cholinergic, and noradrenergic neurons, project (Jones and Yang, 1985;Jones, 1995). As a result of this disfacilitation, thalamic neurons would become sufficiently hyperpolarized to change their firing mode from tonic to phasic, as occurs in the transition to SWS (Steriade et al., 1994). Moreover, the thalamic reticularis neurons, which contain GABA (Houser et al., 1980) and project onto thalamic relay neurons, including midline, medial, and intralaminar nuclei of the diffuse thalamocortical projection system (Steriade et al., 1984; Jones, 1985;Velayos et al., 1989), would begin to burst, hyperpolarizing the thalamocortical neurons and entraining them first in a spindle and then δ rhythmicity (von Krosigk et al., 1993; Steriade et al., 1994). Thalamic neurons also oscillate in a slower rhythm with long-lasting hyperpolarizations in association with the “slow oscillation” on the cortex (<1 Hz) (Contreras et al., 1996), a recently described sleep rhythm (Steriade et al., 1994) that was not measured in the present study. In our results, the rCBF correlation with δ (accounting for >50% of the variation in thalamic rCBF) could reflect the progressive hyperpolarization of thalamic neurons that occurs across SWS (Hirsch et al., 1983; Contreras and Steriade, 1995). The additional covariation with spindling (∼35% of the variation in thalamic rCBF), which was localized in the midline-medial thalamus, may reflect the active inhibition of thalamocortical neurons in association with spindling in the early stages of sleep and a focused dampening of the diffuse thalamocortical projection system during sleep initiation. The early inhibition of this system may underlie the loss of consciousness that occurs with SWS.
Changes in normalized rCBF in the cerebellum also correlated negatively with δ activity. This might be a reflection of the decreased muscle tone and proprioception characteristic of sleep and is consistent with the decreased mobility of the sleeping subject. In addition, the present results may suggest dampening during sleep of certain processes involving neocerebellar–neocortical circuits that are important in higher order cognitive processes (Leiner et al., 1993).
Negative covariation of normalized rCBF and δ was seen in frontal regions of the cortex (anterior cingulate and orbitofrontal cortex), which receive the most dense projections from the diffuse thalamocortical projection system together with afferents from the dorsomedial nucleus. The rCBF decrease in the anterior cingulate cortex, whose activity has been previously linked to changes in arousal during waking (Paus et al., 1997), most likely reflects an attenuation of this cortical arousal system during sleep.
Positive covariation of rCBF with δ
Our results show that during SWS, normalized rCBF changes were heterogeneous across different regions of the cerebral cortex. Whereas δ covaried negatively with rCBF in anterior cingulate and orbitofrontal cortex, it covaried positively with rCBF in another set of areas. Thus, δ activity and rCBF covaried positively in primary and adjacent secondary visual cortex, as well as in secondary auditory cortex, suggesting increased regional activity in these areas during SWS as compared with relaxed wakefulness with eyes closed. Regional CBF increases have been reported when awake subjects imagine different objects with their eyes closed (Kosslyn et al., 1995) or imagine sounds in the absence of external auditory stimuli (Zatorre et al., 1996a). In addition to the positive covariations in the left secondary auditory cortex over planum temporale (BA 22), rCBF versus δ positive covariations were also found in the left inferior parietal lobule (BA 40). Regional CBF increases in these areas have been linked with auditory phonological processing (Howard et al., 1992; Zatorre et al., 1992, 1996b; Paulesu et al., 1993). Regional activation in this complex of areas therefore may reflect the occurrence of visual, auditory, and perhaps verbal imagery during SWS.
Although in early studies “dreaming” was reported almost exclusively from REM sleep awakenings (Dement and Kleitman, 1957), “dream” reports have been subsequently obtained from all stages of sleep at rates of ∼50–75% for stages 2–4 SWS, as compared with ∼80–90% for REM sleep (Foulkes, 1962; Tracy and Tracy, 1974;Cavallero et al., 1992). Reports from SWS were slightly less vivid, shorter, and more thought-like than those from REM sleep, yet the majority of non-REM reports involved both “primary visual experience” and “secondary cognitive elaboration” (Foulkes, 1962;Molinari and Foulkes, 1969; Foulkes and Pope, 1973). Because our subjects were not awakened after each scan, the subjective experience of dreaming could not be confirmed; however, our PET results suggest the presence of visual and auditory imagery or processing during SWS.
Conclusions
Thalamic rCBF decreases dramatically as a function of δ and spindle activity, reflecting the disfacilitation and active inhibition of thalamocortical neurons that occur during SWS and possibly underlie the loss of consciousness and sensory awareness characteristic of that state. Despite this closing of the afferent gateway to the cerebral cortex, certain areas, including the visual and secondary auditory cortex, appear relatively more active, thus revealing a possible substrate for dream-like mentation during SWS.
Footnotes
We thank the staff of the McConnell Brain Imaging Centre, the Medical Cyclotron and EEG units of the Montreal Neurological Institute and Hospital, and all of our volunteers for making this work possible. We are grateful to M. Wolforth for help with the figures and to R. Zatorre for comments on this manuscript. This work was supported by Grant SP-30 from the Canadian Medical Research Council and the McDonnell-Pew Program in Cognitive Neuroscience. N.H. is the recipient of a scholarship from BID-CONICIT, Venezuela.
Correspondence should be addressed to Dr. Barbara E. Jones, Complex Neural Systems, Montreal Neurological Institute, 3801 University Street, Montréal, Québec H3A 2B4, Canada.
REFERENCES
- 1.Andersson J, Onoe H, Hetta J, Broman JE, Valind S, Lilja A, Sundin A, Lindström K, Watanabe Y, Långström B. Regional changes in cerebral blood flow during sleep measured by positron emission tomography. J Cereb Blood Flow Metab. 1995;15:S871. doi: 10.1097/00004647-199807000-00001. [DOI] [PubMed] [Google Scholar]
- 2.Buchsbaum M, Gillin JC, Wu J, Hazlett E, Sicotte N, Dupont R. Regional cerebral glucose metabolic rate in human sleep assessed by positron emission tomography. Life Sci. 1989;45:1349–1356. doi: 10.1016/0024-3205(89)90021-0. [DOI] [PubMed] [Google Scholar]
- 3.Cavallero C, Cicogna P, Natale V, Occhionero M, Zito A. Slow wave sleep dreaming. Sleep. 1992;15:562–566. doi: 10.1093/sleep/15.6.562. [DOI] [PubMed] [Google Scholar]
- 4.Collins DL, Neelin P, Peters TM, Evans AC. Automatic 3D intersubject registration of MR volumetric data in standardized Talairach space. J Comput Assist Tomogr. 1994;18:192–205. [PubMed] [Google Scholar]
- 5.Contreras D, Steriade M. Cellular basis of EEG slow rhythms: a study of dynamic corticothalamic relationships. J Neurosci. 1995;15:604–622. doi: 10.1523/JNEUROSCI.15-01-00604.1995. [DOI] [PMC free article] [PubMed] [Google Scholar]
- 6.Contreras D, Timofeev I, Steriade M. Mechanisms of long-lasting hyperpolarizations underlying slow sleep oscillations in cat corticothalamic networks. J Physiol (Lond) 1996;494:251–264. doi: 10.1113/jphysiol.1996.sp021488. [DOI] [PMC free article] [PubMed] [Google Scholar]
- 7.Dement W, Kleitman N. The relation of eye movements during sleep to dream activity: an objective method for the study of dreaming. J Exp Psychol. 1957;53:339–346. doi: 10.1037/h0048189. [DOI] [PubMed] [Google Scholar]
- 8.Foulkes D. Dream reports from different stages of sleep. J Abnorm Soc Psychol. 1962;65:14–25. doi: 10.1037/h0040431. [DOI] [PubMed] [Google Scholar]
- 9.Foulkes D, Pope R. Primary visual experience and secondary cognitive elaboration in stage REM: a modest confirmation and an extension. Percept Mot Skills. 1973;37:107–118. doi: 10.2466/pms.1973.37.1.107. [DOI] [PubMed] [Google Scholar]
- 10.Fox PT, Mintun MA, Reiman EM, Raichle ME. Enhanced detection of focal brain responses using intersubject averaging and change-distribution analysis of subtracted PET images. J Cereb Blood Flow Metab. 1988;8:642–653. doi: 10.1038/jcbfm.1988.111. [DOI] [PubMed] [Google Scholar]
- 11.Gjedde A. The relation between brain function and cerebral flow and metabolism. In: Hunt Batjer H, editor. Cerebrovascular disease. Lippincott-Raven; Philadelphia: 1997. pp. 23–40. [Google Scholar]
- 12.Guilleminault C, Quera-Salva MA, Goldberg M. Pseudo-hypersomnia and pre-sleep behaviour with bilateral paramedian thalamic lesion. Brain. 1993;116:1549–1563. doi: 10.1093/brain/116.6.1549. [DOI] [PubMed] [Google Scholar]
- 13.Hajak G, Klingelhöfer J, Schulz-Varszegi M, Matzander G, Sander D, Conrad B, Rüther E. Relationship between cerebral blood flow velocities and cerebral electrical activity in sleep. Sleep. 1994;17:11–19. doi: 10.1093/sleep/17.1.11. [DOI] [PubMed] [Google Scholar]
- 14.Herscovitch P, Markham J, Raichle ME. Brain blood flow measured with intravenous H2(15)O. I. Theory and error analysis. J Nucl Med. 1983;24:782–789. [PubMed] [Google Scholar]
- 15.Hirsch JC, Fourment A, Marc ME. Sleep-related variations of membrane potential in the lateral geniculate body relay neurons of the cat. Brain Res. 1983;259:308–312. doi: 10.1016/0006-8993(83)91264-7. [DOI] [PubMed] [Google Scholar]
- 16.Hofle N, Reutens D, Fiset P, Alonso A, Gotman J, Evans AC, Jones BE. Regional cerebral blood flow changes during different stages of sleep in humans studied by positron emission tomography. Soc Neurosci Abstr. 1995;21:1495. [Google Scholar]
- 17.Houser C, Vaughn J, Barber R, Roberts E. GABA neurons are the major cell type of the nucleus reticularis thalami. Brain Res. 1980;200:341–354. doi: 10.1016/0006-8993(80)90925-7. [DOI] [PubMed] [Google Scholar]
- 18.Howard D, Patterson K, Wise R, Brown D, Friston K, Weiller C, Frackowiak RSJ. The cortical localization of the lexicons, positron emission tomography evidence. Brain. 1992;115:1769–1782. doi: 10.1093/brain/115.6.1769. [DOI] [PubMed] [Google Scholar]
- 19.Iadecola C. Regulation of the cerebral microcirculation during neural activity: is nitric oxide the missing link? Trends Neurosci. 1993;16:206–214. doi: 10.1016/0166-2236(93)90156-g. [DOI] [PubMed] [Google Scholar]
- 20.Jones BE. Basic mechanisms of sleep-wake states. In: Kryger M, Roth T, Dement W, editors. Principles and practice of sleep medicine. Saunders; Philadelphia: 1994. pp. 145–162. [Google Scholar]
- 21.Jones BE. Reticular formation. Cytoarchitecture, transmitters and projections. In: Paxinos G, editor. The rat nervous system. Academic Press Australia; New South Wales: 1995. pp. 155–171. [Google Scholar]
- 22.Jones BE, Yang T-Z. The efferent projections from the reticular formation and the locus coeruleus studied by anterograde and retrograde axonal transport in the rat. J Comp Neurol. 1985;242:56–92. doi: 10.1002/cne.902420105. [DOI] [PubMed] [Google Scholar]
- 23.Jones EG. The thalamus. Plenum; New York: 1985. [Google Scholar]
- 24.Knowles RG, Palacios M, Palmer RMJ, Moncada S. Formation of nitric oxide from l-arginine in the central nervous system: a transduction mechanism for stimulation of the soluble guanylate cyclase. Proc Natl Acad Sci USA. 1989;86:5159–5162. doi: 10.1073/pnas.86.13.5159. [DOI] [PMC free article] [PubMed] [Google Scholar]
- 25.Kosslyn S, Thompson W, Kim I, Alpert N. Topographical representations of mental images in primary visual cortex. Nature. 1995;378:496–498. doi: 10.1038/378496a0. [DOI] [PubMed] [Google Scholar]
- 26.Leiner HC, Leiner AL, Dow RS. Cognitive and language functions of the human cerebellum. Trends Neurosci. 1993;16:444–447. doi: 10.1016/0166-2236(93)90072-t. [DOI] [PubMed] [Google Scholar]
- 27.Lugaresi E, Medori R, Montagna P, Baruzzi A, Cortelli P, Lugaresi A, Tinuper P, Zucconi M, Gambetti P. Fatal familial insomnia and dysautonomia with selective degeneration of thalamic nuclei. New Engl J Med. 1986;315:997–1003. doi: 10.1056/NEJM198610163151605. [DOI] [PubMed] [Google Scholar]
- 28.Madsen PL, Vorstrup S. Cerebral blood flow and metabolism during sleep. Cerebrovasc Brain Metab Rev. 1991;3:281–296. [PubMed] [Google Scholar]
- 29.Madsen PL, Holm S, Vorstrup S, Friberg L, Lassen NA, Wildschiødtz G. Human regional cerebral blood flow during rapid-eye-movement sleep. J Cereb Blood Flow Metab. 1991a;11:502–507. doi: 10.1038/jcbfm.1991.94. [DOI] [PubMed] [Google Scholar]
- 30.Madsen PL, Schmidt JF, Holm S, Vorstrup S, Lassen NA, Wildschiødtz G. Cerebral oxygen metabolism and cerebral blood flow in man during light sleep (stage 2). Brain Res. 1991b;557:217–220. doi: 10.1016/0006-8993(91)90137-k. [DOI] [PubMed] [Google Scholar]
- 31.Madsen PL, Schmidt JF, Wildschiødtz G, Friberg L, Holm S, Vorstrup S, Lassen NA. Cerebral O2 metabolism and cerebral blood flow in humans during deep and rapid-eye-movement sleep. J Appl Physiol. 1991c;70:2597–2601. doi: 10.1152/jappl.1991.70.6.2597. [DOI] [PubMed] [Google Scholar]
- 32.Mangold R, Sokoloff L, Conner E, Kleinerman J, Therman P, Kety S. The effects of sleep and lack of sleep on the cerebral circulation and metabolism of normal young men. J Clin Invest. 1955;34:1092–1100. doi: 10.1172/JCI103158. [DOI] [PMC free article] [PubMed] [Google Scholar]
- 33.Maquet P, Dive D, Salmon E, Sadzot B, Franco G, Poirrier R, von Frenckell R, Franck G. Cerebral glucose utilization during sleep-wake cycle in man determined by positron emission tomography and [18F]2-fluoro-2-deoxy-d-glucose method. Brain Res. 1990;513:136–143. doi: 10.1016/0006-8993(90)91099-3. [DOI] [PubMed] [Google Scholar]
- 34.Maquet P, Dive D, Salmon E, Sadzot B, Franco G, Poirrier R, Franck G. Cerebral glucose utilization during stage 2 sleep in man. Brain Res. 1992;571:149–153. doi: 10.1016/0006-8993(92)90522-b. [DOI] [PubMed] [Google Scholar]
- 35.Maquet P, Péters J-M, Aerts J, Delfiore G, Degueldre C, Luxen A, Franck G. Functional neuroanatomy of human rapid-eye-movement sleep and dreaming. Nature. 1996;383:163–166. doi: 10.1038/383163a0. [DOI] [PubMed] [Google Scholar]
- 36.McCormick D. Neurotransmitter actions in the thalamus and cerebral cortex and their role in neuromodulation of thalamocortical activity. Prog Neurobiol. 1992;39:337–388. doi: 10.1016/0301-0082(92)90012-4. [DOI] [PubMed] [Google Scholar]
- 37.Meyer JS, Ishikawa Y, Hata T, Karacan I. Cerebral blood flow in normal and abnormal sleep and dreaming. Brain Cogn. 1987;6:266–294. doi: 10.1016/0278-2626(87)90127-8. [DOI] [PubMed] [Google Scholar]
- 38.Molinari S, Foulkes D. Tonic and phasic events during sleep: psychological correlates and implications. Percept Mot Skills. 1969;29:343–368. doi: 10.2466/pms.1969.29.2.343. [DOI] [PubMed] [Google Scholar]
- 39.Northington FJ, Matherne GP, Berne RM. Competitive inhibition of nitric oxide synthase prevents the cortical hyperemia associated with peripheral nerve stimulation. Proc Natl Acad Sci USA. 1992;89:6649–6652. doi: 10.1073/pnas.89.14.6649. [DOI] [PMC free article] [PubMed] [Google Scholar]
- 40.Paulesu E, Frith C, Frackowiak RSJ. The neural correlates of the verbal component of working memory. Nature. 1993;362:342–345. doi: 10.1038/362342a0. [DOI] [PubMed] [Google Scholar]
- 41.Paus T, Marrett S, Worsley KJ, Evans AC. Extraretinal modulation of cerebral blood flow in the human visual cortex: implications for saccadic suppression. J Neurophysiol. 1995;74:2179–2183. doi: 10.1152/jn.1995.74.5.2179. [DOI] [PubMed] [Google Scholar]
- 42.Paus T, Perry D, Zatorre R, Worsley KJ, Evans AC. Modulation of cerebral blood flow in the human auditory cortex during speech: role of motor-to-sensory discharges. Eur J Neurosci. 1996;8:2236–2246. doi: 10.1111/j.1460-9568.1996.tb01187.x. [DOI] [PubMed] [Google Scholar]
- 43.Paus T, Zatorre R, Hofle N, Caramanos Z, Gotman J, Petrides M, Evans AC. Time-related changes in neural systems underlying attention and arousal during the performance of an auditory vigilance task. J Cogn Neurosci. 1997;9:392–408. doi: 10.1162/jocn.1997.9.3.392. [DOI] [PubMed] [Google Scholar]
- 44.Plum F, Posner J. The diagnosis of stupor and coma. Davis; Philadelphia: 1980. [Google Scholar]
- 45.Raichle M, Martin W, Herscovitch P, Mintun M, Markham J. Brain blood flow measured with intravenous H215O. II. Implementation and validation. J Nucl Med. 1983;24:790–798. [PubMed] [Google Scholar]
- 46.Rechtschaffen A, Kales A. A manual of standardized terminology, techniques and scoring system for sleep stages of human subjects. Brain Information Service/Brain Research Institute; UCLA, Los Angeles: 1968. [Google Scholar]
- 47.Roland PE. Brain activation. Wiley; New York: 1993. [Google Scholar]
- 48.Roland P, Friberg L. The effect of the GABA-A agonist THIP on regional cortical blood flow in humans: a new test of hemispheric dominance. J Cereb Blood Flow Metab. 1988;8:314–323. doi: 10.1038/jcbfm.1988.66. [DOI] [PubMed] [Google Scholar]
- 49.Sakai F, Meyer JS, Karacan I, Derman S, Yamamoto M. Normal human sleep: regional cerebral hemodynamics. Ann Neurol. 1980;7:471–478. doi: 10.1002/ana.410070514. [DOI] [PubMed] [Google Scholar]
- 50.Schmahmann J, Doyon J, Holmes C, Makris N, Petrides M, Kennedy D, Evans AC. An MRI atlas of the human cerebellum in Talairach space. NeuroImage. 1996;3:S122. doi: 10.1006/nimg.1999.0459. [DOI] [PubMed] [Google Scholar]
- 51.Sokal RR, Rohlf FJ. Biometry, 2nd Ed. Freeman; San Francisco: 1981. [Google Scholar]
- 52.Steriade M, Deschěnes M. The thalamus as a neuronal oscillator. Brain Res Rev. 1984;8:1–63. doi: 10.1016/0165-0173(84)90017-1. [DOI] [PubMed] [Google Scholar]
- 53.Steriade M, Llinás R. The functional state of the thalamus and the associated neuronal interplay. Physiol Rev. 1988;68:649–749. doi: 10.1152/physrev.1988.68.3.649. [DOI] [PubMed] [Google Scholar]
- 54.Steriade M, McCarley R. Brainstem control of wakefulness and sleep. Plenum; New York: 1990. [Google Scholar]
- 55.Steriade M, Parent A, Hada J. Thalamic projections of nucleus reticularis thalami of cat: a study using retrograde transport of horseradish peroxidase and fluorescent tracers. J Comp Neurol. 1984;229:531–547. doi: 10.1002/cne.902290407. [DOI] [PubMed] [Google Scholar]
- 56.Steriade M, Contreras D, Amzica F. Synchronized sleep oscillations and their paroxysmal developments. Trends Neurosci. 1994;17:199–208. doi: 10.1016/0166-2236(94)90105-8. [DOI] [PubMed] [Google Scholar]
- 57.Talairach J, Tournoux P. Co-planar stereotactic atlas of the human brain. Thieme; New York: 1988. [Google Scholar]
- 58.Tracy R, Tracy L. Reports of mental activity from sleep stages 2 and 4. Percept Mot Skills. 1974;38:647–648. doi: 10.2466/pms.1974.38.2.647. [DOI] [PubMed] [Google Scholar]
- 59.Velayos J, Jiménez-Castellanos J, Reinoso-Suárez F. Topographical organization of the projections from the reticular thalamic nucleus to the intralaminar and medial thalamic nuclei in the cat. J Comp Neurol. 1989;279:457–469. doi: 10.1002/cne.902790310. [DOI] [PubMed] [Google Scholar]
- 60.Von Krosigk M, Bal T, McCormick DA. Cellular mechanisms of a synchronized oscillation in the thalamus. Science. 1993;261:361–364. doi: 10.1126/science.8392750. [DOI] [PubMed] [Google Scholar]
- 61.Weisz J, Soroker N, Oksenberg A, Myslobodsky M. Effects of hemi-thalamic damage on K-complexes evoked by monaural stimuli during midafternoon sleep. Electroencephalogr Clin Neurophysiol. 1995;94:148–150. doi: 10.1016/0013-4694(94)00328-i. [DOI] [PubMed] [Google Scholar]
- 62.Woods RP, Mazziotta JC, Cherry SR. MRI-PET registration with automated algorithm. J Comput Assist Tomogr. 1993;17:536–546. doi: 10.1097/00004728-199307000-00004. [DOI] [PubMed] [Google Scholar]
- 63.Worsley KJ, Evans AC, Marrett S, Neelin P. Determining the number of statistically significant areas of activation in subtracted activation studies from PET. J Cereb Blood Flow Metab. 1992;12:900–918. doi: 10.1038/jcbfm.1992.127. [DOI] [PubMed] [Google Scholar]
- 64.Zatorre RJ, Evans AC, Meyer E, Gjedde A. Lateralization of phonetic and pitch processing in speech perception. Science. 1992;256:846–849. doi: 10.1126/science.1589767. [DOI] [PubMed] [Google Scholar]
- 65.Zatorre RJ, Halpern AR, Perry DW, Meyer E, Evans AC. Hearing in the mind’s ear: a PET investigation of musical imagery and perception. J Cogn Neurosci. 1996a;8:29–46. doi: 10.1162/jocn.1996.8.1.29. [DOI] [PubMed] [Google Scholar]
- 66.Zatorre RJ, Meyer E, Gjedde A, Evans AC. PET studies of phonetic processing of speech: review, reapplication and reanalysis. Cereb Cortex. 1996b;6:21–30. doi: 10.1093/cercor/6.1.21. [DOI] [PubMed] [Google Scholar]