

Abstract
Two G-protein-coupled receptors for the tridecapeptide neurotensin (NT) have been identified and cloned in mammalian brain: a high-affinity (Kd = 0.3 nm) receptor, sensitive to the antagonist SR 48692 but insensitive to levocabastine, and a lower-affinity (Kd = 2–4 nm) receptor, sensitive to levocabastine but with poor affinity for SR 48692. Although there is good evidence that the high-affinity site is predominantly expressed in neurons, little is known of the cellular localization of the low-affinity receptor. In the present study, we identify by confocal microscopy selective levocabastine-sensitive, SR 48692-resistant binding of a fluorescent derivative of NT (fluo-NT) to a subpopulation of glial fibrillary acidic protein-immunoreactive glial cells grown in culture from the midbrain and cerebral cortex of embryonic and neonatal rats, respectively. We also demonstrate, by combining fluo-NT detection with tyrosine hydroxylase immunofluorescence, that these glial binding sites are differentially regulated from the SR 48692-sensitive NT receptor expressed in the same cultures by mesencephalic dopamine neurons. Whereas the latter undergoes rapid ligand-induced internalization followed by centripetal mobilization of ligand-receptor complexes from processes to perikarya and from perikaryal periphery to cell center, the former induces the formation of cell-surface clusters that fail to internalize. It is concluded that NT may exert its effects on both neurons and astrocytes in the CNS. Whereas NT neural signaling is exerted through high-affinity receptors and may be partly effected through internalization of receptor-ligand complexes, glial signaling is exerted through low-affinity NT receptors and appears to be transduced exclusively at the level of the plasma membrane.
Keywords: confocal microscopy, immunohistochemistry, tyrosine hydroxylase, dopamine, glial fibrillary acid protein, endocytosis, midbrain
A large body of evidence supports the notion that neurotensin (NT), a tridecapeptide originally isolated and characterized by Carraway and Leeman (1973), exerts widespread neuromodulatory effects in the mammalian CNS (for review, see Kitabgi et al., 1985).
Two classes of specific NT binding sites have been described in rat brain: a high-affinity component, originally regarded as the sole functional NT receptor, and a low-affinity binding site, originally referred to as an “acceptor” site (Schotte et al., 1986). The low-affinity site may be differentiated from its high-affinity counterpart by its sensitivity to levocabastine, a nonpeptide histamine antagonist (Schotte et al., 1986; Kitabgi et al., 1987). Both high- and low-affinity NT receptors have been cloned recently, and theirKd values for NT have been calculated to be in the hundred picomolar and nanomolar range, respectively (Tanaka et al., 1990; Chalon et al., 1996; Mazella et al., 1996). Although the high-affinity NT receptor seems to be mainly if not exclusively neuronal, studies on the ontogeny of the low-affinity binding sites led to the concept that they might be associated with glial cells (Schotte and Laduron, 1987), an interpretation supported by their increase in density after kainic acid lesions (Schotte et al., 1988). Recentin situ hybridization studies, however, suggest that low-affinity NT receptors may also be expressed by neuronal cells (Mazella et al., 1996).
Several lines of evidence have indicated that the interaction of NT with its high-affinity receptor is followed by ligand-induced internalization of peptide-receptor complexes (for review, see Beaudet et al., 1994). Biochemical and autoradiographic studies in primary neurons or neuronal cell lines in culture have demonstrated that this internalization process is both time- and temperature-dependent and is sensitive to endocytosis blockers such as phenylarsine oxide (Mazella et al., 1991; Chabry et al., 1993; Faure et al., 1995b). Recent studies in our laboratory, using a fluorescent derivative of NT, have demonstrated that this process is also operational in brain slices from cholinergic and dopaminergic areas of the basal forebrain and ventral midbrain, respectively (Faure et al., 1995a,c). In each of these areas, the internalization was shown to proceed from both the perikaryon and dendritic arborizations of neurons and the internalized ligand to be transported centripetally toward the perinuclear region (Faure et al., 1995a,c). Whether low-affinity NT receptors similarly undergo ligand-induced internalization is unknown.
In the present study, we used primary neuronal and glial cultures to characterize the binding and internalization profiles of NT in these two CNS cell types. Mixed neuronal and glial cultures were taken from embryonic rat mesencephalon, because it has been documented that this region contains high concentrations of both high- and low-affinity NT binding components in the adult (Szigethy and Beaudet, 1989) and during development (Schotte and Laduron, 1987; Palacios et al., 1988; Schotte et al., 1988). Furthermore, high-affinity NT receptors in this area have been shown to be selectively associated with dopaminergic (DA) neurons in both rodent and primate brain (Palacios and Kuhar, 1982;Sadoul et al., 1984; Quirion et al., 1987; Szigethy and Beaudet, 1989). In keeping with these results, rat embryonic DA neurons were found to be enriched with functional NT receptors in primary cell cultures from the rat midbrain (Chabry et al., 1990; Dana et al., 1991; Brouard et al., 1992). Pure glial cultures were taken from the neocortex of neonatal animals, because this region was reported to express among the highest levels of low-affinity NT receptors in the adult rat brain (Chalon et al., 1996; Mazella et al., 1996).
MATERIALS AND METHODS
Mesencephalic mixed neuronal and glial cultures.Mesencephalic cells were cultured from embryonic day 16 Sprague Dawley rats as described (Chabry et al., 1990; Dana et al., 1991; Alonso et al., 1993). Briefly, the mesencephalic tegmentum was dissected in serum-free medium consisting of DMEM supplemented with 20 mm KCl, 110 mg/ml sodium pyruvate, 2 mmglutamine, 100 μl/100 ml penicillin/streptomycin, and 50 μl/100 ml fungizone. The cells were dispersed mechanically by repeated gentle pipetting through a Pasteur pipette in the same medium. The cells were then diluted at a concentration of 0.5 × 10⁶ cells per well in DMEM medium complemented with 10% fetal calf serum (Harlan Products, Indianapolis, IN) and plated on polylysine-pretreated glass slides (25 μg/ml; 1 hr at room temperature) in 12 mm dishes. Cells were grown in a humidified atmosphere of 5% CO2/95% air. Cells were used for experiments after 6–7 d in culture, at which time they were totally differentiated (Chabry et al., 1990; Dana et al., 1991). All chemicals used for culture were purchased from Life Technologies (Burlington, Ontario, Canada).
Glial cell cultures. Glial cells were cultured from cerebral cortex of newborn rats as described by Gallo et al., (1995). Briefly, rat pups were killed by decapitation, brains were removed, and cortices were gently dissected out. Pieces of frontal cortex were passed through a sterile nylon filter (70 μm pore size) in DMEM containing 4.5 g/l glucose, 1 ml/100 ml penicillin/streptomycin, and 10% fetal calf serum. Dissociated cells were seeded into petri dishes at an initial plating density of 150,000 cells/12 mm dishes. Cells were grown in a humidified atmosphere of 5% CO2/95% air; the medium was changed every 4 d, and cells were used for experiments after 15 d in culture.
Fluo-NT binding and internalization in mixed neuronal/glial cultures. All studies were performed in Earle’s buffer, pH 7.4, containing 140 mm NaCl, 5 mm KCl, 1.8 mm CaCl2, 3.6 mm MgCl2, 0.1% bovine serum albumin, 0.01% glucose, and 0.8 mm1–10 phenanthroline, using either Nα-fluoresceinyl-NT(2–13) or Nα-Bodipy-NT(2–13) as fluorescent ligands. These fluorescent ligands, generically referred to here as fluo-NT, were synthesized and purified as described (Faure et al., 1995a) by Dr. J.-P. Vincent (Université de Nice, France). The pharmacological properties of these fluorescent ligands as well as of their parent compound Nα-FTC-[Glu1]NT have been characterized extensively elsewhere (Faure et al., 1994, 1995a).
In a first set of experiments, cells were rinsed for 10 min in Earle’s buffer at 4°C and incubated with 20 nm fluo-NT at 4°C in the same buffer for 60 min. To determine the specificity of fluo-NT binding, additional cells were labeled in the presence of a 1 μm solution of nonfluorescent NT. In some cases, cells were preincubated for 10 min with 10 μm of the endocytosis inhibitor phenylarsine oxide (PAO) or 1 μm of the antagonist SR 48692 (kindly provided by Sanofi, Toulouse, France), and the incubation was carried out in the presence of the same concentration of drug. At the end of incubation, cells were either rinsed in cold buffer or subjected to a hypertonic acid buffer wash (0.2 m acetic acid solution containing 0.5 mNaCl in Earle’s buffer, pH 4), air-dried, mounted on glass slides with Aquamount, and examined using confocal microscopy.
In a second set of experiments, cells were incubated with identical concentrations of fluo-NT, but incubations were carried out at 37°C in the presence or absence of 1 μm levocabastine (kindly provided by Janssen Research, Beerse, Belgium) to differentiate high- from low-affinity NT binding sites (Schotte et al., 1986). After 60 min of incubation, cells were rinsed with ice-cold buffer or subjected to a hypertonic acid buffer wash before they were air-dried. Controls for nonspecific labeling were carried out by adding 1 μmnonfluorescent NT. Pharmacological controls included preincubation followed by incubation with either SR 48692 or PAO, as described above. In some cases, incubated cells were fixed with 4% paraformaldehyde in 0.1 m PO4 buffer for 20 min, rinsed in Tris-buffered saline (TBS), and processed for tyrosine hydroxylase (TH) immunostaining, as described below.
In a third set of experiments, cells were first loaded for 3 min at 37°C with 10 nm fluo-NT in the presence of 1 μm levocabastine (to exclude labeling of low-affinity sites) and with or without 1 μm nonfluorescent NT (to assess nonspecific binding). They were then incubated for an additional 5–90 min at 37°C in Earle’s buffer. At the end of incubation, cells were fixed with 4% paraformaldehyde for 20 min, rinsed in TBS, and mounted on glass slides with Aquamount for confocal microscopic examination.
To confirm that the ligand internalized together with its receptor, cells were incubated for 45 min at 4°C with 20 nm of a photoreactive derivative of Nα-fluoresceinyl-NT(2–13); α2-fluoresceinyl, E6-azido-nitro-NT(2–13) (provided by Dr. J.-P. Vincent). At the end of incubation, cells were subjected or not to three consecutive photographic flashes to cross-link the bound ligand to its receptor as described (Faure et al., 1995a). The cells were then rinsed in ice-cold buffer and placed for an additional 5–120 min at 37°C in the same buffer. They were finally washed in cold buffer, fixed for 20 min with 4% paraformaldehyde in 0.1 m PO4 buffer, dehydrated in 70% alcohol, and mounted on glass slides with Aquamount for confocal microscopic viewing.
Fluo-NT binding and internalization in pure glial cultures.After a 10 min rinse in Earle’s buffer, glial cells were incubated with 20 nm of fluo-NT at either 4° or 37°C in the same buffer for 60 min. To assess labeling specificity, some of the incubations were carried out in the presence of 1 μmnonfluorescent NT. To determine the pharmacological subtype of the receptor present on glial cells, they were preincubated with 1 μm levocabastine or SR 48692 and incubated as above. After incubation, cells were rinsed in cold buffer or subjected to a hypertonic acid wash and air-dried. In some cases, cells were then fixed with 4% paraformaldehyde in 0.1 m PO4buffer during a period of 20 min, rinsed in TBS, and processed for glial fibrillary acidic protein (GFAP) immunostaining as detailed below. In some experiments, cells were preincubated for 10 min at 37°C with 10 μm PAO, and the incubation was carried out in the presence of the same concentration of drug.
Immunohistochemistry. Cells were immunostained for either TH or GFAP by sequential incubation in (1) 0.1 m TBS (2 × 10 min), (2) TBS containing 0.1% Triton X-100 (30 min), and (3) a 1:750 dilution of a rabbit polyclonal TH antibody (Incstar Corporation, Stillwater, MN) or a 1:3000 dilution of a rabbit GFAP antibody (Dakopatts, DK-2600 Glostrup, Denmark) in TBS containing 0.1% Triton X-100 (overnight at 4°C). Cells were then rinsed 2 × 5 min in TBS, and the primary antibody was revealed with a Texas Red-conjugated goat anti-rabbit antibody (Jackson ImmunoResearch, Westgrove, PA) diluted 1:100 in TBS (60 min) for confocal microscopic analysis or with a 1:200 dilution of biotinylated goat anti-rabbit IgG (Jackson) (30 min) followed by (1) TBS (3 × 10 min), (2) avidin–biotinylated–peroxidase complex (ABC, Vector, Dimension Laboratories, Mississauga, Ontario, Canada) (45 min), and (3) TBS (3 × 5 min). Visualization was achieved by reaction with 0.1m Tris buffer containing 0.05% 3,3′ diaminobenzidine and 0.01% H2O2. Sections were dehydrated in graded ethanols, mounted with Permount, and examined with a Leica Aristoplan microscope (Leica, St. Laurent, Quebec, Canada) under Nomarski illumination.
Confocal microscopy. Labeled cells were examined with a Leica confocal laser scanning microscope (CLSM) configured with a Leica Diaplan inverted microscope equipped with an argon/krypton laser with an output power of 2–50 mV and a VME bus MC 68020/68881 computer system coupled to an optical disk for image storage. All image generating and processing operations were performed with the Leica CLSM software package. Micrographs were taken from the image monitor using a Focus Imagecorder (Foster City, CA).
Transcellular optical sections were acquired using 32 scans/frame. For all acquisitions, gain and black levels were set manually to optimize the dynamic range of the image while ensuring that no region was completely suppressed (intensity = 0) or completely saturated (intensity = 255). For double-labeling studies, double fluorescence images were simultaneously acquired in two different channels, one for fluorescein and the other for Texas Red.
Quantitative data were obtained from pulse–chase experiments. The mean number of fluorescent particles per perikaryal profile, their mean surface area, and the mean distance separating them from the cell center were measured using the software provided by Leica. Results were expressed as the mean ± SEM of measurements in 12 labeled cells from three experiments. Statistical analyses were performed using a one-way ANOVA, followed by regression curve analysis.
RESULTS
Phenotypic characterization of cultured mesencephalic cells
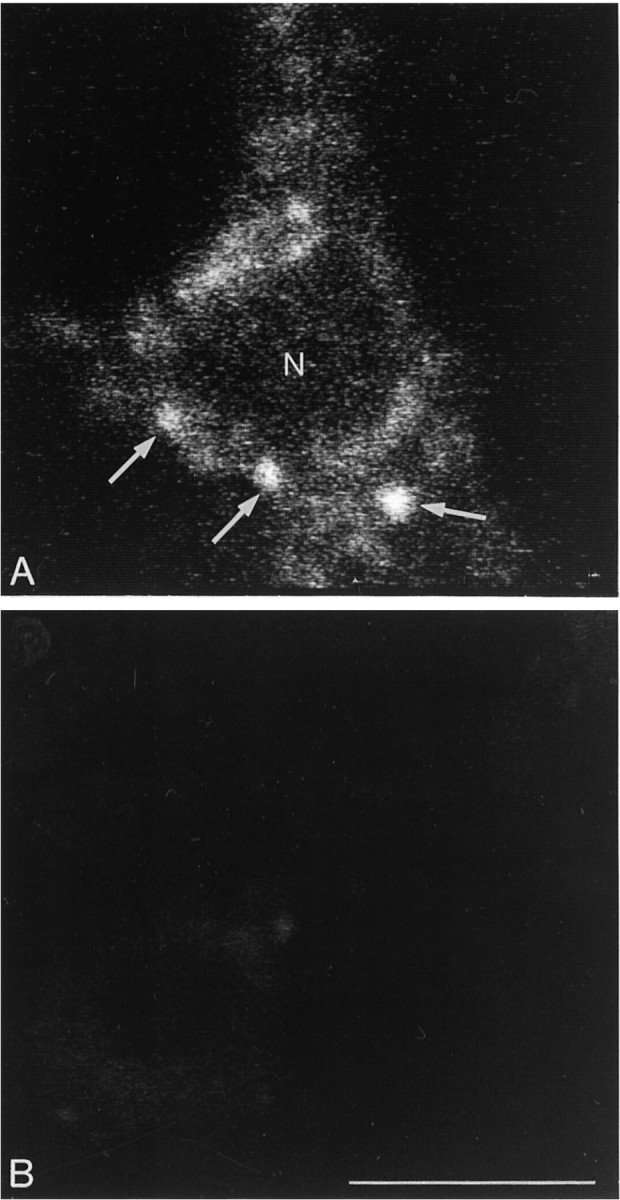
Immunohistochemical characterization of cells present in mesencephalic cultures 7 d after plating revealed that 25–30% corresponded to astrocytes on the basis of GFAP immunopositivity. The vast majority of remaining cells had the morphological appearance of neurons. Of these, ∼15% stained positively for TH (Fig.1A). By contrast, 100% of cells in pure glial cultures were GFAP immunopositive and thereby taken to be exclusively astrocytic in nature (Fig. 1B).
Fig. 1.
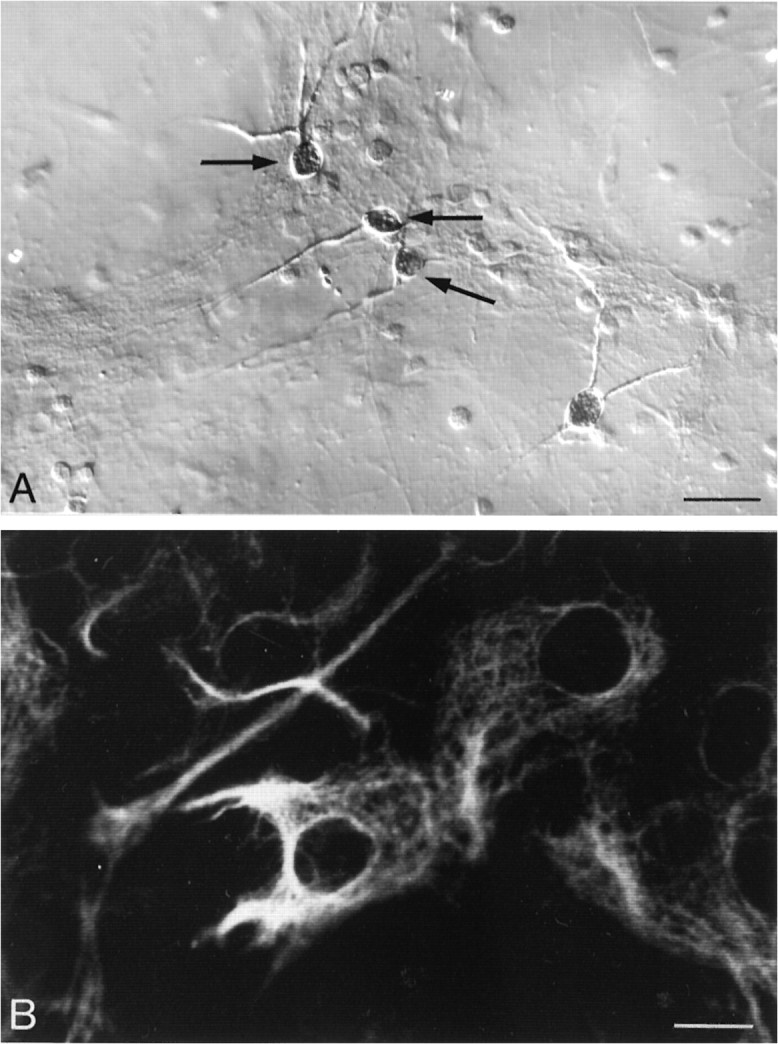
Immunoperoxidase detection of TH-containing cells in mixed cultures (A) and immunofluorescence detection of GFAP-containing cells in pure glial cultures (B). A, Approximately 15% of neurons stain positively for TH in mixed cultures (arrows) (Normaski illumination). Scale bar, 100 μm. B, Glial cells in pure glial culture all stain positively for GFAP (confocal microscopic optical section). Scale bar, 10 μm.
Binding and internalization of fluo-NT in neurons grown in mixed culture
Prolonged incubations (60 min)
In mixed cultures incubated for 60 min with 20 nmfluo-NT at either 4° or 37°C, between 10 and 15% of neuronal cells exhibited intense fluo-NT labeling. This neuronal labeling was no longer observed when the incubation was performed in the presence of 1 μm nonfluorescent NT or with 1 μm of the high-affinity NT receptor agonist SR 48692 but remained unaffected by the addition of the low-affinity receptor ligand levocabastine (not shown). Co-immunostaining for TH revealed that 85% of TH-immunopositive neurons had specifically bound fluo-NT (Fig.2).
Fig. 2.
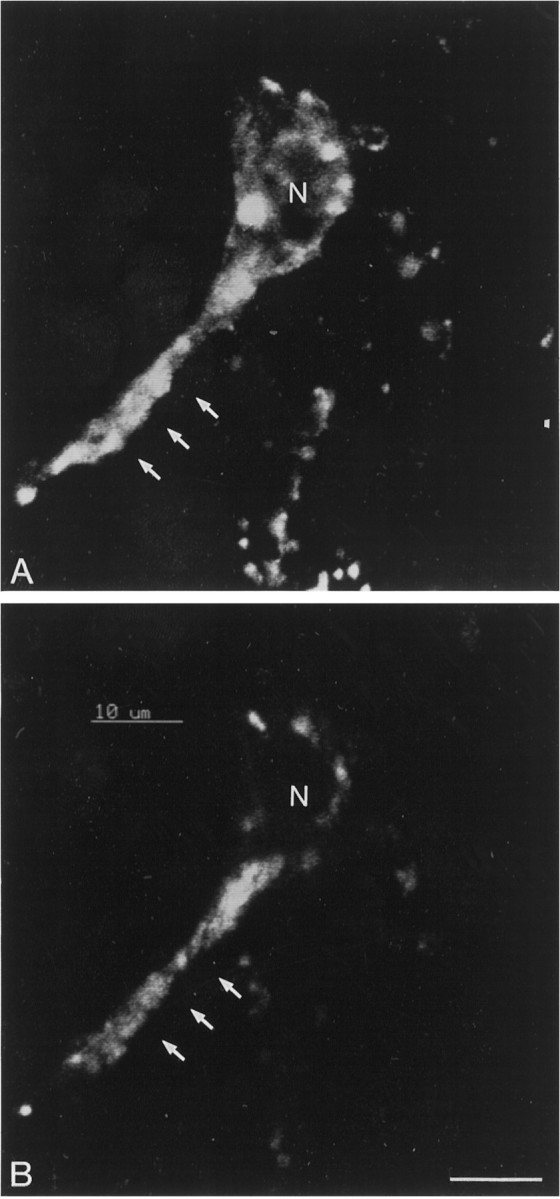
Confocal imaging of a DA neuron dually labeled with a TH antibody (A) and fluo-NT (B). Fluo-NT labeling was performed for 30 min at 37°C. Confocal microscopic images acquired through the red channel for TH (revealed with a Texas Red-tagged secondary antibody) and the green channel for fluo-NT. Note the differential distribution of the two labels in the perikaryon and process (arrows) of the cell. N, Nucleus. Scale bar, 10 μm.
In neurons incubated at 4°C, fluo-NT labeling was evident over both perikarya and processes, where it formed intensely fluorescent “hot spots,” 2.5 μm in mean diameter, superimposed over diffuse background labeling (Fig. 3A). This labeling was strictly surface-bound, as indicated by the lack of intracytoplasmic fluorescence in serial optical sections passing through the plane of the nucleus (not shown), and by the fact that it disappeared totally after hypertonic acid wash (Fig.3B).
Fig. 3.
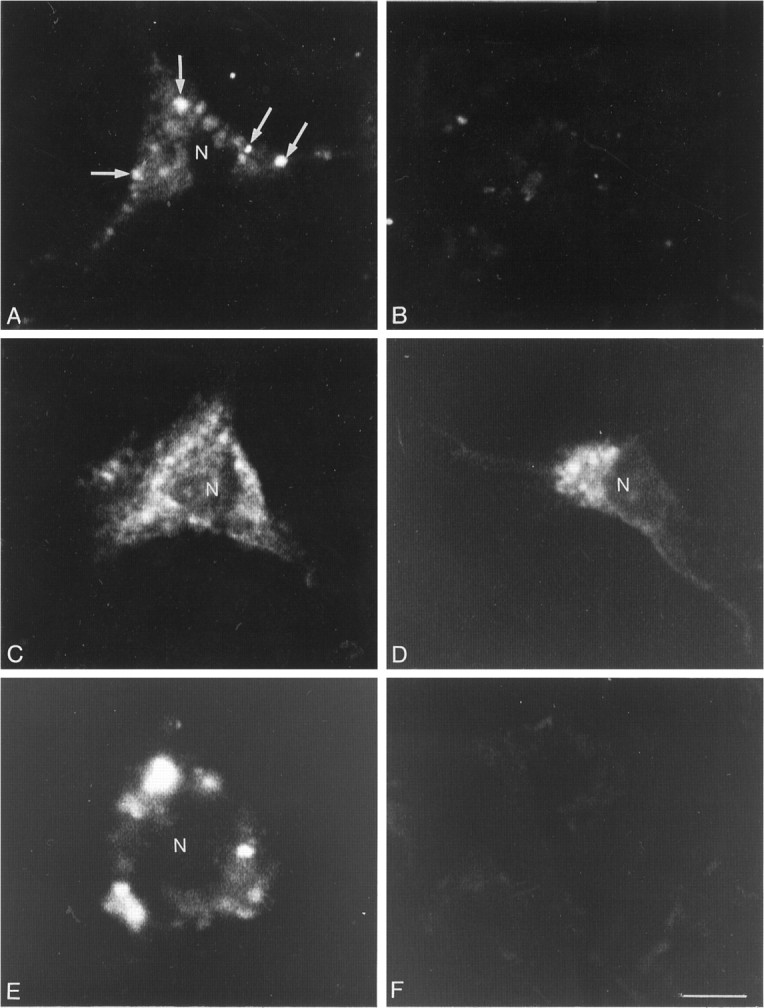
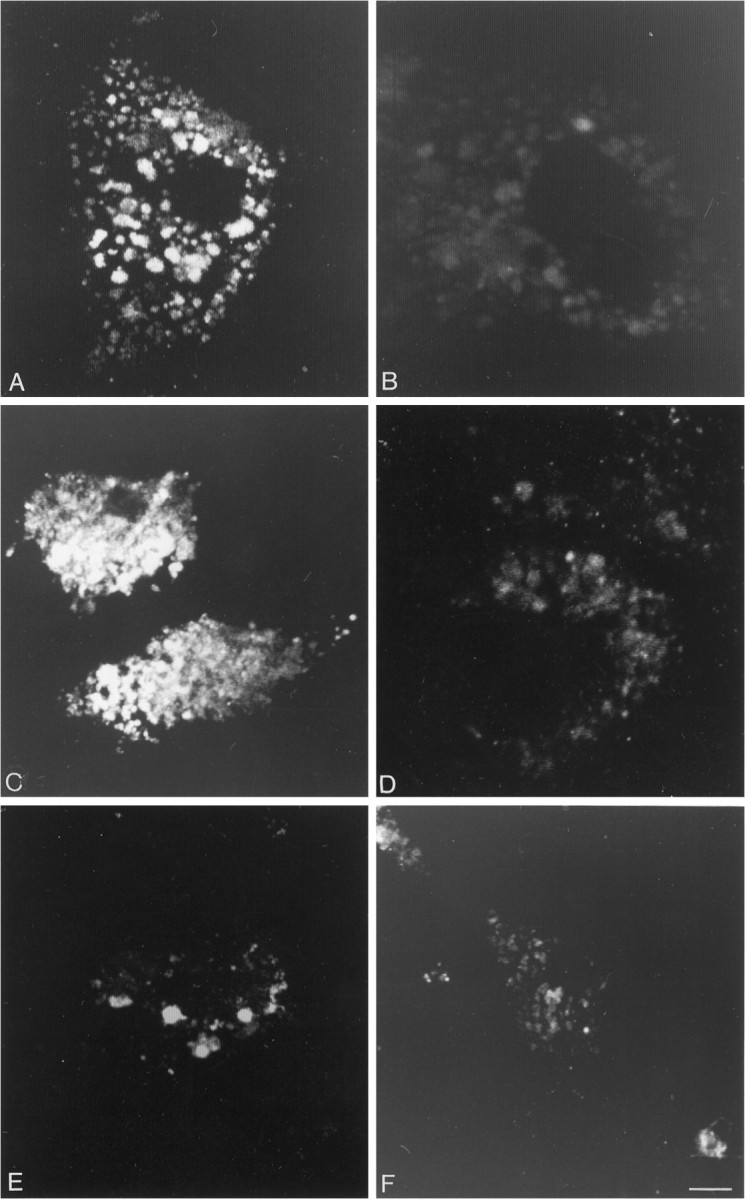
Confocal microscopic images of fluo-NT-labeled neurons grown in mixed cultures and incubated at 4°C (A, B) or 37°C (C–F). Images were acquired as single optical sections at 32 scans/frame.A, At 4°C, labeling forms discontinuous clusters at the periphery of the cell (arrows). B, This labeling is restricted to the cell surface, because it is no longer apparent after hypertonic acid wash. C, After incubation at 37°C, labeling pervades the cytoplasm of the neuron.D, Stripping of cell surface binding with a hypertonic acid wash reveals that this labeling is predominantly intracellular and in the form of small endosome-like particles. E, When internalization is prevented by treatment with the endocytosis inhibitor PAO, bound fluorescent molecules remain clustered at the periphery of the cell. F, This labeling is no longer apparent after acid wash, confirming that it is confined to the surface. N, Nucleus. Scale bar, 10 μm.
In neurons incubated at 37°C, the labeling was also highly punctuate, but confined to perikarya. Fluorescent hot spots were smaller in diameter (≃1.5 μm) and more homogeneous in size than those detected after incubation at 4°C (Fig. 3C). Serial optical sectioning and acid-wash stripping of cell surface binding demonstrated that the bulk of the fluorescent signal was intracellular (Fig. 3D). By contrast, when the incubation was carried out in the presence of the endocytosis inhibitor PAO, specifically bound fluo-NT molecules remained clustered on the cell surface in a pattern comparable to that seen after incubation at 4°C (Fig. 3E). This residual labeling was completely abolished by a hypertonic acid wash, confirming that it was indeed surface-bound (Fig.3F).
Pulse–chase experiments
In neurons incubated for 3 min at 37°C with 10 nmfluo-NT followed by superfusion with buffer at the same temperature for variable time intervals, the distribution, size, and number of intracellular (i.e., acid-wash resistant) fluorescent particles varied with time. Between 5 and 10 min after pulse labeling, fluorescent particles were small (mean area: 0.94 μm2), numerous, and distributed throughout perikarya and processes (Fig.4A). By 45 min, they were larger (mean area: 1.4 μm2), less numerous, and predominated at the level of perikarya and proximal processes (Fig. 4B). Finally, at 90 min, labeled particles were both larger and more sparse than at earlier time intervals. They were confined to the perikaryon, with a tendency to conglomerate in the perinuclear region (Fig.4C). Cells incubated in the presence of 1 μm nonfluorescent NT were devoid of labeling (not shown).
Fig. 4.
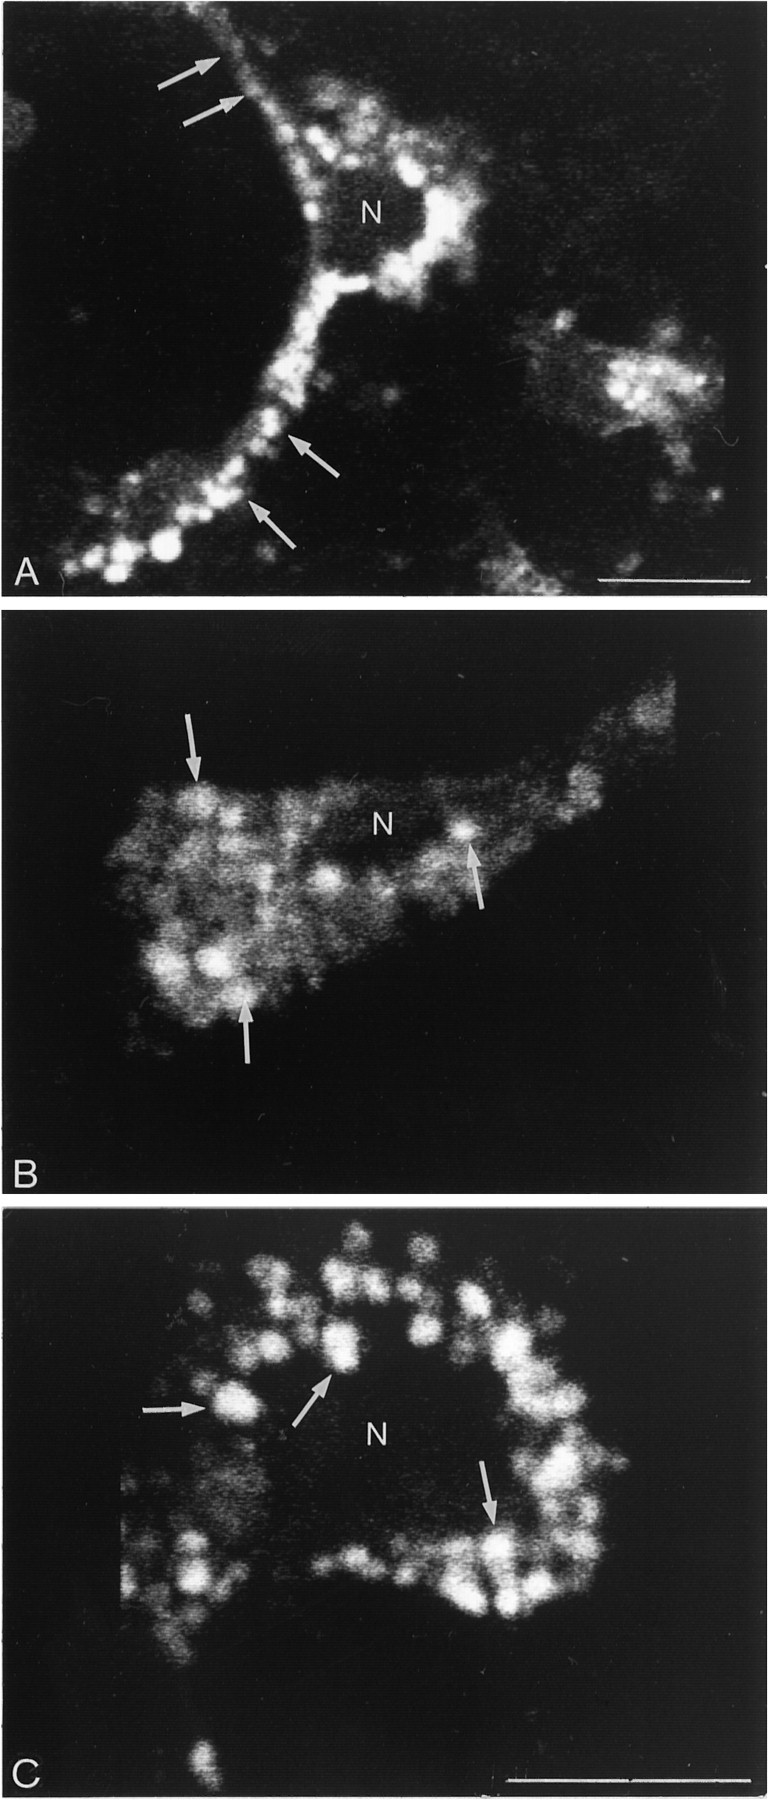
High-magnification confocal microscopic images of fluo-NT-labeled neurons in mixed cultures. Neurons scanned 5 (A), 45 (B), and 90 min after a 3 min incubation with fluo-NT. A, Intensely fluorescent particles fill both perikaryon and processes (arrows).B, Intracellular fluorescent particles are larger than in A (e.g., arrows) and detected throughout the perikaryon and proximal dendritic stump.C, Intracellular fluorescent particles are large (e.g.,arrows) and fill the perikaryal cytoplasm.N, Nucleus. Scale bars, 10 μm.
Quantitative analysis of fluorescent particles in cross-sectioned neuronal perikarya showed a transient increase in the number of fluorescent particles during the first 15 min of chase followed by a sustained decrease throughout the remaining washout time (F(1,39) = 14.02; p < 0.001) (Figure 5). By contrast, the area of fluorescent particles increased steadily during the same period (F(1,39) = 45.9; p < 0.0001) (Figure 5). Finally, the mean distance between labeled particles and the nuclear center decreased significantly with time (F(1,39) = 17.93; p < 0.001) (Figure 5).
Fig. 5.
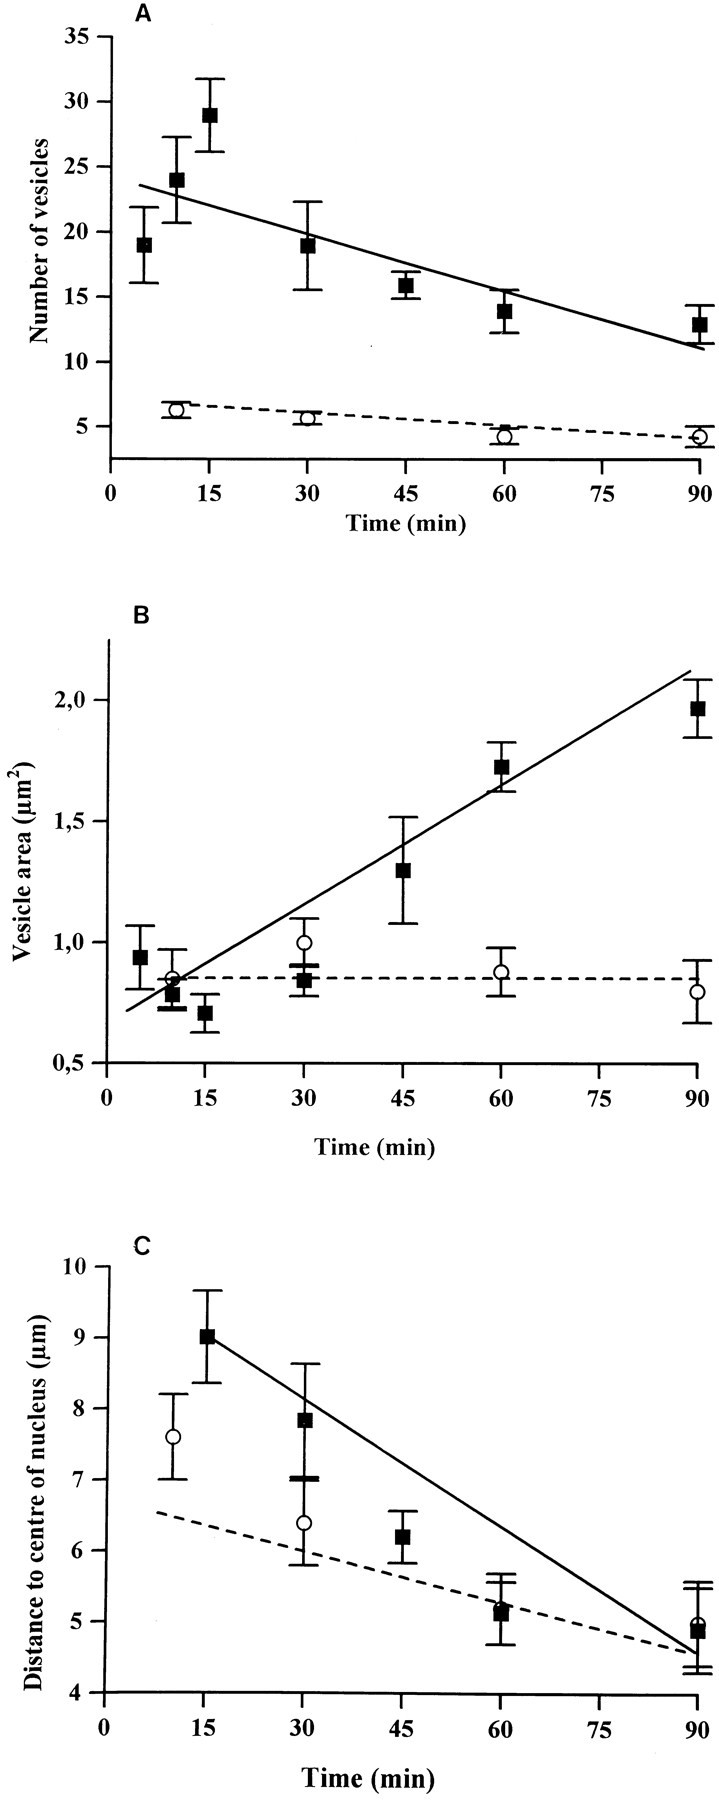
Evolution over time of the mean number per perikaryal profile (A), area (B), and distance to the nuclear center (C) of fluorescent particles in single optical sections through fluo-NT-labeled neurons. Cells were pulse-labeled 3 min with either fluo-NT (▪) or its photoreactive derivative (○). They were then irradiated (○) or not (▪) with visible light and incubated for 5–90 min at 37°C in Earle’s buffer. Mean ± SEM of measurements in 10–15 cells from three different experiments.
The pattern of intraneuronal mobilization of fluorescent particles was markedly different when the fluorescent ligand was photoaffinity cross-linked to cell surface proteins before a 37°C buffer chase. As with fluo-NT, internalized fluorescent molecules were readily visible at the level of neuronal perikarya and processes after 5 min of exposure to warm buffer (Fig. 6A). These fluorescent molecules had been efficiently cross-linked to cell surface proteins, as demonstrated by the fact that they were totally washed out by dehydration in cells that were not irradiated (Fig.6B). As with fluo-NT, the labeling decreased progressively with time at the level of processes and increased in cell bodies. In contrast to what was observed with fluo-NT, however, neither the number nor the size of intra-perikaryal fluorescent particles showed any modification with time, nor was there any variation in the mean distance separating them from the cell center (Fig. 5).
Fig. 6.
Confocal microscopic images of neurons incubated for 45 min at 4°C with 20 nm fluo-azido-nitro-NT and irradiated (A) or not (B) with visible light before incubation at 37°C. Cells in which the ligand has been cross-linked to the receptor (A) exhibit intracytoplasmic fluorescent clusters (arrows), whereas nonirradiated cells (B) are devoid of labeling. Scale bar, 10 μm.
Binding of fluo-NT to glial cells
In both mixed neuronal/glial and pure glial cultures incubated for 60 min with 20 nm fluo-NT at either 4°C or 37°C and immunostained for GFAP, 30–40% of the GFAP immunoreactive cells exhibited fluo-NT labeling (Fig. 7A). This labeling was specific, because it was fully inhibited by an excess of nonfluorescent NT (Fig. 7B). In contrast to neuronal labeling, however, it was resistant to co-incubation with an excess of SR 48692 (Fig. 7C) and abolished by 1 μmlevocabastine (Fig. 7D).
Fig. 7.
Confocal microscopic imaging of fluo-NT binding to astrocytes grown in pure glial culture. A, After 60 min of incubation with 20 nm fluo-NT at 37°C, fluorescent hot spots are distributed throughout the cell surface. B, This labeling is completely abolished by co-incubation with 1 μm nonfluorescent NT. C, Co-incubation with the antagonist SR 48692 (10 μm) does not inhibit binding of fluo-NT to glial cells. D, By contrast, levocabastine competes efficiently with fluo-NT binding.E, After incubation with 20 nm fluo-NT at 4°C, fluorescent clusters are less numerous than at 37°C.F, Labeling observed after incubation with 20 nm fluo-NT at 37°C is virtually abolished after hypertonic acid wash, indicating that it is confined to the cell surface. Scale bar, 10 μm.
When fluo-NT binding was carried out at 4°C, glial labeling in both mixed and pure cultures took the form of hot spots, the size of which (5 μm in mean diameter) was twice that of clusters detected on neuronal cells (2.5 μm) (Fig. 7E). These fluorescent clusters were strictly confined to the cell surface, because they disappeared completely after hypertonic acid wash (not shown).
When the incubation was carried out at 37°C, glial labeling was still detected in the form of intense fluorescent particles distributed all over the cell (Fig. 7A). These particles were higher in number and smaller in size (3 μm in mean diameter) than after incubation at 4°C. They were still larger, however, than those seen in neuronal cells at the same time interval. In contrast to the situation in neurons, glial labeling was unaffected by the addition of the endocytosis inhibitor PAO and was no longer evident after hypertonic acid wash, indicating that the particles were confined to the cell surface (Fig. 7F).
DISCUSSION
The present study provides the first direct evidence for a selective association of a levocabastine-sensitive, SR 48692-insensitive NT receptor with neuroglia. It also demonstrates the existence of major differences in regulation between this glial receptor and the one associated with midbrain DA neurons.
Identification and regulation of the neuronal NT receptor
In mixed cultures prepared from the midbrain of E16 rats, between 10 and 15% of neuronal cells exhibited specific fluo-NT binding consistent with the proportion of radiolabeled cells detected by autoradiography after incubation of the same type of culture with monoiodinated NT (125I-NT; Chabry et al., 1990; Dana et al., 1991). This binding could be ascribed specifically to the high-affinity NT receptor of the type cloned by Tanaka et al. (1991), because it was fully abolished by the selective NT receptor antagonist SR 48692 and was resistant to levocabastine. A major proportion of fluo-NT-labeled cells were immunoreactive for TH, congruent with the earlier demonstration that midbrain DA neurons contain high-affinity NT receptor mRNA transcripts (Nicot et al., 1995) and that the effects of NT on DA neurons are antagonized by the NT receptor antagonist SR 48692 (Gully et al., 1993).
Approximately 85% of TH-immunopositive cells exhibited fluo-NT labeling, in keeping with the results of double-labeling studies in the adult, which have shown that between 80 and 90% of DA cells in the ventral tegmental area and >95% of DA cells in the substantia nigra harbor 125I-NT binding sites (Szigethy and Beaudet, 1989). After incubation at 4°C, bound fluo-NT molecules remained confined to the cell surface, as indicated by their pericellular distribution and sensitivity to hypertonic acid wash. In contrast, when the incubation was carried out at 37°C, the labeling took the form of smaller, intracytoplasmic particles. This labeling was resistant to acid washes and prevented by PAO, confirming that it resulted from endocytosis. These observations are consistent with earlier biochemical and autoradiographic demonstrations of 125I-NT and/or fluo-NT endocytosis in primary neurons in culture (Mazella et al., 1991, 1993;Beaudet et al., 1994), in immortalized neuronal cells (Faure et al., 1995b), and in live brain slices (Faure et al., 1995a,c).
Endocytosis of fluo-NT was followed rapidly by intracellular migration of internalized ligand molecules, first from processes to cell bodies and second within the cell body, from the periphery of the perikaryon to the perinuclear region. Such mobilization of internalized molecules from the dendritic/axonal tree toward the perikaryon had been surmised previously from the neuropil to perikaryal shift in labeling observed in brain slices after incubation with fluo-NT (Faure et al., 1995a,c) but was directly visualized here for the first time. It is reminiscent of what has been described for labeled nerve growth factor in both sensory and sympathetic systems (Handry et al., 1974; Stoeckel et al., 1975), where it has been shown to play a critical role in signal transduction (Koliatsos and Price, 1993). Whether NT internalization is similarly involved in neural signaling within midbrain DA cells, as proposed previously on the basis of in vivo experiments (Burgevin et al., 1992), awaits further investigation.
Within nerve cell bodies, the number of fluorescent particles showed a transient increase followed by a sustained decrease throughout the washout period. This decrease in number was paralleled by an increase in size, suggesting that it resulted from a fusion of the original endocytic compartment. This interpretation is congruent with current models of ligand/receptor complexes, which call on a sequential transformation of endocytic vesicles into early endosomes, late endosomes, and secondary lysosomes (Stoorvogel et al., 1991; Dahan et al., 1994).
Experiments in which fluo-NT was cross-linked to cell surface proteins before allowing internalization to proceed showed no hindrance of the endocytic process, confirming that the latter involved a joint sequestration of receptor-ligand complexes. Indeed, earlier biochemical studies using an iodinated variant of our photoaffinity probe had shown that under experimental conditions comparable to the ones used in the present study, this ligand selectively labels two neuronal proteins of 50 and 60 kDA (Chabry et al., 1993). The same two proteins were found to be labeled in membranes from COS-7 cells transfected with the high-affinity NT receptor, indicating that they correspond to two different forms of the receptor (Chabry et al., 1994). If it did not impede ligand endocytosis, the cross-linking procedure profoundly modified the intracellular routing of internalized ligand molecules. Specifically, internalized fluorescent clusters were no longer seen to either coalesce or migrate to the center of the cell, as after incubation with fluo-NT, but they remained small, numerous, and uniformly dispersed in the cytoplasm throughout the washout period. These results suggest that dissociation of ligand-receptor complexes is mandatory for fusion of early endosomes and their subsequent transformation into lysosomes.
Identification and regulation of the glial NT receptor
Glial cells in both mixed and pure glial cultures also exhibited specific fluo-NT labeling. This labeling, however, differed in both its pharmacological properties and its distributional pattern from that observed in neuronal cells.
Specific fluo-NT labeling was detected over ∼30% of glial cells in both mixed neuronal/glial cultures and pure glial cultures. In both cases, fluo-NT-labeled cells were found to correspond to astrocytes when double-labeled with GFAP. Such selective expression of NT binding sites by a subpopulation of glial cells is consistent with the repeated demonstration of phenotypic heterogeneity of astrocytes in the CNS (for reviews, see Hanson, 1990; Wilkin et al., 1990).
Pharmacologically, specific glial fluo-NT labeling differed from neuronal labeling in its sensitivity to levocabastine and resistance to SR 48692. These properties suggest that the NT receptor labeled in our preparations corresponds to a levocabastine-sensitive low-affinity type of NT receptor such as that cloned recently by Chalon et al. (1996) andMazella et al. (1996). This interpretation is supported by the recent demonstration of expression of the receptor cloned by Mazella et al. (1996) in neonatal glial cells in culture (Nouel et al., 1996). It is also consistent with the developmental profile of levocabastine-sensitive NT binding sites, which follows that of glial cell maturation (Schotte and Laduron, 1987), and with the increase in levocabastine-sensitive NT binding observed after induction of reactive gliosis (Schotte et al., 1988).
The glial labeling observed in the present study was insensitive to the high-affinity NT receptor antagonist SR 48692, suggesting a lack of expression of the high-affinity NT site by glial cells, a view supported by in situ hybridization data on the localization of high-affinity NT receptor transcripts (Nicot et al., 1995). There has been, however, a report of SR 48692-sensitive [3H]NT autoradiographic labeling of astrocytes in cultures prepared from the neocortex of newborn rats and the brainstem of E17 rat embryos, which leaves open the possibility that the high-affinity NT receptor may be expressed by glial cells under specific conditions (Hölsi et al., 1995).
The glial low-affinity levocabastine receptor was also differentially regulated compared with its neuronal high-affinity counterpart. Specifically, it lacked the ligand-induced internalization properties documented in neurons, as evidenced by the absence of intracytoplasmic labeling in serial confocal sections and by the complete washout of specifically bound ligand after exposure to hypertonic buffer wash. There is a growing body of evidence suggesting that G-protein-coupled receptors may be internalized differently when expressed in different cell types, presumably through interaction with distinct cellular proteins. For instance, the type A cholecystokinin receptor internalizes more efficiently when transfected into chinese hamster ovary cells than when expressed naturally in pancreatic acinar cells (Roettger et al., 1995a,b). Furthermore, different receptor subtypes may exhibit different internalization patterns within the same type of cells. This phenomenon has been well documented for different subtypes of α and β adrenergic receptors (Von Zastrow et al., 1993) as well as for sst1 and sst2A somatostatin receptors transfected in COS-7 cells (Nouel et al., 1997). Site-directed mutagenesis has recently allowed Chabry et al. (1995) to identify Thr-422 and Tyr-424 residues in the C-terminal tail of the high-affinity NT receptor as being critical for ligand-induced internalization (Chabry et al., 1995). It is interesting in this context that high- and low-affinity NT receptors differ in their C terminus and that the latter lacks these two amino acid residues (Mazella et al., 1996). This suggests that the difference in the internalization profile capacities of these two NT receptor subtypes may be structural as well as cell-dependent.
The lack of internalization of fluo-NT bound to glial cells at 37°C made it possible to study the fate of surface low-affinity NT receptor clustering at physiological temperatures. Our observations indicate that the size and number of cell surface receptor clusters are temperature-dependent. This suggests strongly that receptor clusters are neither preformed nor rigidly anchored to cytoskeletal proteins, as is the case, for instance, for ligand-gated receptor channels (Nicola et al., 1992; Craig et al., 1993). Mobility within the plasma membrane and ligand-induced clustering has also been proposed for the high-affinity NT receptor (Chabry et al., 1993; Faure et al., 1995a–c) as well as for various other G-protein receptors in other cell types and may be a common feature of G-protein-coupled receptors. Interestingly, cell surface ligand clusters decreased in size but increased in number as temperature was heightened, a phenomenon most likely attributable to greater fluidity of the membrane at 37° than at 4°C. Clustering of receptor-ligand complexes is usually considered as a prelude to internalization (Hazum et al., 1980; Naor et al., 1981;Lutz et al., 1990), whereas the present data demonstrate clearly that receptor clustering may occur without subsequent endocytosis. Whether and how such clustering is involved in cell signaling remain to be established.
In conclusion, the present study provides the first evidence for a selective association of a levocabastine-sensitive NT receptor with astrocytes and demonstrates that this receptor differs not only pharmacologically but also in its mode of regulation from the high-affinity NT receptor expressed by neurons.
Footnotes
This study was supported by Grant MA-7366 from the Medical Research Council of Canada and by a fellowship to D.N. from the Fonds de la Recherche en Santé du Québec. The clerical assistance of Mariette Houle, Beverley Lindsay, and Ester Di Camillo is gratefully acknowledged.
Correspondence should be addressed to Dr. Alain Beaudet, Montreal Neurological Institute, McGill University, 3801 University Street, Montreal, Quebec, Canada, H3A 2B4.
Dr. Faure’s present address: Advanced Bioconcept Inc., 1440 St. Catherine Street West, Suite 424, Montreal, Quebec, Canada, H3G 1R8.
Dr. Alonso’s present address: Sanofi Recherche, Département de Neuropsychiatrie, 371 rue du Pr. J. Blayac, 34184 Montpellier Cedex 04, France.
REFERENCES
- 1.Alonso R, Chaudieu I, Diorio J, Krishnamurthy A, Quirion R, Boksa P. Interleukin-2 modulates evoked release of [3H]dopamine in rat cultured mesencephalic cells. J Neurochem. 1993;61:1284–1290. doi: 10.1111/j.1471-4159.1993.tb13620.x. [DOI] [PubMed] [Google Scholar]
- 2.Beaudet A, Mazella J, Nouel D, Chabry J, Castel MN, Laduron PM, Kitabgi P, Faure MP. Internalization and intracellular mobilization of neurotensin in neuronal cell. Biochem Phamacol. 1994;47:43–52. doi: 10.1016/0006-2952(94)90436-7. [DOI] [PubMed] [Google Scholar]
- 3.Brouard A, Pelaprat D, Dana C, Vial M, Lhiaubet AM, Rostène W. Mesencephalic dopaminergic neurons in primary cultures express functional neurotensin receptors. J Neurosci. 1992;12:1409–1415. doi: 10.1523/JNEUROSCI.12-04-01409.1992. [DOI] [PMC free article] [PubMed] [Google Scholar]
- 4.Burgevin M, Castel MN, Quateronet D, Chevet T, Laduron PM. Neurotensin increases tyrosine hydroxylase messenger mRNA-positive neurons in substantia nigra after its retrograde axonal transport in dopaminergic neurons. Neuroscience. 1992;49:627–633. doi: 10.1016/0306-4522(92)90232-q. [DOI] [PubMed] [Google Scholar]
- 5.Carraway RE, Leeman S. The isolation of a new hypotensive peptide, neurotensin from bovine hypothalami. J Biol Chem. 1973;248:6854–6861. [PubMed] [Google Scholar]
- 6.Chabry J, Checler F, Vincent J-P, Mazella J. Colocalization of neurotensin receptors and the neurotensin-degrading endopeptidase 24.16 on primary culture of neurons. J Neurosci. 1990;10:3916–3921. doi: 10.1523/JNEUROSCI.10-12-03916.1990. [DOI] [PMC free article] [PubMed] [Google Scholar]
- 7.Chabry J, Gaudriault G, Vincent J-P, Mazella J. Implication of various forms of neurotensin receptors in the mechanism of internalization of neurotensin in cerebral neurons. J Biol Chem. 1993;208:17138–17144. [PubMed] [Google Scholar]
- 8.Chabry J, Labbé-Jullié C, Gully D, Kitabgi P, Vincent J-P, Mazella J. Stable expression of the cloned rat brain neurotensin receptor into fibroblasts: binding properties, photoaffinity labeling, transduction mechanisms, and internalization. J Neurochem. 1994;63:19–27. doi: 10.1046/j.1471-4159.1994.63010019.x. [DOI] [PubMed] [Google Scholar]
- 9.Chabry J, Botto JM, Nouel D, Beaudet A, Vincent J-P. Thr-422 and Tyr-424 residues in the carboxyl terminus are critical for the internalization of the rat neurotensin receptor. J Biol Chem. 1995;270:2439–2442. doi: 10.1074/jbc.270.6.2439. [DOI] [PubMed] [Google Scholar]
- 10.Chalon P, Vita N, Kaghad M, Guillemot M, Bonnin J, Delpech B, Le Fur G, Ferrara P, Caput D. Molecular cloning of a levocabastine-sensitive neurotensin binding site. FEBS Lett. 1996;386:91–94. doi: 10.1016/0014-5793(96)00397-3. [DOI] [PubMed] [Google Scholar]
- 11.Craig AM, Blackstone CD, Huganir RL, Banker G. The distribution of glutamate receptors in cultured rat hippocampal neurons: postsynaptic clustering of AMPA-selective subunits. Neuron. 1993;10:1055–1068. doi: 10.1016/0896-6273(93)90054-u. [DOI] [PubMed] [Google Scholar]
- 12.Dahan S, Ahluwalia JP, Wong L, Posner BI, Bergeron JM. Concentration of intracellular hepatic apolipoprotein E in Golgi apparatus saccular distensions and endosomes. J Cell Biol. 1994;127:1859–1869. doi: 10.1083/jcb.127.6.1859. [DOI] [PMC free article] [PubMed] [Google Scholar]
- 13.Dana C, Pelaprat D, Vial M, Brouard A, Lhiaubet AM, Rostène W. Characterization of neurotensin binding sites on rat mesencephalic cells in primary culture. Dev Brain Res. 1991;61:259–264. doi: 10.1016/0165-3806(91)90139-a. [DOI] [PubMed] [Google Scholar]
- 14.Faure MP, Gaudreau P, Shaw I, Cashman NR, Beaudet A. Synthesis of a biologically active fluorescent probe for labeling neurotensin receptors. J Histochem Cytochem. 1994;42:755–763. doi: 10.1177/42.6.8189037. [DOI] [PubMed] [Google Scholar]
- 15.Faure MP, Alonso A, Nouel D, Gaudriault G, Dennis M, Vincent J-P, Beaudet A. Somatodendritic internalization and perinuclear targeting of neurotensin in the mammalian brain. J Neurosci. 1995a;15:4140–4147. doi: 10.1523/JNEUROSCI.15-06-04140.1995. [DOI] [PMC free article] [PubMed] [Google Scholar]
- 16.Faure MP, Labbé-Jullié C, Cashman NR, Kitabgi P, Beaudet A. Binding and internalization of neurotensin in hybrid cells derived from septal cholinergic neurons. Synapse. 1995b;20:106–116. doi: 10.1002/syn.890200203. [DOI] [PubMed] [Google Scholar]
- 17.Faure MP, Nouel D, Beaudet A. Axonal and dendritic transport of internalized neurotensin in rat mesostriatal dopaminergic neurons. Neurosciences. 1995c;68:519–529. doi: 10.1016/0306-4522(95)00145-9. [DOI] [PubMed] [Google Scholar]
- 18.Gallo F, Morale MC, Avola R, Marchetti B. Cross-talk between luteinizing hormone-releasing hormone (LHRH) neurons and astroglial cells: developing glia release factors that accelerate neuronal differentiation and stimulate LHRH release from GT1–1 neuronal cell line and LHRH neurons induce astroglia proliferation. Endocrine. 1995;3:863–874. doi: 10.1007/BF02738891. [DOI] [PubMed] [Google Scholar]
- 19.Gully D, Canton M, Boigegrain R, Jeanjean F, Molimard JC, Poncelet M, Gueudet C, Heaulme M, Leyris R, Brouard A, Pelaprat D, Labbé-Jullié C, Mazella J, Soubrié P, Malfrand JP, Rostène W, Kitabgi P, Le Fur G. Biochemical and pharmacological profile of a potent and selective nonpeptide antagonist of the neurotensin receptor. Proc Natl Acad Sci USA. 1993;90:65–69. doi: 10.1073/pnas.90.1.65. [DOI] [PMC free article] [PubMed] [Google Scholar]
- 20.Handry JA, Stach R, Herrup K. Characteristics of the retrograde axonal transport system for nerve growth factor in the sympathetic nervous system. Brain Res. 1974;82:117–128. doi: 10.1016/0006-8993(74)90897-x. [DOI] [PubMed] [Google Scholar]
- 21.Hanson E. Regional heterogeneity among astrocytes in the central nervous system. Neurochem Int. 1990;16:237–245. doi: 10.1016/0197-0186(90)90097-d. [DOI] [PubMed] [Google Scholar]
- 22.Hazum E, Cuatrecasas P, Maran J, Conn PM. Receptor-mediated internalization of fluorescent gonadotropin-releasing hormone by pituitary gonadotropes. Proc Natl Acad Sci USA. 1980;77:6692–6695. doi: 10.1073/pnas.77.11.6692. [DOI] [PMC free article] [PubMed] [Google Scholar]
- 23.Hölsi E, Stauffer S, Hölsi L. Autoradiographic and electrophysiological evidence for the existence of neurotensin receptors on cultured astrocytes. Neuroscience. 1995;66:627–633. doi: 10.1016/0306-4522(95)00005-4. [DOI] [PubMed] [Google Scholar]
- 24.Kitabgi P, Checler F, Mazella J, Vincent J-P. Pharmacology and biochemistry of neurotensin receptors. Rev Clin Bas Pharmacol. 1985;5:397–486. [PubMed] [Google Scholar]
- 25.Kitabgi P, Rostène W, Dusdaillant M, Schotte A, Laduron PM, Vincent J-P. Two populations of neurotensin binding sites in murine brain: discrimination by the antihistamine levocabastine reveals markedly different radioautographic distribution. Eur J Pharmacol. 1987;140:285–293. doi: 10.1016/0014-2999(87)90285-8. [DOI] [PubMed] [Google Scholar]
- 26.Koliatsos VE, Price DL. Retrograde axonal transport: applications in trophic factor research. In: Boulton AA, Baker GB, Hefti F, editors. Animals models of neurological disorders. Humana; Clifton, NJ: 1993. pp. 247–290. [Google Scholar]
- 27.Lutz W, Sanders M, Salisbury J, Kumar R. Internalization of vasopressin analogs in kidney and smooth muscle cells: evidence for receptor-mediated endocytosis in cells with V1 or V2 receptors. Proc Natl Acad Sci USA. 1990;87:6507–6511. doi: 10.1073/pnas.87.17.6507. [DOI] [PMC free article] [PubMed] [Google Scholar]
- 28.Mazella J, Leonard K, Chabry J, Kitabgi P, Vincent J-P, Beaudet A. Binding and internalization of iodinated neurotensin in neuronal cultures from embryonic mouse brain. Brain Res. 1991;564:249–255. doi: 10.1016/0006-8993(91)91460-i. [DOI] [PubMed] [Google Scholar]
- 29.Mazella J, Chabry J, Checler F, Beaudet A, Vincent J-P. Neurotensin receptors in primary culture of neurons. Methods Neurosci. 1993;11:334–350. [Google Scholar]
- 30.Mazella J, Botto JM, Guillemare E, Coppola T, Sarret P, Vincent J-P. Structure, functional expression, and cerebral localization of the levocabastine-sensitive neurotensin/neuromedin N receptor from mouse brain. J Neurosci. 1996;16:5613–5620. doi: 10.1523/JNEUROSCI.16-18-05613.1996. [DOI] [PMC free article] [PubMed] [Google Scholar]
- 31.Naor Z, Atlas D, Clayton RN, Forman DS, Amsterdam A, Catt KJ. Interaction of fluorescent gonadotropin-releasing hormone with receptors in cultured pituitary cells. J Biol Chem. 1981;256:3049–3052. [PubMed] [Google Scholar]
- 32.Nicola MA, Becker CM, Trillet A. Development of glycine receptor alpha subunit in cultivated rat spinal neurons: an immunocytochemical study. Neurosci Lett. 1992;138:173–178. doi: 10.1016/0304-3940(92)90499-w. [DOI] [PubMed] [Google Scholar]
- 33.Nicot A, Rostène W, Bérot A. Differential expression of neurotensin receptor mRNA in the dopaminergic cell groups of the rat diencephalon and mesencephalon. J Neurosci Res. 1995;40:667–674. doi: 10.1002/jnr.490400512. [DOI] [PubMed] [Google Scholar]
- 34.Nouel D, Botto JM, Sarret P, Vincent J-P, Mazella J, Beaudet A. Neurotensin internalizes via the low affinity, levocabastine-sensitive receptor in transfected COS-7 cells, but not in glial cells. Soc Neurosci Abstr. 1996;22:1298. [Google Scholar]
- 35.Nouel D, Gaudriault G, Houle M, Reisine T, Vincent J-P, Mazella J, Beaudet A (1997) Differential internalization of somatostatin in COS-7 cells transfected with sst1 and sst2 receptor subtypes: a confocal microscopic study using novel fluorescent derivatives. Endocrinology, in press. [DOI] [PubMed]
- 36.Palacios JM, Kuhar MJ. Neurotensin receptors are located on dopamine containing neurons in rat midbrain. Nature. 1982;294:587–589. doi: 10.1038/294587a0. [DOI] [PubMed] [Google Scholar]
- 37.Palacios JM, Pazos A, Dietl MM, Schlumpf M, Lichtensteiger W. The ontogeny of brain receptors studied by autoradiography. Neuroscience. 1988;25:307–317. doi: 10.1016/0306-4522(88)90028-0. [DOI] [PubMed] [Google Scholar]
- 38.Quirion R, Welner S, Gauthier S, Bedard P. Neurotensin receptor binding sites in monkey and human brain: autoradiographic distribution and effects on 1-methyl-4-phenyl-1,2,3,6 tetrahydropyridine treatment. Synapse. 1987;1:559–566. doi: 10.1002/syn.890010608. [DOI] [PubMed] [Google Scholar]
- 39.Roettger BF, Rentsch RU, Hadac EM, Hellen EH, Burghardt TP, Miller LJ. Insulation of a G-protein-coupled receptor on the plasmalemmal surface of the pancreatic acinar cells. J Cell Biol. 1995a;130:579–590. doi: 10.1083/jcb.130.3.579. [DOI] [PMC free article] [PubMed] [Google Scholar]
- 40.Roettger BF, Rentsch RU, Pinon D, Holicky E, Haldac EM, Larkin JM, Miller LJ. Dual pathways of internalization of the cholecystokinin receptor. J Cell Biol. 1995b;128:1029–1041. doi: 10.1083/jcb.128.6.1029. [DOI] [PMC free article] [PubMed] [Google Scholar]
- 41.Sadoul JL, Checler F, Kitabgi P, Rostene W, Javoy-Agid F, Vincent J-P. Loss of high affinity neurotensin receptors in substantia nigra from Parkinsonian subjects. Biochem Biophys Res Commun. 1984;125:395–404. doi: 10.1016/s0006-291x(84)80381-2. [DOI] [PubMed] [Google Scholar]
- 42.Schotte A, Laduron PM. Different ontogeny for two 3H-neurotensin binding sites in rat brain. Brain Res. 1987;408:326–328. doi: 10.1016/0006-8993(87)90398-2. [DOI] [PubMed] [Google Scholar]
- 43.Schotte A, Leysen JE, Laduron PM. Evidence for a displaceable non-specific [3H]neurotensin binding site in rat brain. Arch Pharmacol. 1986;333:400–405. doi: 10.1007/BF00500016. [DOI] [PubMed] [Google Scholar]
- 44.Schotte A, Rostène W, Laduron PM. Different subcellular localization of neurotensin receptor and neurotensin-acceptor sites in the rat brain dopaminergic system. J Neurochem. 1988;50:1026–1031. doi: 10.1111/j.1471-4159.1988.tb10568.x. [DOI] [PubMed] [Google Scholar]
- 45.Stoeckel K, Schwab M, Thoenen H. Comparison between the retrograde axonal transport of nerve growth factor and tetanus toxin in motor, sensory and adrenergic neurons. Brain Res. 1975;99:1–16. doi: 10.1016/0006-8993(75)90604-6. [DOI] [PubMed] [Google Scholar]
- 46.Stoorvogel W, Strous GJ, Geuze HJ, Oorschot V, Schwartz AL. Late endosomes derive from early endosomes by maturation. Cell. 1991;65:417–427. doi: 10.1016/0092-8674(91)90459-c. [DOI] [PubMed] [Google Scholar]
- 47.Szigethy E, Beaudet A. Correspondence between high affinity 125-I neurotensin binding sites and dopaminergic neurons in the rat substantia nigra and ventral tegmental area: a combined radioautographic and immunohistochemical light microscopic study. J Comp Neurol. 1989;279:128–137. doi: 10.1002/cne.902790111. [DOI] [PubMed] [Google Scholar]
- 48.Tanaka K, Masu M, Nakanishi S. Structure and functional expression of the cloned rat neurotensin receptor. Neuron. 1990;4:847–854. doi: 10.1016/0896-6273(90)90137-5. [DOI] [PubMed] [Google Scholar]
- 49.Von Sastrow M, Link R, Daunt D, Barsh G, Kobilka B. Subtype-specific differences in the intracellular sorting of G-protein-coupled receptors. J Biol Chem. 1993;268:763–766. [PubMed] [Google Scholar]
- 50.Wilkin GP, Mariott DR, Cholwinski AJ. Astrocyte heterogeneity. Trends Neurosci. 1990;13:43–46. doi: 10.1016/0166-2236(90)90065-i. [DOI] [PubMed] [Google Scholar]