Abstract
When a bat approaches a target, it continuously modifies its echolocation sounds and relies on incoming echo information to shape the characteristics of its subsequent sonar cries. In addition, acoustic information about the azimuth and elevation of a sonar target elicits orienting movements of the head and pinnae toward the sound source. This requires a common sensorimotor interface, where echo information is used to guide motor behaviors.
Using single-unit neurophysiological methods and free-field auditory stimulation, we present data on biologically relevant specializations in the superior colliculus (SC) of the bat for orientation by sonar. In the bat’s SC, two classes of spatially tuned neurons are distinguished by their sensitivity to echoes. One population shows facilitated, delay-tuned responses to pairs of sounds, simulating sonar emissions and echoes. Delay tuning, related to encoding target range, may play a role in guiding motor responses in echolocation, because the bat adjusts its emissions with changes in target distance. The delay-facilitated response depends on the direction of stimulation and on the temporal relationship between the simulated emission and echo in the sound pair, suggesting that this class of neurons represents the location of a target in three dimensions. A second population encodes the target in two dimensions, azimuth and elevation, and does not show a facilitated response to echoes delivered from any locus. Encoding of azimuth and elevation may be important for directing head aim, and this class may function in transforming auditory spatial information into signals used to guide acoustic orientation.
Keywords: superior colliculus, echolocation, bats, acoustic orientation, spatial perception, sensorimotor integration
The midbrain superior colliculus (SC; optic tectum) of vertebrates is thought to play a role in spatial perception and in the translation of multisensory signals into commands for the control of quick (saccadic) orienting responses. In individual species, the organization of the SC reflects the importance of a particular sensory modality to an animal’s goal-directed behavioral responses. By analogy with the role of the SC in the saccadic eye-movement system of primates (Sparks, 1986), in gaze-control orientation behavior in cat and barn owl (Knudsen, 1982; Middlebrooks and Knudsen, 1984; Du Lac and Knudsen, 1990; Munoz et al., 1991), and in prey-catching behavior in pit viper and frog (Hartline et al., 1978; Grobstein, 1988), the SC of the echolocating bat may play a role in integrating sensory and motor signals that drive this animal’s acoustic orientation by sonar.
The bat guides its flight and forages in darkness by emitting ultrasonic vocal signals and listening to the echoes returning to its ears from objects in space (Griffin, 1958; Moss and Schnitzler, 1995). Binaural differences in arrival time, intensity, and spectrum of echoes encode the location of an object in azimuth and elevation (Lawrence and Simmons, 1982; Simmons et al., 1983; Pollak, 1988). The third dimension, the distance between the bat and a target, is determined from the time delay between the outgoing sound and the returning echo (Hartridge, 1945; Simmons, 1973). Together, these cues provide the bat with information to form an estimate of a target’s position in three-dimensional space. The bat presumably makes use of these acoustic cues to guide behavior appropriate for the tasks of detecting, tracking, and capturing insect prey. Echo-derived spatial information is ultimately integrated through neural circuitry with systems involved in generating motor responses for tracking the target (Kick and Simmons, 1984) and for controlling vocal output (Metzner, 1989, 1993). The bat aims the direction of its head, ears, and body toward the target, and it changes the repetition rate and the acoustic features of its outgoing sounds in response to spatial information contained in the echoes (Kick and Simmons, 1984).
The SC may play a role in a sensorimotor feedback process that coordinates the bat’s active motor control over the acoustic features of reflected echoes. Changes in echolocation behavior that facilitate the reception of additional sensory input are closely tied to target range; thus, a process that integrates signals driving acoustic orientation by sonar must include information about a target in azimuth, elevation, and range. Our work explores the role of the SC as a component of an adaptive sensorimotor feedback system for orientation, directional filtering, and vocalization production by the big brown bat, Eptesicus fuscus. Using extracellular recording methods and free-field auditory stimulation, we show two classes of spatially selective neurons that are distinguished by their sensitivity to the dimension of target range.
MATERIALS AND METHODS
Animal subjects. Twenty-eight big brown bats (Eptesicus fuscus, family Vespertilionidae) were used in physiological recording experiments. The bats were caught as adults during the summer in eastern Massachusetts and were housed in small groups in cages or in a larger enclosure where they could fly freely. The circadian cycle was maintained on a of 12 hr light/dark schedule so that their active nocturnal period occurred between 7 A.M. and 7 P.M. The temperature and humidity in the bat colony area were maintained at 25°C and 50%, respectively. They were fed ad libitum a diet consisting of nutritionally supplemented mealworms (Tenebrio molitor).
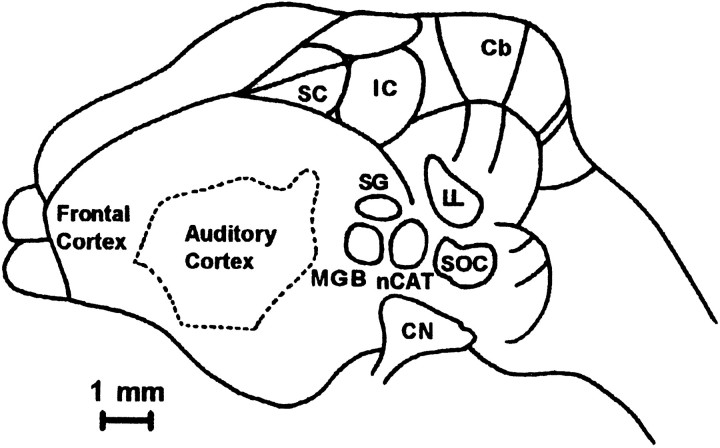
Surgical procedure and electrode implantation. The SC of the bat lies on the dorsal surface of the brain as shown in Figure1. A surgical procedure was carried out both to expose the SC for extracellular recording and to mount a small pedestal that served to immobilize the bat’s head during these experiments (see Suga et al., 1983; Suga and Horikawa, 1986). Under anesthesia (ketamine/xylazine, i.m., standard dosage of 52.4 mg/kg body weight), the muscle and skin covering the dorsal cranium were retracted and the restraint post was fastened with cyanoacrylate (Locktite 411) onto the bone surface anterior to the SC. The bat recovered in its home cage for 2–3 d before physiological recordings were initiated.
Fig. 1.
The location of the SC in Eptesicus fuscus on the dorsal surface of the brain. The SC lies beneath two layers of thin bone, and is ∼1.4 mm rostral-to-caudal and 1.0 mm medial-to-lateral. nCAT, Nucleus of the central acoustic tract; Cb, cerebellum; CN, cochlear nucleus; IC, inferior colliculus; nLL, nuclei of the lateral lemniscus; MGB, medial geniculate body;SC, superior colliculus; SG, suprageniculate nucleus; SOC, superior olivary complex. Adapted from Dear et al. (1993a) with permission.
On the day of the physiology experiment, the dorsal cranium was cleaned gently with saline to reexpose the SC. The bat then was placed in a Plexiglas restraint that was suspended by an elastic band at the center of a double-walled acoustic booth (Industrial Acoustics). The body restraint was designed to hold the bat stationary in a natural position with its wings comfortably folded and to provide air space around the bat’s body. To immobilize the bat’s head, the skull pedestal was locked into a metal rod with set screws, and the whole restraint system was supported from behind the bat by a magnetic stand at the center of a vibration isolation table (Kinetic Systems). The bat was placed with the tip of its snout aligned above the corner edge of the isolation table at a distance 40 cm from each speaker mounted on the semicircular hoop.
Initially, two 50 μm diameter holes were made in the skull with a polished needle under a surgical microscope (Zeiss OPNI). A low-impedance (∼700 kΩ) tungsten-indifferent electrode was inserted into a nonauditory region of the brain (anterior to the SC, lateral to the attachment post on the dorsal midline, and dorsal to the main extent of the bat’s auditory cortex) through one of these holes and remained there for the entire recording session. A high-impedance recording electrode (15–20 MΩ tungsten FHC or custom-made platinum–iridium, courtesy of S. Macknick and G. Blasdel) was inserted into the SC through the second 50 μm hole. This second hole was made in the lower layer of bone overlying the SC after the upper layer was carefully removed using a microblade (3 mm cutting edge; Wever Eye Blade). The recording electrode was lowered using a hydraulic microdrive (Stoelting Co.) mounted on a micromanipulator. The auditory-evoked unit activity was recorded in the intermediate and deep layers of the SC at depths between 50 and 650 μm. During the course of the experiment, additional holes were made in the bone for electrode penetrations and up to seven independent holes could be made in one side of the SC. The SC was surveyed throughout its extent, except for a lateral sector where a major blood sinus overlies the brain tissue. The anterior and posterior borders also were not well explored.
To document recording sites, drawings of the SC on the dorsal surface were made with reference to a 1 mm2 reticule fitted in the right ocular of the surgical microscope, and the alignment of the microscope to roughly the same position over the SC was achieved by measuring the pitch and roll of the microscope with a digital inclinometer and by referring to cranial and vascular landmarks. The head holder and body restraint were set in a fixed position, and care was taken to check that each bat was placed in a consistent position in the apparatus. Using an approach that is standard in bat neurophysiological experiments, the individual maps were pooled to generate a composite map of the SC (Jen et al., 1984; Wong, 1984) (see also O’Neill and Suga, 1982; Dear et al., 1993a,b). Electrolytic lesions also were made at the final recording site by passing a small amount of current (1–2 μA) through the tip of the recording electrode. The bat was then perfused and the brain cut serially at 40 μm before staining with cresyl violet.
Physiological recording and data collection. Physiological recordings were made in awake animals because auditory activity can be severely depressed by anesthesia. The awake animals showed no overt signs of discomfort during the experiments, and auditory activity was elicited reliably. The protocol for the neurophysiological experiments was carried out in accordance with standards established by the U.S. Department of Agriculture Regulations and the Animal Welfare Act, and the Harvard University Faculty of Arts and Sciences Standing Committee on the Use of Animals in Research and Teaching.
Acoustic stimulation of the SC evoked multiunit activity that was correlated with stimulus presentation, but only isolated units that showed well driven and reliable responses were studied. Single units were identified by constancy of amplitude and waveform of the extracellular potential recorded from the electrode and displayed simultaneously on analog and digital oscilloscopes. Further, in some experiments, neural activity was stored on reel-to-reel tape for off-line playback and inspection of the waveform. The neural activity was amplified by a differential amplifier (World Precision Instruments) and bandpass-filtered (300 Hz to 3 kHz; Stanford Research Systems) before being delivered to a custom-built window discriminator set to register a TTL pulse to the data acquisition system (Modular Instruments) for each neural spike exceeding the threshold level set by the experimenter. The software generated on-line raster and peristimulus time (PST)–histogram plots of spike activity that were stored for off-line data processing.
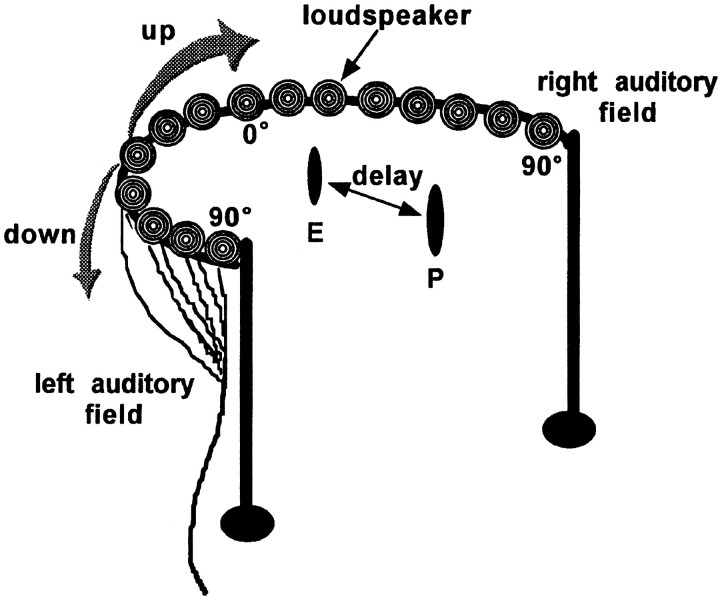
Spatial–acoustic stimulation. Synthetic sonar signals were played to the awake, restrained animal through 15 custom-built ultrasonic loudspeakers arranged ∼13° apart on a foam-covered semicircular hoop of 50 cm radius (Fig. 2). The sounds were broadcast as single-sound stimuli or as pulse–echo pairs in which the two sounds were separated by a time delay. In each of these experiments, the pulse (P), which stands for the bat’s echolocation cry, is not self-produced but is played to the restrained bat (O’Neill and Suga, 1982; Suga and Horikawa, 1986; Wong and Shannon, 1988; Covey, 1993; Dear et al., 1993a,b; Dear and Suga, 1995). The simulated echo (E) is a second, weaker sound, presented with a time delay from the onset of P.
Fig. 2.
Experimental setup for auditory neurophysiology in the SC of the bat showing the arrangement for manipulating the direction and distance of an auditory stimulus during extracellular recording. The bat was placed in the acoustic booth with its head at the edge of the table at a distance of 40 cm from the speaker hoop. All 15 loudspeakers, arranged ∼13° apart in a hemifield, were positioned at an equal distance from the bat and showed similar frequency response profiles (see Materials and Methods). Azimuthal sensitivity was studied by recording neural responses to sounds broadcast through each of the loudspeakers. The speaker hoop was rotated to move the sound source along the vertical axis to test sensitivity to changes in elevation. Target range was simulated using pairs of sounds (P and E) separated by particular delays.
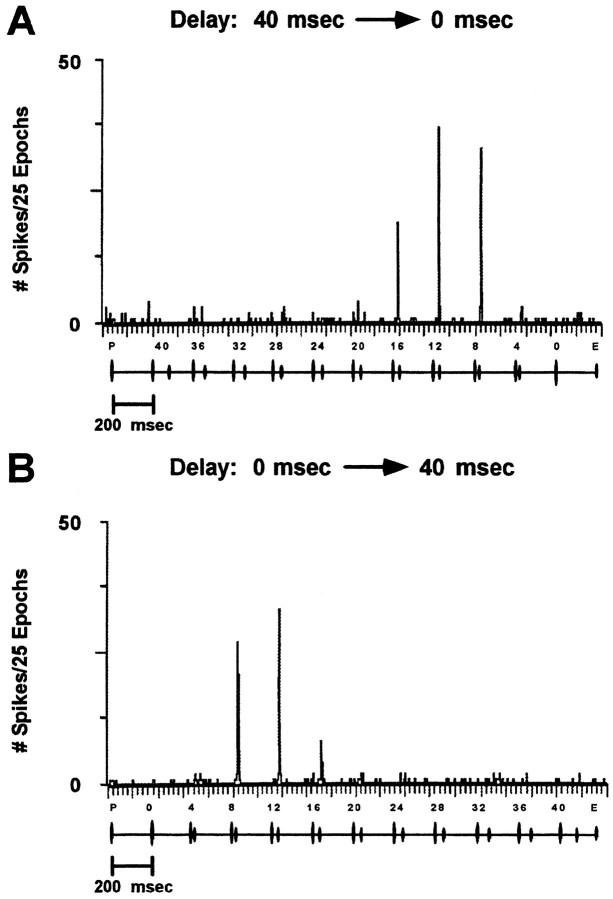
P–E pairs were presented in two distinct stimulus configurations: (1) a fixed delay between a P–E pair repeated over 100 stimulus presentations, and (2) an approach epoch consisting of 11 P–E pairs changing in delay, repeated over 25 stimulus presentations (see abscissa in Fig. 6). The delay values in the approach epoch were presented in 4 msec steps over a period of 2000 msec and typically ranged from 40 msec between the paired sounds down to complete overlap of the signals (P–E separation of 0 msec produced a single sound that was ∼0.9 dB stronger than P alone). For both the fixed delay and the approach stimulus configurations, P and E sounds were presented alone at the beginning and end of each epoch. Stimulus elements (unpaired and paired) were delivered every 200 msec.
Fig. 6.
Selective delay facilitation of a single neuron. PST-histograms for a sequence of P–E pairs in which the delay between sounds became progressively shorter (A, approach/closing distance) or longer (B, increasing distance) over a 2500 msec sequence of sounds. The sounds were broadcast from the speaker evoking the maximum discharge, which in this example, was 13° contralateral. The unit responded to P–E pairs separated by delays ranging from 8 to 16 msec. Note that echo-delay facilitation occurred at the same values of delay for both approach and increasing-distance stimulus epochs. Sound levels for P and E were 84 and 64 dB SPL, respectively.
The computer-generated sounds (RC-Electronics signal generation system operated by Emit software provided by T. Haresign) were two-harmonic hyperbolic FM sweeps, 2 msec in duration, sweeping from 50 to 25 kHz in the first harmonic. P and E stimulus elements were matched in frequency, except in some experiments in which the harmonic composition was modified to present different combinations of the first and second harmonics (see Suga et al., 1983). Frequency bands sweeping from high to low with a bandwidth of 20 kHz and pure tones also were used to explore frequency selectivity. Limited-bandwidth stimuli covering a range of 90 kHz (20–110 kHz) were used to obtain coarse frequency-response profiles (in some cases, responses to stimuli sweeping from 120 to 100 kHz and 30 to 10 kHz also were tested). The frequency response of each speaker, measured using an ACO 1/4 inch microphone and a digital oscilloscope with on-line FFT capability, was flat within 3 dB over the range of 25–80 kHz and similar across all 15 speakers (±2 dB).
P and E were processed along separate channels by the signal generator and were independently manipulated in frequency, intensity, and direction. P and E signals were delivered to separate passive attenuators (Wavetek) and then through a custom-built mixer before being amplified and broadcast from the preselected speaker. E was attenuated 20 dB relative to P, but in some experiments, this relationship was manipulated, e.g., the weaker sound was played first, followed by a louder sound, or the two sounds were made equally loud (see Fig. 5). Sound levels usually were varied in steps of 10 or 5 dB, covering a range from 14 to 84 dB SPL, peak-to-peak (p-p), at the location of the bat’s ears.
Fig. 5.
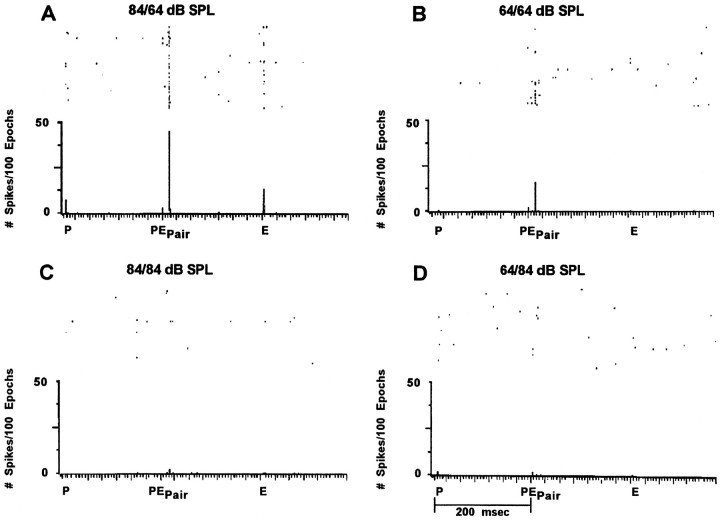
Echo-delay facilitation: level versus temporal position. The effective stimulus that drove the neuron’s response was a P–E pair, separated by 12 msec delay. Reversing the temporal order of the stronger (P) and weaker (E) stimuli eliminated the response. The unit was tested using a fixed delay stimulus epoch broadcast at the preferred direction (64° contralateral). The time between presentation of each stimulus element (single P, P–E pair, single E) was 200 msec.
Data acquisition and analysis. Isolated units were studied and classified according to their responses to simple and complex auditory stimuli, to the location of the stimulus in one, two, or three dimensions of space, and to the sound intensity and frequency characteristics of the stimulus. The experimental approach was first to assess what stimulus would excite the isolated unit and, in particular, whether the unit showed a preferential response to a P–E pair. For units that gave a response suggesting paired-sound facilitation (see below), the sensitivity of this response to particular time intervals between the first (P) and second (E) sounds was examined. The next step was to determine if the echo-delay facilitation response property depended on the direction of the sound source along the horizontal axis or, more generally, to map the azimuthal response profile. Third, the sound level was attenuated to measure the relationship of discharge rate to sound level and to explore the shape and extent of the unit’s spatial response area to changes in stimulus intensity. Fourth, frequency sensitivity was more systematically investigated than was carried out when the unit first was encountered. Fifth, when time permitted the azimuth and delay response area was studied as a function of changing stimulus elevation.
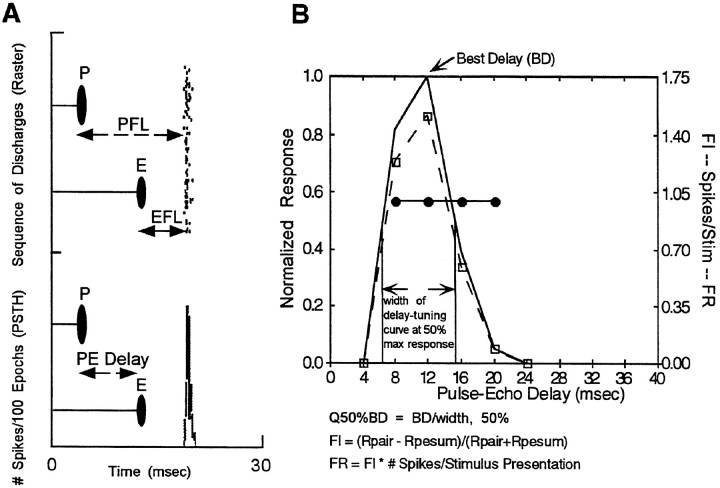
For the approach sequence, spikes were counted in 0.4 msec bins, and for the other stimulus epochs, unpaired sound, or the fixed delay stimulus sequence, spikes were counted in 0.1 msec bins. The latency of the neural response was corrected for the time delay for the signal to travel the distance from the speaker to the ears of the bat and for the delay imposed by the synchronization signal to the data acquisition system, totaling a correction factor of 6.48 msec subtracted from the response latencies. For units that exhibited echo-delay facilitation, the latency of the neural response was expressed in two ways: from the onset of the first stimulus in the pair (pulse facilitation latency, PFL), and from the onset of the second stimulus (echo facilitation latency, EFL) (Sullivan, 1982; Dear et al., 1993b). The timing of impulses with respect to stimulus onset is demonstrated in the raster-dot display of Figure 3A for activity recorded from a single cell in response to a fixed delay stimulus.
Fig. 3.
Analysis of neuronal response properties.A, Response time analysis. The time to the facilitated response can be expressed with respect to the onset of the first stimulus (PFL) or from the onset of the second stimulus (EFL). B, Analysis of delay facilitation:BD (solid line), Q50%BD(arrows indicate response at 50% of maximum),FI (solid line with circle markers),FR (dash–dot line with square markers) (see Materials and Methods). In this example, BD is 12 msec and FR overlaps with the curve showing the number of spikes/stimulus presentation because FI is 1.0.
Spatial response areas were calculated as a best azimuth and a best delay (for the echo-delay sensitive population) and, in a few cases, the auditory receptive field was measured in three dimensions: azimuth, range, and elevation. Azimuth-, range-, and frequency-related responses were assigned a best response (peak), and the best area was defined by the response zone > 50% of the maximum. The normalized response profile plotted as a function of the stimulus variable was examined to classify the response by the shape of this curve. Three response groups were delimited on the basis of the width and number of peaks in the profiles, and units were thus classified as selective, twin-peaked, or broadly facilitated. The same strategy and criteria were applied to response profiles for each stimulus parameter studied: delay, azimuth, and frequency.
The sharpness of delay tuning in the SC was described by a quality factor derived from dividing the peak response by the width of the response at 50% of maximum (Q50%BD; Fig.3B) (Dear et al., 1993b). For the special case of echo-delay facilitation, the magnitude of facilitation was quantified as a ratio or index of facilitation with respect to the sum of responses to each stimulus element (Olsen and Suga, 1991; Dear and Suga, 1995): Facilitation Index (FI) = (RPE-pair − (RP+ RE))/(RPE-pair + RP + RE), where RPE-pair is the number of spikes fired to the pair and RP and RE are the number of impulses elicited from singly presented P and E stimuli in the delay-stimulus epoch, respectively. A delay facilitation response (FR) for each unit was calculated FR = FI × number of spikes fired per stimulus presentation, and the maximum FR was used to assign a value of best delay (BD) to the unit (Fig. 3B) (Suga and O’Neill, 1979).
RESULTS
Auditory responses in the SC of the bat
We report here on the responses of 98 units to acoustic stimulation and show two functional classes of spatially tuned neurons that were distinguished by their sensitivity to delayed echoes presented in pulse–echo pairs: two-dimensional neurons (2D; insensitive to echoes and spatially selective in azimuth and elevation for regions directly in front of the bat’s head or within the contralateral acoustic hemifield) and three-dimensional neurons (3D; echo-sensitive and spatially selective in azimuth and elevation). Each auditory-responsive unit discharged phasically, firing on average one spike per stimulus presentation (see below). No systematic study of other sensory responses was pursued.
Auditory responses in 2D neurons
The neurons termed 2D (n = 66/98) were characterized as echo-insensitive and spatially selective to the horizontal and vertical location of acoustic stimulation. That is, they discharged at their maximum firing rate to unpaired acoustic stimuli arriving from regions of auditory space located within their receptive fields. The horizontal dimension at 0° elevation was tested for each isolated unit, and the stimulus direction evoking the maximum number of impulses was used to assign a value of best azimuth. Responses to the vertical aspect of auditory stimulation also were tested in a subset of cells, and the data support the role of these neurons in encoding auditory space in 2D.
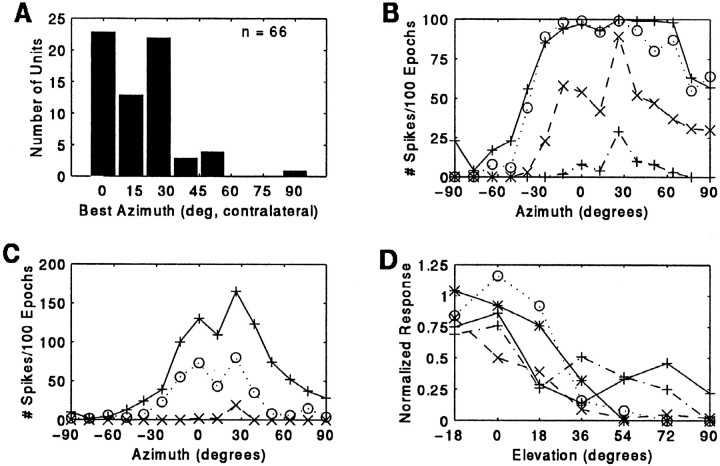
Most 2D units (n = 58/66, 88%) fired maximally to stimuli broadcast from a centrally placed speaker, or from a region extending almost 30° laterally from the midline in the contralateral hemifield (Figure 4A). Only a few units responded maximally to locations peripheral to this region, and none preferred stimuli originating from the ipsilateral hemifield. Within their azimuthal receptive fields (and also in the vertical dimension; see below), echo-insensitivity, or the lack of a facilitated response to paired P–E stimuli, was confirmed for all values of delay presented in the approach epoch.
Fig. 4.
Distribution of best azimuth for single P responses in 2D neurons (A). Representative auditory spatial receptive fields in 2D neurons (B, C). Single sounds were broadcast at 2/sec at various sound levels above the unit’s minimum threshold. The receptive field in B was mapped using a tone stimulus of 24 kHz, 2 msec in duration. This unit also fired strongly to FM sounds. The unit in C was studied using the standard two-harmonic stimulus. Legend: 84 dB SPL, solid line; 74 dB SPL, dotted line; 64 dB SPL, dashed line; 54 dB SPL, dash–dot line. D, Sensitivity to elevation in 2D neurons. Units were tested at their best azimuth, and each curve represents a different unit.
Auditory receptive fields in 2D units were broad within the frontal zone of space. Figure 4, B and C, shows azimuth–response curves for two representative 2D units. The size of each unit’s receptive field broadened at intense sound levels. The azimuthal location eliciting the greatest discharge at the strongest sound level typically continued to evoke peak activity as a function of azimuth as the sound level was attenuated.
To determine whether neurons that are insensitive to delayed echoes originating on the horizon show delay facilitation at some other elevation, the approach epoch was broadcast along the vertical dimension at best azimuth. Elevational responses to the delay stimulus epoch at non-optimal speaker azimuths also were tested.
Neural responses to changes in elevation were recorded in seven 2D neurons. Echo-insensitive (2D) response profiles that were observed at 0° elevation remained echo-insensitive when elevation was varied. However, 2D units were sensitive to changing elevation, discharging most vigorously to single sound stimulation played at 0° elevation and from locations 18° below and above the horizon. Elevations below 18° could not be tested due to physical constraints of our set-up. Neural responses dropped off significantly at elevations greater than 18°. Representative elevation-response profiles are shown in Figure 4d.
Echo-delay facilitation in 3D neurons: range
Echo-delay facilitation, indicating the representation of target range, the third spatial dimension, was demonstrated in approximately one-third (n = 32/98) of the population. Like 2D cells, 3D neurons were sensitive to the horizontal and vertical direction of acoustic stimulation. In addition to 2D spatial sensitivity, 3D neurons were characterized by facilitation to a pair of acoustic signals simulating a sonar emission and a delayed echo. In each 3D unit studied, maximal facilitation was observed when the two sounds in the pair were separated by a particular time interval (see Fig. 3). On average, the maximum number of spikes fired per P–E stimulus was 1.01 ± 0.65 (n = 32 units). The same cells responded poorly or were silent to an unpaired sound stimulus played from the same speaker (0.14 ± 0.23 spikes/stimulus presentation). In contrast, 2D units were maximally driven by an unpaired stimulus (0.92 ± 0.51 spikes/stimulus presentation; n = 66). Figure 12A shows the histogram distribution of the number of impulses elicited per stimulus presentation for the maximum response rates in 2D and 3D populations.
Fig. 12.
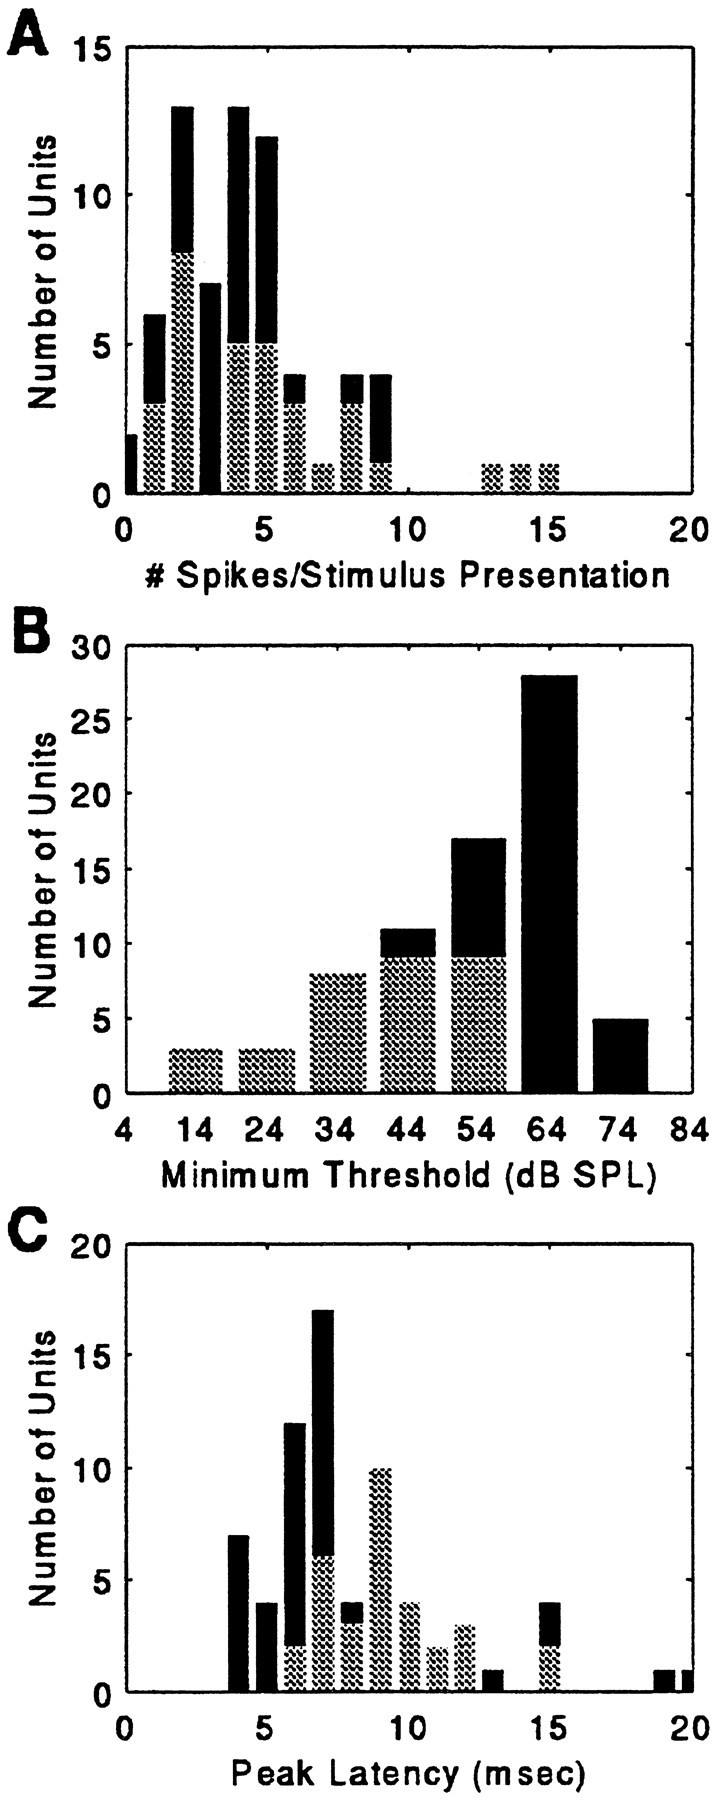
Histogram distribution of the average discharge (A), the distribution of minimum thresholds (B), and the distribution of response latencies (C) for the population of SC neurons (N = 98). Mean discharge and response latency reported here are to an unpaired FM sound, presented singly or as P within a delay-stimulus epoch, and broadcast to the bat from the optimum speaker location at 84 dB SPL. Minimum threshold is the minimum sound level at which 0.08 spikes/stimulus presentation (2 spikes/25 epochs) were recorded. 2D cells are indicated by thelight bars; 3D neurons are shown by the dark bars.
Figure 5 shows the response from a single 3D unit recorded to paired and unpaired sound stimuli. In Figure 5A, unpaired sounds played at 84 dB SPL, p-p (P alone) and 64 dB SPL, p-p (E alone) weakly elicited a response, whereas the paired P–E stimulus at these same sound levels effectively drove the unit. This was true when the sound level attenuations of P and E were made equal at the weaker sound level, although the magnitude of the response was diminished (Figure 5B). When the sounds were both played at a stronger sound level (84/84 dB SPL), or when they were reversed such that the first was 20 dB down from the second, the unit showed no response (Figure 5C,D).
Using the approach epoch, delay selectivity was examined across a range of delay values. An example of a delay-selective response is shown in Figure 6A. The unit discharged when the delay separation between P and E fell between 8 and 20 msec. To determine whether delay selectivity depended on the order in which stimulus pairs were presented, the approach epoch was modified to present the shortest delays before the longer delays in the sequence. As shown in Figure 6B, when the short delay values preceded the longer intervals, the selectivity of the response remained between 8 and 20 msec. Importantly, the unit displayed no response to either P or E played alone.
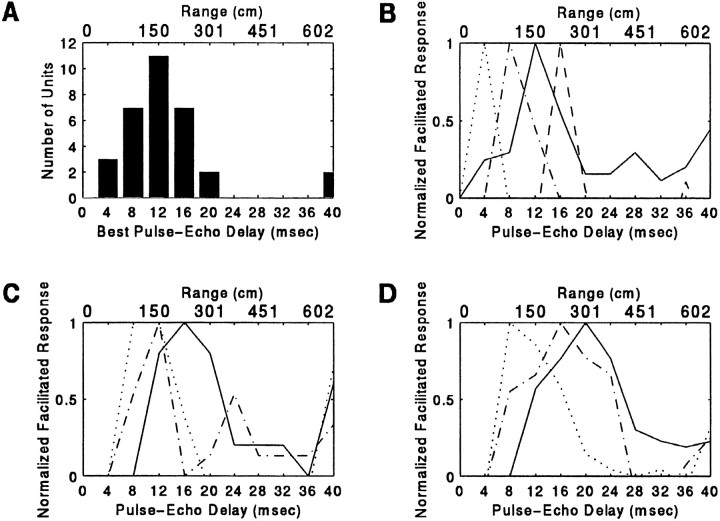
The mean delay value to which delay facilitation (3D) neurons were sensitive was 13.5 ± 8.1 msec (n = 32); this value corresponds to 230 ± 138 cm in range. All but 2 neurons were tuned to best delays between 4 and 20 msec, which corresponds to target ranges from 68 to 340 cm. The other two responded most strongly to a delayed stimulus separated by 40 msec. The distribution of BDs for the population is shown in Figure 7A.
Fig. 7.
Distribution of BDs and delay response profiles in the population of 3D neurons. BDs were between 4 and 40 msec, which corresponds to target ranges of 68–680 cm (1 cm of distance adds 58 μsec to echo delay). The mean BD for the population of 32 units was 13.5 ± 8.1 msec (A). Based on the shape of the delay-response profiles, 3D units were classified as selective (B), twin-peaked (C), or broadly facilitated(D). Individual units are indicated by different line styles.
Although each 3D unit fired maximally to a particular value of delay, the range of delays evoking a weaker facilitated response was sometimes broad. Based on the delay-response profiles, the population of 3D units was classified as selective, twin-peaked, or broadly facilitated. Nineteen of thirty-two units (59%) displayed a single peak of echo delay-facilitated activity along the delay axis and were judged to be range-selective. Range-selective 3D neurons fired maximally to an optimum delay stimulus, and the width of the facilitated response at 50% of the maximum was <12 msec across the 40 msec range of delays that were tested. The other 13 3D units showed a second peak of facilitation along the delay axis (n = 6/32) or responded at a level exceeding 50% of the maximum response over a range of delay values broader than 12 msec (n = 7/32). Table 1 presents the distribution of 3D neurons in these three response profile groups. Representative delay-tuning curves for each response group are shown in Figure 7 (B, selective;C, twin-peaked; D, broadly facilitated).
Table 1.
Spatial tuning
| Delay tuning | Azimuthal tuning | ||||
|---|---|---|---|---|---|
| Selective | Twin-peaked | Broadly facilitated | Undetermined | Total | |
| Selective | 10 /28 (36%) | 2 /28 (7%) | 4 /28 (14%) | 3 /32 | 19 /32 (59%) |
| Twin-peaked | 4 /28 (14%) | 1 /28 (4%) | 0 /28 (0%) | 1 /32 | 6 /32 (19%) |
| Broadly facilitated | 5 /28 (18%) | 1 /28 (4%) | 1 /28 (4%) | 7 /32 (22%) | |
| Total | 19 /28 (68%) | 4 /28 (14%) | 5 /28 (18%) | 4 /32 | |
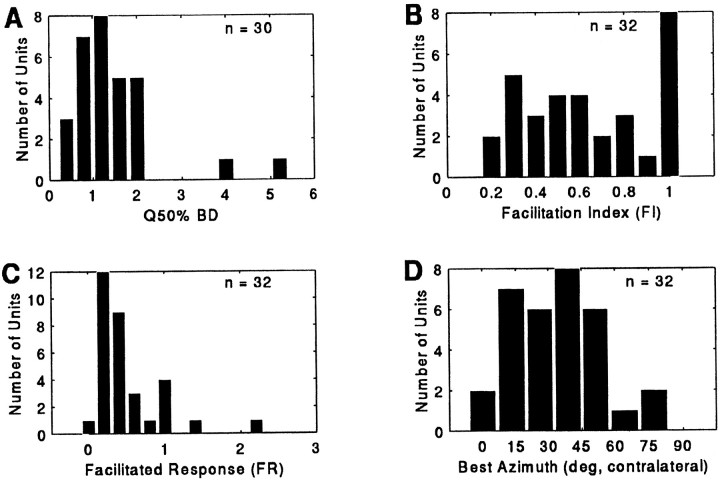
The sharpness of the delay filter, which describes the selectivity of neurons for delay, was quantified by calculating a quality factor (Q50%BD) for the response.Q50%BD values were calculated for units whose BD was ≤40 msec (n = 30/32) and ranged from 0.70 to 5.56, with a mean and SD of 1.68 ± 1.01 (Fig.8A). The individual means for the selective, twin-peaked, and broadly facilitated groups were 1.91 ± 1.16 (n = 17/30) for the selective group, 1.68 ± 0.53 (n = 6/30) for the larger peak of the twin-peaked group, and 1.13 ± 0.56 (n = 7/30) for the group displaying broad or multipeaked echo-delay facilitation.
Fig. 8.
Distribution of Q50%BD(A), FI (B), FR (C), and best azimuth (D) of echo-delay facilitation in 3D neurons.
The magnitude of facilitation quantified by the facilitation index (FI) ranged from 0.21 to 1.00 at the neuron’s best delay, with a mean of 0.67 ± 0.27 (n = 32). As shown in Figure8B, FI for the population was not normally distributed. Rather, 25% of 3D units discharged to a delayed-echo sound pair but not to unpaired sound elements of the delay-stimulus epoch at the optimum speaker location for facilitation (FI = 1.00;n = 8/32). The distribution of FR (FI × discharge rate) values is shown in Figure 8C.
Representation of azimuth, elevation, and target range (delay) in 3D cells
The relationship between echo-delay facilitation and the 2D location of the sound source was studied using the standard approach epoch played from each of the loudspeakers. Every 3D unit showed response dependence on the azimuthal location of the auditory stimulus. Approximately half of the units discharged to free-field stimuli arriving from the contralateral auditory field but were silent when the stimuli (paired and unpaired) came from regions of auditory space ipsilateral to the recording site.
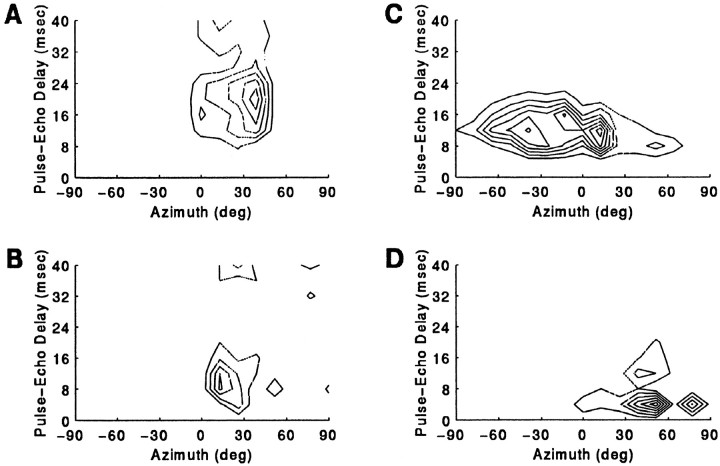
Auditory spatial response areas are clearly seen by plotting a 3D contour for the response to the paired stimulus as a function of azimuth (in degrees) and delay (in msec). The unit whose response pattern is shown in Figure 9A failed to respond to an unpaired stimulus played from anywhere along the horizon but showed a selective response to a simulated P–E stimulus broadcast from within its azimuthal receptive field. Maximum facilitation to echoes occurred when the approach epoch was played from a speaker located 39° contralateral. Weaker facilitation was observed when the epoch was played from speakers near the center, adjacent to the optimal speaker azimuth, and there was little response to stimulation from azimuthal locations peripheral to 39°. The cell responded maximally to 20 msec echo delay, discharging 1.16 spikes per stimulus presentation. FI for the best delay stimulus was 0.87, but the response profile revealed broadly facilitated delay tuning. In a second example (Fig. 9b), another neuron’s response was more narrowly tuned along the dimension of range than it was tuned along the horizontal axis. The response at the unit’s BD, 12 msec, and also at a suboptimum 8 msec delay, was strong within the ipsilateral field, although the locus of maximal activity occurred when the sound was played from 13° contralateral.
Fig. 9.
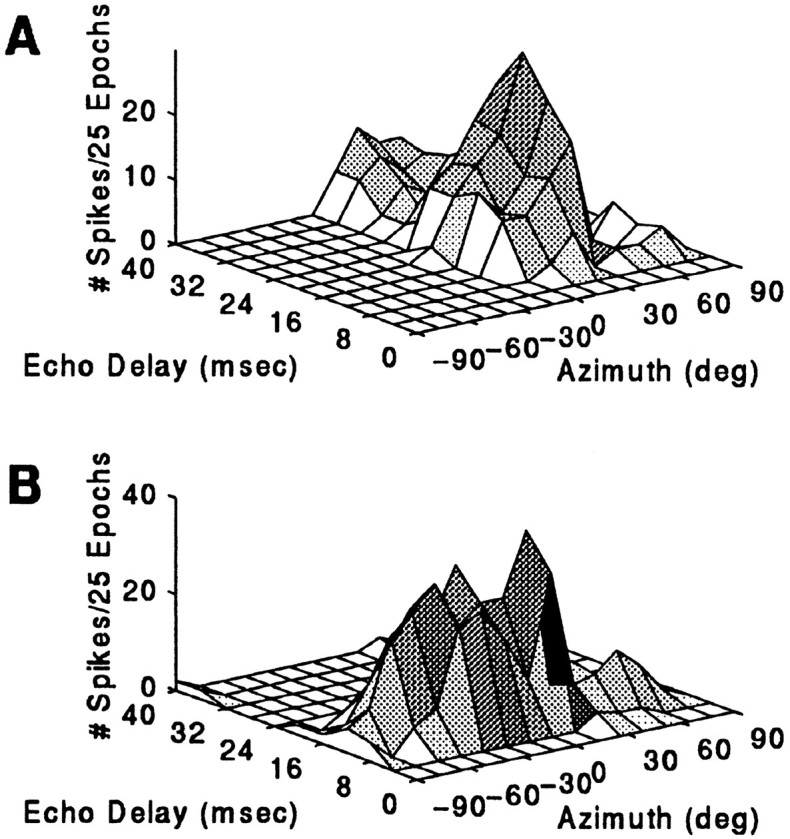
Contour plots showing azimuth-dependent echo-delay facilitation. The response to P–E stimulation is shown for two different single 3D units. Sound levels for P and E were 84 and 64 dB SPL, respectively.
Figure 10 shows contour plots of echo-delay (range) facilitation for 4 different units, but in this figure the plots emphasize the borders rather than the magnitude of the response. Looking down on the response area, two distinct patterns become evident. The first pattern includes units that were more sharply tuned along the horizontal axis than they were tuned in the dimension of delay (A; n = 9/28) and units that were selective for both delay and azimuth (B; n = 10/28). The second pattern found in a small sample (C, D;n = 6/28) shows broad tuning to stimulus azimuth and restricted selectivity to values of delay. Table 1 summarizes the distribution of 3D units into selective, twin-peaked, and broadly facilitated response categories. The distribution of best horizontal location for delay facilitation (Fig. 8D) indicates that 3D neurons preferentially responded to sounds broadcast from a region of space 13° to 51° contralateral to the midline. In contrast, the histogram of directional responses in 2D units showed a central-field distribution (Fig. 4A).
Fig. 10.
Contour plots showing the boundaries of azimuth-delay selectivity in four different 3D neurons. Aand B show examples of unit responses to P–E pairs that were selective for the direction of the sound source, whereas inC and D the responses were more selective to range (delay) than they were to echo azimuth.
Echo-sensitive neural responses to three-dimensions of auditory space were studied in two 3D neurons for 32 contralateral speaker locations. Figure 11 shows auditory receptive fields in elevation and delay (range) at 13° contralateral, the azimuth for peak echo-delay facilitation (A), and at 26° contralateral (B). Peak facilitation was observed at 0° elevation and also within regions above and below the horizon (±18°). At 26° azimuth, the delay-response profile as a function of elevation showed broad sensitivity. A discharge to P alone, presented at the beginning of each approach epoch, occurred when P was played from the periphery of the superior auditory field (data not shown). Peripheral single-sound responses also were noted when the neural response was tested as a function of changing azimuth (see below). Thus, the 3D receptive field for this unit may be described as showing broadly facilitated echo-delay (range) responses in the contralateral midfield of auditory space. This zone of echo sensitivity was flanked above and laterally by a region in which responses to single sounds were stronger.
Fig. 11.
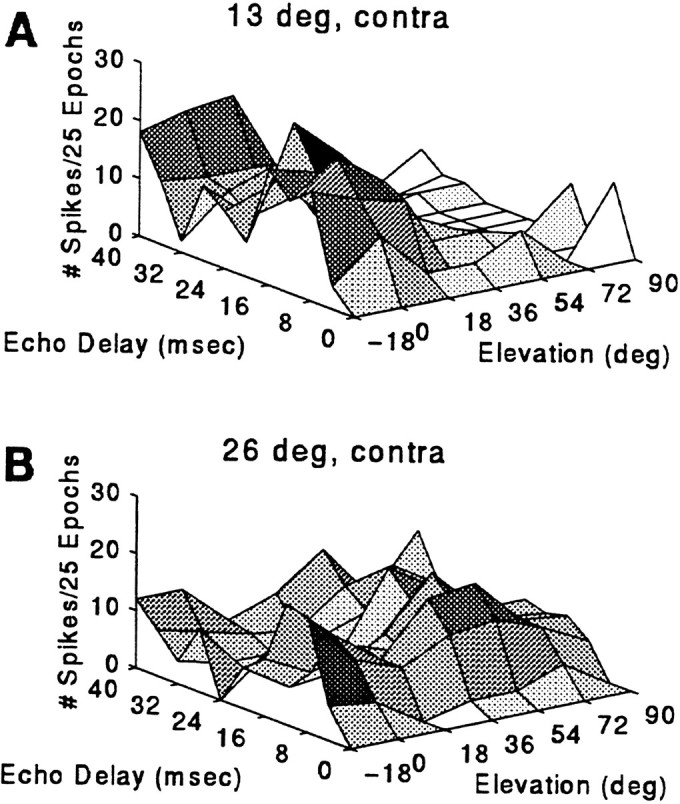
Contour plot of the response to P–E presentation as a function of delay and speaker elevation at 13° (A) and 26° (B) contralateral. Sound levels for P and E were 84 and 64 dB SPL.
Sound sensitivity and spatial response properties of 2D and 3D neurons
For the total population, minimum response thresholds for a stimulus broadcast from a unit’s preferred direction ranged from ∼14–74 dB SPL, with most thresholds falling between 34 and 64 dB SPL (Fig. 12B). The average minimum response threshold in the 2D population was ∼20 dB higher than that in the 3D population (2D neurons: 57 ± 11 dB SPL,n = 66; 3D neurons: 40 ± 13 dB SPL,n = 32). In half of the 2D population, the minimum sound level for eliciting a response was between 64 and 74 dB SPL. The remaining neurons exhibited lower minimum thresholds for evoking responses, although only 5 of the 66 2D cells studied fired impulses at sound levels weaker than 34 dB SPL.
Rate–level functions were obtained for SC units using single FM sounds. Rate-level curves in 2D units largely were monotonic functions over the range of sound levels studied, with the greatest number of discharges evoked by the strongest level of stimulation. Figure13A displays rate–level curves for 7 different 2D units. In contrast, nearly every 3D unit responded nonmonotonically to changing amplitude (Fig. 13B,C). The shape of the rate–level curves suggests that upper and lower thresholds bracket the response areas for 3D units. However, an upper threshold was not always obtained, because there existed an upper limit to the amplitude that could be broadcast from the loudspeaker without the sound showing distortion; rather, a decline in the number of discharges was recorded for intense and for very weak sounds with the maximum response at some intermediate sound level. For most 3D neurons, the echo sound level producing the greatest level of facilitation was ∼64 dB SPL. Attenuating or increasing the intensity of paired stimuli from the sound level that evoked the maximum response either had little effect or weakened the magnitude of the facilitated response.
Fig. 13.
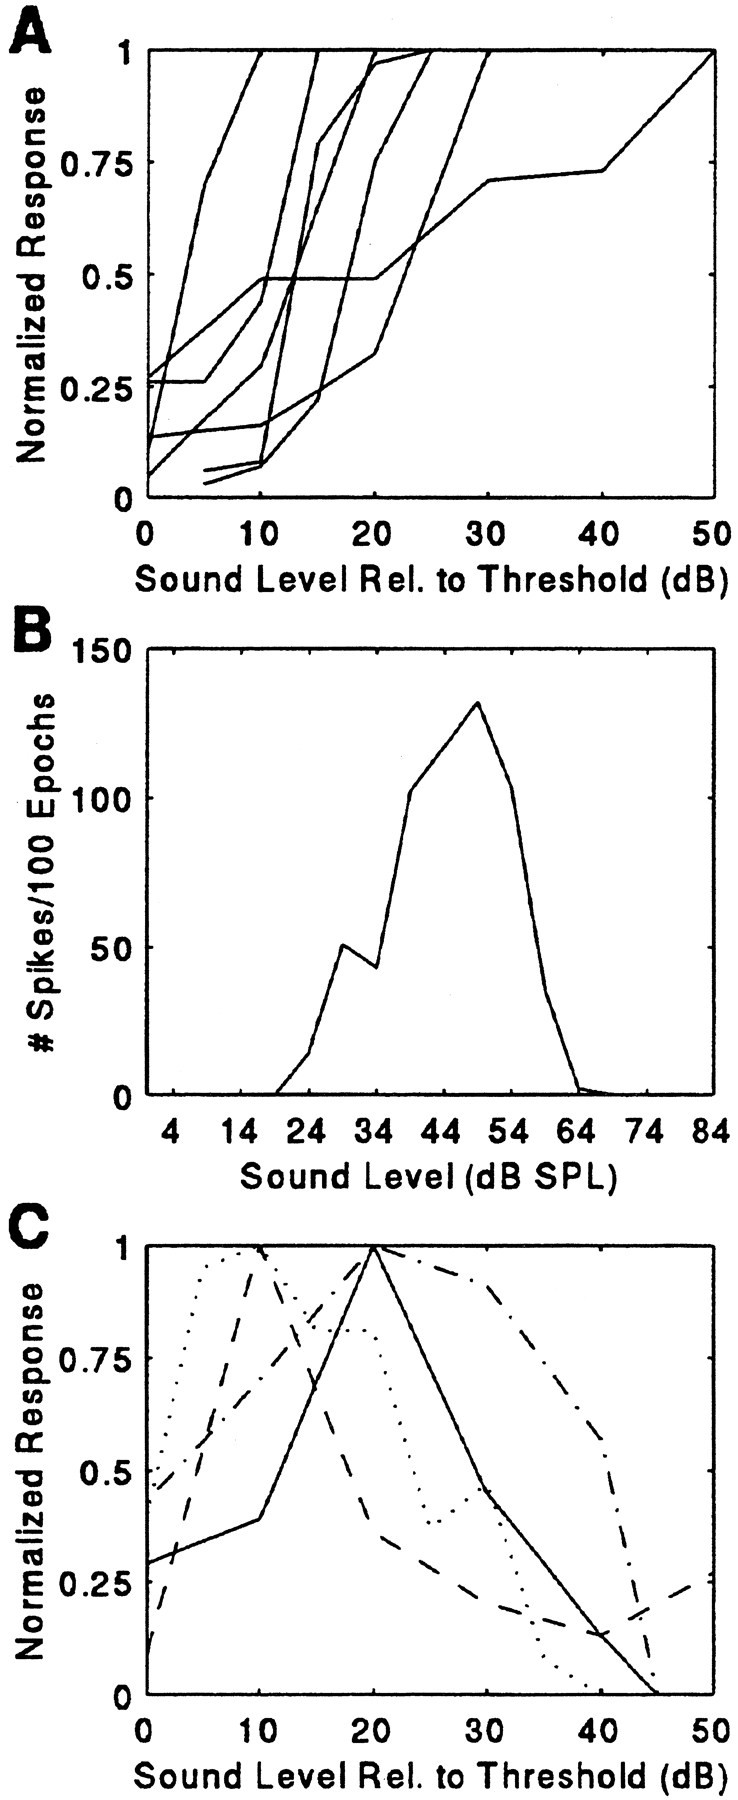
Representative rate–intensity curves for 2D (A) and 3D (B, C) neurons.B, Response to a single P stimulus broadcast from 26° contralateral in a 3D neuron. The curve shows a nonmonotonic function; the unit’s response has both an upper and a lower threshold. InA and C, each curve represents a different unit.
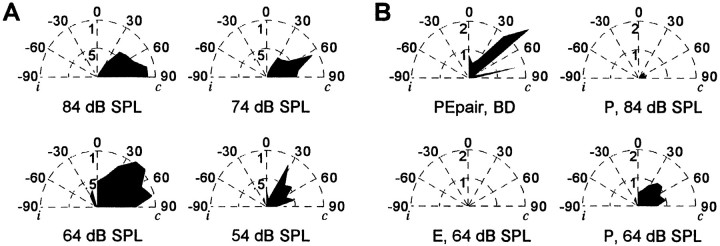
In 3D units in which responses to P stimuli presented in the unpaired sound epoch were systematically investigated (n = 23/32), spatial tuning in azimuth was different for echo-delay facilitation and single P responses. In these cells, the echo-sensitive receptive field was flanked peripherally by a region of space in which a single P evoked a response. In 22 of these 23 3D neurons, the directionality of echo-delay-facilitated and non-delay-facilitated responses changed as a function of sound level. Attenuating the level of P led to a systematic shift in azimuthal sensitivity to the single sound from the periphery toward center space (Fig.14A). A detailed study of this response characteristic was carried out for seven 3D units that exhibited reliable responses to unpaired sound stimulation. This spatial response characteristic was demonstrated qualitatively in the remaining 16 single-sound-responsive cells.
Fig. 14.
Set of hemifield polar plots of the response to a single pulse (unpaired sound epoch) as a function of azimuth for four different sound levels (A). Activity plotted is to a single-sound broadcast at a rate of 2 Hz through each speaker at four different sound levels (84, 74, 64, and 54 dB SPL). Note the azimuthal position evoking the maximum response shifts from the periphery to a more central location as the sound level is attenuated. B, Set of hemifield polar plots of the azimuthal response profile to single-sound elements and to the paired echo at BD (4 msec) of the fixed-delay epoch. The response to the single P (unpaired sound epoch) at the same sound level as the paired echo (64 dB SPL) is also shown (bottom right plot). Note that the magnitude of the responses to unpaired stimuli is significantly less than the response to the paired echo, even at the same level of acoustic stimulation.i, Ipsilateral auditory space; c, contralateral auditory space.
The first set of polar plots (Fig. 14A) represents the shifting selectivity to the direction of single-sound stimulation. The maximum response was elicited by a single sound played at 64 dB SPL, and the rate–level relationship was nonmonotonic. The neuron also fired strongly to stimulation at sound levels of 84, 74, and 54 dB SPL. At 84 dB SPL, the peak of spatial selectivity was peripheral to the frontal interaural plane of the bat, at 90° contralateral. When the sound level was attenuated to 74 dB SPL, the peak response was to sound broadcast from a speaker placed 64° contralaterally. At 64 dB SPL, the unit was maximally driven by sound arriving over a broad region extending from 77° in the periphery to 26° contralateral. A stimulus of 54 dB SPL excited the cell when the sound was played from the speaker at 26°.
In this example, single-sound stimulation at a rate of 2/sec maximally evoked 1.06 spikes per stimulus presentation at 51° and 64 dB SPL. Echo-delay facilitation also was greatest at this combination of azimuth and intensity. However, the unit fired more than twice as many spikes per stimulus presentation to the P–E stimulus at BD (2.68 spikes/stimulus presentation, BD = 4 msec). Further, the magnitude of the response to the unpaired sounds broadcast during the fixed delay trial was 0.16 spikes/stimulation for P alone (84 dB SPL) and 0.00 spikes/stimulus presentation for E alone (64 dB SPL). Figure14B is a set of polar plots of the azimuthal selectivity of the echo-delay facilitated response at BD, and the response to the single P (unpaired stimulus epoch; bottom right) at 64 dB SPL also has been plotted. This representation shows clearly that the neuron’s firing was maximally driven by delayed echo stimuli. Differences in stimulus repetition rate may account for differences in the magnitude of the responses to unpaired stimuli presented in the single-sound epoch (B, bottom right) and in the delay epoch (B, top rightand bottom left).
Temporal processing in the SC
The mean discharge latency for the total population of SC units studied was 8.9 ± 3.2 msec, ranging from a minimum of 4.1 msec to a maximum of 21.9 msec (Fig. 12C). This value expresses the peak latency to an unpaired P stimulus of 84 dB SPL played at the unit’s best azimuth. 3D units responded with a slightly longer latency than the 2D population for the same stimulus (3D: 9.7 ± 2.3 msec,n = 32; 2D: 8.5 ± 3.4 msec, n = 66). In 3D units, two measures of latency were calculated (see Fig. 3). PFL for the paired stimulus responses ranged from 11.9 to 32 msec, with a mean of 21.9 ± 4.7 msec (n = 30; BD ± 40 msec); the average EFL for the same units was 10.2 ± 3.2 msec, ranging from 4.0 to 22.2 msec (Fig.15A).
Fig. 15.
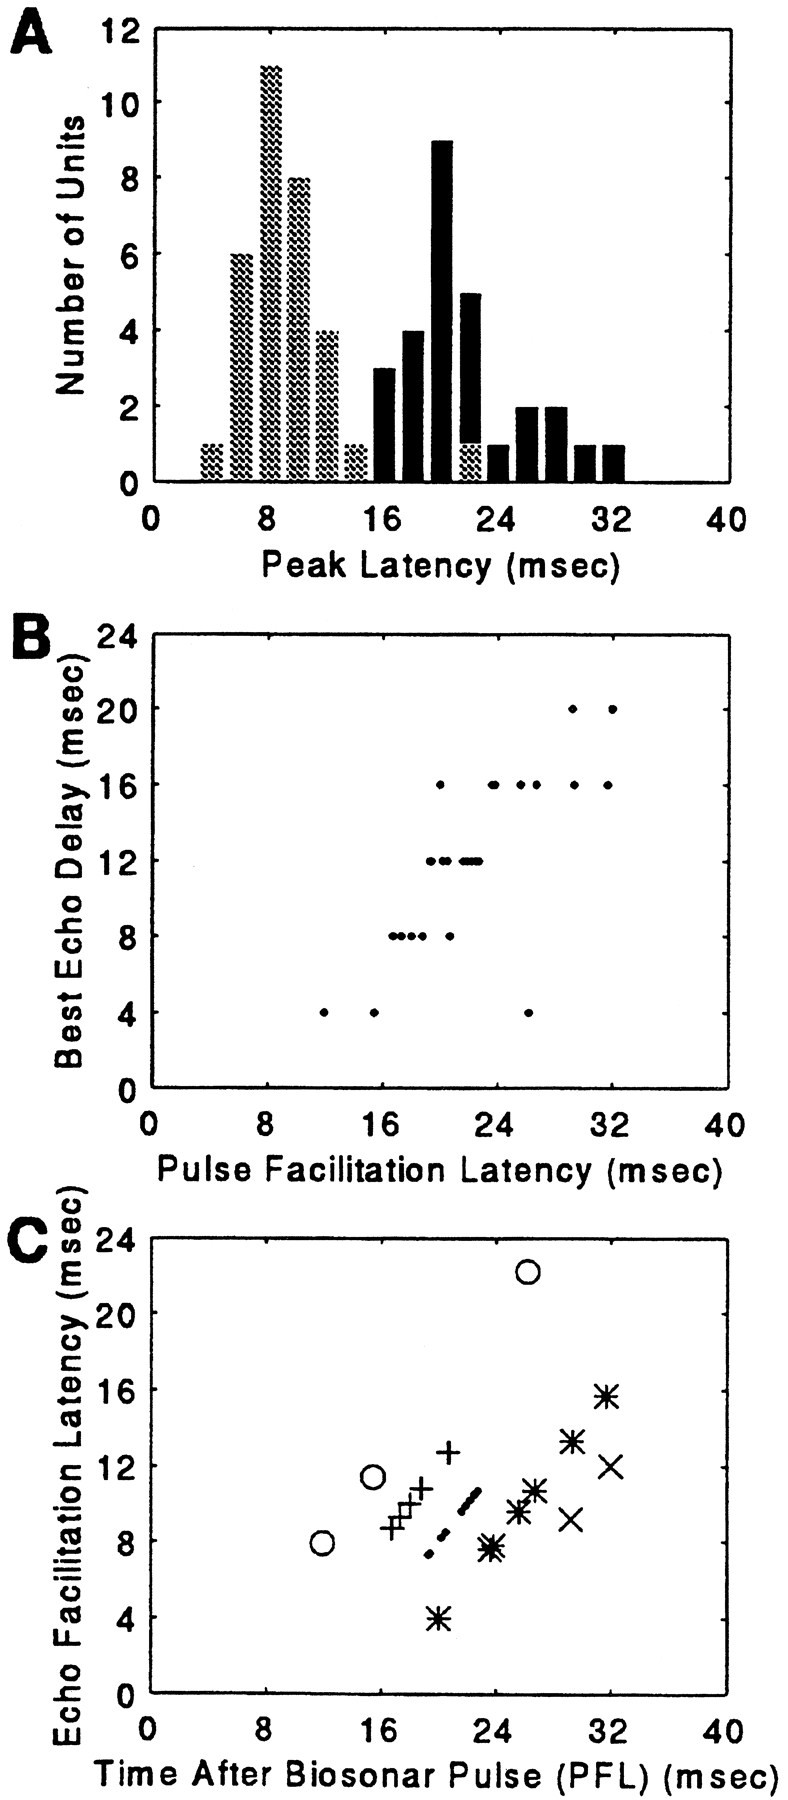
A, The distribution of P and E facilitation latencies. The light bars are EFLs, and thedark bars correspond to PFLs. B, PFL at BD for the population of 3D neurons. C, EFL is plotted as a function of PFL. Each symbol indicates the distribution of latencies for the population segregated by BD. ○, 4 msec BD; +, 8 msec BD; ·, 12 msec BD; *, 16 msec BD; ×, 20 msec BD.
EFL for the paired-sound response (10.2 ± 3.2 msec) was slightly longer than the latency to P stimuli (9.0 ± 2.9 msec), and the variablity in the response of a given neuron was smaller than the bin width of 400 μsec. The small shift in the average latency follows the time–intensity trading relationship described for most other auditory neurons, with a stronger sound evoking a discharge with a shorter latency than a weaker sound (Pollak, 1988; Simmons et al., 1990;Burkard and Moss, 1994). No evidence of paradoxical latency shifts in 3D neurons was observed (see Sullivan, 1982), i.e., the response latency to the stronger pulse was not delayed with respect to the response latency to the weaker echo.
The relationship between latency and best echo delay is shown in Figure15. BD, determined with a 4 msec resolution, was highly correlated with PFL (r = 0.76; Fig. 15B). Presuming that the stronger, first sound is encoded by the bat’s nervous system as its own sonar emission, PFL is a measure of the time-of-occurrence of the facilitated response to a returning echo after a sonar vocalization. The highly linear relationship between BD and vocalization (PFL) latency suggests that echoes arriving at the bat’s ears are processed sequentially along the axis of echo delay, or target range, by 3D cells. Although facilitated responses of 3D neurons were time-locked to the first sound (the emitted pulse), there was a small positive latency shift from that predicted by the timing of the first pulse alone in cells tuned to shorter delays. Figure 15C plots EFL as a function of the time after a biosonar pulse (PFL). Latency progressively increases after a biosonar pulse, but the overlap of activity at each point in time indicates that neurons tuned to different best delays may discharge at the same time (Dear et al., 1993b). That is, 3D neurons with different BDs may be simultaneously active as a function of their delay selectivity and their EFL.
Frequency sensitivity in 2D and 3D neurons
Frequency–response characteristics were explored in 67 of 98 cells by modifying the harmonic composition of the stimulus or by presenting FM sweeps of a limited bandwidth. Thirty-one neurons (n = 16/32 3D units, 15/66 2D units) were examined using only the standard two-harmonic stimulus.
Using FM stimuli of limited bandwidth, sensitivity to particular frequency bandwidths was found in 36 2D and 7 3D units. Twenty-three percent (n = 10/43) of the cells discharged most vigorously to an FM signal sweeping from 90 to 70 kHz. Another 33% preferred a different bandwidth within the frequency range of the second-harmonic (100 to 50 kHz). The remaining 44% responded best to stimulation corresponding to the fundamental frequencies of the bat’s sonar pulse (50 to 25 kHz).
Topography of 2D and 3D neurons in the SC
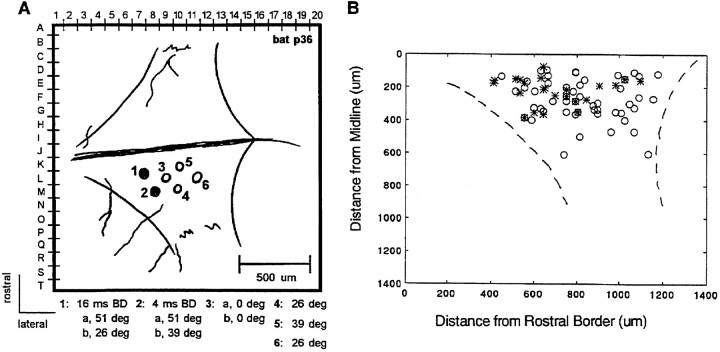
Figure 16A shows a map of the electrode penetrations made in the left SC of a single bat (p36). 3D responses were recorded from the two most anterior penetrations (#1 and #2), whereas 2D responses were found at intermediate and caudal sites (#3, #4, #5, #6). Indicated on the figure are the values of delay and azimuth to which each unit was maximally responsive. The map of the structure in an individual bat hints at a topographic organization that was also observed in the analysis of the composite map of all unit responses. 3D neurons were found in anterior half and near the midline, whereas the 2D units were found throughout the extent of the SC. In the population of 2D units studied in bat p36 (n = 5), neurons selective for the centrally placed speaker (0°) were located anterior to units preferring more peripheral directions, although clearly documenting an orderly map of azimuthal space in the bat’s SC would require additional experiments.
Fig. 16.
Topography of neural responses. A, Map of electrode penetration sites in the left SC of one bat (p36). The numbers indicate the order in which the sites were sampled. B, Location of 2D (open symbol) and 3D units (asterisks) on the dorsal surface of the SC.
Figure 16B is a composite plot of the recording sites. Twenty-one neurons were recorded in the right SC, but to examine the topographic organization in the population, the locations of these sites were added to the map of the left SC. The graph plots the rostro-caudal and medio-lateral positions of the recording sites, and an outline of the SC has been added to the figure.
As suggested by the map of responses in individual bats, 3D units were found rostral and medial in the SC. The two classes of units overlapped in the anterior half of the SC, but in the midcaudal–lateral region, only 2D responses were observed. 2D and 3D neurons did not appear to segregate into different laminae.
The properties of 2D and 3D neurons were analyzed with respect to the composite map of recording sites. In agreement with previous findings in the echolocating bat (Jen et al., 1984; Poussin and Schlegel, 1984;Wong, 1984), a map of azimuthal space in the SC was not evident in the population of 2D units. The best azimuth for echo-delay facilitation and the best delay value in 3D neurons also did not map systematically in the SC. Quantitative measures of the delay facilitation response, such as Q50% BD, FI, and FR, did not show a clear pattern associated with the location of the recording site. An analysis of response latencies offers only a hint of a map in the SC that corresponds to the time after a biosonar emission: for a subpopulation of SC neurons with BD = 12 msec, those firing with a shorter EFL were found closer to the midline.
DISCUSSION
Properties of 2D and 3D neurons in the bat SC
Two neuronal populations in the SC of the echolocating bat,Eptesicus fuscus, were distinguished by their sensitivity to synthetic echoes and to the spatial location of auditory stimulation. 2D neurons, which were echo-insensitive and responded to auditory stimuli arriving predominantly from a central region of space, comprised 67% of the population. They discharged phasically to presentations of single, loud FM signals and did not exhibit selective firing to P–E pairs broadcast from any spatial locus. SC neurons with 2D auditory spatial tuning have been reported in the bat (Jen et al., 1984; Poussin and Schlegel, 1984; Wong, 1984) and in many other species (e.g., cat: Wise and Irvine, 1983; Middlebrooks and Knudsen, 1984; guinea pig: King and Palmer, 1983; barn owl: Knudsen, 1982). In these studies, 2D acoustic neurons were classified as frontal, hemifield, axial, or unidirectional to reflect differences in the location and sharpness of spatial tuning. Consistent with these findings, the majority of 2D cells in the current study showed spatially selective responses for regions in front of the animal’s interaural plane, monotonic rate–level functions, high minimum response thresholds, and receptive fields that generally increased with increasing stimulus intensity.
A class of 3D neurons (33%) was distinguished by a facilitated response to paired acoustic stimuli that represented a sonar emission and a returning echo. Echo sensitivity in 3D neurons depended on both the time interval separating P and E signals and the 2D location of the sounds, indicating that these cells may encode the spatial locus of an acoustic object in coordinates of range, azimuth, and elevation. Although echo-delay facilitation has been observed in the bat’s auditory cortex, in thalamus, and in several structures of the brainstem (see below), the current study is the first to demonstrate echo-delay facilitation in the SC, where a representation of target range that is coupled to the dimensions of azimuth and elevation may be used to guide acoustic orientation by sonar.
Neurophysiological and anatomical considerations
The map of 2D auditory space in the bat’s SC is not highly topographic (see also Jen et al., 1984; Poussin and Schlegel, 1984), and a majority of directional (2D) neurons are tuned to best azimuths spanning from the center to 30–40° in the contralateral hemifield (see Figure 4A) (Jen et al., 1984; Wong, 1984).Poussin and Schlegel (1984) reported 2D-type neurons with broad receptive fields that extended 90° to 120° in azimuth and 60° to 120° in elevation. Most of these broadly tuned neurons displayed a constant best azimuth for changing levels of sound amplitude. A subset of their sample showed a systematic shift in azimuthal sensitivity from the periphery toward center space as the sound level was attenuated. This response property was called pluridirectional to distinguish units exhibiting amplitude-dependent shifts in azimuthal tuning from those that showed azimuth-stable responses to changing amplitude (unidirectional). In the current study, using simulated emissions and delayed echoes as stimuli, we found pluridirectional response profiles in delay-facilitated, 3D neurons (see Fig. 14). The coupling of these response properties suggests that the spatial zone of echo sensitivity in cells with 3D receptive fields is flanked laterally and above by regions in which responses to echoes are suppressed.
The anatomical connections of the SC with the brainstem and cortex (Covey et al., 1987; Cassedy et al., 1989) suggest that the SC functions to intergrate spatial acoustic information from several auditory structures with signals that convey appropriate audiomotor responses to the motor system. Echo-delay facilitation has been demonstrated previously in several species of bat and in several structures of the ascending auditory pathway, including dorsal nucleus of the lateral lemniscus (DNLL) (Covey, 1993), intertectal nucleus (ITN) (Feng et al., 1978; Dear and Suga, 1995), inferior colliculus (IC) (Mittmann and Wenstrup, 1994; Yan and Suga, 1996), medial geniculate body (MGB) (Olsen and Suga, 1991), and auditory cortex (AC) (Suga and O’Neill, 1979; Wong and Shannon, 1988; Dear et al., 1993a,b). Comparing the mean neural response latencies across structures studied in Eptesicus fuscus, the time to firing in the SC (2D: 8.5 ± 3.4 msec; 3D: 9.7 ± 2.3 msec) falls between the average latencies reported for DNLL (7.8 ± 3.5 msec;Covey, 1993) and AC (non-delay-tuned: 13.8 ± 5.7 msec; delay-tuned: 12.1 ± 5.5 msec, Dear et al., 1993b), although the overlap with the brainstem nucleus is considerable. The DNLL is thought to function as a link between the binaural system that processes spatial-acoustic information and the orientation system (Covey, 1993). Spatially selective delay facilitation in the SC may be influenced by inputs from DNLL, as well as from IC and cortex.
In contrast to the sharply delay-tuned responses observed in the MGB (Olsen and Suga, 1991) and AC of the mustache bat (Suga and Horikawa, 1986), delay-facilitated neurons in SC and other structures ofEptesicus (DNLL: Covey, 1993; ITN: Dear and Suga, 1995; AC:Dear et al., 1993a) are broadly tuned along the range axis. In the mustache bat, thalamic and cortical delay-sensitive neurons respond predominantly to delay values corresponding to close target ranges, typically between 14 and 140 cm, although BDs for ranges up to 400 cm also were reported (Suga and Horikawa, 1986). The distribution of BDs in the AC of FM bats, Eptesicus and Myotis, also covers close target ranges (Wong and Shannon, 1988; Dear et al., 1993b). In the SC and in the brainstem, the greatest representation was found for best delays between 8 and 16 msec, corresponding to 140–280 cm in range.
The directional sensitivity of range facilitation found in the current study is a property that may represent a functional specialization of the bat’s SC, where azimuthal, elevational, and distance cues may converge to guide perceptually driven orientation and vocalization responses. Delay-tuned neurons in the AC of the mustache bat do not show a strong directional preference for echo-delay stimuli and respond most strongly to sound delivered from the center of space (Suga et al., 1990). In most experiments, however, the direction of the P–E stimulus is not varied from a center position; thus, it is not known whether 3D sonar sensitivity is a property expressed in the delay-tuned neurons of other auditory structures.
Functional and experimental considerations
An important consideration is whether a synthetic P–E stimulus effectively mimics a sonar emission and a returning echo. In AC, single-unit responses to simulated P–E stimuli and to self-produced emissions triggering playback of delayed echoes were shown to be identical, whereas self-produced vocalizations in the absence of returning echoes failed to elicit firing from the same unit (Kawasaki et al., 1988). In the SC, feedback from self-produced emissions may contribute to mechanisms of integrating sensory information with motor error signals that encode the characteristics of orienting responses. In the current study, several lines of evidence support the use of a paired-sound stimulus as an effective substitute for a self-emitted pulse and a returning echo. The delay-tuning properties and the values of range that are represented are both physiological and behaviorally relevant; responses to paired and unpaired stimuli are selective and directional, and dependent on the temporal order of P and E signals. Further, the 200 msec time separation between paired and unpaired elements in stimulus epochs is 100 times longer than the aural integration time of Eptesicus fuscus (Surlykke and Bojesen, 1996), and thus it is highly unlikely that the sound energy of signals separated by 200 msec would sum or be processed as delayed echoes of the initial unpaired pulse. Moreover, 200 msec corresponds to 34.5 m, a distance nearly 7 times the normal operating range of the bat’s sonar system (Griffin, 1958; Kick, 1982). This indicates that the sound elements within a stimulus epoch are each encoded as separate neural events. The single-sound elements thus serve as important control stimuli for demonstrating delay facilitation, which is a selective response to a paired-signal stimulus.
Behavioral relevance
The architecture of the SC in the bat suggests a 2D spatial construct within which neurons tuned to three dimensions may interact to direct motor output (vocal and orientation responses) appropriate for both the bat’s position and distance relative to the target. 2D cells may function to direct the aim of the head and pinnae to a desired position. The activity of 3D neurons may be to coordinate the reception of echo information with vocalizations and movements of the head and ears over a closing dimension of range. Given the operating range suggested by the distribution of BDs in the SC, 3D neurons may function particularly during the approach sequence of insect pursuit when the bat is between 1 and 2 m from the target (Kick and Simmons, 1984). In support of a role for the SC in approach-tracking behavior, we have shown that microstimulation elicits movements of the head and pinnae coupled to the production of sonar vocalizations (Valentine and Moss, 1997) (see also Schuller and Radtke-Schuller, 1990). The directional control of vocal behavior along an axis of closing distance is an integral part of the bat’s acoustic orientation, and our single-unit and microstimulation data fit the general notion that the SC is involved in coordinating species-specific orienting behaviors.
Footnotes
This research was supported by a National Science Foundation Young Investigator Award (IBN-9258255), a Whitehall Foundation Grant (J92-10), and Milton funds awarded to C.F.M., and a Sackler Programme grant to D.E.V. We thank T. Haresign for writing the computer software used for generating our acoustic stimuli and C. Hines for modifying the program to allow us to switch the direction of the sound source. We also thank L. Miller for providing us with a prototype and materials to build our ultrasonic loudspeakers, and M. Zagaeski, J. Wadsworth, A. Grossetête, R. Iannucci, and L. Taft for technical assistance. We gratefully acknowledge S. Dear for his assistance with preparing a set of reference series of histological sections of the bat’s brain and for his helpful advice. We also thank U. Dräger and B. Burkard for their advice and two anonymous reviewers for their constructive comments on the manuscript. LeCroy Instruments generously donated the FFT software used for speaker calibration.
Correspondence should be addressed to Cynthia F. Moss at her current address: Department of Psychology, University of Maryland, College Park, MD 20742.
REFERENCES
- 1.Burkard R, Moss CF. The brain-stem auditory-evoked response in the big brown bat (Eptesicus fuscus) to clicks and frequency-modulated sweeps. J Acoust Soc Am. 1994;96:801–810. doi: 10.1121/1.410318. [DOI] [PubMed] [Google Scholar]
- 2.Casseday JH, Kobler JB, Isbey SF, Covey E. Central acoustic tract in an echolocating bat: an extralemniscal auditory pathway to the thalamus. J Comp Neurol. 1989;287:247–259. doi: 10.1002/cne.902870208. [DOI] [PubMed] [Google Scholar]
- 3.Covey E. Response properties of single units in the dorsal nucleus of the lateral lemniscus and paralemniscal zone of an echolocating bat. J Neurophysiol. 1993;69:842–859. doi: 10.1152/jn.1993.69.3.842. [DOI] [PubMed] [Google Scholar]
- 4.Covey E, Hall WC, Kobler JB. Subcortical connections of the superior colliculus in the mustache bat, Pteronotus parnellii. J Comp Neurol. 1987;263:179–197. doi: 10.1002/cne.902630203. [DOI] [PubMed] [Google Scholar]
- 5.Dear SP, Suga N. Delay-tuned neurons in the midbrain of the big brown bat. J Neurophysiol. 1995;73:1084–1100. doi: 10.1152/jn.1995.73.3.1084. [DOI] [PubMed] [Google Scholar]
- 6.Dear SP, Fritz J, Haresign T, Ferragamo M, Simmons JA. Tonotopic and functional organization in the auditory cortex of the big brown bat, Eptesicus fuscus. J Neurophysiol. 1993a;70:1988–2009. doi: 10.1152/jn.1993.70.5.1988. [DOI] [PubMed] [Google Scholar]
- 7.Dear SP, Simmons JA, Fritz J. A possible neuronal basis for representation of acoustic scenes in auditory cortex of the big brown bat. Nature. 1993b;364:620–623. doi: 10.1038/364620a0. [DOI] [PubMed] [Google Scholar]
- 8.Du Lac S, Knudsen EI. Neural maps of head movement vector and speed in the optic tectum of the barn owl. J Neurophysiol. 1990;63:131–146. doi: 10.1152/jn.1990.63.1.131. [DOI] [PubMed] [Google Scholar]
- 9.Feng AS, Simmons JA, Kick SA. Echo detection and target-ranging neurons in the auditory system of the bat Eptesicus fuscus. Science. 1978;202:645–648. doi: 10.1126/science.705350. [DOI] [PubMed] [Google Scholar]
- 10.Griffin DR. Listening in the dark. Yale UP; New Haven, CT: 1958. [Google Scholar]
- 11.Grobstein P. Between the retinotectal projection and directed movement: topography of a sensorimotor interface. Brain Behav Evol. 1988;31:34–48. doi: 10.1159/000116574. [DOI] [PubMed] [Google Scholar]
- 12.Hartline PH, Kass L, Loop MS. Merging of modalities in the optic tectum: infrared and visual integration in rattlesnakes. Science. 1978;199:1225–1229. doi: 10.1126/science.628839. [DOI] [PubMed] [Google Scholar]
- 13.Hartridge H. Acoustic control in the flight of bats. Nature. 1945;156:490–494. doi: 10.1038/156692b0. [DOI] [PubMed] [Google Scholar]
- 14.Jen PH-S, Sun X, Kamada T, Zhang S, Shimozawa T. Auditory response properties and spatial response areas of superior colliculus neurons of the FM bat, Eptesicus fuscus. J Comp Physiol [A] 1984;154:407–413. [Google Scholar]
- 15.Kawasaki M, Margoliash D, Suga N. Delay-tuned combination-sensitive neurons in the auditory cortex of the vocalizing mustached bat. J Neurophysiol. 1988;59:623–635. doi: 10.1152/jn.1988.59.2.623. [DOI] [PubMed] [Google Scholar]
- 16.Kick SA. Target-detection by the echolocating bat, Eptesicus fuscus. J Comp Physiol [A] 1982;145:31–435. [Google Scholar]
- 17.Kick SA, Simmons JA. Automatic gain control in the bat’s sonar receiver and the neuroethology of echolocation. J Neurosci. 1984;4:2725–2737. doi: 10.1523/JNEUROSCI.04-11-02725.1984. [DOI] [PMC free article] [PubMed] [Google Scholar]
- 18.King AJ, Palmer AR. Cells responsive to free-field auditory stimuli in guinea-pig superior colliculus: distribution and response properties. J Physiol (Lond) 1983;342:361–381. doi: 10.1113/jphysiol.1983.sp014856. [DOI] [PMC free article] [PubMed] [Google Scholar]
- 19.Knudsen EI. Auditory and visual maps of space in the optic tectum of the owl. J Neurosci. 1982;2:1177–1194. doi: 10.1523/JNEUROSCI.02-09-01177.1982. [DOI] [PMC free article] [PubMed] [Google Scholar]
- 20.Lawrence BD, Simmons JA. Echolocation in bats: the external ear and perception of the vertical positions of targets. Science. 1982;218:481–483. doi: 10.1126/science.7123247. [DOI] [PubMed] [Google Scholar]
- 21.Metzner W. A possible neuronal basis for Doppler-shift compensation in echo-locating horseshoe bats. Nature. 1989;341:529–532. doi: 10.1038/341529a0. [DOI] [PubMed] [Google Scholar]
- 22.Metzner W. An audio-vocal interface in echolocating horseshoe bats. J Neurosci. 1993;13:1899–1915. doi: 10.1523/JNEUROSCI.13-05-01899.1993. [DOI] [PMC free article] [PubMed] [Google Scholar]
- 23.Middlebrooks JC, Knudsen EI. A neural code for auditory space in the cat’s superior colliculus. J Neurosci. 1984;4:2621–2634. doi: 10.1523/JNEUROSCI.04-10-02621.1984. [DOI] [PMC free article] [PubMed] [Google Scholar]
- 24.Mittmann DH, Wenstrup JJ. Combination-sensitive neurons in the inferior colliculus of the mustached bat. Assoc Res Otolaryngol Abstr. 1994;17:371. [Google Scholar]
- 25. Moss CF, Schnitzler H-U. Behavioral studies of auditory information processing. Hearing by bats Fay RR, Popper AN. 1995. 87 143 Springer; New York: Verlag. [Google Scholar]
- 26.Munoz DP, Pélisson D, Guitton D. Movement of neural activity on the superior colliculus motor map during gaze shifts. Science. 1991;251:1358–1360. doi: 10.1126/science.2003221. [DOI] [PubMed] [Google Scholar]
- 27.Olsen JF, Suga N. Combination-sensitive neurons in the medial geniculate body of the mustached bat: encoding of target range information. J Neurophysiol. 1991;65:1275–1296. doi: 10.1152/jn.1991.65.6.1275. [DOI] [PubMed] [Google Scholar]
- 28.O’Neill WE, Suga N. Encoding of target range and its representation in the auditory cortex of the mustached bat. J Neurosci. 1982;2:17–31. doi: 10.1523/JNEUROSCI.02-01-00017.1982. [DOI] [PMC free article] [PubMed] [Google Scholar]
- 29.Pollak GD. Time is traded for intensity in the bat’s auditory system. Hearing Res. 1988;36:107–124. doi: 10.1016/0378-5955(88)90054-8. [DOI] [PubMed] [Google Scholar]
- 30.Poussin C, Schlegel P. Directional sensitivity of auditory neurons in the superior colliculus of the bat, Eptesicus fuscus, using free field sound stimulation. J Comp Physiol [A] 1984;154:253–261. [Google Scholar]
- 31.Schuller G, Radtke-Schuller S. Neural control of vocalization in bats: mapping of brainstem areas with electrical microstimulation eliciting species-specific echolocation calls in the rufous horseshoe bat. Exp Brain Res. 1990;79:192–206. doi: 10.1007/BF00228889. [DOI] [PubMed] [Google Scholar]
- 32.Simmons JA. The resolution of target range by echolocating bats. J Acoust Soc Am. 1973;54:157–173. doi: 10.1121/1.1913559. [DOI] [PubMed] [Google Scholar]
- 33.Simmons JA, Kick SA, Lawrence BD, Hale C, Bard C, Escudié B. Acuity of horizontal angle discrimination by the echolocating bat, Eptesicus fuscus. J Comp Physiol [A] 1983;153:321–330. [Google Scholar]
- 34.Simmons JA, Moss CF, Ferragamo M. Convergence of temporal and spectral information into acoustic images of complex sonar targets perceived by the echolocating bat, Eptesicus fuscus. J Comp Physiol [A] 1990;166:449–470. doi: 10.1007/BF00192016. [DOI] [PubMed] [Google Scholar]
- 35.Sparks DL. Translation of sensory signals into commands for control of saccadic eye movements: role of primate superior colliculus. Physiol Rev. 1986;66:118–171. doi: 10.1152/physrev.1986.66.1.118. [DOI] [PubMed] [Google Scholar]
- 36.Suga N, Horikawa J. Multiple time axes for representation of echo delays in the auditory cortex of the mustached bat. J Neurophysiol. 1986;55:776–805. doi: 10.1152/jn.1986.55.4.776. [DOI] [PubMed] [Google Scholar]
- 37.Suga N, O’Neill WE. Neural axis representing target range in the auditory cortex of the mustache bat. Science. 1979;206:351–353. doi: 10.1126/science.482944. [DOI] [PubMed] [Google Scholar]
- 38.Suga N, O’Neill WE, Kujirai K, Manabe T. Specialization of “combination-sensitive” neurons for processing of complex biosonar signals in auditory cortex of the mustached bat. J Neurophysiol. 1983;49:1573–1626. doi: 10.1152/jn.1983.49.6.1573. [DOI] [PubMed] [Google Scholar]
- 39.Suga N, Kawasaki M, Burkard RF. Delay-tuned neurons in auditory cortex of mustached bat are not suited for processing directional information. J Neurophysiol. 1990;64:225–235. doi: 10.1152/jn.1990.64.1.225. [DOI] [PubMed] [Google Scholar]
- 40.Sullivan WE. Neural representation of target distance in auditory cortex of the echolocating bat Myotis lucifugus. J Neurophysiol. 1982;48:1011–1032. doi: 10.1152/jn.1982.48.4.1011. [DOI] [PubMed] [Google Scholar]
- 41.Surlykke A, Bojesen O. Integration time for short broad band clicks in echolocating FM-bats (Eptesicus fuscus). J Comp Physiol [A] 1996;178:235–241. doi: 10.1007/BF00188165. [DOI] [PubMed] [Google Scholar]
- 42.Valentine DE, Moss CF. Sensorimotor integration in bat sonar. In: Kunz TH, Racey PA, editors. Bats: phylogeny, morphology, echoloation, and conservation biology. Smithsonian Institution UP; Washington, DC: 1997. [Google Scholar]
- 43.Wise LZ, Irvine DRF. Auditory response properties of neurons in deep layers of cat superior colliculus. J Neurophysiol. 1983;49:674–685. doi: 10.1152/jn.1983.49.3.674. [DOI] [PubMed] [Google Scholar]
- 44.Wong D. Spatial tuning of auditory neurons in the superior colliculus of the echolocating bat, Myotis lucifugus. Hearing Res. 1984;16:261–270. doi: 10.1016/0378-5955(84)90115-1. [DOI] [PubMed] [Google Scholar]
- 45.Wong D, Shannon SL. Functional zones in the auditory cortex of the echolocating bat, Myotis lucifugus. Brain Res. 1988;453:349–352. doi: 10.1016/0006-8993(88)90176-x. [DOI] [PubMed] [Google Scholar]
- 46.Yan J, Suga N. Corticofugal modulation of time-domain processing of biosonar information in bats. Science. 1996;273:1100–1103. doi: 10.1126/science.273.5278.1100. [DOI] [PubMed] [Google Scholar]


