

Abstract
To study the molecular mechanism of calcium current modulation in the bag cell neurons of Aplysia californica, we have identified calcium channel subtypes expressed in these cells and analyzed their distribution using channel-specific antibodies. Using PCR to amplify reverse-transcribed RNA from bag cell clusters, we identified two classes of calcium channel α1 subunit. One, BCCa-I, belongs to the ABE subfamily of calcium channels, whereas the other, BCCa-II, belongs to the SCD subfamily. Antibodies generated against the bag cell calcium channels recognize membrane proteins of ∼210 and 280 kDa on immunoblots. Both channels are expressed in the bag cell clusters as well as in other parts of theAplysia nervous system. BCCa-II also localizes to glia and muscle. The subcellular distribution of the two channel types is strikingly different. Antibody staining of bag cell neurons in primary culture shows that BCCa-II is present on the plasma membrane, whereas BCCa-I has a punctate, intracellular distribution consistent with a vesicular localization. The BCCa-I-containing vesicles are found in bag cell neuron somata and growth cones and occasionally in neuritic hotspots. Their distribution is similar but not identical to that of LysoTracker Red, a marker for acidic organelles, but unlike that of dense-core vesicles containing egg-laying hormone. The vesicular channels may represent the protein kinase C-sensitive calcium channels of bag cell neurons that are believed to enhance hormonal release during electrical activity.
Keywords: calcium channel, bag cell neuron, Aplysia, protein kinase C, vesicle, neuroendocrine, invertebrate, immunocytochemistry, antibody, glia
Voltage-sensitive calcium channels are essential for the function of neurons and neuroendocrine cells: they mediate secretion of neurotransmitters and peptide hormones and often modulate cell excitability and gene regulation (for reviews, see Dunlap et al., 1995; Perez-Reyes and Schneider, 1995; Tsien et al., 1995). Numerous subtypes of voltage-sensitive calcium channel have been distinguished by physiological and pharmacological analysis, and six classes of calcium channel α1 subunit (α1A–E and α1S) have been identified by molecular cloning. These classes divide into two related subfamilies based on sequence similarity: the ABE subfamily (α1A, α1B, and α1E) of predominantly neuronal α1subunits and the more broadly expressed SCD subfamily, whose members (α1S, α1C, and α1D) are found in neurons, muscle, glia, and endocrine cells (Snutch et al., 1990;Fujita et al., 1993; Zhang et al., 1993; Robitaille et al., 1996). All classes are found in neurons and neuroendocrine cells except for the α1S subunit, which is muscle-specific.
Although considerable progress has been made in determining which classes of calcium channel are involved in neurotransmitter release at synapses, less is known about the types and distribution of calcium channels that mediate nonsynaptic release of neuromodulators and peptide hormones. The pharmacology of peptide secretion implicates members of the SCD subfamily of α1 subunits (Perney et al., 1986; Satin et al., 1995; Loechner et al., 1996), which in vertebrates are selectively sensitive to dihydropyridines. The α1D subunit is known to be expressed in some endocrine cells and neuroendocrine cell lines (Perez-Reyes et al., 1990; Seino et al., 1992), but there is also evidence for expression of other α1 subunits (Lemos and Nowycky, 1989; Liévano et al., 1994). No detailed examination of the calcium channel distribution in neuroendocrine cells has yet been carried out. The study presented here, localizing the calcium channel subtypes expressed in the bag cell neurons of Aplysia, represents a step in this direction.
The bag cell neurons of Aplysia are a well characterized model system for the study of neuroendocrine function (Strummwasser, 1988; Conn and Kaczmarek, 1989). They are found in discrete clusters at the rostral end of the abdominal ganglion and secrete the peptide responsible for the initiation of egg-laying behavior [egg-laying hormone (ELH)] during a prolonged phase of electrical activity known as the afterdischarge. These cells contain two physiologically characterized calcium channels distinguished by their unitary conductances (12 and 24 pS) and by their differential sensitivity to protein kinase C (PKC) (Strong et al., 1987). The 24 pS channel is acutely upregulated by PKC and seems to underlie enhancement of action potential height and the potentiation of ELH release observed in bag cell clusters during the afterdischarge (Conn et al., 1988; Loechner et al., 1992). These PKC-sensitive channels are observed in bag cell somata and, based on calcium imaging studies (Knox et al., 1992), are likely to be present in growth cones. Because these channels are detected only after PKC activation, it has been proposed that they are regulated by insertion into the plasma membrane. An understanding of their mechanism of modulation provides an added impetus for the molecular characterization of bag cell neuron calcium channels.
To study the distribution and regulation of the bag cell neuron calcium channels, we have identified partial sequences of two α1subunits expressed in bag cell neurons. Using these sequences, we have constructed fusion proteins (FPs) and raised channel-specific antibodies. The antibodies recognize distinct channel types with different expression patterns and different subcellular distributions. One type is uniformly distributed in bag cell neuron membranes, whereas the other localizes to vesicles that concentrate in the bag cell somata and growth cones. The latter distribution is consistent with what has been proposed for the PKC-sensitive calcium channels of bag cell neurons.
MATERIALS AND METHODS
Chemicals, secondary antibodies, and solutions.Triton X-100 and gelatin were obtained from Eastman Kodak (Rochester, NY). Dispase and phenylmethanesulfonyl fluoride (PMSF) were from Boehringer Mannheim (Indianapolis, IN). HEPES, Tris-base, and SDS were from American Bioanalytical (Natick, MA), and methanol, EDTA, NaCl, KCl, MgCl2, CaCl2, sodium phosphate, dibasic (Na2HPO4), and potassium phosphate, monobasic (KH2PO4) were from J. T. Baker Chemical Company (Phillipsburg, NJ). Chromalum was from Aldrich Chemical (Milwaukee, WI), 16% paraformaldehyde from Electron Microscopy Sciences (Fort Washington, PA), d-glucose from Mallinckrodt (Paris, KY), glycine from Bio-Rad (Hercules, CA), and isopropyl-β-thiogalactopyranoside from Promega (Madison, WI). LysoTracker Red DND-99 and MitoTracker Red CMXRos were from Molecular Probes (Eugene, OR), and the phorbol esters phorbol 12-myristate 13-acetate (PMA) and 4α-PMA were from LC Laboratories (Boston, MA). All oligonucleotides were synthesized by the Yale University DNA Synthesis Laboratory. Unless indicated otherwise, all other chemicals were from Sigma (St. Louis, MO).
Fluorescein- and Texas Red-conjugated goat anti-rabbit IgG secondary antibodies (FITC-GαRIgG and Texas Red-GαRIgG, respectively), and Texas Red-conjugated goat anti-rat IgG were from Jackson ImmunoResearch Laboratories (West Grove, PA). These secondary antibodies were used at 1:150 dilution in 5% goat serum (Life Technologies, Gaithersburg, MD). Horseradish peroxidase-conjugated goat anti-rabbit IgG (HRP-GαRIg) was from Vector Laboratories (Burlingame, CA) and was used at 1:5000 dilution.
Artificial seawater (ASW) contained (in mm): 460 NaCl, 10.4 KCl, 55 MgCl2, 11 CaCl2, and 15 HEPES, pH 7.8. Unless stated otherwise, this was supplemented with 0.1% glucose, 5000 U/l penicillin, 5 mg/l streptomycin. Other buffers included “low-divalent seawater” (460 mm NaCl, 10 mmKCl, 1 mm CaCl2, 1 mmMgCl2, 72 mm Tris, pH 7.8), PBS (in mm: 137 NaCl, 2.7 KCl, 4.3 Na2HPO4, 1.5 KH2PO4, pH 7.0), and Tris-buffered saline (TBS) (in mm: 137 NaCl, 2.7 KCl, 25 Tris-base, pH 8.0).
Cloning and characterization of calcium channel fragments.RNA was isolated from the bag cell clusters of 27 adultAplysia (obtained from Marinus Inc., Long Beach, CA, or Alacrity Marine Services, Redondo Beach, CA) by using the single-step guanidium thiocyanate method (Sacchi, 1995). The clusters, consisting primarily of the bag cell neurons and their supporting glia, were cut away from the abdominal ganglion and pleural abdominal connective and then homogenized in 1 ml of denaturing solution. Sixty micrograms of total RNA were isolated and stored as an ethanolic stock (at 350 μg/ml) at −20°C until use.
Aliquots (0.5 μg) of total RNA were reverse-transcribed using random primers, and calcium channel fragments were amplified using the degenerate oligonucleotide primers A1 and A2. Both reactions were carried out using the GeneAmp RNA PCR kit from Perkin-Elmer (Foster City, CA) following the instructions of the manufacturer. The sequences of A1 and A2 (where I stands for the base inosine) were ATIACIATGGA(A/G)GGITGGAC and CCICC(A/G)AAIA(A/G)(T/C)TGCAT, respectively, and both were used at a concentration of 1 mm. Amplification was completed in 45 cycles of PCR with the following steps: 1 min denaturation at 94°C, 2 min annealing at 55°C, and 2 min extension at 72°C. Products were separated on a 1% agarose gel.
PCR fragments were ligated into the PCRII vector using the TA Cloning Kit (Invitrogen, San Diego, CA) and subclones from four to five independent PCR reactions were sequenced using the Sequenase Sequencing Kit (United States Biochemical, Cleveland, OH) with dITP nucleotides. Sequencing reactions were also treated with one to two units of terminal deoxynucleotidyl transferase (Life Technologies) to remove prematurely terminated chains. Plasmid DNA for sequencing was prepared using the boiling miniprep method (Engebrecht and Brent, 1995).
Sequence analysis of the calcium channel clones was carried out using programs of the Wisconsin Package (Genetics Computer Group, 1994). The five BCCa-I subclones sequenced were substantially the same (with only 1.2 nucleotide differences per pair of clones on average) and had a unique consensus sequence. The four BCCa-II subclones showed considerably more variability (6.8 nucleotide differences per pair of clones on average), but only at two positions was there an ambiguity in the assignment of the nucleotide. At position 333, two subclones had a G and two had an A, whereas at position 564, two subclones had a T and two had a C. In neither case did the ambiguity in nucleotide sequence alter the predicted protein sequence. The sequences have been deposited in GenBank with accession numbers U56727 (BCCa-I) and U56728 (BCCa-II).
Preparation of anti-calcium channel antibodies. FPs linking the two calcium channel sequences to glutathione-S-transferase (GST) were constructed in the pGEX-2T vector (Pharmacia, Piscataway, NJ). The calcium channel regions indicated in Figures 1 and 2 were amplified using PCR primers corresponding to nucleotides 268–285 and 476–498 of BCCa-I and 264–285 and 397–416 of BCCa-II. The forward primers incorporated a restriction site for BamHI, whereas the reverse primers contained an EcoRI site. The amplified fragments were cleaved with these enzymes (both from New England Biolabs, Beverly, MA) and ligated into correspondingly cut pGEX-2T vector after purification by electrophoresis on 2% NuSieve GTG agarose gels (FMC Bioproducts, Rockland, ME). Protease-deficient Escherichia coli of the ompT− strain (CGSC Strain 7231, E. coli Genetic Stock Center, Yale University) were transformed with the pGEX-2T constructs, and the sequence and orientation of the calcium channel fusion constructs were confirmed by sequencing.
Fig. 1.
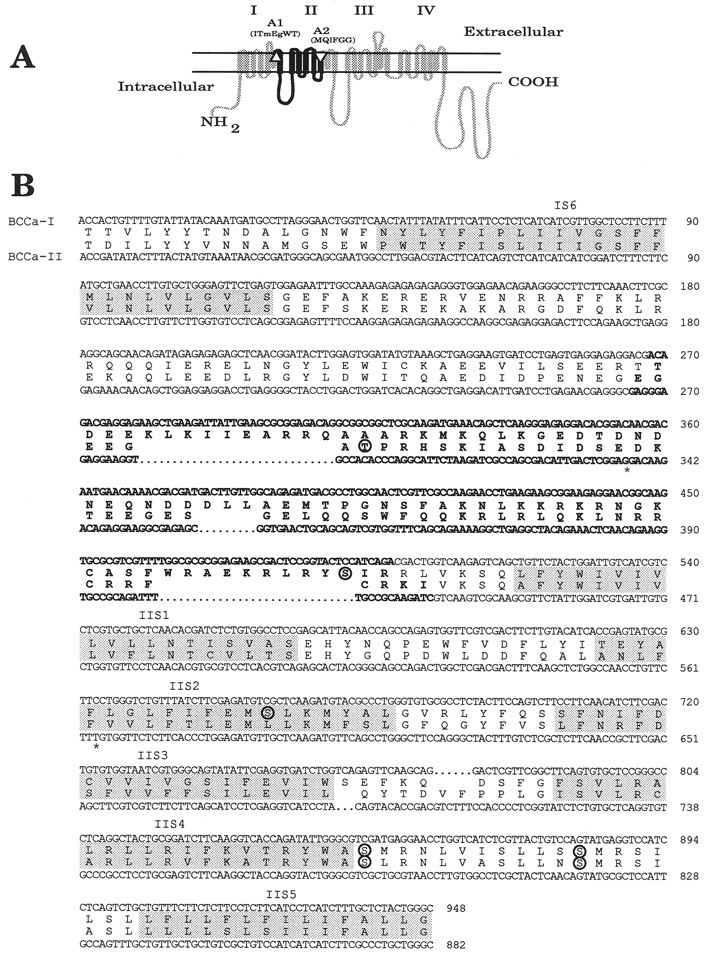
Sequences of BCCa-I and BCCa-II, the calcium channel fragments amplified from bag cell neuron RNA. PCR primers A1 and A2 were used to amplify partial sequences of calcium channel α1 subunits from reverse-transcribed RNA isolated from bag cell clusters, as described in Materials and Methods.A, Transmembrane structure of an α1subunit indicating the four domains and the positions of the two PCR primers A1 and A2 (triangles). The conserved protein sequences targeted by each primer are indicated inparentheses, with capital lettersindicating complete conservation in vertebrate α1-subunit sequences. The amplified region is shaded black.B, The consensus nucleotide sequences of the amplified fragments and their corresponding protein sequences BCCa-I and BCCa-II. The regions used in the fusion protein constructs FP-I and FP-II are shown in boldface. Transmembrane regions areshaded. Potential sites of PKC phosphorylation arecircled. Asterisks indicate two sites of ambiguity in the BCCa-II nucleotide sequence (see Materials and Methods). Alignment was performed using the GAP program of the Wisconsin Package (see Materials and Methods).
Fig. 2.

Comparison of BCCa-I and BCCa-II with other neuronal calcium channels. The BCCa-I and BCCa-II sequences are shown aligned with the corresponding regions of α1 subunits from the five neuronal classes. The α1A- (Mori et al., 1991), α1B- (Fujita et al., 1993), and α1E-subunit (Niidome et al., 1992) sequences are from rabbit. α1C- (Snutch et al., 1991) and α1D-subunit (Hui et al., 1991) sequences are from rat, and the α1D-subunit sequence (fly) is fromDrosophila (Zheng et al., 1995). Completely conserved residues are shaded, and the percent sequence identities to BCCa-I and BCCa-II, respectively, are shown inbrackets at the end of each sequence. Residues forming the β subunit binding motif are indicated by asterisksabove the sequence, whereas transmembrane regions are indicated bylines. The sequences present in the FP constructs are shown in boldface. Percent sequence identities were determined by pairwise comparison using the GAP program, and sequence alignment was performed with the Pileup program, as described in Materials and Methods.
Rabbit polyclonal antibodies were prepared against affinity-purified FPs by Immunodynamics (San Diego, CA). Large-scale purification of GST FPs was carried out as described by Smith and Corcoran (1995). FPs were affinity-purified on glutathione-agarose beads from bacterial lysates and concentrated to 1–4 mg/ml using Centriprep concentrators (Amicon, Beverly, MA) in the presence of 1 mm PMSF, 10 μm leupeptin, and 10 mm EDTA.
Rabbits were boosted with 300 μg of FP 3, 6, 9, 13, 20, and 25 weeks after the initial immunization. Bleeds taken at 5, 7, 9, 16, 22, and 27 weeks were tested for activity by ELISA on calcium channel peptides cleaved from the GST FPs by 20 U of thrombin (as described by Smith, 1995). Antibody binding activity was measured using an HRP-conjugated goat anti-rabbit IgG secondary antibody ando-phenylenediamine as a substrate (Lauritzen et al., 1994). Optical densities were measured at 450 nm.
Two rabbits (1615 and 1616) immunized with the BCCa-I FP (FP-I) had comparable peak activities by ELISA at weeks 9, 16, and 22 (EC50 = 1:32,000 on the BCCa-I peptide vs 1:4000 on the BCCa-II peptide). One rabbit (1618) immunized with the BCCa-II FP (FP-II) showed similar levels of activity at weeks 7, 9, and 16 (EC50 = 1:32,000 on the BCCa-II peptide vs 1:4000 on the BCCa-I peptide), whereas another (1617) showed weak immunoreactivity. Approximately 1 ml aliquots of rabbit 1616 bleeds from weeks 7, 9, and 16 were pooled for purification of αBCCa-I antibodies. Similarly, 1 ml aliquots of rabbit 1618 bleeds from weeks 5, 7, and 16 were pooled for purification of αBCCa-II antibodies. The pooled antisera were first partially purified by precipitation in 50% saturated ammonium sulfate followed by dialysis into PBS and further purification by affinity chromatography.
The ImmunoPure Ag/Ab Immobilization Kit (Pierce, Rockford, IL) was used to prepare four 3 ml affinity columns, two with 7 mg of GST coupled to the matrix, and one each with 7 mg of FP-I or FP-II coupled to the matrix. Each partially purified pool of antisera was passed twice over a GST affinity column to remove αGST antibodies. The flow-throughs then were concentrated and passed over the FP-I and FP-II affinity columns. Bound antibodies were eluted by 100 mm glycine, pH 2.8. The success of the purification was monitored by ELISA. Approximately 95% of the αGST activity was removed from the affinity-purified αBCCa-I sample, and antibodies in this sample exhibited 1000-fold greater selectivity for the BCCa-I peptide than the BCCa-II peptide. In the αBCCa-II sample, roughly 75% of the αGST activity was removed, and the antibodies exhibited more than 100-fold selectivity for the BCCa-II peptide over the BCCa-I peptide. The affinity-purified antibodies were dialyzed into PBS, concentrated to 1 mg/ml, and stored at −20°C in PBS supplemented with 1% bovine serum albumin and 0.05% sodium azide.
Immunoblotting. Membrane preparations of tissues from adult (200–600 gm) Aplysia were prepared for immunoblotting by excision into an ice-cold solution of ASW containing a cocktail of protease inhibitors (1 mm each of NEM, benzamidine, and PMSF, and 10 mm EDTA). After removal of connective tissue, samples were homogenized glass-on-glass in 1 ml of “low-divalent seawater” supplemented with 0.25 m sucrose and protease inhibitors. Homogenates were then centrifuged at 15,000 ×g. The resulting supernatants were centrifuged at 105,000 × g, and the membrane pellets were resuspended in 100 μl 100 mm Tris, pH 6.8, 0.1% SDS, and assayed for protein concentration using the Bio-Rad Protein Assay (Bio-Rad). Before the final resuspension, membrane pellets from buccal muscle were treated to extract myosin by the method of Marossian and Lowey (1982). Briefly, the samples were resuspended in 0.5 ml 300 mm KCl, 0.15 m KPO4, pH 6.5, 0.02 m EDTA, 5 mm MgCl2, 1 mm ATP, and incubated 15 min before membranes were pelleted at 105,000 × g. Removal of myosin was necessary because of the heavy nonspecific labeling of this dense band by both antibodies.
Equal amounts of protein were loaded onto 6.5% polyacrylamide gels and separated by electrophoresis according to the procedure of Laemmli (1970). After electrophoresis, proteins were electroblotted onto nitrocellulose (BioTrace NT, Gelman Scientific, Ann Arbor, MI) using 20% methanol, 190 mm glycine, 25 mm Tris, 0.1% SDS as the transfer buffer. The nitrocellulose blots were blocked with Blotto (5% Carnation Nonfat Dry Milk, 0.1% Tween 20 in TBS). Strips (4 mm) were cut from the various sample lanes and incubated 2 hr with 0.2 μg/ml αBCCa-I or αBCCa-II in Blotto followed by four 20 min washes, the first two in 1 m NaCl,1% Triton X-100 in TBS, and the last two in 0.1% Tween in TBS. In preincubation experiments, antibodies were incubated at 67 μg/ml with a 10-fold excess of FP-I or FP-II bound to glutathione-agarose beads for 2 hr at 23°C before centrifugation at 15,000 × g and dilution of the supernatants at 1:335. The strips were incubated 1 hr in Blotto containing HRP-GαRIgG and washed as before. Blots were developed by luminol chemiluminescence as described by Gallagher (1995), except that p-coumaric acid was substituted forp-iodophenol as the enhancer. Briefly, strips were incubated for several min in a solution of 1.25 mm luminol, 68 μmp-coumaric acid in 100 mm Tris, pH 8.6, and then placed between two plastic sheets and exposed to Hyperfilm (Amersham). αBCCa-II-stained blots were typically exposed 5–10 times longer than those stained with αBCCa-I, because the αBCCa-I signal was consistently stronger than that of αBCCa-II.
Staining of tissue sections. Tissue sections ofAplysia abdominal ganglia were prepared as described byBeushausen et al. (1988). Abdominal ganglia, including the pleural-abdominal connectives, were excised from ∼300 gm animals after 50% w/w injection of MgCl2. The ganglia were fixed for 2 hr at 23°C in 4% paraformaldehyde, 30% sucrose in 0.1m sodium phosphate buffer, pH 7.3 (NaPi, pH 7.3), before rinsing and incubating overnight at 4°C in 30% sucrose/NaPi, pH 7.3. Fixed ganglia were tamped dry, mounted in O.C.T. embedding medium (Miles Inc., Elkhart, IN), and then frozen rapidly on dry ice before they were sectioned with a cryostat microtome. Twelve micrometer sections were mounted directly on slides coated with 5 mg/ml gelatin and 0.5 mg/ml chromalum and then stored desiccated at −20°C until use.
For sample staining, slide sections were pretreated with 2% Triton X-100/PBS for 10 min and then washed four to five times with PBS. Sections were incubated for 4 hr with 5 μg/ml αBCCa-I or αBCCa-II or with rabbit αELH (kindly provided by Dr. Arlene Chiu) at a 1:1000 dilution in PBS/5% goat serum (Life Technologies). For the experiments presented, αBCCa-I and αBCCa-II were preincubated 4 hr in PBS/5% goat serum at 25 μg/ml with excess FP-I or FP-II bound to glutathione-agarose beads, as indicated in the figure legends. In each experiment, the samples were matched to contain equal amounts of antibody, FP, and beads. After preincubation, all antibody samples were spun briefly at 15,600 × g to pellet the beads. Where indicated, the supernatants were centrifuged further at 105,000 ×g to pellet any residual Ab-Ag complexes. Supernatants were then diluted 1:5 into PBS/5% goat serum. After incubation with primary antibodies, sections were PBS-washed, incubated 2 hr with FITC-GαRIg, washed again and finally mounted with Vectashield mountant (Vector Laboratories, Burlingame, CA) and viewed and photographed with an Olympus BX-60 Fluorescence Microscope equipped with fluorescein and rhodamine filters. Exposures of αBCCa-I-stained sections were typically two to four times as long as those taken of αBCCa-II-stained sections, because the intensity of αBCCa-II immunohistochemical staining was consistently stronger than that observed for αBCCa-I.
Staining of bag cell neurons in culture. Bag cell clusters were excised from adult Aplysia (200–400 gm) after anesthetic injection of MgCl2 to 50% of their weight and then incubated for 18 hr at room temperature in a solution of 1% Dispase. The cells were then isolated by trituration and plated in 3 ml ASW on coverslips coated with 1 μg/ml poly-d-lysine. The coverslips were typically mounted with wax on the bottom of 35-mm-diameter culture dishes through which a hole had been drilled to form a small well.
Bag cell neurons were cultured in ASW for 1–5 d before fixation with 4% paraformaldehyde in 400 mm sucrose/ASW, essentially as described by Azhderian et al. (1994). In some cases, bag cell neurons were treated with phorbol esters or vital dyes before fixation, as described in the figure legends. To ensure rapid fixation, the culture dishes were drained of all but ∼65 μl over the bag cell neurons. Three milliliters of fixative were then rapidly superfused into the central well, and fixation was allowed to continue for 25 min before the addition of Triton X-100 to 0.3%. Culture dishes were then washed two times with PBS and blocked with 5% goat serum/PBS before incubation with primary antibodies.
Coverslips were removed from the culture dishes, inverted on 100 μl of primary antibody solution, and placed in a humidified chamber at 4°C overnight. αBCCa-I and αBCCa-II were used at concentrations of 5 μg/ml in 5% goat serum/PBS. Rat αELH (the kind gift of Dr. Richard Scheller, Stanford University) was included in the primary antibody solution at a 1:1000 dilution in some experiments. In some cases, the antibodies at 5 μg/ml were preincubated with a 100-fold molar excess of FP-I or FP-II bound to glutathione-agarose beads. Preincubation reactions were carried out for 6 hr in 1% BSA/5% goat serum/PBS and contained equal amounts of antibody, FP, and beads in all samples. The supernatants from the preincubation reactions were used after centrifugation at 105,000 × g for 20 min.
After overnight incubation, the coverslips were washed extensively with PBS and then incubated for 4 hr at room temperature with either Texas Red- or FITC-GαRIG. When the primary antibody solution contained rat αELH, Texas Red-conjugated goat αrat IgG was also included. Coverslips were washed and mounted on glass slides (shimmed on both sides with no. 1 coverslips) using Vectashield. The stained slides were viewed and photographed as described above. Confocal microscopy was carried out using a Bio-Rad MRC-600 confocal microscope.
The punctate staining of bag cell neurons observed with αBCCa-I varied from sparse, with a few tens of dots in the perinuclear region, to robust, with stained cells suffused with puncta. Although we did not study them systematically, these variations seemed to exhibit a seasonality, with sparse punctate staining in winter months (December–March) and robust staining in summer and autumn (July–November), which is when reproduction and egg laying peak (Pinsker and Parsons, 1985).
RESULTS
Identification of bag cell neuron calcium channel α1 subunits
To identify the calcium channel α1 subunits expressed in bag cell neurons and obtain partial sequence for the production of channel-specific antibodies, we used PCR to amplify reverse-transcribed RNA isolated from bag cell clusters. Our oligonucleotide primers targeted the pore region of the first domain and the fifth transmembrane region of the second domain (Fig.1A). The sequences of both regions are highly conserved in all classes of α1subunit and are expected to amplify fragments of ∼1 kb.
PCR amplification, carried out as described in Materials and Methods, yielded two fragments in the expected size range (data not shown). Systematic variation of the conditions of amplification repeatedly gave only these fragments, the homogeneity of which was confirmed by restriction analysis. Four to five independent subclones of each fragment were sequenced, and the consensus nucleotide sequences are shown in Figure 1B, together with the predicted protein sequences. The larger fragment, 951 nucleotides in length, is designated BCCa-I, whereas the shorter fragment, 873 nucleotides in length, is designated BCCa-II.
The two sequences are 53% identical at the amino acid level and, as illustrated in Figure 2, share considerable sequence identity with the corresponding regions of neuronal calcium channel α1 subunits. Interestingly, each sequence shares greater sequence identity with specific mammalian channels than it does with the other Aplysia sequence. BCCa-I is ∼65% identical to the corresponding region of channels in the ABE subfamily of mammals but only 50% identical to channels of the SCD subfamily. In contrast, BCCa-II is ∼67% identical to the SCD channels over the corresponding region but <55% identical to channels of the ABE subfamily (Fig.2).
Both BCCa-I and BCCa-II bear the structural features of calcium channel sequences, with the highest degree of sequence conservation falling in the hydrophobic regions IS6 and IIS1–5. More importantly, both sequences have the highly conserved motif for binding of the calcium channel β subunit that follows IS6 (Pragnell et al., 1994) (indicated by the asterisks in Fig. 2). As with other calcium channels, the linker region between domains I and II is poorly conserved apart from the β subunit binding motif. This feature, together with its length and hydrophilicity, made this region ideal for antibody production. Antibodies directed against these regions would be expected to be selective for BCCa-I and BCCa-II.
FPs containing the calcium channel sequences indicated in boldface in Figures 1B and 2 were prepared by linking the sequences to GST, as described in Materials and Methods, and affinity-purified FPs were used to immunize rabbits for the production of polyclonal antibodies. Selected antisera from these rabbits were affinity-purified after substantial removal of anti-GST antibodies (see Materials and Methods). All work reported here was carried out with these affinity-purified antibodies, designated αBCCa-I and αBCCa-II.
Identification of calcium channel proteins by immunoblotting
To verify that αBCCa-I and αBCCa-II indeed recognize calcium channels expressed in the bag cell clusters of Aplysia, we probed nitrocellulose blots of bag cell cluster and abdominal ganglion membrane preparations with these antibodies. The antibodies stained distinct membrane proteins in both preparations: αBCCa-I stained a band of ∼210 kDa, whereas αBCCa-II recognized a band of ∼280 kDa (Fig. 3A). These molecular weights are consistent with those of other neuronal calcium channel α1 subunits, which range in predicted size from 187 kDa for the rat α1D channel (Hui et al., 1991) to 276 kDa for the Drosophila α1D channel (Zheng et al., 1995). Within the resolution of the gel system used, each antibody seemed to recognize one major band. Multiple isoforms were not distinguished, as they have been for several mammalian calcium channels on immunoblots (Westenbroek et al., 1992; Hell et al., 1993). Although minor bands were sometimes present (Fig. 3A, lane I), they were not consistently observed and may represent proteolytic degradation products. As indicated in Figure 3B, the staining with both antibodies is specific, because preadsorption with the FP against which the antibody was made, but not with the other FP, inhibits the immunostaining.
Fig. 3.

Immunoblots of bag cell cluster and abdominal ganglion membranes probed with antibodies against BCCa-I and BCCa-II.A, Membrane preparations of bag cell clusters (BC) and abdominal ganglion (AG) were probed with antibodies to BCCa-I (I) or BCCa-II (II). Each strip represents ∼90 μg of the membrane protein loaded on the gel. Mobilities of molecular weight standards are indicated. B, Membrane preparations were probed with antibodies to BCCa-I or BCCa-II that had been preincubated with fusion protein I (I) or fusion protein II (II). In each case, preincubation of the antibody with the FP against which it was made eliminates staining. Each strip represents ∼50 μg of the bag cell cluster and abdominal ganglion membrane protein loaded on the gel.
The observation that the antibodies recognize similar membrane proteins in both the abdominal ganglion and bag cell clusters indicates that expression of the BCCa-I and BCCa-II channels is not restricted to bag cell clusters. Indeed, immunoblots of membrane preparations of otherAplysia ganglia (Fig. 4) show that both channels are widely expressed in the Aplysia nervous system. In addition, the BCCa-II channel, but not BCCa-I, seems to be expressed prominently in muscles of the buccal mass. Neither channel is expressed in a nonexcitable tissue, the hepatopancreas.
Fig. 4.

Immunoblots of membranes from variousAplysia tissues probed with antibodies against BCCa-I and BCCa-II. Membranes from Aplysia pleural (Ple), pedal (Ped), cerebral (Cer), and buccal (BG) ganglia, buccal muscle (BM), and hepatopancreas (HP) were probed with antibodies against BCCa-I (I) and BCCa-II (II). Each strip represents ∼30 μg of the membrane protein loaded on the gel.
Distribution of calcium channels in the abdominal ganglion
Fluorescence staining of 12 μm cryostat sections through the abdominal ganglion and bag cell clusters confirmed that BCCa-I and BCCa-II are expressed in bag cell neurons as well as in many other cells (Fig. 5). Of the two channels, BCCa-I has the more restricted distribution. In addition to the bag cell neurons, identified by staining with αELH antibodies (Fig. 5C), αBCCa-I stained the somata of other abdominal ganglion neurons and stained a subset of processes in the pleural abdominal connectives and the siphon nerve (Fig. 5A,F). Preincubation of the αBCCa-I antibody with FP-I (Fig. 5B) but not FP-II (Fig.5A) eliminated the staining, demonstrating its specificity. Preincubation with FP-II did not alter the pattern of staining seen with antibody alone (data not shown).
Fig. 5.
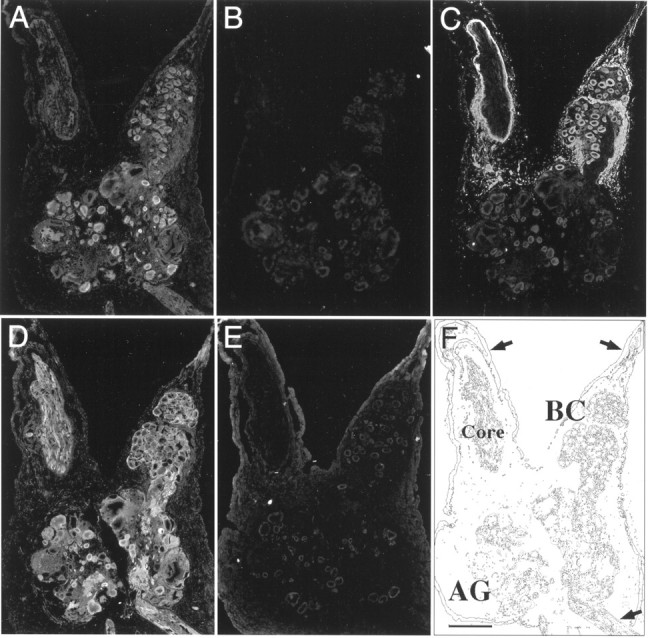
Immunofluorescent staining of tissue sections through the abdominal ganglion with αBCCa-I, αBCCa-II, and αELH antibodies. Neighboring 12 μm cryostat sections through the abdominal ganglion (AG), including one bag cell cluster (BC), were probed with antibodies to BCCa-I (A, B) and BCCa-II (D,E) and then stained with an FITC-conjugated secondary antibody. In each case, the antibodies were preadsorbed with a 100-fold molar excess of either FP-I (B, D) or FP-II (A, E) bound to glutathione-agarose beads and centrifuged at 100,000 ×g to remove bound antibody. The bag cell neurons, identified by staining with an antibody against ELH (C), are shown for comparison, and the anatomy of the tissue sections is shown schematically in F, where the arrows indicate major nerves. The top arrows indicate the pleural abdominal connectives with the axon core of the left connective labeled. The arrow on thebottom right indicates the siphon nerve. Scale bar, 500 μm.
By contrast, αBCCa-II stained not only the bag cell neurons and other neurons of the abdominal ganglion (Fig. 5D), but also prominently stained surrounding satellite cells previously identified as glia by ultrastructural analysis (Frazier et al., 1967). In addition, it stained a greater number of fibers within the axon core of the connective nerves and in the tissue sheath. In each case, the staining was clearly specific, because preincubation with FP-II (Fig.5E) but not FP-I (Fig. 5D) blocked the staining. Preincubation with FP-I did not alter the pattern of staining seen with antibody alone (data not shown).
Staining of the bag cell clusters with the anti-calcium channel antibodies is shown at higher power in Figure 6, together with bisbenzimide staining of cell nuclei to indicate the distribution of glia and neurons. Dense staining between bag cell neurons is clearly evident with αBCCa-II (Fig. 6A) in regions occupied by glial cells whose small nuclei are evident in Figure 6B. Although BCCa-II is represented more prominently in processes than BCCa-I is, one class of processes in the nerve tracts and neuropil did stain clearly with αBCCa-I (indicated by the arrow in Fig. 6C). These processes had a distinctive morphology, with many varicosities of the kind typically found on peptidergic fibers (Kreiner et al., 1984). Whether bag cell neuron processes also contained BCCa-I or BCCa-II was difficult to determine, given the abundance of low-level fiber staining in the regions containing these processes. As described below, however, the staining of cultured bag cell neurons with αBCCa-I and αBCCa-II provided evidence that both channels are expressed in the neurites of these cells.
Fig. 6.

Fluorescence staining of bag cell clusters, showing the distribution of cell nuclei, BCCa-I, and BCCa-II. Neighboring 12 μm tissue sections through the abdominal ganglion were stained essentially as indicated in Figure 5, except that the preincubation reactions were not subjected to ultracentrifugation. Sections were also counterstained with the nuclear dye bisbenzimide to reveal the positions of cell bodies. Photographs show stained bag cell clusters (BC) and the nerve tracts of the pleural-abdominal connective (PA). A, αBCCa-II staining of a bag cell cluster. The antibody was preadsorbed with a 25-fold molar excess of FP-I. B, Bisbenzimide staining of the same bag cell cluster in a neighboring section showing the large nuclei of the bag cell neurons surrounded by smaller glial nuclei. C, αBCC-I staining of the same section shown in B. The antibody was preadsorbed with a 25-fold molar excess of FP-II. Scale bar, 200 μm.
Subcellular distribution of calcium channels in bag cell neurons
Because most studies of the physiology and regulation of calcium currents in bag cell neurons have been carried out on cultured cells, it was of interest to examine the subcellular distribution of the BCCa-I and BCCa-II channels in primary culture. Consistent with the staining patterns observed in tissue sections, αBCCa-II stained both bag cell neurons and their associated glia (Fig.7A). As expected, this staining was inhibited by FP-II (Fig. 7C) but not FP-I (Fig. 7B). Although staining of the bag cell neurons by αBCCa-II tended to be brighter on the cell edges, suggesting a possible membrane localization, αBCCa-I staining often tended to fill the somata (Fig.7C,D). This staining also was specific (Fig.7F).
Fig. 7.

Immunofluorescent staining of cultured bag cell neurons with αBCCa-I and αBCCa-II antibodies. Fixed, permeabilized bag cell neurons were incubated with αBCCa-II (A–C) or αBCCa-I (D–F) and stained with an FITC-conjugated secondary antibody as described in Materials and Methods. Both primary antibodies were used without preadsorption (A, D) or after preadsorption with a 100-fold molar excess of FP-I (B, F) or FP-II (C, E). Large arrows indicate the bag cell neurons, and small arrows indicate glial cells, which are prominently stained by αBCCa-II. Scale bars, 100 μm.
Interestingly, closer examination of αBCCa-I staining showed that it could generally be resolved into a mass of bright “dots” or “puncta.” Such punctate staining was most easily resolved in slightly flattened cells with broad lamellae (Fig.8A) or in confocal sections (Fig.8B). A frequent feature of this staining was the accumulation of puncta in specific subcellular domains (as indicated by the arrow in Fig. 8A). Although almost always distributed around the nucleus, puncta also were often present in the processes, typically accumulating in growth cones (Fig.8C), and occasionally in other domains, specifically in regions of membrane contact or at neurite branch points (Figs.8D, 9A,B). These nonuniform patterns of staining contrasted strongly with the even distribution of αBCCa-II, which smoothly stained somata, processes, and growth cones (Fig. 8E).
Fig. 8.

Immunofluorescent staining of bag cell neuron somata, processes, and growth cones by αBCCa-I and αBCCa-II. Cultured bag cell neurons were fixed, permeabilized, and stained for BCCa-I (A–D) and BCCa-II (E,F) as described in Materials and Methods.A, A bag cell neuron displaying the punctate pattern of BCCa-I staining. The arrow indicates an accumulation of punctate staining in one of the lammelae. Scale bar, 100 μm.B, A confocal section through the nuclei of two bag cell neurons stained for BCCa-I, overlaid on a Nomarski image of the same two neurons, and their processes. Punctate staining (inwhite) is seen cytoplasmically in the somata and in the overlapping processes (arrows). Scale bar, 100 μm.C, Process of a bag cell neuron showing the accumulation of BCCa-I staining in the growth cone. Scale bar, 50 μm.D, Accumulation of BCCa-I staining in a region of neurite contact. The top and bottom right-hand panels show the pattern of immunofluorescence and the phase-contrast image, respectively, of two bag cell neurons and their processes. The left-hand panel shows an enlarged view of the region of contact (arrow) boxed in the top right-hand panel. Scale bar, 50 μm. E, A bag cell neuron with multiple processes and growth cones showing the typically uniform pattern of BCCa-II staining. Scale bar, 50 μm.F, Confocal section through a bag cell neuron stained for BCCa-II. The highest density of staining is at the peripheral edge. Scale bar, 100 μm.
Fig. 9.

Double-labeling of bag cell neurons with αBCCa-I and probes to acidic organelles and mitochondria. BCCa-I staining is shown in the left panel in each case, whereas corresponding staining with the following two organellar probes is shown on the right: A, B, LysoTracker Red, a vital dye sequestered by acidic intracellular compartments (arrows indicate BCCa-I and corresponding LysoTracker hotspots); C, MitoTracker Red, a vital, fixable dye that stains mitochondria. Bag cell neurons were stained with 50 nm LysoTracker Red in ASW for 1 hr at 14°C, washed thoroughly with ASW, and imaged by confocal microscopy before fixation and permeabilization. The cells were then stained with rabbit αBCCa-I and FITC-conjugated secondary antibodies and imaged by a second round of confocal microscopy. Staining with 100 nm MitoTracker Red was performed for 40 min at room temperature before thorough washing with ASW followed by fixation, permeabilization, and staining with rabbit αBCCa-I and FITC-conjugated secondary antibodies. The focal planes of the images in C are slightly offset to show the somatic BCCa-I staining. Scale bars, 50 μm.
That the αBCCa-I staining was intracellular was evident from confocal microscopy. The confocal section of Figure 8B, through the middle of adjacent bag cell neurons, overlies a Nomarski image of the same two cells. The punctate staining, visible both in the somata and the overlapping processes, is clearly not associated with the cell surface and instead is located largely at sites not adjacent to plasma membrane. The punctate appearance of the staining and its intracellular localization strongly suggest that the BCCa-I channel resides in vesicles. In contrast, confocal analysis of bag cell neurons stained with αBCCa-II showed strongest staining at the cell edges, suggesting that BCCa-II is present in the plasma membrane (Fig.8F). Cytoplasmic staining was also typically observed but did not have the punctate quality seen with αBCCa-I. Similar cytoplasmic staining has been observed previously with antibodies against other ion channels and may reflect rapid turnover rates of the ion channel proteins (Maletic-Savatic et al., 1995; Weiser et al., 1995). Thus far, we have not detected punctate αBCCa-I staining in any identified Aplysia neurons other than bag cell neurons. None of those that we have examined (B1, B2, and sensory neurons) stains specifically with this antibody.
Characterization of the BCCa-I-containing vesicles
In an effort to further characterize the vesicles containing the BCCa-I channel, we labeled bag cell neurons with probes directed against various intracellular membrane compartments, including acidic organelles, mitochondria, and dense-core vesicles. Although none of these compartments appeared to coincide completely with the compartment occupied by BCCa-I, the distribution of acidic organelles labeled by the vital dye LysoTracker Red shared some striking similarities with that of the BCCa-I-containing vesicles (Fig. 9A,B). Like BCCa-I, LysoTracker Red staining occasionally was concentrated in neuritic hotspots, and, indeed, 5 of 10 BCCa-I hotspots observed in these experiments colocalized with LysoTracker Red hotspots, as shown in Fig. 9A. The coincidence of staining was not absolute, however, with hotspots in the remaining five cases either somewhat displaced from LysoTracker Red hotspots (3 of 10) or of significantly greater intensity (2 of 10), as in Fig. 9B. Also, the distribution of LysoTracker Red staining in cell somata was typically broader than that of BCCa-I. Because LysoTracker Red stains vitally and can be observed only before cell fixation, it is possible that migration or degradation of BCCa-I between LysoTracker Red observation and cell fixation is masking a bona fide coincidence of staining, and additional experiments with other probes will be necessary to determine whether that is the case. Also, because LysoTracker Red stains a range of acidic compartments, including both endosomes and lysosomes, additional experiments will be required to determine the nature of the acidic compartment whose distribution seems to correlate with BCCa-I staining.
In contrast, BCCa-I did not appear to localize in bag cell neurons to mitochondria, identified by the fixable dye MitoTracker. Figure9C shows an example of mitochondria accumulated in the tips of several short neurites. BCCa-I staining is absent from these neurites but clearly present in the cell soma. BCCa-I also did not appear to colocalize with ELH, a marker for one class of dense-core vesicles targeted to the growth cones and neurites of bag cell neurons (Fisher et al., 1988; Sossin et al., 1990; Azhderian et al., 1994). Although the distributions of the two molecules often overlapped, their relative intensities of staining generally differed. BCCa-I staining was typically more restricted than that of ELH, rarely extending into the very distal regions of bag cell neurites, as was sometimes observed with ELH (Fig. 10A). The neuritic “hotspot” staining seen with αBCCa-I was also not generally observed for ELH, which tended to distribute more uniformly in neurites (Fig. 10B,C). Double-labeling experiments at higher resolution would be required to determine whether BCCa-I is present in a subset of either the ELH-containing vesicles or mitochondria, but there seems to be no one-to-one correspondence between the staining patterns of these molecules and that of BCCa-I.
Fig. 10.

Double-labeling of bag cell neurons with antibodies to BCCa-I and ELH. BCCa-I staining is shown in theleft panel in each case, whereas corresponding staining with rat αELH is shown on the right.Arrows indicate sites of αBCCa-I staining;arrowheads, in contrast, show regions where αELH, but not αBCCa-I, staining is robust. A, A growth cone at the end of a short neurite has a broad web that stains for ELH but not BCCa-I. B, A branching neurite has prominent BCCa-I staining only at the branch-point, with less staining at the growth cone. ELH staining, in contrast, is relatively uniform.C, Accumulation of BCCa-I in a neurite is much more restricted than that of ELH, which tends to fill the neurite. The brightly stained bag cell soma is partially occluded in the top right-hand corner of each frame. Scale bars: A, C, 25 μm; B, 50 μm.
The vesicular localization of BCCa-I makes it an attractive candidate for the “covert” calcium channels of bag cell neurons recruited by PKC. These channels have been suggested, on the basis of patch-clamp studies, to translocate from an intracellular pool to the plasma membrane in response to phorbol esters (Strong et al., 1987). We therefore examined the distribution of BCCa-I in bag cell neurons that had been treated with 20–150 nm PMA for periods of 10 min to 24 hr. We did not observe any overt difference in BCCa-I staining between PMA-treated cells and cells treated with the inactive phorbol ester 4α-PMA under any of the conditions tested, either at the level of the cell somata or the growth cones. Such immunocytochemical examination of fixed cells, however, is likely to lack the sensitivity required to detect subtle changes in BCCa-I distribution, because comparison of the distributions before and after PMA treatment cannot be made in the same cell. This is important, because physiological evidence indicates that the number of channels affected by PKC is likely to be small (see Discussion).
DISCUSSION
We have identified two distinct calcium channel subtypes that are expressed in the bag cell neurons of Aplysia. Comparison of their partially cloned sequences with those of mammalian calcium channels indicates that one channel, BCCa-I, belongs to the ABE subfamily of α1 subunits, whereas the other, BCCa-II, belongs to the SCD subfamily. The tissue distributions of the two channels as determined by immunoblotting and immunohistochemistry are also consistent with these conclusions. Although BCCa-II, like its mammalian counterparts, is broadly expressed in neurons, glia, and muscle, BCCa-I has so far been identified only in neurons and thus seems to share the more restricted expression pattern of ABE subfamily members. The subcellular distributions of the twoAplysia channels is also quite different: BCCa-II is relatively uniformly distributed in the membranes of bag cell neurons, whereas BCCa-I localizes to a population of vesicles primarily concentrated in the cell somata and growth cones. The latter pattern of expression has not been described for any of the cloned mammalian channels, although evidence for intracellular pools of two members of the ABE subfamily of calcium channels has been reported (Passafaro et al., 1994; Yokoyama et al., 1995).
The numerous features that bag cell neuron calcium channels share with their mammalian counterparts suggest the phylogenetic preservation of particular roles for the two broad subfamilies of calcium channel α1 subunits. The observation that mammalian neuroendocrine cells often express members of both subfamilies also supports this conclusion. Molecular identification of the calcium channels expressed in neuroendocrine cells has thus far been restricted primarily to pituitary-derived cell lines in which expression of α1A, α1B, α1C, and α1D have all been reported (Liévano et al., 1994). Pharmacological evidence, however, also supports the conclusion that members of both subfamilies are expressed in native neuroendocrine cells (Lemos and Nowycky, 1989; Wang et al., 1992; Kuryshev et al., 1995).
The finding that bag cell neurons express two classes of calcium channel α1 subunit is also consistent with the previous physiological identification of two distinct calcium conductances in these cells. The physiology and pharmacology of the two bag cell neuron calcium currents is remarkably similar: both are high voltage-activated, slowly inactivating currents, and both are sensitive to higher concentrations of the dihydropyridine nifedipine (Strong et al., 1987). Both channels thus seem to resemble most closely the L-type channels of vertebrates. This is surprising in light of the apparent sequence similarity of BCCa-I to the dihydropyridine-insensitive vertebrate channels. It is unlikely, however, that sensitivity to dihydropyridines in invertebrate channels correlates with membership in the SCD subfamily as it does in vertebrates. Indeed, theDrosophila calcium channel Dmca1D is believed to be dihydropyridine-insensitive, although with 64% sequence identity to vertebrate α1D subunits it is grouped with that class (Zheng et al., 1995). Moreover, the calcium currents of bag cell neurons do not display the full range of dihydropyridine sensitivity, because they are inhibited only by high concentrations of dihydropyridine antagonists and are unaffected by dihydropyridine agonists such as BayK 8644 (Nerbonne and Gurney, 1987; Strong et al., 1987).
Supporting the conclusion that BCCa-I and BCCa-II underlie the observed calcium currents of bag cell neurons are their strikingly different subcellular distributions, which suggest that the two channels have very different functions. This is also true of the two bag cell neuron calcium currents. One of the calcium conductances is observed consistently in patch-clamp recordings of bag cell neuron membranes, and its current seems to underlie the calcium-based action potentials evoked from bag cell neurons by electrical stimulation. The other conductance is detectable in the membrane only after stimulation of PKC and seems to underlie the enhancement of action potentials and ELH release seen during the afterdischarge. BCCa-II, with its relatively uniform surface expression in bag cell neurons, is a plausible candidate for the basal calcium current seen in bag cell neurons, whereas BCCa-I represents a plausible candidate for the PKC-sensitive calcium conductance.
Several lines of evidence have suggested that calcium channel recruitment by PKC in bag cell neurons may involve translocation of channels from an intracellular pool. First, the 24 pS, PKC-sensitive channels are observed in patch-clamped membranes only after PKC stimulation. Furthermore, formation of either on-cell or whole-cell patches before PKC stimulation disrupts channel recruitment (Strong et al., 1987). This suggests that recruitment is not mediated simply by phosphorylation of a calcium channel resident in the plasma membrane, as has been described in many other systems. Second, calcium imaging studies show that PKC enhances growth cone size concomitantly with electrically stimulated calcium entry, suggesting that calcium entry may be coupled to membrane addition (Knox et al., 1992). The vesicular distribution of BCCa-I in bag cell neuron somata and growth cones is consistent with a role for this channel in both recruitment by translocation and potentiation of ELH release.
The number of 24 pS channels required to account for the observed PKC-sensitive currents in bag cell neurons can be calculated to be on the order of 10,000 per cell, assuming an open probability of 0.1 at +20 mV (Strong et al., 1987). Moreover, patch-clamp recordings indicate that the 24 pS channels are not clustered (Strong et al., 1987). This means that detection of translocated channels may be at or beyond the detection limits of fluorescence microscopy. It is therefore not surprising that we failed to observe an altered distribution of BCCa-I in bag cell neurons treated with PKC activators, an observation that also implies that any translocation of BCCa-I must affect only a small fraction of the total number of channels. More sensitive histochemical methods (involving, for example, use of an antibody against an extracellular epitope to directly monitor changes in the surface expression of BCCa-I) may help assess the possible translocation of BCCa-I channels in the future. An alternative approach to identifying BCCa-I as the PKC-sensitive channel would involve correlating the magnitude of PKC-sensitive calcium currents in bag cell neurons with the degree of punctate staining. We are currently pursuing this approach in juvenile bag cell neurons in which BCCa-I expression levels vary markedly (B. White, T. Nick, T. Carew, and L. Kaczmarek, unpublished observation).
Additional characterization of the membrane compartment occupied by BCCa-I may also help elucidate the function of the channel. Our evidence suggests that BCCa-I does not localize to the vesicles that carry ELH, although additional studies with antibodies against both ELH and other bag cell peptides will be necessary to rule out localization to a dense-core vesicle compartment. The frequent coincidence of BCCa-I hotspots with LysoTracker Red staining at sites where membrane remodeling is occurring (growth cones, neuritic branch points, and sites of contact) suggests the possible recycling of BCCa-I via an endosomal pathway. This is interesting in light of recent findings that the Glut-4 glucose transporter of mammalian adipocytes, which is translocated to the plasma membrane in response to insulin stimulation, seems to reside in endosomes or an endosome-like compartment (Hanpeter and James, 1995). Alternatively, coincidence of BCCa-I and LysoTracker staining may reflect accumulation of BCCa-I in lysosomes for degradation. Because neither ELH nor BCCa-II (which must also be transported to the membrane in vesicles) exhibits hotspots, it seems unlikely that the coincidence of BCCa-I and LysoTracker staining reflects a general feature of vesicle trafficking in bag cell neurons. Clearly, additional work will be necessary to determine the nature of the acidic compartment that correlates with BCCa-I localization and to establish whether BCCa-I localizes to this compartment at a specific point in its biogenesis.
Footnotes
This work was supported by National Institutes of Health (NIH) Grant NS18492 to L.K.K. and NIH Research Service Award NS09258-02 to B.H.W. We thank Dr. Spyros Artavanis-Tsakanos and Dr. Sue Hockfield for use of the confocal microscope and cryostat microtome, respectively. We also thank Dr. Arlene Chiu and Dr. Richard Scheller for αELH antibodies. Thanks also to Dr. Grace Gray, Laurent Caron, and Gail Kelly for technical advice.
Correspondence should be addressed to Leonard K. Kaczmarek, Yale University School of Medicine, 333 Cedar Street, New Haven, CT 06520.
REFERENCES
- 1.Azhderian EM, Hefner D, Lin C-H, Kaczmarek LK, Forscher P. Cyclic AMP modulates fast axonal transport in Aplysia bag cell neurons by increasing the probability of single organelle movement. Neuron. 1994;12:1223–1233. doi: 10.1016/0896-6273(94)90439-1. [DOI] [PubMed] [Google Scholar]
- 2.Beushausen S, Bergold P, Sturner S, Elste A, Roytenberg V, Schwartz JH, Bayley H. Two catalytic subunits of cAMP-dependent protein kinase generated by alternative RNA splicing are expressed in Aplysia neurons. Neuron. 1988;1:853–864. doi: 10.1016/0896-6273(88)90133-x. [DOI] [PubMed] [Google Scholar]
- 3.Conn PJ, Kaczmarek LK. The bag cell neurons of Aplysia: a model for the study of the molecular mechanisms involved in the control of prolonged animal behaviors. Mol Neurobiol. 1989;3:237–273. doi: 10.1007/BF02740607. [DOI] [PubMed] [Google Scholar]
- 4.Conn PJ, Strong JS, Kaczmarek LK. Inhibitors of protein kinase C prevent enhancement of calcium current and action potentials in peptidergic neurons of Aplysia. J Neurosci. 1988;9:480–487. doi: 10.1523/JNEUROSCI.09-02-00480.1989. [DOI] [PMC free article] [PubMed] [Google Scholar]
- 5.Dunlap K, Luebke JI, Turner TJ. Exocytotic Ca2+ channels in mammalian central neurons. Trends Neurosci. 1995;18:89–98. [PubMed] [Google Scholar]
- 6.Engebrecht J, Brent R. Boiling miniprep. In: Ausubel F, Brent R, Kingston RE, Moore DD, Seidman JG, Smith JA, Struhl K, editors. Current protocols in molecular biology. Wiley; New York: 1995. pp. 1.6.4–1.6.5. [Google Scholar]
- 7.Fisher JM, Sossin W, Newcomb R, Scheller R. Multiple neuropeptides derived from a common precursor are differentially packaged and transported. Cell. 1988;54:813–822. doi: 10.1016/s0092-8674(88)91131-2. [DOI] [PubMed] [Google Scholar]
- 8.Frazier WT, Kandel ER, Kupfermann I, Waziri R, Coggeshall RE. Morphological and functional properties of identified neurons in the abdominal ganglion of Aplysia californica. J Neurophysiol. 1967;30:1288–1351. [Google Scholar]
- 9.Fujita Y, Mynlieff M, Dirksen RT, Kim M-S, Niidome T, Nakai J, Friedrich T, Iwabe N, Miyata T, Furuichi T, Furutama D, Mikoshiba K, Mori Y, Beam KG. Primary structure and functional expression of the ω-conotoxin-sensitive N-type calcium channel from rabbit brain. Neuron. 1993;10:585–598. doi: 10.1016/0896-6273(93)90162-k. [DOI] [PubMed] [Google Scholar]
- 10.Gallagher S. Visualization with luminescent substrates. In: Ausubel F, Brent R, Kingston RE, Moore DD, Seidman JG, Smith JA, Struhl K, editors. Current protocols in molecular biology. Wiley; New York: 1995. pp. 10.8.11–10.8.13. [Google Scholar]
- 11.Genetics Computer Group. Program manual for the Wisconsin package, version 8. Genetics Computer Group, University of Wisconsin; Madison, WI: 1994. [Google Scholar]
- 12.Hanpeter D, James DE. Characterization of the intracellular GLUT-4 compartment. Mol Membr Biol. 1995;12:263–269. doi: 10.3109/09687689509072426. [DOI] [PubMed] [Google Scholar]
- 13.Hell JW, Westenbroek RE, Warner C, Ahlijanian MK, Prystay W, Gilbert MM, Snutch TP, Catterall WA. Identification and differential subcellular localization of the neuronal class C and class D L-type calcium channel α1 subunits. J Cell Biol. 1993;123:949–962. doi: 10.1083/jcb.123.4.949. [DOI] [PMC free article] [PubMed] [Google Scholar]
- 14.Hui A, Ellinor PT, Krizanova O, Wang J-J, Diebold RJ, Schwartz A. Molecular cloning of multiple subtypes of a novel rat brain isoform of the α1 subunit of the voltage-dependent calcium channel. Neuron. 1991;7:35–44. doi: 10.1016/0896-6273(91)90072-8. [DOI] [PubMed] [Google Scholar]
- 15.Knox RJ, Quattrocki EA, Connor JA, Kaczmarek LK. Recruitment of Ca2+ channels by protein kinase C during rapid formation of putative neuropeptide release sites in isolated Aplysia neurons. Neuron. 1992;8:883–889. doi: 10.1016/0896-6273(92)90202-o. [DOI] [PubMed] [Google Scholar]
- 16.Kreiner T, Rothbard JB, Schoolnik GK, Scheller RH. Antibodies to synthetic peptides defined by cDNA cloning reveal a network of peptidergic neurons in Aplysia. J Neurosci. 1984;4:2581–2589. doi: 10.1523/JNEUROSCI.04-10-02581.1984. [DOI] [PMC free article] [PubMed] [Google Scholar]
- 17.Kuryshev Y, Childs GV, Ritchie AK. Three high threshold calcium channel subtypes in rat corticotropes. Endocrinology. 1995;136:3916–3924. doi: 10.1210/endo.136.9.7649100. [DOI] [PubMed] [Google Scholar]
- 18.Laemmli UK. Cleavage of structural proteins during the assembly of the head of bacteriophage T4. Nature. 1970;227:680–685. doi: 10.1038/227680a0. [DOI] [PubMed] [Google Scholar]
- 19.Lauritzen E, Flyge H, Holm A. Enzyme-linked immunosorbent assay (ELISA). In: Malik VS, Lillehoj EP, editors. Antibody techniques. Academic; New York: 1994. pp. 234–248. [Google Scholar]
- 20.Lemos J, Nowycky MC. Two types of calcium channels coexist in peptide-releasing vertebrate nerve terminals. Neuron. 1989;2:1419–1426. doi: 10.1016/0896-6273(89)90187-6. [DOI] [PubMed] [Google Scholar]
- 21.Liévano A, Bolden A, Horn R. Calcium channels in excitable cells: divergent genotypic and phenotypic expression of α1-subunits. Am J Physiol. 1994;267:C411–C424. doi: 10.1152/ajpcell.1994.267.2.C411. [DOI] [PubMed] [Google Scholar]
- 22.Loechner KJ, Mattessich-Arrandale J, Azhderian EM, Kaczmarek LK. Inhibition of peptide release from invertebrate neurons by the protein kinase inhibitor H-7. Brain Res. 1992;581:315–318. doi: 10.1016/0006-8993(92)90724-n. [DOI] [PubMed] [Google Scholar]
- 23.Loechner KJ, Kream RM, Dunlap K. Calcium currents in a pituitary cell line (AtT-20): Differential roles in stimulus-secretion coupling. Endocrinology. 1996;137:1–9. doi: 10.1210/endo.137.4.8625921. [DOI] [PubMed] [Google Scholar]
- 24.Maletic-Savatic M, Lenn NJ, Trimmer JS. Differential spatiotemporal expression of K+ channel polypeptides in rat hippocampal neurons developing in situ and in vitro. J Neurosci. 1995;15:3840–3851. doi: 10.1523/JNEUROSCI.15-05-03840.1995. [DOI] [PMC free article] [PubMed] [Google Scholar]
- 25.Marossian SS, Lowey S. Preparation of myosin and its subfragments from rabbit skeletal muscle. Methods Enzymol. 1982;85:55–71. doi: 10.1016/0076-6879(82)85009-x. [DOI] [PubMed] [Google Scholar]
- 26.Mori Y, Friedrich T, Kim M-S, Mikami A, Nakai J, Ruth P, Bosse E, Hofmann F, Flockerzi V, Furuichi T, Mikoshiba K, Imoto K, Tanabe T, Numa S. Primary structure and functional expression from complementary DNA of a brain calcium channel. Nature. 1991;350:398–402. doi: 10.1038/350398a0. [DOI] [PubMed] [Google Scholar]
- 27.Nerbonne J, Gurney AM. Blockade of Ca2+ and K+ currents in bag cell neurons of Aplysia californica by dihydropyridine Ca2+ antagonists. J Neurosci. 1987;7:882–893. doi: 10.1523/JNEUROSCI.07-03-00882.1987. [DOI] [PMC free article] [PubMed] [Google Scholar]
- 28.Niidome T, Kim M-S, Friedrich T, Mori Y. Molecular cloning and characterization of a novel calcium channel from rabbit brain. FEBS Lett. 1992;308:7–13. doi: 10.1016/0014-5793(92)81038-n. [DOI] [PubMed] [Google Scholar]
- 29.Passafaro M, Clementi F, Pollo A, Carbone E, Sher E. ω-Conotoxin and Cd2+ stimulate the recruitment to the plasma membrane of an intracellular pool of voltage-operated Ca2+ channels. Neuron. 1994;12:317–326. doi: 10.1016/0896-6273(94)90274-7. [DOI] [PubMed] [Google Scholar]
- 30.Perez-Reyes E, Schneider T. Molecular biology of calcium channels. Kidney Int. 1995;48:1111–1124. doi: 10.1038/ki.1995.395. [DOI] [PubMed] [Google Scholar]
- 31.Perez-Reyes E, Wei X, Castellano A, Birnbaumer L. Molecular diversity of L-type calcium channels. J Biol Chem. 1990;265:20430–20436. [PubMed] [Google Scholar]
- 32.Perney TM, Hirning SE, Leeman SE, Miller RJ. Dihydropyridine effects on release of substance P. Proc Natl Acad Sci USA. 1986;83:6656–6660. doi: 10.1073/pnas.83.17.6656. [DOI] [PMC free article] [PubMed] [Google Scholar]
- 33.Pinsker HM, Parsons DW. Temperature dependence of egg laying in Aplysia brasiliana and A. californica. J Comp Physiol [B] 1985;156:21–27. doi: 10.1007/BF00692922. [DOI] [PubMed] [Google Scholar]
- 34.Pragnell M, De Waard M, Mori Y, Tanabe T, Snutch TP, Campbell KP. Calcium channel β-subunit binds to a conserved motif in the I–II cytoplasmic linker of the α1-subunit. Nature. 1994;368:67–70. doi: 10.1038/368067a0. [DOI] [PubMed] [Google Scholar]
- 35.Robitaille R, Bourque M-J, Vandaele S. Localization of L-type Ca2+ channels at perisynaptic glial cells of the frog neuromuscular junction. J Neurosci. 1996;16:148–158. doi: 10.1523/JNEUROSCI.16-01-00148.1996. [DOI] [PMC free article] [PubMed] [Google Scholar]
- 36.Sacchi N. Single-step RNA isolation from cultured cells or tissues. In: Ausubel F, Brent R, Kingston RE, Moore DD, Seidman JG, Smith JA, Struhl K, editors. Current protocols in molecular biology. Wiley; New York: 1995. pp. 4.2.4–4.2.6. [Google Scholar]
- 37.Satin LS, Tavalin SJ, Kinard TA, Teague J. Contribution of L- and non-L-type calcium channels to voltage-gated calcium current and glucose-dependent insulin secretion in HIT-T15 cells. Endocrinology. 1995;136:4589–4601. doi: 10.1210/endo.136.10.7545106. [DOI] [PubMed] [Google Scholar]
- 38.Seino S, Chen L, Seino M, Blondel O, Takeda J, Johnson JH, Bell GI. Cloning of the α1 subunit of a voltage-dependent calcium channel expressed in pancreatic β cells. Proc Natl Acad Sci USA. 1992;89:584–588. doi: 10.1073/pnas.89.2.584. [DOI] [PMC free article] [PubMed] [Google Scholar]
- 39.Smith DB. Enzymatic cleavage of fusion proteins with thrombin. In: Ausubel F, Brent R, Kingston RE, Moore DD, Seidman JG, Smith JA, Struhl K, editors. Current protocols in molecular biology. Wiley; New York: 1995. pp. 16.4.8–16.4.9. [Google Scholar]
- 40.Smith DB, Corcoran LM. Expression and purification of glutathione-S-transferase fusion proteins. In: Ausubel F, Brent R, Kingston RE, Moore DD, Seidman JG, Smith JA, Struhl K, editors. Current protocols in molecular biology. Wiley; New York: 1995. pp. 16.7.1–16.7.7. [DOI] [PubMed] [Google Scholar]
- 41.Snutch TP, Leonard JP, Gilbert MM, Lester HA, Davidson N. Rat brain expresses a heterogeneous family of calcium channels. Proc Natl Acad Sci USA. 1990;87:3391–3395. doi: 10.1073/pnas.87.9.3391. [DOI] [PMC free article] [PubMed] [Google Scholar]
- 42.Snutch TP, Tomlinson WJ, Leonard JP, Gilbert MM. Distinct calcium channels are generated by alternative splicing and are differentially expressed in the mammalian CNS. Neuron. 1991;7:45–57. doi: 10.1016/0896-6273(91)90073-9. [DOI] [PubMed] [Google Scholar]
- 43.Sossin WS, Sweet-Cordero A, Scheller RH. Dale’s hypothesis revisited: different neuropeptides derived from a common prohormone are targeted to different processes. Proc Natl Acad Sci USA. 1990;87:4845–4848. doi: 10.1073/pnas.87.12.4845. [DOI] [PMC free article] [PubMed] [Google Scholar]
- 44.Strong JA, Fox AP, Tsien RW, Kaczmarek LK. Stimulation of protein kinase C recruits covert calcium channels in Aplysia bag cell neurons. Nature. 1987;325:714–717. doi: 10.1038/325714a0. [DOI] [PubMed] [Google Scholar]
- 45.Strumwasser F. The bag cell neuroendocrine system of Aplysia. In: Ganten D, Pfaff D, editors. Stimulus-secretion coupling in neuroendocrine systems. Springer; New York: 1988. pp. 105–122. [Google Scholar]
- 46.Tsien RW, Lipscombe D, Madison D, Bley K, Fox A. Reflections on Ca2+-channel diversity, 1988–1994. Trends Neurosci. 1995;18:52–54. [PubMed] [Google Scholar]
- 47.Wang X, Treistman SN, Lemos JR. Two types of high-threshold calcium currents inhibited by ω-conotoxin in nerve terminals of rat neurohypophysis. J Physiol (Lond) 1992;445:181–199. doi: 10.1113/jphysiol.1992.sp018919. [DOI] [PMC free article] [PubMed] [Google Scholar]
- 48.Weiser M, Bueno E, Sekirnjak C, Martone ME, Baker H, Hillman D, Chen S, Thornhill W, Ellisman M, Rudy B. The potassium channel subunit KV3.1b is localized to somatic and axonal membranes of specific populations of CNS neurons. J Neurosci. 1995;15:4298–4314. doi: 10.1523/JNEUROSCI.15-06-04298.1995. [DOI] [PMC free article] [PubMed] [Google Scholar]
- 49.Westenbroek RE, Hell JW, Warner C, Dubel SJ, Snutch TP, Catterall WA. Biochemical properties and subcellular distribution of an N-type calcium channel α1 subunit. Neuron. 1992;9:1099–1115. doi: 10.1016/0896-6273(92)90069-p. [DOI] [PubMed] [Google Scholar]
- 50.Yokoyama CT, Westenbroek RE, Hell JW, Soong TW, Snutch TP, Catterall WA. Biochemical properties and subcellular distribution of the neuronal class E calcium channel α1 subunit. J Neurosci. 1995;15:6419–6432. doi: 10.1523/JNEUROSCI.15-10-06419.1995. [DOI] [PMC free article] [PubMed] [Google Scholar]
- 51.Zhang J-F, Randall AD, Ellinor PT, Horne WA, Sather WA, Tanabe T, Schwarz TL, Tsien RW. Distinctive pharmacology and kinetics of cloned neuronal Ca2+ channels and their possible counterparts in mammalian CNS neurons. Neuropharmacology. 1993;32:1075–1088. doi: 10.1016/0028-3908(93)90003-l. [DOI] [PubMed] [Google Scholar]
- 52.Zheng W, Feng G, Ren D, Eberl DF, Hannan F, Dubald M, Hall LM. Cloning and characterization of a calcium channel α1 subunit from Drosophila melanogaster with similarity to the rat brain type D isoform. J Neurosci. 1995;15:1132–1143. doi: 10.1523/JNEUROSCI.15-02-01132.1995. [DOI] [PMC free article] [PubMed] [Google Scholar]