Abstract
The glutamate receptor δ2 subunit (GluRδ2) is specifically expressed in cerebellar Purkinje cells (PCs) from early developmental stages and is selectively localized at dendritic spines forming synapses with parallel fibers (PFs). Targeted disruption of the GluRδ2 gene leads to a significant reduction of PF→PC synapses. To address its role in the synaptogenesis, the morphology and electrophysiology of PF→PC synapses were comparatively examined in developing GluRδ2 mutant and wild-type cerebella. PCs in GluRδ2 mutant mice were normally produced, migrated, and formed spines, as did those in wild-type mice. At the end of the first postnatal week, 74–78% of PC spines in both mice formed immature synapses, which were characterized by small synaptic contact, few synaptic vesicles, and incomplete surrounding by astroglial processes, eliciting little electrophysiological response. During the second and third postnatal weeks when spines and terminals are actively generated, the percentage of PC spines forming synapses attained 98–99% in wild type but remained as low as 55–60% in mutants, and the rest were unattached to any nerve terminals. As a result, the number of PF synapses per single-mutant PCs was reduced to nearly a half-level of wild-type PCs. Parallelly, PF stimulation less effectively elicited EPSCs in mutant PCs than in wild-type PCs during and after the second postnatal week. These results suggest that the GluRδ2 is involved in the stabilization and strengthening of synaptic connectivity between PFs and PCs, leading to the association of all PC spines with PF terminals to form functionally mature synapses.
Keywords: glutamate receptor δ2 subunit, gene knock-out, cerebellum, Purkinje cell, parallel fiber synapse, synapse formation, development, mouse
Purkinje cells (PCs) receive two distinct excitatory inputs: one from parallel fibers (PFs), the bifurcated axons of granule cells (GCs), and another from climbing fibers (CFs), which originates in the inferior olive (Palay and Chan-Palay, 1974; Ito, 1984). The PF synapse is formed on spines of distal PC dendrites and accounts for >95% of PC synapses (Sotelo, 1978). In contrast, CFs establish strong excitatory synapses along the proximal dendrites of PCs (Palay and Chan-Palay, 1974; Ito, 1984), triggering Ca2+ entry through voltage-dependent channels (Crépel and Jaillard, 1991; Konnerth et al., 1992). In adult animals, most PCs are innervated by single CFs, and this one-to-one relationship is preceded by a transient stage of multiple innervation by surplus CFs (Mason et al., 1990). Analyses of x-ray-irradiated animals and cerebellar mutants have revealed that the formation of intact PF synapses is a prerequisite step to the developmental switch of CF innervation (Altman and Anderson, 1972;Crépel, 1982; Mariani, 1982). Heterosynaptic interaction also occurs in the mature cerebellum; co-activation of PF and CF synapses onto PCs induces long-term depression (LTD) of transmission at the PF→PC synapse, a form of synaptic plasticity considered to be a cellular basis for motor learning (Ito, 1989; Linden, 1994).
The glutamate receptor channel (GluR) mediates most of the fast excitatory synaptic transmission in the vertebrate CNS (Mayer and Westbrook, 1987) and is also essential for synaptic plasticity underlying development, learning, and memory (Ito, 1989; McDonald and Johnston, 1990; Bliss and Collingridge, 1993). The δ2 subunit (GluRδ2) is one of 16 GluR subunits (Mishina et al., 1993; Seeburg, 1993; Hollmann and Heinemann, 1994; Nakanishi and Masu, 1994), and is specifically expressed in PCs (Araki et al., 1993; Lomeli et al., 1993). Immunoelectron microscopy has shown that GluRδ2 is localized at dendritic spines synapsing with PF terminals, not with CF terminals (Mayat et al., 1995; Takayama et al., 1995; Landsend et al., 1997). The administration of antisense oligonucleotides prevents LTD of glutamate responsiveness in cultured PCs (Hirano et al., 1994; Jeromin et al., 1996). Targeted disruption of the GluRδ2 gene results in (1) reduced PF synapses, (2) persistence of surplus CFs, (3) impaired cerebellar LTD, and (4) motor discoordination (Kashiwabuchi et al., 1995). The cerebellum of GluRδ2-deficient mouse has thus been considered an excellent model system to investigate the molecular mechanisms underlying synapse formation, synaptic plasticity, motor learning, and their relationships (Kashiwabuchi et al., 1995). In the present study, we analyzed developing GluRδ2 mutant and wild-type cerebella to address its role in PF→PC synapse formation. During the second and third postnatal weeks, the percentage of PC spines forming synapses attained 98–99% in wild-type PCs, whereas it remained as low as 55–60% in mutant PCs. Therefore, the GluRδ2-associated postsynaptic mechanism plays an important role in the stabilization and strengthening of synaptic connectivity during cerebellar development. This molecular function leads to a recruitment of all PC spines to form mature PF synapses, which are sufficient to drive a switch of CF innervation from multiple to mono-innervation during development.
MATERIALS AND METHODS
Animals. GluRδ2 mutant mice were produced as described previously (Kashiwabuchi et al., 1995). Both mutant and wild-type mice used were on a C57BL/6 × CBA genetic background.
Light microscopy. Under deep anesthesia with chloral hydrate (350 mg/kg body weight, i.p.), mice at postnatal day 35 (P35) were perfused transcardially with 4% paraformaldehyde in 0.1 msodium phosphate buffer, pH 7.2. The brains were excised quickly from the skull and immersed overnight in the same fixative. A set of three mutant and three wild-type brains was used for preparation of microslicer sections in the parasagittal plane (50 μm thickness; Dosaka, DTK). The microslicer sections were subject to Nissl staining with toluidine blue to measure section area. Microslicer sections were also used for immunohistochemistry with spot 35/calbindin antibody. After overnight incubation with rabbit anti-spot 35/calbindin antibody (1:1000), sections were incubated for 2 hr with FITC-labeled goat anti-rabbit IgG (1:100; Jackson ImmunoResearch, West Grove, PA) and observed on an MRC1024 confocal laser scanning microscope (Bio-Rad, Hercules, CA). Another set of fixed brains were embedded in JB-4 plastic media (Polysciences, Warrington, PA). Parasagittal JB-4 semithin sections (1 μm) cut on an Ultracut E ultramicrotome (Reichert-Jung) were used for measurement of PC number. These sections were photographed on an AX-80 light microscope (Olympus Optical, Tokyo, Japan) at an original magnification of 8.25× and printed on black-and-white paper at a final magnification of 66×.
Electron microscopy. For electron microscopy, three mutant and three wild-type mice at each postnatal stage (P7, P14, P21, and P35) were perfused transcardially with 0.5% glutaraldehyde and 4% paraformaldehyde in 0.1 m sodium cacodylate buffer, pH 7.2. After sectioning by microslicer in the parasagittal plane (400 μm thickness), sections through the cerebellar midline were chosen and immersed in the same fixative overnight. The slices were post-fixed for 2 hr with 1% osmium tetraoxide in 0.1 m sodium cacodylate buffer and block-stained in 1% aqueous uranyl acetate solution. After dehydration using graded alcohols, the slices were embedded in Epon 812. By setting the section thickness at 70 nm, silver–gold ultrathin sections were prepared from the culmen (lobules 4 + 5) on an Ultracut E ultramicrotome and stained with 1% uranyl acetate for 5 min and a mixed lead solution for 2 min. For morphometric measurement of GCs, low-power electron micrographs were randomly taken from the granular layer on an LEM 2000 electron microscope (Topcon) at an original magnification of 430× and printed at a final magnification of 3440×. For measurement of PC spines and PF terminals, high-power electron micrographs were taken from the middle-third depth of the molecular layer on an H7100 electron microscope (Hitachi) at an original magnification of 4000× and printed at a final magnification of 16,000×.
A ribbon consisting of at least 15 serial ultrathin sections was prepared and mounted on a single-slot copper grid (1 × 2 mm) supported with a Formvar membrane. After staining with 1% uranyl acetate for 10 min and a mixed lead solution for 4 min, photographs were taken on an H7100 electron microscope at an original magnification of 4000× and printed at a final magnification of 16,000×. From the serial electron micrographs, we determine the percentage of synaptic contact of PC spines and the contact ratio of PF→PC synapses.
Morphometry and statistics. Using a double-lattice system with 5 mm spacing, the point-counting method of Weibel (1979)was applied to printed photographs as above to measure the section area of the cerebellum and the numerical profile count and volume density of GCs in the granular layer and PC spines in the molecular layer. To calculate the numerical density (NV) of GCs and PC spines, we calculated from the equation of Weibel (1963):NV = 1/β ×NA1.5/VV0.5, where NA is the visible profile count, andVV is the volume fraction of GC nuclei and PC spines. β is a dimensionless shape coefficient and is defined as 1.38, assuming that these structures have a spherical shape.
The numerical density of PCs (NVPC) was calculated from the equation: NVpc = (NAPCn ×T)/{T + [(DPCn2 −k)2]0.5}, whereNAPCn is the number of visible PC nuclei in unit section area, T is section thickness, and k is the minimum nuclear profile diameter (Konigsmark, 1970). The mean nuclear diameter (DPCn) was estimated from the nuclear profile diameter (dPCn):DPCn = 1.27 ×dPCn. All the mean values and SEMs were calculated from three mutant and three wild-type mice, and pvalues were calculated from Student’s t test or χ 2 test.
Electrophysiology. Sagittal cerebellar slices of 250 μm thickness were prepared from wild-type and GluRδ2 mutant mice as described previously (Edwards et al., 1989; Llano et al., 1991; Kano and Konnerth 1992). Whole-cell recording was made from visually identified Purkinje cells using a 40× water immersion objective attached to either an Olympus BH-2 or Zeiss Axioskop upright microscope (Edwards et al., 1989; Llano et al., 1991). The resistance of patch pipettes was 3–6 MΩ when filled with an intracellular solution composed of (in mm): 60 CsCl, 30 Cs-d-gluconate, 20 TEA-Cl, 20 BAPTA, 4 MgCl2, 4 ATP, and 30 HEPES, pH 7.3, adjusted with CsOH. QX314 (5 mm) was added to block Na spikes. The composition of standard bathing solution was (in mm): 125 NaCl, 2.5 KCl, 2 CaCl2, 1 MgSO4, 1.25 NaH2PO4, 26 NaHCO3, and 20 glucose, which was bubbled continuously with a mixture of 95% O2 and 5% CO2. Bicuculline (10 μm) was always present in the saline to block spontaneous IPSCs (Konnerth et al. 1990; Kano et al., 1992). Ionic currents were recorded with either an Axopatch-1D (Axon Instruments) or an EPC-9 (HEKA) patch-clamp amplifier and were stored on a digital audio tape recorder (Sony PC204) for later analysis. Stimulation and on-line data acquisition were performed using the PULSE program on a Macintosh computer (version 7.5, HEKA). The signals were filtered at 3 kHz and digitized at 20 kHz. For stimulation of PFs, a glass pipette with 5–10 μm tip diameter filled with standard saline was used. Square pulses (duration, 0.1 msec; amplitude, 2–15 μA) were applied to the glass pipette.
RESULTS
The PF→PC synapse number is reduced by half, mainly because of impaired synaptic contact of PC spines
Morphological analyses were done for the mid-sagittal cerebellar region, and results presented here were all obtained from three GluRδ2 mutant mice and three wild-type mice at P35. To facilitate quantitative comparisons, the numbers of cells, synaptic elements, and synaptic contacts were expressed as those contained in a 1-mm-thick midsagittal cerebellar slice. Statistic evaluation was performed using the Student’s t test, unless otherwise noted.
The cerebellum of the adult GluRδ2 mutant mouse exhibited normal foliation and laminated cortical structure, as reported previously (Kashiwabuchi et al., 1995). However, we noticed that the thickness of each folium was consistently thinner than that of the wild-type mouse (Fig. 1A,B). To quantify the difference, the area of Nissl-stained cerebellar sections was measured. The mean cerebellar section area was significantly reduced: 6.16 ± 0.11 mm2 in the mutant mouse (mean ± SEM) and 7.01 ± 0.24 mm2 in the wild-type mouse (88%, p = 0.03; Table1). Among cerebellar layers, significant areal reduction was observed for the granular layer (86%,p = 0.02) and molecular layer (86%, p= 0.03) but not for the white matter (101%, p = 0.46; Table 1).
Fig. 1.
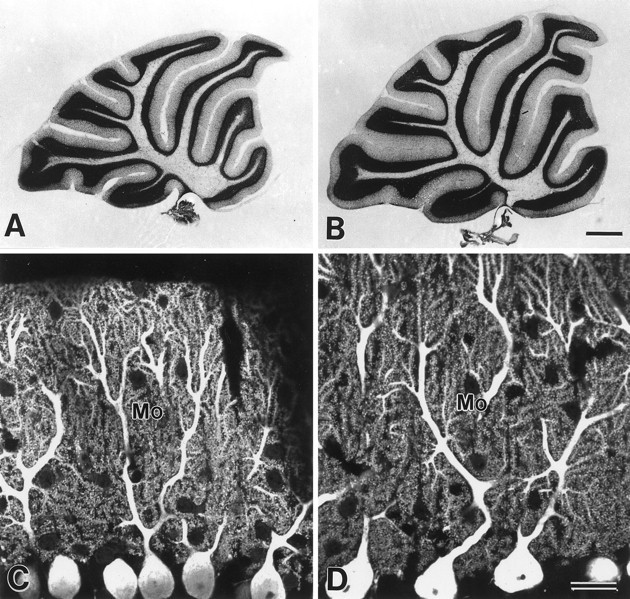
Cerebellar histology and Purkinje cell cytology in the GluRδ2 mutant (A, C) and wild-type mouse (B, D). A, B, Nissl-stained sagittal cerebellar sections. Note reductions in thickness of the granular and molecular layers in the mutant cerebellum. Rostral is to the right, and dorsal is at the top. C, D, Confocal laser scanning microscopic images of PCs immunostained for spot 35/calbindin. Note elaborate branching of PC dendrites studded with numerous spines. Mo, Molecular layer. Scale bars:B, 0.5 mm; D, 20 μm.
Table 1.
Cerebellar section area at P35
| δ2 Mutant (mm2)1-a | Wild-type (mm2)1-a | Ratio | p | |
|---|---|---|---|---|
| Molecular layer | 3.05 ± 0.02 | 3.55 ± 0.13 | 0.86 | 0.03 |
| Granular layer | 2.22 ± 0.08 | 2.57 ± 0.08 | 0.86 | 0.02 |
| White matter | 0.90 ± 0.03 | 0.89 ± 0.04 | 1.01 | 0.46 |
| Total | 6.16 ± 0.11 | 7.01 ± 0.24 | 0.88 | 0.03 |
Values are mean ± SEM;n = 3 for mutant and wild-type mice, respectively.
In both types of mice, flask-shaped cell bodies of PCs were aligned at similar intervals in a monolayer between the granular and molecular layers. The PC number contained in a 1-mm-thick mid-sagittal cerebellar slice was calculated from the density of their nuclei and the measured cerebellar section area. The PC number was obtained as 43,900 ± 2600 in the mutant mouse and 44,900 ± 6200 in the wild-type mouse, showing no significant difference (98%, p = 0.45; Table 2). The GC number was calculated from the nuclear density in the granular layer (Table 2) and the mean area of the granular layer (Table 1). Because the numerical density did not differ significantly (103%, p = 0.42; Table 2), the estimated GC number contained in a 1-mm-thick cerebellar slice in the mutant showed a proportional reduction to the area of the granular layer (88%; Table 2).
Table 2.
Morphometry of Purkinje cells and granule cells at P35
| δ2 Mutant a | Wild-type2-a | Ratio | p | |
|---|---|---|---|---|
| PC number2-b | 43,900 ± 2600 | 44,900 ± 2600 | 0.98 | 0.45 |
| Numerical density of GC (× 106/mm3 of granular layer) | 4.94 ± 0.55 | 4.82 ± 0.26 | 1.03 | 0.43 |
| Estimated GC number2-b | 1.10 × 10⁷ | 1.24 × 10⁷ | 0.88 |
Values are mean ± SEM;n = 3 for mutant and wild-type mice, respectively.
Cell number contained in 1-mm-thick parasagittal cerebellar slice.
When visualizing PC dendrites by immunohistochemistry with the spot 35/calbindin antibody, they exhibited elaborate branching from primary to secondary dendrites and further to tertiary dendrites in both the mutant and wild-type mice (Fig. 1C,D). Although longitudinal outgrowth of the dendrites was slightly decreased because of the reduced thickness of the molecular layer, dendritic spines in the mutant mouse were aligned along the tertiary dendrites as densely as those in the wild-type mouse. By electron microscopy, PC spines in both mice were observed as round or oval profiles containing smooth endoplasmic reticulum but no mitochondria or microtubules (Figs.2A,3A). The numerical density of PC spines in the molecular layer was morphometrically evaluated, using electron micrographs taken randomly from a middle-third depth of the molecular layer. The numerical density showed no significant difference between the mutant and wild-type mice (97%, p = 0.27; Table 3).
Fig. 2.
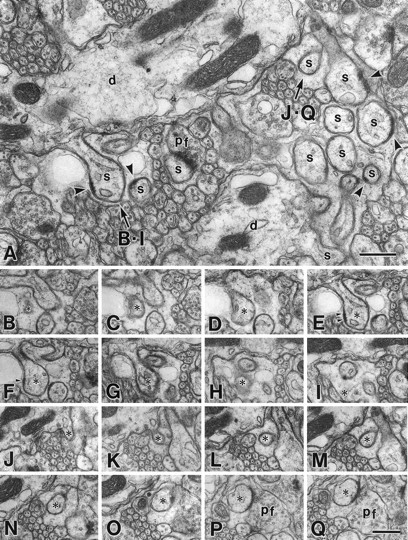
Serial electron micrographs of the molecular layer in the GluRδ2 mutant mouse at P35. A, Image from a set of serial sections. In the mutant mouse, spines (s) protruding from PC dendrites (d) occupy the molecular layer as densely as in the wild-type mouse (Fig. 3A). Note some profiles of unattached spines possess PSD-like dense materials (arrowheads) under the cell membrane.B–I, PC spine (asterisks) unattached to any nerve terminals. Note that small PSD-like dense material is seen under the postsynaptic membrane (arrowheads).J–Q, PC spine (asterisks) in contact with PF terminal (pf). Scale bars, 0.5 μm.
Fig. 3.
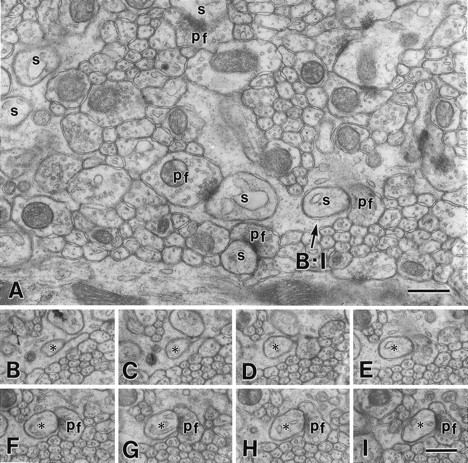
Serial electron micrographs of the molecular layer in a wild-type mouse at P35. A, Image from a set of serial sections. B–I, PC spine (asterisks) in contact with PF terminal (pf). s, PC spine. Scale bars, 0.5 μm.
Table 3.
Morphometry of PF→PC synapse at P35
| δ2 Mutant 3-a | Wild-type3-a | Ratio | p | |
|---|---|---|---|---|
| Numerical density of PC spines (× 109/mm3 of molecular layer) | 1.17 ± 0.02 | 1.21 ± 0.04 | 0.97 | 0.27 |
| Contacted PC spine (%) | 63 ± 5 | 100 ± 0 | 0.63 | 0.009 |
| Estimated PF→PC synapses3-b | 2.25 × 10⁹ | 4.29 × 10⁹ | 0.52 | |
| Per PC | 51,200 | 95,900 | 0.54 | |
| Per GC | 205 | 346 | 0.59 |
Values are mean ± SEM;n = 3 for mutant and wild-type mice, respectively.
Number contained in 1-mm-thick parasagittal cerebellar slice.
On single electron micrographs, the molecular layer of the mutant mouse was conspicuous for its reduced number of PC spine profiles in contact with PF terminals as well as unusual increase of “unattached” PC spines, which were surrounded by Bergmann astrocytes (Figs.2A, 3A). Unattached spines bearing postsynaptic density (PSD)-like fuzzy materials were often encountered in the mutant mouse, whereas they were extremely rare in the wild-type mouse. To determine the presence or absence of synaptic contact onto individual spines, we prepared several sets of serial electron micrographs, from which 80–90 PC spines were sampled for each mouse. In the mutant, 63 ± 5% of PC spines formed synaptic contacts with PF terminals, whereas the rest were unattached and completely surrounded by cell processes of Bergmann astrocytes (Fig.2B–Q, Table 3). Contacted and unattached spines protruded at random from single tertiary dendrites of mutant PCs. Unattached spines consistently possessed a slender spine head and a less developed PSD compared with contacted ones (Fig. 2). In the wild-type mouse, all PC spines contacted PF terminals (100 ± 0%,p = 0.009; Table 3) and possessed a well developed PSD (Fig. 3B–I). Based on the area of the molecular layer, the numerical density and contact percentage of PC spines, and the PC number, the mean PF→PC synapse number per PC was estimated to be 51,200 in the mutant mouse and 95,500 in the wild-type mouse (54%; Table 3). It is clear that the reduction in the GluRδ2 mutant mouse is mainly attributable to the reduced synaptic contact of PC spines and also to the reduced area (or volume) of the molecular layer. The mean PF→PC synapse number per GC was also reduced to 205 in the mutant mouse versus 346 in the wild-type mouse (59%; Table 3).
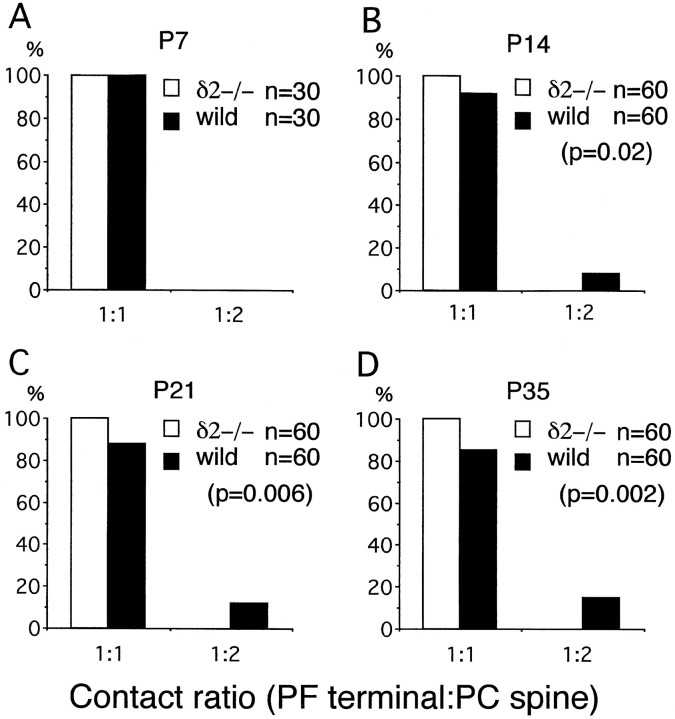
The reduced synaptic contact of mutant PC spines suggests a lowered capacity to stabilize or maintain synaptic connectivity. To examine this possibility, the morphology of contacted PF→PC synapses were compared between the GluRδ2 mutant and wild-type mice. The shape and size of PC spines were similar in both mice. However, a difference in the contact ratio between the PF terminal and PC spine was noticed. On electron micrographs, PF→PC synapses were usually contacts between one terminal and one spine (1:1 contact). Contacts between one terminal and two spines (1:2 contact) were occasionally encountered in the wild-type mouse (Fig. 4) but not in the mutant mouse. When quantifying the difference using serial electron micrographs (20 PF→PC synapses from each mouse), all PF→PC synapses were 1:1 contact in the mutant mouse, whereas in the wild-type mouse 85 ± 3% were 1:1 contacts, and the rest were 1:2 contact (see Fig. 7D) (χ2 test, p = 0.002).
Fig. 4.
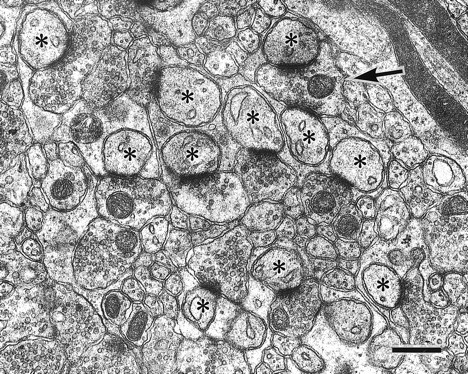
Parallel fiber→Purkinje cell synapses in the wild-type mouse at P35. Asterisks indicate PC spines in contact with PF terminals. PF→PC synapses between one terminal and two spines are occasionally found in wild-type mice. Scale bar, 0.5 μm.
Fig. 7.
Postnatal changes in the contact ratio between the PF terminal and PC spine. A, P7; B, P14;C, P21; D, P35. The total number of PF→PC synapses analyzed is shown in the top right corner. Statistics, χ2 test.
Impaired PF→PC synapse formation appears during the second postnatal week
To determine the developmental stages at which the impaired PF→PC synapse formation first appears in the GluRδ2 mutant mouse, electron microscopic analyses were made for three mutant and three wild-type mice at P7, P14, and P21.
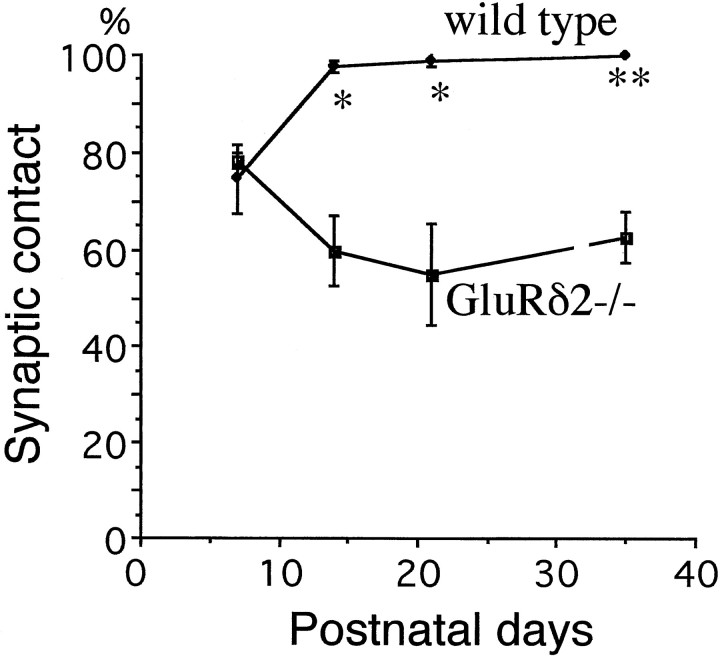
At P7, the molecular layer was very thin in both strains of mice, and the number of asymmetrical synapses between PF terminals and PCs was much fewer compared with later stages (Fig.5A,B). The PF→PC synapses expressed immature morphological features, as reported previously (Larramendi, 1969; Robain et al., 1981), including small terminal swellings with few synaptic vesicles, small synaptic contacts and PSD, and incomplete surrounding by astroglial processes. These immature morphological features were in marked contrast to asymmetrical synapses distributed adjacent to cell bodies of PCs; they were contacts between large nerve terminals with numerous synaptic vesicles and one or more large protrusions having well developed PSD. These were presumably perisomatic CF synapses. Using serial electron micrographs, 20 PC spines were examined in each mouse to determine the percentage of synaptic contacts. Moreover, 10 PF→PC synapses were examined to obtain the contact ratio between the PF terminal and PC spine. At P7, no significant difference was detected in the synaptic contact percentage of PC spines (78 ± 1% in the mutant and 74 ± 7% in the wild-type; p = 0.32; Fig.6), and all PF→PC synapses were 1:1 contact in the mutant and wild-type mouse (Fig.7A).
Fig. 5.
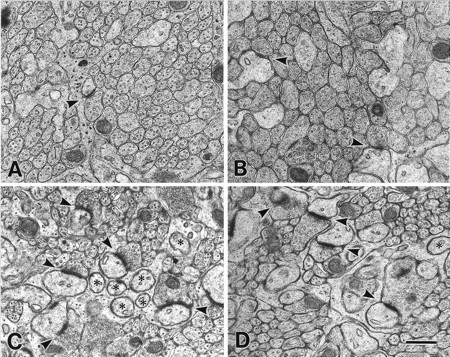
Electron micrographs showing developing PF→PC synapses in the GluRδ2 mutant (A, C) and wild-type (B, D) mice. A, B, P7. Note small synaptic contacts (arrowheads), which are not fully surrounded by astroglial investments in both mice. C,D, P14. PF→PC synapses (arrowheads) develop normal structure in both mice. However, profiles of unattached PC spines (asterisks) are more obvious in the mutant mouse. Note that unattached spines often possess a small PSD-like condensation in the mutant mouse but not in the wild-type mouse. Scale bar, 0.5 μm.
Fig. 6.
Postnatal changes in the percentage of contacted PC spines. The total numbers of PC spines analyzed from mutant and wild-type mice are n = 60 or 60 at P7,n = 122 or 116 at P14, n = 60 or 90 at P21, and n = 271 or 253 at P35, respectively. p = 0.32 at P7, 0.02 at P14 and P21, and 0.009 at P35. Statistics, Student’s t test.
At P14, the thickness of the molecular layer and the number of PC spines were remarkably increased in both the mutant and wild-type mice (Fig. 5C,D). However, unattached PC spine profiles possessing PSD-like fuzzy materials were observed in the mutant mouse, not in the wild-type mouse. Using serial electron micrographs made from the middle third of the molecular layer, 20–41 PC spines were examined in each mouse at P14 and P21 to determine the synaptic contact percentage onto PC spines. The score was 60 ± 7% in the mutant mouse and 98 ± 1% in the wild type, showing a significant difference (p = 0.02; Fig. 5). A similar difference was observed at P21 (55 ± 10% in the mutant and 99 ± 1% in the wild type) (p = 0.02, Fig.6). Twenty PF→PC synapses were examined in each mouse to obtain the contact ratio between the PF terminal and PC spine. All PF→PC synapses examined in the mutant mouse were 1:1 contact at P14 and P21, whereas in the wild-type mouse 92 ± 2% (P14) and 88 ± 2% (P21) of PF→PC synapses were 1:1 contact, and the rest were 1:2 contact (Fig. 7B,C). The differences in the contact ratio were statistically significant between mutant and wild-type mice (χ2 test, p = 0.02 at P14 andp = 0.006 at P21). Thus, impaired PF→PC synapse formation emerges during the second postnatal week in the GluRδ2 mutant mouse.
PF stimulation is consistently less effective to elicit PF EPSC in GruRδ2 mutant PCs
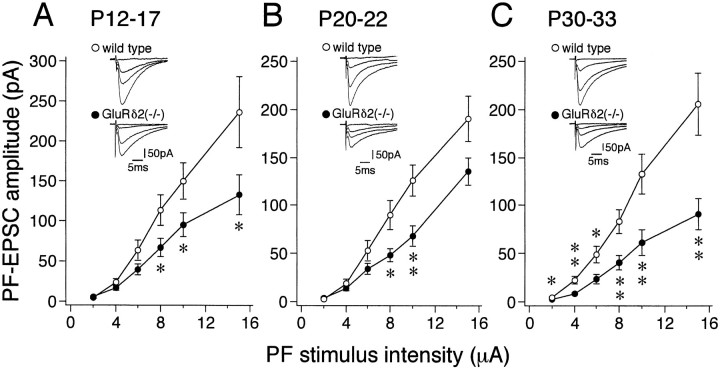
The reduced PF→PC synapse number in the GluRδ2 mutant cerebellum may affect the responses of PCs to PF stimulation. To address this issue, we recorded PF-mediated EPSCs (PF-EPSCs) from PCs in mutant and wild-type mice at P6–P8, P14–P17, P18–P22, and P30–P33. PCs were recorded from parasagittal cerebellar slices (250 μm) in the whole-cell configuration (Edwards et al., 1989; Konnerth et al., 1990; Llano et al., 1991; Kano et al., 1992). PFs were stimulated in the molecular layer at the deeper one-third from the pial surface. At P6–P8, we could not reliably induce PF-EPSCs in isolation from CF-EPSCs, suggesting that PF→PC synapses are functionally immature at this stage of development. At later stages, stimulation of PFs readily elicited EPSCs. Their amplitudes gradually increased with increments of PF stimulus intensity in both the wild-type and GluRδ2 mutant mice (Fig.8A–C). However, PF stimulation was consistently less effective to elicit EPSCs in mutant PCs than wild-type PCs. The slopes of the amplitude intensity curves for wild-type PCs were significantly steeper than mutant PCs at P14–P17 (Fig. 8A), P18–P22 (Fig.8B), and P30–P33 (Fig. 8C). In contrast, the decay time constants of PF-EPSCs were not significantly different between wild-type and GluRδ2 mutant PCs. The values that were obtained at the stimulus intensity of 10 μA by fitting the decay phases with single exponentials (Llano et al., 1991) were 9.0 + 1.7 and 9.3 + 2.1 msec (P14–P17), 9.9 + 3.5 and 9.3 + 3.6 msec (P18–P22), and 11.5 + 3.1 and 12.9 + 4.3 msec (P30–P33) for wild-type and GluRδ2 mutant PCs, respectively (mean + SEM). These results are consistent with morphological data that impaired PF→PC synapse formation appears in the GluRδ2 mutant mouse during the second postnatal week.
Fig. 8.
Reduced electrophysiological responses to PF stimulation in GluRδ2 mutant PCs. Amplitudes of PF-EPSCs are plotted as a function of stimulus intensity in the wild-type (open circles) and GluRδ2 mutant (filled circles) PCs sampled from mice at P14–P17 (A;n = 10–12 for the wild-type, andn = 18–24 for the GluRδ2 mutant mice), P21–P22 (B; n = 18–20 for the wild-type, and n = 9–13 for the GluRδ2 mutant mice), and P30–P33 (C; n = 20–25 for the wild-type, and n = 19–27 for the GluRδ2 mutant mice). Each point represents the mean ± SEM.Asterisks indicate significant differences between the wild-type and GluRδ2 mutant mice (*p < 0.05; **p < 0.01, t test).Insets, Representative traces of PF-EPSCs with increasing stimulus intensities of 2, 6, 10, and 15 μA.
DISCUSSION
Specific impairment of PF→PC synaptogenesis during the second postnatal week
In the ventricular zone of the fourth ventricle, precursors of mouse PCs undergo their final mitosis from embryonic day 11 (E11) to E13 (Miale and Sidman, 1961; Fujita et al., 1966). With the cessation of cell proliferation, PCs begin to migrate and to form the PC plate in the mantle zone (Altman, 1982). Histochemical detection of GluRδ2 transcripts and protein products in the mouse cerebellum at E15 (Takayama et al., 1996) suggests the expression onset during or shortly after PC migration. The unaltered number and monolayer alignment of PCs in the GluRδ2 mutant mouse at P35 suggest their normal production, migration, and survival in the absence of the GluRδ2. Moreover, elaborate arborization of PC dendrites and comparable numerical density of PC spines in the molecular layer indicate normal postsynaptic differentiation in the GluRδ2-deficient milieu. Nevertheless, deletion of the GluRδ2 gene resulted in a reduction of the PF→PC synapse number to nearly one-half of the wild-type mouse. These results suggest that impaired PF→PC synapse formation is unlikely to result from general abnormalities in PC development but, rather, is likely to result from specific impairment in the process of synaptogenesis.
The PF→PC synapse develops postnatally, concomitant with outgrowth of PC dendrites and differentiation of GCs (Altman, 1972b,c). During the first 10 d of a rodent’s life, growth of PC dendrites and production and migration of GCs are slow in rate (Altman, 1972b,c; West and del Cerro, 1976). In this period, PF→PC synapses are few in number and immature in morphology, eliciting little electrophysiological response. The scores of the synaptic contact percentage at P7 (74–78%) indicate that, irrespective of GluRδ2 function, newly generated PC spines are able to form initial synaptic contacts, and that a certain fraction of the spines remain unattached to presynaptic terminals in this early phase of synaptogenesis. In the next 10 d, PC dendrites grow dynamically, the bulk of GCs come into existence, and PF→PC synapses drastically increase in number (Woodward et al., 1971; Altman, 1972a,b,c; Robain et al., 1981;Dumesnil-Bousez and Sotelo, 1992; Takács and Hámori, 1994). It is during this period when morphological and electrophysiological differences became evident between the GluRδ2 mutant and wild-type mice. In the wild-type mouse at P14, almost all PC spines established synapses with PFs, possessing large synaptic contacts, well developed PSD, and astroglial surroundings. In the GluRδ2 mutant mouse at P14, however, PC spines free of innervation remained and even increased, as reflected in less efficient EPSC induction after PF stimulation. Therefore, the GluRδ2 mutant mouse begins to display impaired PF→PC synapse formation and function during the second postnatal week.
Role of the GluRδ2 in PF→PC synapse stabilization
Unattached PC spines are also known to exist in theweaver mutant mouse (Hirano and Dembitzer, 1973; Rakic and Sidman, 1973; Sotelo, 1973) and x-ray-irradiated rats (Altman and Anderson, 1972), in both of which GCs die before they form PFs. The evidence from these classical “agranular” animal models has provided an important insight into the autonomous differentiation of the postsynaptic element (spines), independent of their presynaptic counterpart (PFs). On the other hand, the case of the GluRδ2 mutant mouse has highlighted the importance of postsynaptic molecular mechanisms in PF→PC synaptogenesis, because the GluRδ2 is expressed specifically in PCs (Araki et al., 1993; Lomeli et al., 1993) and is localized selectively at postsynaptic sites facing PF terminals (Mayat et al., 1995; Takayama et al., 1995; Landsend et al., 1997). How is the GluRδ2 involved in PF→PC synapse formation during cerebellar development?
Activity-dependent synapse development is best understood in the visual and somatosensory systems. Deprivation of sensory inputs at early developmental stages leads to a failure in the formation and maintenance of ocular dominance columns in the primary visual cortex and of the somatosensory barrelettes, barreloids, and barrels in the brainstem, thalamus, and somatosensory cortex, respectively (Wiesel and Hubel, 1963; Belford and Killackey, 1980). In both systems, glutamate is the major transmitter, and the NMDA receptor channel is thought to serve as a coincidence detector, which stabilizes synapses with correlated activities and eliminates uncorrelated ones (Shatz, 1990;Scheetz and Constantine-Paton, 1994). In fact, targeted disruptions of the NMDA receptor channel NR1 (ζ1) and ε2 (NR2B) subunits have resulted in an impaired formation of barrelettes (Li et al., 1994;Kutsuwada et al., 1996). In contrast to the synapse development based on a competition between homologous inputs conveyed from different eyes or whiskers, PC synapses develop as a consequence of a heterologous competition between PF and CF synapses (Crépel, 1982). It has been postulated that developmental elimination of supernumerary CFs results from their competition with PFs for a limiting factor (Crépel, 1982), and that PF→PC synapse activities fuel this competition (Kano et al., 1995, 1997).
The intracellular distribution of the GluRδ2 changes in early postnatal stages (Takayama et al., 1996). The GluRδ2 is distributed in both dendritic shafts and spines at P1 and P7, when structure and function of PF→PC synapses are immature in both types of mice. At P14, the GluRδ2 becomes localized exclusively at dendritic spines, suggesting that synaptic targeting and/or clustering mechanisms develop in PCs during the second postnatal week. Concomitant with the establishment, almost all PC spines came to contact PF terminals, and PF→PC synapses with a 1:2 contact ratio appeared in the wild-type mouse, whereas impaired synapse formation became evident in the GluRδ2-deficient mouse. From these results, together with the structural similarity to other members of GluR channel subunits, we hypothesize that the GluRδ2 might be a key postsynaptic molecule to stabilize and strengthen labile PF→PC synapses in an activity-dependent manner, resulting in the association of all PC spines with PF terminals. As a result, the formation of mature PF→PC synapses is sufficient to eliminate supernumerary CFs in a heterosynaptic manner.
Distinct roles from the metabotropic glutamate receptor cascade in PC synapse development
It remains unknown with what kind of molecular counterparts the GluRδ2 is associated to exert its function and how it is organized postsynaptically. Despite the molecular ambiguity, it is assumed that the GluRδ2-associated postsynaptic mechanism is distinct from the metabotropic glutamate receptor signaling cascade in PC synapse development for the following reasons. The type 1 metabotropic glutamate receptor (mGluR1) is highly expressed in PCs and localized at perisynaptic sites facing PF terminals (Masu et al., 1991; Baude et al., 1993). Activated mGluR1 couples to the Gq family of guanine nucleotide-binding proteins, which then stimulates the phospholipase C producing diacylglycerol, a second messenger activating protein kinase C (PKC) (Strathmann and Simon, 1990; Exton, 1996). In PCs, the α subunit of Gq protein (Gαq) and the γ isoform of PKC (PKCγ) are expressed at high levels (Huang et al., 1988; Saito et al., 1988;Tanaka and Kondo, 1994; Roustan et al., 1995) (S. Offermanns, K. Hashimoto, M. Watanabe, W. Sun, K. Kurihara, R. F. Thompson, Y. Inoue, M. Kano, and M. I. Simon, unpublished observations). Mice lacking mGluR1, Gαq, and PKCγ share a common phenotype in which multiple CF innervation persists to adulthood, whereas no significant changes are seen in the number of PF→PC synapses or their electrophysiological parameters (Kano et al., 1995, 1997) (S. Offermanns, K. Hashimito, M. Watanabe, W. Sun, K. Kurihara, R. F. Thompson, Y. Inoue, M. Kano, and M. I. Simon, unpublished observations). Therefore, the GluRδ2-associated mechanism plays an important role primarily in the stabilization of developing PF→PC synapses to form functionally mature synapses, whereas the possible signal transduction cascade from mGluR1 to PKCγ mediates activities of PF→PC synapses to eliminate supernumerary CF→PC synapses.
Footnotes
This investigation was supported in part by a grant-in-aid for scientific research on priority areas from the Ministry of Education, Science, Sports, and Culture, Japan, and also by research grants from the Ministry of Health and Welfare, the Science and Technology Agency of Japan, Core Research for Evolutional Science and Technology of Japan Science and Technology Corporation, the Uehara Foundation, and the Kato Memorial Bioscience Foundation. We thank Dr. Takao Hensch for his helpful discussion and also Mr. Hideo Umeda and Mr. Yoshihiko Ogawa (Hokkaido University School of Medicine) for their technical assistance.
Correspondence should be addressed to Masahiko Watanabe, Department of Anatomy, Hokkaido University School of Medicine, Sapporo 060, Japan.
REFERENCES
- 1.Altman J. Postnatal development of the cerebellar cortex in the rat. I. The external germinal layer and the transitional molecular layer. J Comp Neurol. 1972a;145:353–398. doi: 10.1002/cne.901450305. [DOI] [PubMed] [Google Scholar]
- 2.Altman J. Postnatal development of the cerebellar cortex in the rat. II. Phases in the maturation of Purkinje cells and of the molecular layer. J Comp Neurol. 1972b;145:399–463. doi: 10.1002/cne.901450402. [DOI] [PubMed] [Google Scholar]
- 3.Altman J. Postnatal development of the cerebellar cortex in the rat. III. Maturation of the components of the granular layer. J Comp Neurol. 1972c;145:465–514. doi: 10.1002/cne.901450403. [DOI] [PubMed] [Google Scholar]
- 4.Altman J. Morphological development of the rat cerebellum and some of its mechanisms. Exp Brain Res [Suppl] 1982;6:8–49. [Google Scholar]
- 5.Altman J, Anderson WJ. Experimental reorganization of the cerebellar cortex. I. Morphological effects of elimination of all microneurons with prolonged x-irradiation started at birth. J Comp Neurol. 1972;146:355–406. doi: 10.1002/cne.901460305. [DOI] [PubMed] [Google Scholar]
- 6.Araki K, Meguro H, Kushiya E, Takayama C, Inoue Y, Mishina M. Selective expression of the glutamate receptor channel δ2 subunit in cerebellar Purkinje cells. Biochem Biophys Res Commun. 1993;197:1267–1276. doi: 10.1006/bbrc.1993.2614. [DOI] [PubMed] [Google Scholar]
- 7.Baude A, Nusser Z, Roberts JD, Mulvihill E, Mcllhinney RA, Somogyi P. The metabotropic glutamate receptor (mGluR1α) is concentrated at perisynaptic membrane of neuronal subpopulations as detected by immunogold reaction. Neuron. 1993;11:771–787. doi: 10.1016/0896-6273(93)90086-7. [DOI] [PubMed] [Google Scholar]
- 8.Belford GR, Killackey HP. The sensitive period in the development of the trigeminal system of the neonatal rat. J Comp Neurol. 1980;193:335–350. doi: 10.1002/cne.901930203. [DOI] [PubMed] [Google Scholar]
- 9.Bliss TV, Collingridge GL. A synaptic model of memory: long-term potentiation in the hippocampus. Nature. 1993;361:31–39. doi: 10.1038/361031a0. [DOI] [PubMed] [Google Scholar]
- 10.Crépel F. Regression of functional synapses in the immature mammalian cerebellum. Trends Neurosci. 1982;5:266–269. [Google Scholar]
- 11.Crépel F, Jaillard D. Pairing of pre- and postsynaptic activities in cerebellar Purkinje cells induces long-term changes in synaptic efficacy: an in vitro study. J Physiol (Lond) 1991;432:123–141. doi: 10.1113/jphysiol.1991.sp018380. [DOI] [PMC free article] [PubMed] [Google Scholar]
- 12.Dumesnil-Bousez N, Sotelo C. Early development of the Lurcher cerebellum: Purkinje cell alterations and impairment of synaptogenesis. J Neurocytol. 1992;21:506–529. doi: 10.1007/BF01186954. [DOI] [PubMed] [Google Scholar]
- 13.Edwards FA, Konnerth A, Sakmann B, Takahashi T. A thin slice preparation for patch-clamp recordings from neurons of the mammalian central nervous system. Pflügers Arch. 1989;414:600–612. doi: 10.1007/BF00580998. [DOI] [PubMed] [Google Scholar]
- 14.Exton JH. Regulation of phosphoinositide phospholipases by hormones, neurotransmitters, and other agonists linked to G-proteins. Annu Rev Pharmacol Toxicol. 1996;36:481–509. doi: 10.1146/annurev.pa.36.040196.002405. [DOI] [PubMed] [Google Scholar]
- 15.Fujita S, Shimada M, Nakamura T. H3-thymidine autoradiographic studies on the cell proliferation and differentiation in the external and the internal granular layers of the mouse cerebellum. J Comp Neurol. 1966;128:191–208. doi: 10.1002/cne.901280206. [DOI] [PubMed] [Google Scholar]
- 16.Hirano A, Dembitzer HM. Cerebellar alterations in the weaver mouse. J Cell Biol. 1973;56:478–486. doi: 10.1083/jcb.56.2.478. [DOI] [PMC free article] [PubMed] [Google Scholar]
- 17.Hirano T, Kasono K, Araki K, Shinozuka K, Mishina M. Involvement of the glutamate receptor δ2 subunit in the long-term depression of glutamate responsiveness in cultured rat Purkinje cells. Neurosci Lett. 1994;192:172–176. doi: 10.1016/0304-3940(94)90790-0. [DOI] [PubMed] [Google Scholar]
- 18.Hollmann M, Heinemann S. Cloned glutamate receptors. Annu Rev Neurosci. 1994;17:31–108. doi: 10.1146/annurev.ne.17.030194.000335. [DOI] [PubMed] [Google Scholar]
- 19.Huang FL, Yoshida Y, Nakabayashi H, Young WS, Huang K-P. Immunocytochemical localization of protein kinase C isozymes in rat brain. J Neurosci. 1988;8:4734–4744. doi: 10.1523/JNEUROSCI.08-12-04734.1988. [DOI] [PMC free article] [PubMed] [Google Scholar]
- 20.Ito M. The cerebellum and neural control. Raven; New York: 1984. [Google Scholar]
- 21.Ito M. Long-term depression. Annu Rev Neurosci. 1989;12:85–102. doi: 10.1146/annurev.ne.12.030189.000505. [DOI] [PubMed] [Google Scholar]
- 22.Jeromin A, Huganir RL, Linden DJ. Suppression of the glutamate receptor δ2 subunit produces a specific impairment in cerebellar long-term depression. J Neurophysiol. 1996;76:3578–3583. doi: 10.1152/jn.1996.76.5.3578. [DOI] [PubMed] [Google Scholar]
- 23.Kano M, Konnerth A. Cerebellar slices for patch clamp recording. In: Kettenmann H, Grantyn R, editors. Practical electrophysiological methods. Wiley; New York: 1992. pp. 54–57. [Google Scholar]
- 24.Kano M, Rexhausen U, Dreessen J, Konnerth A. Synaptic excitation produces a long-lasting rebound potentiation of inhibitory synaptic signals in cerebellar Purkinje cells. Nature. 1992;356:601–604. doi: 10.1038/356601a0. [DOI] [PubMed] [Google Scholar]
- 25.Kano M, Hashimoto K, Chen C, Abeliovich A, Aiba A, Kurihara H, Watanabe M, Inoue Y, Tonegawa S. Impaired synapse elimination during cerebellar development in PKCγ mutant mice. Cell. 1995;83:1223–1232. doi: 10.1016/0092-8674(95)90147-7. [DOI] [PubMed] [Google Scholar]
- 26.Kano M, Hashimoto K, Kurihara H, Watanabe M, Inoue Y, Aiba A, Tonegawa S. Persistent multiple climbing fiber innervation of cerebellar Purkinje cells in mice lacking mGluR1. Neuron. 1997;18:71–79. doi: 10.1016/s0896-6273(01)80047-7. [DOI] [PubMed] [Google Scholar]
- 27.Kashiwabuchi N, Ikeda K, Araki K, Hirano T, Shibuki K, Takayama C, Inoue Y, Kutsuwada T, Yagi T, Kang Y, Aizawa S, Mishina M. Impairment of motor coordination, Purkinje cell synapse formation, and cerebellar long-term depression in GluRδ2 mutant mice. Cell. 1995;81:245–252. doi: 10.1016/0092-8674(95)90334-8. [DOI] [PubMed] [Google Scholar]
- 28.Konigsmark BW. Methods for the counting neurons. In: Nauta WJH, Ebberson SOE, editors. Contemporary research methods in neuroanatomy. Springer; Heidelberg: 1970. pp. 315–338. [Google Scholar]
- 29.Konnerth A, Llano I, Armstrong CM. Synaptic currents in cerebellar Purkinje cells. Proc Natl Acad Sci USA. 1990;87:2662–2665. doi: 10.1073/pnas.87.7.2662. [DOI] [PMC free article] [PubMed] [Google Scholar]
- 30.Konnerth A, Dreessen J, Augustine GJ. Brief dendritic calcium signals initiate long-lasting synaptic depression in cerebellar Purkinje cells. Proc Natl Acad Sci USA. 1992;89:7051–7055. doi: 10.1073/pnas.89.15.7051. [DOI] [PMC free article] [PubMed] [Google Scholar]
- 31.Kutsuwada T, Sakimura K, Manabe T, Takayama C, Katakura N, Kushiya E, Natsume R, Watanabe M, Inoue Y, Yagi T, Aizawa S, Arakawa M, Takahashi T, Nakamura Y, Mori H, Mishina M. Impairment of suckling response, trigeminal neuronal pattern formation, and hippocampal LTD in NMDA receptor ε2 subunit mutant mice. Neuron. 1996;16:333–344. doi: 10.1016/s0896-6273(00)80051-3. [DOI] [PubMed] [Google Scholar]
- 32.Landsend AS, Amiry-Moghaddam M, Matsubara A, Bergersen L, Usami S, Wenthold RJ, Ottersen OP. Differential localization of δ2 glutamate receptors in the rat cerebellum: coexpression with AMPA receptors in parallel fiber-spine synapses and absence from climbing fiber-spine synapses. J Neurosci. 1997;17:834–842. doi: 10.1523/JNEUROSCI.17-02-00834.1997. [DOI] [PMC free article] [PubMed] [Google Scholar]
- 33.Larramendi LM. Electron microscopic studies of cerebellar interneurons. UCLA Forum Med Sci. 1969;11:289–307. [PubMed] [Google Scholar]
- 34.Li Y, Erzurumlu RS, Chen C, Jhaveri S, Tonegawa S. Whisker-related neuronal patterns fail to develop in the trigeminal brainstem nuclei of NMDAR1 knockout mice. Cell. 1994;76:427–437. doi: 10.1016/0092-8674(94)90108-2. [DOI] [PubMed] [Google Scholar]
- 35.Linden DJ, Smeyne M, Connor JA. Trans-ACPD, a metabotropic receptor agonist, produces calcium mobilization and an inward current in cultured cerebellar Purkinje neurons. J Neurophysiol. 1994;71:1992–1998. doi: 10.1152/jn.1994.71.5.1992. [DOI] [PubMed] [Google Scholar]
- 36.Llano I, Marty A, Armstrong CM, Konnerth A. Synaptic- and agonist-induced excitatory currents of Purkinje cells in rat cerebellar slices. J Physiol (Lond) 1991;434:183–213. doi: 10.1113/jphysiol.1991.sp018465. [DOI] [PMC free article] [PubMed] [Google Scholar]
- 37.Lomeli H, Sprengel R, Laurie DJ, Kohr G, Herb A, Seeburg PH, Wisden W. The rat delta-1 and delta-2 subunits extend the excitatory amino acid receptor family. FEBS Lett. 1993;315:318–322. doi: 10.1016/0014-5793(93)81186-4. [DOI] [PubMed] [Google Scholar]
- 38.Mariani J. Extent of multiple innervation of Purkinje cells by climbing fibers in the olivocerebellar system of weaver, reeler, and staggerer mutant mice. J Neurobiol. 1982;13:119–126. doi: 10.1002/neu.480130204. [DOI] [PubMed] [Google Scholar]
- 39.Mason CA, Christakos S, Catalano S. Early climbing fiber interactions with Purkinje cells in the postnatal mouse cerebellum. J Comp Neurol. 1990;297:77–90. doi: 10.1002/cne.902970106. [DOI] [PubMed] [Google Scholar]
- 40.Masu M, Tanabe Y, Tsuchida K, Shigemoto R, Nakanishi S. Sequence and expression of a metabotropic glutamate receptor. Nature. 1991;348:760–765. doi: 10.1038/349760a0. [DOI] [PubMed] [Google Scholar]
- 41.Mayat E, Petralia RS, Wang Y-X, Wenthold RJ. Immunoprecipitation, immunoblotting, and immunocytochemistry studies suggest that glutamate receptor δ subunits form novel postsynaptic receptor complexes. J Neurosci. 1995;15:2533–2546. doi: 10.1523/JNEUROSCI.15-03-02533.1995. [DOI] [PMC free article] [PubMed] [Google Scholar]
- 42.Mayer ML, Westbrook GL. The physiology of excitatory amino acids in the vertebrate central nervous system. Prog Neurobiol. 1987;28:197–276. doi: 10.1016/0301-0082(87)90011-6. [DOI] [PubMed] [Google Scholar]
- 43.McDonald JW, Johnston MV. Physiological and pathophysiological roles of excitatory amino acids during central nervous system development. Brain Res Rev. 1990;15:41–70. doi: 10.1016/0165-0173(90)90011-c. [DOI] [PubMed] [Google Scholar]
- 44.Miale IL, Sidman RL. An autoradiographic analysis of histogenesis in the mouse cerebellum. Exp Neurol. 1961;4:277–296. doi: 10.1016/0014-4886(61)90055-3. [DOI] [PubMed] [Google Scholar]
- 45.Mishina M, Mori H, Araki K, Kushiya E, Meguro H, Kutsuwada T, Kashiwabuchi N, Ikeda K, Nagasawa M, Yamazaki M, Masaki H, Yamakura T, Morita T, Sakimura K. Molecular and functional diversity of the NMDA receptor channel. Ann NY Acad Sci. 1993;707:136–152. doi: 10.1111/j.1749-6632.1993.tb38049.x. [DOI] [PubMed] [Google Scholar]
- 46.Nakanishi S, Masu M. Molecular diversity and functions of glutamate receptors. Annu Rev Biophys Biomol Struct. 1994;23:319–348. doi: 10.1146/annurev.bb.23.060194.001535. [DOI] [PubMed] [Google Scholar]
- 47.Palay SL, Chan-Palay V. Cerebellar cortex. Springer; New York: 1974. [Google Scholar]
- 48.Rakic P, Sidman RL. Sequence of developmental abnormalities leading to granule cell deficit in cerebellar cortex of weaver mutant mice. J Comp Neurol. 1973;152:103–132. doi: 10.1002/cne.901520202. [DOI] [PubMed] [Google Scholar]
- 49.Robain O, Bideau I, Farkas E. Developmental changes of synapses in the cerebellar cortex of the rat. A quantitative analysis. Brain Res. 1981;206:1–8. doi: 10.1016/0006-8993(81)90095-0. [DOI] [PubMed] [Google Scholar]
- 50.Roustan P, Abitbol M, Ménini C, Ribeaudeau F, Gérard M, Vekemans M, Mallet J, Dufier J-L. The rat phospholipase Cβ4 gene is expressed at high abundance in cerebellar Purkinje cells. NeuroReport. 1995;6:1837–1841. doi: 10.1097/00001756-199510020-00004. [DOI] [PubMed] [Google Scholar]
- 51.Saito N, Kikkawa U, Nishizuka Y, Tanaka C. Distribution of protein kinase C-like immunoreactive neurons in rat brain. J Neurosci. 1988;8:369–382. doi: 10.1523/JNEUROSCI.08-02-00369.1988. [DOI] [PMC free article] [PubMed] [Google Scholar]
- 52.Scheetz AJ, Constantine-Paton M. Modulation of NMDA receptor function: implications for vertebrate neural development. FASEB J. 1994;8:745–752. doi: 10.1096/fasebj.8.10.8050674. [DOI] [PubMed] [Google Scholar]
- 53.Seeburg PH. The molecular biology of mammalian glutamate receptor channels. Trends Neurosci. 1993;16:359–365. doi: 10.1016/0166-2236(93)90093-2. [DOI] [PubMed] [Google Scholar]
- 54.Shatz CJ. Impulse activity and the patterning of connections during CNS development. Neuron. 1990;5:745–756. doi: 10.1016/0896-6273(90)90333-b. [DOI] [PubMed] [Google Scholar]
- 55.Sotelo C. Permanence and fate of paramembranous synaptic specializations in “mutants” experimental animals. Brain Res. 1973;62:345–351. doi: 10.1016/0006-8993(73)90695-1. [DOI] [PubMed] [Google Scholar]
- 56.Sotelo C. Purkinje cell ontogeny: formation and maintenance of spines. Prog Brain Res. 1978;48:149–170. doi: 10.1016/S0079-6123(08)61021-3. [DOI] [PubMed] [Google Scholar]
- 57.Strathmann MP, Simon MI. G protein diversity: a distinct class of α subunits is present in vertebrates and invertebrates. Proc Natl Acad Sci USA. 1990;87:9113–9117. doi: 10.1073/pnas.87.23.9113. [DOI] [PMC free article] [PubMed] [Google Scholar]
- 58.Takács J, Hámori J. Developmental dynamics of Purkinje cells and dendritic spines in rat cerebellar cortex. J Neurosci Res. 1994;38:515–530. doi: 10.1002/jnr.490380505. [DOI] [PubMed] [Google Scholar]
- 59.Takayama C, Nakagawa S, Watanabe M, Mishina M, Inoue Y. Light- and electron-microscopic localization of the glutamate receptor channel δ2 subunit in the mouse Purkinje cell. Neurosci Lett. 1995;188:89–92. doi: 10.1016/0304-3940(95)11403-j. [DOI] [PubMed] [Google Scholar]
- 60.Takayama C, Nakagawa S, Watanabe M, Mishina M, Inoue Y. Developmental changes in expression and distribution of the glutamate receptor channel δ2 subunit according to the Purkinje cell maturation. Dev Brain Res. 1996;92:147–155. doi: 10.1016/0165-3806(95)00212-x. [DOI] [PubMed] [Google Scholar]
- 61.Tanaka O, Kondo H. Localization of mRNAs from three novel members (β3, β4 and γ2) of phospholipase C family in mature rat brain. Neurosci Lett. 1994;182:17–20. doi: 10.1016/0304-3940(94)90194-5. [DOI] [PubMed] [Google Scholar]
- 62.Weibel ER. Principles and methods for the morphometric study of the lung and other organs. Lab Invest. 1963;12:131–151. [PubMed] [Google Scholar]
- 63.Weibel ER. Practical methods for biological morphometry. In: Weibel ER, editor. Stereological methods I. Academic; New York: 1979. [Google Scholar]
- 64.West MJ, del Cerro M. Early formation of synapses in the molecular of the fetal rat cerebellum. J Comp Neurol. 1976;165:137–160. doi: 10.1002/cne.901650203. [DOI] [PubMed] [Google Scholar]
- 65.Wiesel TN, Hubel DH. Single cell responses in striate cortex of kittens deprived of vision in one eye. J Neurophysiol. 1963;26:1003–1007. doi: 10.1152/jn.1963.26.6.1003. [DOI] [PubMed] [Google Scholar]
- 66.Woodward DJ, Hoffer BJ, Siggins GR, Bloom FE. The ontogenetic development of synaptic junctions, synaptic activation and responsiveness to neurotransmitter substances in rat cerebellar Purkinje cells. Brain Res. 1971;34:73–97. doi: 10.1016/0006-8993(71)90352-0. [DOI] [PubMed] [Google Scholar]


