

Abstract
We have investigated the control of calcitonin gene-related peptide (CGRP) expression by a serotonergic agonist that is related pharmacologically to currently used antimigraine drugs. During migraines, CGRP levels are elevated but then returned to normal by a 5-HT1 receptor agonist, sumatriptan. However, neither the molecular nor cellular targets of this drug are known. Trigeminal neurons are the major source of cerebrovascular CGRP, and thus we have used trigeminal primary cultures and the neuronal-like CA77 thyroid C-cell line as a model. We first demonstrate that sumatriptan and another 5-HT1 agonist, CGS 12066A (CGS), cause a robust and prolonged increase with oscillations in intracellular calcium in CA77 cells. CGS caused a similar increase in trigeminal cultures. We then show that CGS treatment leads to a decrease in CGRP mRNA levels in the CA77 cells. This decrease is attributable to the repression of promoter activity through two discrete elements: (1) the cAMP-responsive region, via a cAMP-independent mechanism; and (2) the cell-specific enhancer, which binds the upstream stimulatory factor helix–loop–helix protein and a cell-specific activator. These results demonstrate that activation of the endogenous 5-HT1 receptor is coupled to calcium signaling pathways and leads to inhibition of CGRP gene transcription.
Keywords: CGRP, transcription, trigeminal, thyroid C-cells, serotonin, 5-HT1 receptor, sumatriptan, calcium
Calcitonin gene-related peptide (CGRP) has been well characterized as the most potent peptide vasodilator of peripheral and cerebral vessels (Brain et al., 1985;McCulloch et al., 1986). Alternative processing of the primary transcript yields the hormone calcitonin (CT) in thyroid C-cells and CGRP in neurons (Rosenfeld et al., 1983). In the cerebrovasculature the major source of CGRP is perivascular nerve endings from the trigeminal ganglia (McCulloch et al., 1986; O’Conner and Van der Kooy, 1988). High levels of circulating CGRP have been measured during migraine and cluster headache (Goadsby and Edvinsson, 1993, 1994; Edvinsson and Goadsby, 1994) and have been implicated in neurogenic inflammation (Goadsby et al., 1988; Buzzi et al., 1991). Recently, sumatriptan, a serotonin type 1 (5-HT1) receptor agonist commonly used in the treatment of migraine, has been reported to selectively return CGRP to normal serum levels and alleviate the headache (Ferrari and Saxena, 1993; Edvinsson and Goadsby, 1994; Buzzi et al., 1995). Based on pharmacological evidence, this drug is known to interact preferentially with the human and rat 5-HT1B, 5-HT1D, and 5-HT1F receptors (Boess and Martin, 1994). Although the mRNAs for these receptors have been detected in trigeminal ganglia (Bruinvels et al., 1992; Rebeck et al., 1994; Bouchelet et al., 1996), it is not known if these neurons express functional receptors. Hence, the mechanisms by which 5-HT1antimigraine drugs may regulate CGRP levels have not been investigated.
The 5-HT1 receptors generally have been viewed as coupled to the inhibition of adenylate cyclase via pertussis toxin-sensitive Gi-proteins (see Boess and Martin, 1994). More recently, the receptors also have been reported to elevate intracellular calcium levels when stably expressed in fibroblast cell lines (Adham et al., 1993; Zgombick et al., 1993). CT/CGRP gene transcription and peptide secretion are increased by cAMP (deBustros et al., 1986, 1992; Monia et al., 1995), and prolonged elevated calcium has been reported to lower CT and CGRP mRNA levels in a C-cell line (Zeytin et al., 1987). However, there have been contradictory reports on calcium regulation in C-cells, possibly because of the experimental systems (Jacobs et al., 1983; Besnard et al., 1989). In either case, the cAMP-dependent and/or calcium-dependent regulation of CT/CGRP gene expression may be potential targets of 5-HT1 agonists.
In this study we have demonstrated that 5-HT1 receptors are coupled to calcium pathways in trigeminal neurons and the CA77 rat medullary thyroid carcinoma C-cell line. The CA77 cells provide a useful neuronal model system (Russo and Lanigan, 1996; Russo et al., 1996) that eliminates the complicating heterogeneity of trigeminal ganglia. We primarily used CGS 12066A (CGS) (Neale et al., 1987) as a 5-HT1 receptor agonist, along with other agonists and antagonists. We have shown that CGS decreases CGRP steady-state mRNA levels and CT/CGRP promoter activity in CA77 cells. The CGS responsiveness is mediated via two distinct elements, a cAMP-responsive region and the cell-specific enhancer. These results raise the possibility that at least one mechanism of action of serotonergic antimigraine drugs may be to inhibit CGRP transcription in trigeminal neurons.
MATERIALS AND METHODS
Cell culture. Trigeminal ganglia primary cultures were based on the protocol of Vedder and Otten (1991). Ganglia from 2-week-old Sprague Dawley rats were dissociated with Dispase II (Life Technologies, Gaithersburg, MD). The cells from four ganglia were plated on glass coverslips coated with mouse EHS laminin (Life Technologies) and incubated in L15 medium, 10% fetal bovine serum (FBS), and 5 ng/ml mouse 2.5 S nerve growth factor (Sigma, St. Louis, MO) at 37°C in 5% CO2. CA77 cells were maintained in Ham’s F-12/DMEM (low glucose) (1:1) and 10% FBS at 37°C in 7% CO2. Parental HeLa cells and HeLa cells stably transfected with the human 5-HT1B receptor (Hamblin et al., 1992) (from M. Hamblin, Seattle Veterans Affairs Medical Center, Seattle, WA), were maintained in Ham’s F-12 and 10% FBS at 37°C in 5% CO2. Penicillin and streptomycin were added to all media. CA77 cells used for RNA isolation and transfection were subcultured for 24 hr in serum-free medium (Clark et al., 1995b). Pertussis toxin (100 ng/ml; Sigma) treatments occurred for 20 hr before the experiment. CGS-12066A monomaleate, N-(3-trifluoromethylphenyl) piperazine hydrochloride (TFMPP), 1-(3-chlorophenyl)piperazine dihydrochloride (mCPP), methiothepin mesylate, and SB 206553 hydrochloride were obtained from Research Biochemicals International (RBI, Natick, MA). The original CGS compound was synthesized as a dimaleate (CGS 12066B maleate) (Neale et al., 1987), but the two forms appear to have the same pharmacological properties (RBI, R. P., personal communication). Sumatriptan succinate was obtained from the University of Iowa Pharmacy. CGS was prepared at 10 mm in 0.1N HCl, with aliquots stored at −20°C; TFMPP and mCPP were prepared fresh at 10 mm in 0.1N HCl and water, respectively. In all studies the cells were treated with equivalent amounts of vehicle.
Calcium measurements. Intracellular calcium levels in cultured trigeminal neurons and CA77 cells were measured by a video microscope digital image analysis system (Photon Technology, South Brunswick, NJ), as described previously (Sharma et al., 1995). Briefly, dissociated trigeminal ganglia and CA77 cells grown on laminin-coated 25 mm glass coverslips were maintained in phenol- and serum-free medium 24 hr before the start of the calcium imaging procedure. Cells were incubated in DMEM (high glucose) containing 0.2% bovine serum albumin and 1–4 μm fura-2/AM for 30–45 min at 37°C in 5% CO2. Higher basal calcium levels were seen with the longer loading time (compare Tables 1 and2). After washing the cells twice with DMEM/bovine serum albumin, we incubated the cells for 30 min before measurement, using a Nikon Diaphot microscope. Basal calcium levels were measured for a minimum of 60 sec in untreated cells or for 300 sec in cells treated with antagonists before the addition of CGS. For the pertussis toxin study, cells were kept in the presence of toxin. An equal volume of medium containing agonist or vehicle (at two times the final concentration) was added directly to the cells, and measurements were recorded every 10 sec, generally for 6–10 min (up to 30 min in some experiments), on a heated stage at 37°C. Calcium levels in individual cells were determined by using a 50 × 50 pixel area in the center of each cell.
Table 1.
Effect of CGS on intracellular calcium levels in CA77 cells
| [CGS] | n | Basal (nm) | Peak (nm) | Fold increase | Peak time (sec) |
|---|---|---|---|---|---|
| 1 μm | 45 | 142 ± 6.1 | 179 ± 5.7 | 1.26 ± 0.10 | 242 ± 10 |
| 10 μm | 71 | 160 ± 3.9 | 381 ± 27 | 2.38 ± 0.16 | 225 ± 7.3 |
| 50 μm | 49 | 148 ± 7.2 | 684 ± 20 | 4.62 ± 0.12 | 204 ± 7.6 |
The values are the mean and SE (n = number of cells). Basal values were measured in untreated cells 30 sec after the start of the experiment. Peak values correspond to the maximum [Ca2+]i measured during the 6 min sampling period. The fold increase indicates the change from basal to peak calcium levels for each individual cell. The peak times are the time of maximal recorded [Ca2+]i after the addition of CGS. Cells were loaded for 45 min with fura-2.
Table 2.
Effect of serotonergic agents on intracellular calcium levels in CA77 cells
| Agent | n | Basal (nm) | Peak (nm) | Fold increase | Peak time (sec) |
|---|---|---|---|---|---|
| CGS (1 μm) | 29 | 64 ± 3.0 | 139 ± 4.5 | 2.17 ± 0.08 | 355 ± 17 |
| CGS (1 μm) + 0.1 μm MET | 25 | 61 ± 1.8 | 85 ± 3.1 | 1.41 ± 0.04 | 352 ± 13 |
| CGS (1 μm) + 1.0 μm MET | 42 | 52 ± 2.2 | 61 ± 3.3 | 1.18 ± 0.05 | 368 ± 10 |
| CGS (10 μm) | 40 | 66 ± 2.9 | 265 ± 18 | 4.02 ± 0.30 | 319 ± 16 |
| CGS (10 μm) + 10 μm MET | 19 | 64 ± 4.4 | 142 ± 2.7 | 2.22 ± 0.04 | 325 ± 23 |
| CGS (10 μm) + 50 μm MET | 32 | 70 ± 3.1 | 117 ± 3.8 | 1.67 ± 0.05 | 291 ± 13 |
| CGS (10 μm) + 100 μm MET | 36 | 58 ± 1.9 | 69 ± 2.6 | 1.20 ± 0.04 | 305 ± 9 |
| CGS (10 μm) + 2 μm SB | 26 | 51 ± 1.9 | 197 ± 9.8 | 3.89 ± 0.19 | 308 ± 19 |
| CGS (10 μm) + 50 μm SB | 31 | 64 ± 2.8 | 274 ± 15 | 4.28 ± 0.27 | 341 ± 19 |
| mCPP (50 μm) | 15 | 73 ± 5.4 | 263 ± 5.5 | 3.60 ± 0.08 | 293 ± 24 |
| Sumatriptan (20 μm) | 26 | 60 ± 3.2 | 198 ± 6.8 | 3.30 ± 0.11 | 218 ± 18 |
| CGS (10 μm) + PTX | 85 | 69 ± 3.0 | 280 ± 8.3 | 4.06 ± 0.11 | 328 ± 17 |
| Sumatriptan (20 μm) + PTX | 27 | 55 ± 2.8 | 187 ± 7.3 | 3.40 ± 0.09 | 222 ± 19 |
The values are the mean and SE (n = number of cells). Basal values were measured in untreated cells 60 sec after the start of the experiment. Peak values are the maximum [Ca2+]i measured during the 10 min sampling period. The fold increase indicates the change from basal to peak calcium levels calculated for each individual cell. The peak times are the time of maximal recorded [Ca2+]i after the addition of the agent. Cells were preincubated with methiothepin (MET) or SB 206553 (SB) for 5 min before the addition of CGS or treated overnight with pertussis toxin (PTX, 100 ng/ml). Cells were loaded for 30 min with fura-2.
cAMP and adenylate cyclase assays. CA77 cells were incubated with 10 μm forskolin (Sigma) in the presence or absence of 10 μm CGS for 30 min at 37°C, and total cAMP was measured by a cAMP-specific radioimmunoassay (Jaquette and Segaloff, 1997). Adenylate cyclase assays and membrane preparations were performed as described (Salomon, 1979). Reactions were initiated by the addition of membranes (10 μg) to the assay and then incubated for 20 min at 30°C. Membranes were treated with vehicle or 100 μm forskolin ±10 μm CGS or 5-HT creatine sulfate complex (freshly prepared in dilute acid; RBI).
RNA isolation, RT-PCR, and Northern blots. Total RNA was isolated and analyzed by Northern blots as described (Clark et al., 1995b). After the removal of CGRP probe from the filter, the membranes were hybridized with a 32P-labeled rabbit mitochondrial cytochrome oxidase subunit II (CO II) cDNA (Durham et al., 1992). The signals were quantitated with National Institutes of Health Imagescan software. RT-PCR conditions and 5-HT1B oligonucleotide sequences have been described (Clark et al., 1995a). Total RNA (2 μg) was used to generate first-strand cDNA with Moloney murine leukemia virus reverse transcriptase, and the products were resolved on 2% agarose gels.
Plasmids and transfection assays. Many of the rat CT/CGRP and thymidine kinase (TK) luciferase reporter plasmids and the cytomegalovirus (CMV) β-galactosidase reporter plasmid have been described (Tverberg and Russo, 1992, 1993; Lanigan et al., 1993;Lanigan and Russo, 1997). The 1250 bp CT/CGRP luciferase reporter contains sequences from the KpnI site (−1250) to theSau3A site (+21) in exon 1. The 280 bp cAMP response element (CRE)–CT–luciferase reporter contains a PCR fragment from −280 bp to +21 bp. The 1160–920+Bam TK reporter contains a BamHI linker (CGGATCCG) inserted at the PvuII site (−1038 bp) of the 1160 to 920 bp TK–luciferase gene (Tverberg and Russo, 1993). Complementary oligonucleotides with BamHI ends were annealed and ligated into the BamHI site of the TK–luciferase plasmid. The H/O and H/O+A reporters used in our studies contained four tandem repeats in the sense orientation. The H/O+A mutant sequence (5′-ggatccGGCAGCTG ATGCAAATCCTggatcc-3′) (BamHI ends in lower case) contains an adenosine nucleotide (underlined) inserted between the HLH and octamer motifs to create a consensus octamer binding site within the H/O enhancer. All plasmids were sequenced to confirm the insertions.
CA77 cells were transiently transfected by electroporation with 10–20 μg of plasmid DNA at 200 V, 960 μF (Tverberg and Russo, 1992). HeLa cells were transfected with 20 μg of DNA at 240 V, 960 μF. Transfected cells were equally divided among 60 mm dishes containing serum-free medium, treated with CGS or other agents for the times indicated, and harvested 14–20 hr later. This protocol insured that the control and drug-treated cells had equal transfection efficiencies. For the time course, 10 μm CGS was added immediately after transfection and then removed from the cells at the indicated times by washing in PBS, followed by the addition of medium without CGS for the remainder of the time. In the forskolin and cAMP experiments, cells were pretreated for 1 hr in 10 μm CGS or vehicle and then treated for an additional 4 hr with vehicle, CGS, 10 μm forskolin, or 500 μm dibutyrl cAMP (Sigma). Luciferase was measured with reagents from Promega (Madison, WI). In some experiments the transfection efficiencies were normalized to β-galactosidase measured with galacto-light reagents (Tropix, Bedford, MA). The β-galactosidase normalization did not significantly alter the relative activities. Each experimental condition was repeated in at least three independent experiments done in duplicate.
RESULTS
Elevation of calcium levels in CA77 cells by CGS
To study the mechanisms controlling trigeminal CGRP gene expression, we used the CA77 thyroid C-cell line as a model system. This was necessitated because trigeminal ganglia are a heterogeneous population of neuronal and non-neuronal cells. It is estimated that <23% of the neurons express CGRP (O’Conner and van der Kooy, 1988). The CA77 cell line was established from a rat medullary thyroid carcinoma, yet it has a neuronal phenotype that is characterized by high levels of CGRP and expression of 5-HT1B receptor mRNA (Clark et al., 1995a; Russo and Lanigan, 1996; Russo et al., 1996). In addition, both trigeminal neurons and C-cells share a neural crest origin. The pyrroloquinoxaline CGS was used in our studies as a 5-HT1 agonist. CGS was characterized initially as a 5-HT1B specific agonist; however, it has not been tested against many of the more recently discovered 5-HT receptors, such as 5-HT1F. A major advantage of CGS is that it is not likely to be metabolized by monoamine oxidases (MAO), because the chemical structure of CGS does not contain an amine group. These properties were important because a drawback of the CA77 cells is that they express the serotonin reuptake transporter and MAO, and the full spectrum of 5-HT receptors is not known (Clark et al., 1995a; Russo et al., 1996). Hence, the use of CGS allowed us to circumvent these complications pharmacologically.
We determined whether CA77 cells express functional 5-HT1receptors, using CGS in conjunction with other agonists and antagonists. The approach was to measure intracellular calcium levels, because the cloned 5-HT1B receptor has been reported to elevate calcium levels transiently (Zgombick et al., 1993). Calcium levels were measured with the calcium-sensitive fluorescent dye fura-2. The addition of 10 μm CGS caused a marked increase in intracellular calcium levels when compared with basal levels in the same cells before CGS treatment (Fig. 1). After the addition of CGS, elevated levels of calcium were maintained in each cell for at least 30 min, the longest time point measured in this study. CGS also caused oscillations in calcium levels that were superimposed on the overall increase. As a control, calcium levels did not change appreciably after the addition of vehicle for at least 10 min (data not shown). The dosage required for detecting increased calcium levels was ∼1 μm (Table 1). At 10 μm, CGS caused a several-fold increase in calcium levels (Tables 1 and 2) and was used for subsequent experiments.
Fig. 1.

CGS increases the concentration of intracellular calcium in CA77 cells. Intracellular calcium concentrations, [Ca2+]i, were measured by using fura-2 and a microscopic digital imaging system. A, Basal levels in cells loaded for 30 min. B, Levels 5 min after the addition of 10 μm CGS. CGS elevated [Ca2+]i in all cells. The pseudocolor scale indicates the 340/380 nm excitation wavelength ratio and corresponding [Ca2+]i.
The specificity of CGS was demonstrated by using methiothepin as a 5-HT type 1 receptor antagonist. The addition of methiothepin at concentrations previously used to block 5-HT1 receptors (Adham et al., 1993; Zgombick et al., 1993) essentially blocked the action of 10 μm CGS (Table 2). Concentrations of methiothepin as low as 0.1 μm could effectively inhibit calcium increases caused by subsaturating concentrations (1 μm) of CGS. In contrast, the addition of a different antagonist, SB 206553, at concentrations that block the 5-HT2C and 5-HT2B receptors (Kennet et al., 1996), did not affect CGS activity (Table 2). This particular antagonist was chosen because the efficacy of CGS on 5-HT2Creceptors had not been tested, and this receptor is coupled to calcium.
We then demonstrated that two other 5-HT type 1 receptor agonists, sumatriptan and mCPP (Boess and Martin, 1994), also increased calcium levels to a comparable extent (Table 2). Sumatriptan should activate multiple 5-HT1 receptors at the concentration that was used. This dosage was chosen on the basis of the relative binding affinities of sumatriptan and CGS to the 5-HT1B receptor (Boess and Martin, 1994). Although mCPP is not completely selective for type 1 receptors (it can also activate the type 2C receptors), its activity is consistent with the action of CGS. As another test for specificity, we showed that 10 μm CGS increased calcium levels in HeLa cells stably transfected with the human 5-HT1B receptor (Hamblin et al., 1992), but not in parental HeLa cells that lack 5-HT1B receptors (data not shown).
As an initial characterization of the type of G-protein coupled to the 5-HT1B receptor in CA77 cells, we tested the effect of pertussis toxin on CGS and sumatriptan activity. Preincubation with pertussis toxin overnight had no detectable effect on CGS- or sumatriptan-induced elevation in intracellular calcium (Table 2). These data are in contrast to the inhibitory effect of pertussis toxin on 5-HT-stimulated calcium levels in cells stably transfected with 5-HT1B receptors (Zgombick et al., 1993). This difference in coupling is consistent with differences in the type of calcium response in the two studies. Although we observed a delayed, sustained increase in calcium, Zgombick et al. (1993) reported a rapid, transient elevation in calcium. Our results argue that CGS and sumatriptan are activating 5-HT1 receptors that are coupled by a pertussis toxin-insensitive G-protein to a calcium signaling pathway in CA77 cells.
CGS increases calcium levels in cultured trigeminal neurons
Although 5-HT1B receptor mRNA had been found in adult rat trigeminal ganglia by in situ hybridization, there was no information on the signaling mechanism in these cells. To address this issue, we established primary cultures from day 14 neonatal rat trigeminal ganglia. We first confirmed that 5-HT1B receptor mRNA was expressed in these ganglia by using RT-PCR (Fig.2). Only a single product was detected. It was the predicted size and comigrated with RT-PCR amplification products from CA77 cells and rat brain. The identity of the CA77 amplified product was established by sequence analysis (Clark et al., 1995a). As a control for contaminating DNA, no product was detected in the absence of reverse transcriptase.
Fig. 2.

5-HT1B receptor mRNA in trigeminal ganglia. Total RNA isolated from day 14 neonatal rat trigeminal ganglia and brain and from CA77 cells was reverse-transcribed and PCR-amplified, using 5-HT1B specific primers. A 303 bp 5-HT1B cDNA product was detected in CA77 cells (lane 3), trigeminal ganglia (lane 5), and rat brain (lane 7). As controls, RT-PCR was performed with H2O as a substitution for an RNA template (lane 2) or in the absence of reverse transcriptase (lanes 4, 6, 8). A 100 bp DNA standard is shown in lane 1. An inverse image of an ethidium bromide-stained gel is shown.
We then asked whether CGS also would activate a calcium pathway in cultured trigeminal neurons. We observed a robust, sustained (>15 min) increase in intracellular calcium levels after 10 μm CGS treatment when compared with basal levels in the same cells (Fig.3). In addition to the sustained overall increase in calcium, there was also a series of calcium oscillations after CGS treatment. Elevated calcium levels were observed initially in the soma and shortly thereafter in the neurites. These data demonstrate that CGS activation of 5-HT1 receptors is coupled to increases in intracellular calcium in both trigeminal neurons and CA77 cells.
Fig. 3.
CGS increases the concentration of intracellular calcium in primary trigeminal neuron cultures. Intracellular calcium concentrations, [Ca2+]i, were measured, using fura-2 in trigeminal neurons after 3 d in culture.A, Basal levels in cells loaded for 45 min.B, Levels 4 min after the addition of 10 μm CGS. Marked increases in [Ca2+]i are observed in the soma of trigeminal neurons. The pseudocolor scale indicates the 340/380 nm excitation wavelength ratio and [Ca2+]i.
CGS does not decrease cAMP levels
The effect of CGS on cAMP levels in CA77 cells was measured to determine if CGS also might be coupled to the more classical 5-HT1 signaling pathway. However, 10 μm CGS had no significant effect on the 20-fold increase in cAMP levels caused by 1 hr of forskolin treatment (Table 3). We also observed no effect of CGS on cAMP levels in cells plated at twice the normal cell density (n = 2) or in cells treated for 20 min (n = 2). To confirm that CGS did not affect cAMP levels significantly, we directly measured adenylate cyclase activity in CA77 membrane preparations. CGS (10 μm) had little or no effect on the approximately fourfold forskolin stimulation of adenylate cyclase activity. The greatest repression by CGS was ∼14%, and no decrease was detected in most experiments. A similar lack of an effect was seen after treatment with 10 μm 5-HT, with at most a 10% inhibition. These results indicate that 5-HT1 receptors are not coupled to a cAMP-dependent pathway in CA77 cells.
Table 3.
Effect of CGS on forskolin-stimulated cAMP levels in CA77 cells
| Sample | [cAMP] | Fold increase |
|---|---|---|
| Control | 0.77 ± 0.09 | 1 |
| FSK | 16.1 ± 3.8 | 20.9 |
| FSK + CGS | 19.1 ± 4.2 | 24.8 |
Total cAMP levels (pmol/ml) were measured from untreated CA77 cells (control) or cells treated with 10 μm forskolin (FSK) or 10 μm forskolin and 10 μm CGS for 60 min. The mean and SE from two independent experiments with triplicate samples are reported. The fold increase in cAMP relative to control cells is shown.
CGS decreases CGRP mRNA levels
Because increases in calcium levels have been shown to regulate neuropeptide transcription in neuronal cells (MacArthur and Eiden, 1996), we asked whether CGS would decrease CGRP steady-state mRNA levels. CA77 cells were treated with CGS for 14–16 hr, because it was reasoned that this amount of time would be needed to detect a change in the relatively stable CGRP mRNA (Cote and Gagel, 1986). Treatment of CA77 cells with 10 μm CGS resulted in a decrease in the level of both the nuclear precursor CT/CGRP RNA (∼4 kB) and mature 1.2 kB CGRP mRNA (Fig.4A). As a control, the membranes were stripped and reprobed for CO II mRNA. The effect of CGS treatment on CGRP mRNA levels normalized to CO II levels is shown in Figure 4B. CGS treatment caused a threefold decrease in CGRP steady-state mRNA levels. These results demonstrate that a 5-HT1 agonist can downregulate directly the CGRP transcripts in CA77 cells.
Fig. 4.
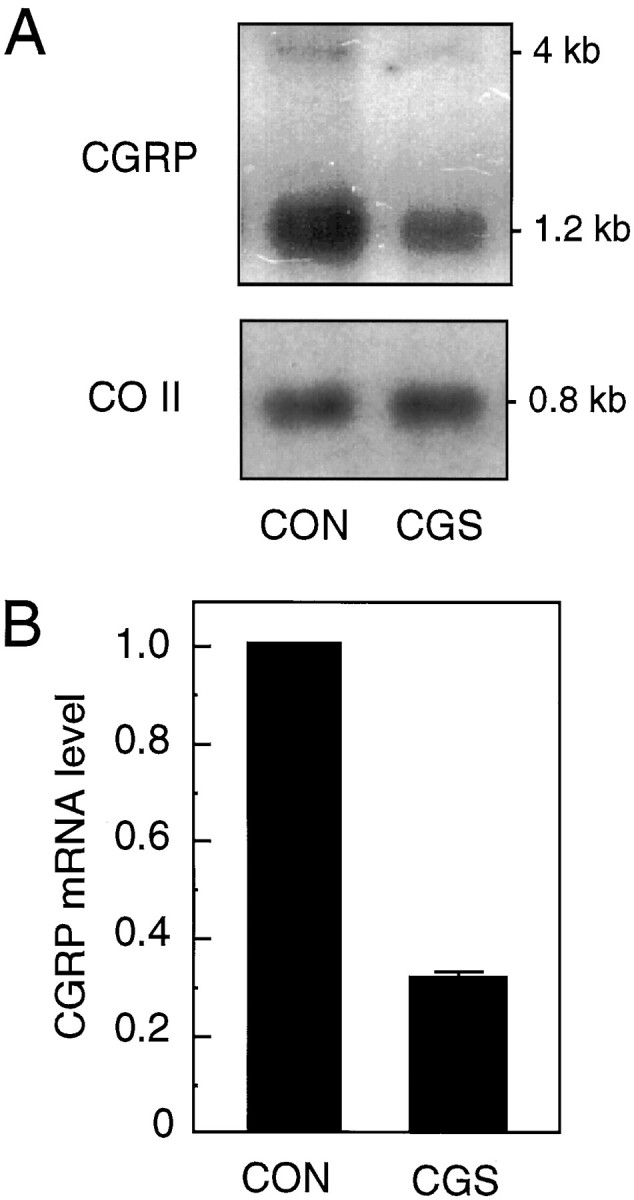
CGS treatment downregulates CGRP steady-state mRNA levels. A, Northern blot analysis of total RNA (3 μg) from vehicle-treated (CON) or CGS-treated (CGS; 10 μm for 16 hr) CA77 cells. The filter was hybridized with cDNA probes for CGRP (top) or CO II (bottom). B, Levels of CGRP mRNA from CGS-treated cells relative to control cells. The CGRP signals were normalized to the density of the CO II band in the vehicle- and CGS-treated cells. The means and SE from four independent experiments are shown.
Dose- and time-dependent inhibition of promoter activity by CGS
To determine whether the decrease in steady-state CGRP mRNA levels was the result of decreased gene transcription, we evaluated the effect of CGS on promoter activity by using the same treatment paradigm. A luciferase reporter gene containing 1250 bp of the 5′ flanking sequences of the rat CT/CGRP promoter was transiently transfected into CA77 cells. The 1250 bp fragment contains the regulatory sequences responsible for the cell-specific and cAMP-responsive activities of the rat CT/CGRP gene. CT/CGRP promoter activity was decreased to ∼10% of control levels after 16 hr of treatment with 10 μm CGS (Fig. 5A). In contrast, CGS had little or no effect on the activity of a cotransfected β-galactosidase reporter gene under the control of the CMV promoter (Fig. 5A). CGS caused a dose-dependent decrease in CT/CGRP promoter activity with half-maximal inhibition at ∼2.5 μm (Fig. 5B). A similar value has been reported for CGS inhibition of forskolin-stimulated cAMP accumulation in cells expressing the 5-HT1B receptor (Unsworth and Molinoff, 1992).
Fig. 5.
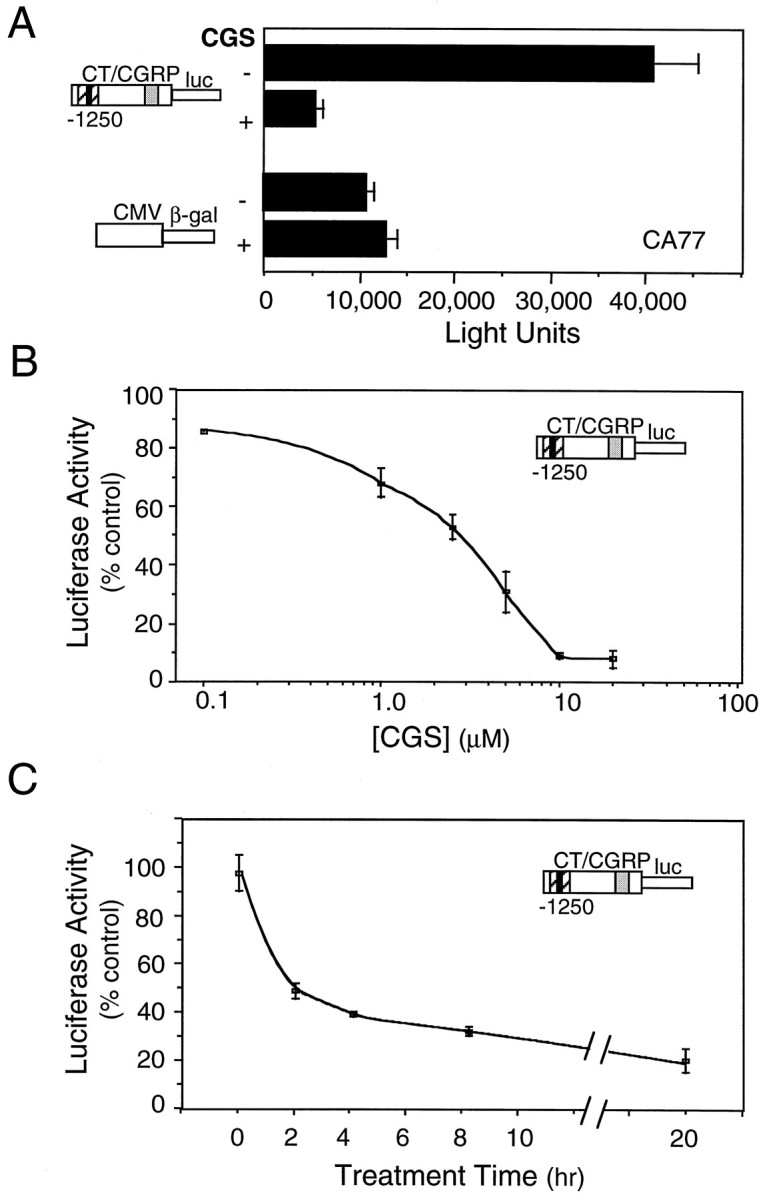
CGS repression of CT/CGRP promoter activity.A, CA77 cells were cotransfected with the CT/CGRP luciferase and CMV–β-galactosidase reporter genes. The CT/CGRP sequences contain a proximal cAMP response region (dotted box) and a distal enhancer that contains both cell-specific (black box) and noncell-specific (striped box) elements. The cells were pooled and divided into parallel dishes that were treated with the vehicle or 10 μm CGS for 16 hr. The mean reporter activity per 20 μg of protein with the SE is shown from four independent experiments. B, The effect of CGS dosage on CT/CGRP promoter activity. CA77 cells were treated with CGS or the maximum volume of vehicle for 16 hr. The activities were normalized to the vehicle activities, which were generally 32,000 light units per 20 μg of protein. The means and the SE from four independent experiments are shown, except the 0.1 μm CGS point, which is from a single experiment.C, The effect of CGS treatment time on CT/CGRP promoter activity. CA77 cells were treated with 10 μm CGS or vehicle for the indicated times, washed to remove CGS, and incubated in medium without CGS until 20 hr after transfection. The activities were normalized to the vehicle activities at each time point. The means and the SE from two independent experiments are shown.
We then addressed whether shorter treatment times also could repress promoter activity. CA77 cells were treated with 10 μm CGS for 2, 4, or 8 hr, and then the drug was removed from the culture medium until the cells were harvested at 20 hr. A treatment time as short as 2 hr, followed by 18 hr without CGS, was sufficient to reduce activity by 50% (Fig. 5C). This indicates that CGS initiates a reduction in CGRP promoter activity within a few hours that is maintained even after removal of the drug.
We also demonstrated that two other 5-HT1 receptor agonists, TFMPP and mCPP (Boess and Martin, 1994), were able to decrease CT/CGRP promoter activity. At 10 μm TFMPP and 10 μm mCPP, promoter activity was decreased to 28% ± 4% and 33% ± 6% of control, respectively (mean ± SEM;n = 3 independent experiments). The mCPP result is especially relevant because this compound increased intracellular calcium levels analogous to CGS. Although, as noted before, mCPP as well as TFMPP is not completely selective, when taken together with the CGS data, these results indicate that 5-HT1 receptor activation leads to an inhibition of CT/CGRP promoter activity.
CGS can inhibit cAMP stimulation of CT/CGRP promoter activity
We then asked whether CGS inhibition of the cAMP-responsive element of the CT/CGRP gene could contribute to repression of promoter activity. Although we had shown that the effect of CGS was not coupled to decreased cAMP levels (Table 3), increased intracellular calcium can inhibit cAMP-responsive elements (Ginty, 1997). We have localized the cAMP-responsive region of the rat CT/CGRP gene between −280 and −100 bp (P. L. Durham, unpublished data). This region shares a high degree of homology with the human CT/CGRP gene, which contains two cAMP-responsive motifs located between −250 and −150 bp (deBustros et al., 1992; Monia et al., 1995).
The effect of CGS on forskolin stimulation of the CT/CGRP reporter genes was tested after treatment of the cells with forskolin for 4 hr. The transcriptional activities of the 1250, 920, and 280 bp CT/CGRP luciferase reporter genes were increased by forskolin 2.7-, 4.6-, and 5.6-fold, respectively (Fig.6). This stimulatory effect of forskolin was inhibited 50% or greater by cotreatment with CGS (Fig. 6). Comparable inhibition was seen with cells that had been treated with CGS for 16 hr or only 1 hr before forskolin treatment. Importantly, similar results also were seen when dibutyrl cAMP was substituted for forskolin. Dibutyrl cAMP induced the 280 bp CT/CGRP promoter activity fourfold, and cotreatment with 10 μm CGS decreased this stimulation by 51% (±4%; n = 2 independent experiments). As a control, TK–luciferase reporter activity was relatively unaffected by forskolin, dibutyrl cAMP, or CGS during the 4 hr treatment times. These results demonstrate that CGS specifically can inhibit cAMP-stimulated transcription of the CT/CGRP gene.
Fig. 6.

CGS inhibition of cAMP stimulation of CT/CGRP promoter activity. Luciferase reporter genes containing 1250, 920, or 280 bp of the 5′-flanking sequence of the CT/CGRP gene or the non-cAMP-responsive 105 bp TK promoter were transfected into CA77 cells. The cAMP-responsive region is indicated by a dotted box, whereas the striped and solid boxes identify the noncell-specific and cell-specific enhancer, respectively. Cells were cotreated with 10 μm forskolin in the presence (+) or absence (−) of 10 μm CGS for 4 hr and assayed for luciferase activity. The activities of the forskolin-treated cells with or without CGS were normalized to vehicle (control) cells. The average activity for the TK control cells was ∼1700 light units per 20 μg of protein. The fold stimulations in response to forskolin and SEM from at least four independent experiments, each in duplicate, are shown.
Repression of cell-specific enhancer activity by CGS
Because CGS can repress CT/CGRP mRNA levels and promoter activity even in the absence of cAMP stimulation, we reasoned that additional sequences might be involved. To test this prediction, we used a series of luciferase reporter genes containing various regions of 5′ flanking DNA. We first compared the degree of repression of the 1250 bp promoter fragment, which contains the distal cell-specific enhancer and proximal cAMP-responsive region, with a 920 bp promoter–reporter, which lacks the distal enhancer. CGS decreased the activity of the 1250 bp promoter to a much greater extent than the 920 bp promoter (Fig.7). To allow comparisons between multiple experiments, we normalized the data to the TK–luciferase reporter and a cotransfected CMV–β-galactosidase reporter for which the activity remained unchanged after CGS treatment (see Fig. 5A). Because the TK reporter generally was inhibited 1.5- to 2.5-fold by overnight CGS treatment, this normalization also facilitated the comparison between reporters containing different elements linked to the TK promoter. The relative lack of an effect on the 920 bp reporter illustrates that the CGS effect on basal promoter activity is separate from its effect on forskolin-induced promoter activity.
Fig. 7.

CGS-mediated repression of CT/CGRP enhancer activity. CT/CGRP or TK reporter genes containing the cAMP-responsive region (dotted box), distal cell-specific enhancer HLH–octamer binding motifs (H/O; solid box), and/or noncell-specific elements (striped box) were transfected into CA77 cells treated with 10 μm CGS for 16 hr and then assayed for luciferase activity. CGS responsiveness also was tested by using reporter genes that contain site-directed mutations in the cell-specific enhancer. Insertion of a BamHI linker (1160–920+Bam) or a single adenosine residue (H/O+A) eliminated both cell-specific enhancer activity and repression by CGS. The data in each experiment were normalized to the TK–luciferase reporter activity in the presence (+) or absence (−) of CGS and expressed as the fold change relative to TK–luciferase, the mean for which was set at one. The average activities for CGS-treated and untreated TK–luciferase-transfected cells were 1000 and 2000 light units per 20 μg of protein, respectively. The means and SE from at least three independent experiments with duplicate samples are shown.
We then mapped the sequences in the region between −920 and −1250 bp that were responsible for the CGS repression of basal activity. The distal enhancer within this region is composed of both the cell-specific enhancer and flanking noncell-specific enhancer sequences (Lanigan and Russo, 1997). Reporter plasmids containing all of the enhancer sites (from −1160 to −960 bp) and containing only the cell-specific sites (H/O) were repressed by CGS (Fig. 7). The degree of repression of the distal enhancer is similar to that seen with the 1250 bp reporter, which contains the enhancer and cAMP-responsive regions. Combined with the relative lack of an effect on the 920 bp reporter, these results demonstrate that the cAMP-responsive region does not contribute to the inhibition of basal activity. In agreement with this conclusion, reporter genes containing the distal enhancer (from −1160 to −920 bp) juxtaposed with the cAMP-responsive region (from −280 to +21 bp) showed no additional repression by CGS, as compared with the 1160 to 920 bp TK–luciferase reporter (data not shown). This is in contrast to vitamin D inhibition of CT/CGRP transcription, which required both regions (Peleg et al., 1993). Furthermore, neither the −1160 to −920 bp nor 18 bp H/O sequences are cAMP-responsive (data not shown). These studies demonstrate that the effectiveness of CGS is mediated via the cell-specific enhancer.
The importance of both sites within the cell-specific enhancer was shown by the loss of CGS-mediated repression on mutation of the H/O enhancer (Fig. 7). CGS did not have an inhibitory effect on the reporter gene containing the −1160 to −920 bp fragment with an 8 bpBamHI linker inserted into the HLH site (+Bam mutation). Likewise, there was no CGS repression of the 18 bp H/O enhancer containing a single additional adenosine residue inserted between the HLH and octamer motifs (+A mutation). The +Bam and +A mutations reduce activity by disrupting the binding of upstream stimulatory factor (USF) and OB2, respectively (Lanigan and Russo, 1997). These studies demonstrate that CGS downregulation of the H/O enhancer requires both the HLH and OB2 factors.
To confirm the cell specificity of CGS repression, we tested the effect of CGS on CGRP enhancer activity in heterologous cells. The H/O enhancer of the CT/CGRP gene previously has been shown to be inactive in HeLa cells, presumably because of the lack of OB2 protein (Tverberg and Russo, 1993). Because HeLa cells have been reported to not express 5-HT1 receptors, we took advantage of a HeLa line expressing 5-HT1B receptors (Hamblin et al., 1992). Serotonin treatment of these cells has been reported to inhibit forskolin-stimulated cAMP accumulation in the 5-HT1B-expressing cells, but not the parental HeLa cells (Hamblin et al., 1992). As mentioned above, we also saw a CGS-induced increase in calcium levels in the HeLa 5-HT1B cells. We observed a small (twofold) increase in each of the reporter gene activities after treatment with CGS. Hence, when normalized to the TK reporter, CGS had little or no effect on the H/O enhancer in HeLa cells (Fig. 8). As a control, the mutant H/O+A enhancer yielded similar results. These results confirm that CGS repression of the basal enhancer is cell-specific.
Fig. 8.

Cell specificity of CGS inhibition of CT/CGRP enhancer activity. TK reporter genes containing the H/O enhancer (solid box) or the H/O+A mutant enhancer were transfected into HeLa cells expressing the 5-HT1B receptor, treated with 10 μm CGS or vehicle for 16 hr, and then assayed for luciferase activity. The data in each experiment were normalized to the TK–luciferase reporter activity in the presence (+) or absence (−) of CGS and expressed as the fold change relative to TK, the mean for which was set at one. The average activities for CGS-treated and untreated TK-transfected cells were 3200 and 1600 light units per 20 μg of protein, respectively. The means and SE from three independent experiments with duplicate samples are shown.
DISCUSSION
To begin to understand the molecular mechanism by which serotonergic antimigraine drugs regulate CGRP levels, we have studied the effect of a 5-HT1 receptor agonist, CGS, on CGRP transcription. We first demonstrated that CGS and sumatriptan markedly increased intracellular calcium levels in CA77 cells in a manner that is similar to CGS effects on trigeminal neurons. The pattern and duration of the calcium increase we observed in CA77 cells differ from those reported for the 5-HT1B receptor stably expressed in a fibroblast cell line (Zgombick et al., 1993). Furthermore, in contrast to the the coupling in fibroblasts, the coupling we observed in CA77 cells was cAMP-independent and pertussis toxin-insensitive. To our knowledge, this is the first demonstration of 5-HT1receptors coupled to a calcium pathway via pertussis toxin-insensitive G-proteins. Our findings support the possibility of a cell-specific difference from the classical role ascribed to this class of receptors (Boess and Martin, 1994). Indeed, cell type-dependent recruitment of cAMP and calcium pathways has been reported for transfected 5-HT1F receptors (Adham et al., 1993). This potential cell specificity emphasizes the importance of CA77 cells and trigeminal neurons having similar CGS calcium coupling and CGRP enhancer activity in transgenic mice (Stolarsky-Fredman et al., 1990). Although it is certainly possible that additional pathways and/or enhancer mechanisms may be recruited in trigeminal neurons that differ from CA77 cells or other models, these similarities support judicious use of CA77 cells for CGRP gene expression studies.
Using the CA77 cells as a model, we found that CGS decreased CGRP mRNA levels and promoter activity. The concentration of CGS required to inhibit promoter activity correlated with the concentration required for a significant increase in calcium levels. Thus, activation of calcium-dependent pathway(s) is likely to be involved in inhibition of CGRP transcription. How might this be mediated? Elevated calcium levels potentially could activate several signaling pathways and target genes (Ghosh and Greenberg, 1995). For example, calcium is known to activate CAM-kinases and immediate early genes, which then can, in turn, regulate neuropeptide gene transcription (MacArthur and Eiden, 1996). Interestingly, tonic neuronal activity, characterized by elevated calcium levels, either can activate or can suppress neuropeptide expression in peripheral neurons, dependent on the neuropeptide, the stimulus, and type of neuron (MacArthur and Eiden, 1996). Recently,Dolmetsch et al. (1997) reported that both the duration and amplitude of the increase in calcium are critical determinants of gene regulation. Hence, it seems that the prolonged duration of elevated calcium may be an important component of CGS action.
We identified two distinct regulatory regions that are responsible for the inhibitory effect of CGS on CGRP gene transcription, the cAMP-responsive region and the cell-specific enhancer. Because we have shown that CGS had little or no inhibitory effect on cyclase activity and cAMP levels in CA77 cells, this indicates that CGS must inhibit the cAMP-responsive region via a cAMP-independent mechanism, presumably involving calcium. Such inhibitory cross-talk between calcium and cAMP pathways can occur. Elevated calcium can inhibit CRE binding protein (CREB) activity by stimulating a CREB phosphatase (Mulkey et al., 1994;Ginty, 1997) and by causing an inhibitory phosphorylation of CREB (Sun et al., 1994). The prediction that CGS inhibits a downstream target such as CREB is supported further by our observation that CGS also inhibited the stimulatory effect of exogenously added cAMP. Candidate target proteins for repression by CGS include CREB, ATF-1 (Monia et al., 1995), and a novel factor responsive to activated Ras (Thiagalingam et al., 1996), all of which have been shown to bind the homologous cAMP-responsive region of the human CGRP gene.
The most marked inhibition of CGRP promoter activity was mediated via the 18 bp cell-specific H/O enhancer. This enhancer is controlled by a synergistic interaction between a ubiquitous USF HLH heterodimer and the cell-specific OB2 protein (Tverberg and Russo, 1993; Lanigan and Russo, 1997). Both of these factors are required for the inhibitory effect of CGS. In preliminary studies we have not detected a change in binding activity in electrophoretic mobility shift assays after CGS treatment. This suggests that CGS is not affecting the levels or binding activity of USF or OB2. Because CGS action appears to be fairly rapid, we predict that a calcium-activated kinase cascade initiates repression of the activity of USF and/or OB2 proteins. Interestingly, the H/O enhancer also is repressed by dexamethasone and retinoic acid (Tverberg and Russo, 1992; Lanigan et al., 1993). Thus the cell-specific enhancer appears to be a common focal point of several regulatory agents.
On the basis of these findings, we speculate that antimigraine drugs that bind 5-HT1 receptors potentially may decrease CGRP synthesis in trigeminal ganglion neurons. This action is most likely occurring in tandem with a rapid inhibition of CGRP secretion, which would account for the fast action of these drugs (∼30 min) (Ferrari and Saxena, 1993). Future studies using both trigeminal and CA77 cell cultures should help to uncover the signaling mechanisms and efficacies of serotonergic drugs on CGRP gene expression and peptide secretion.
Footnotes
This work was supported by Grants from the National Institutes of Health (HD25969) and American Heart Association (96013860) to A.R., with tissue culture support provided by the Diabetes and Endocrinology Center (DK25295) and an Iowa Cardiovascular Interdisciplinary Research Fellowship (HL07121) to P.D. We thank T. Lanigan and M. Clark for discussions, and D. Segaloff, A. Abel, A. K. Johnson, M. Hamblin, and S. Barcellos for generously providing advice and reagents.
Correspondence should be addressed to Dr. Andrew F. Russo, Department of Physiology and Biophysics, University of Iowa, Iowa City, IA 52242.
REFERENCES
- 1.Adham N, Borden LA, Schechter LE, Gustafson EL, Cochran TL, Vaysse PJ, Weinshank RL, Branchek TA. Cell-specific coupling of the cloned human 5-HT1F receptor to multiple signal transduction pathways. Naunyn Schmiedebergs Arch Pharmacol. 1993;348:566–575. doi: 10.1007/BF00167231. [DOI] [PubMed] [Google Scholar]
- 2.Besnard P, Jousset V, Garel J. Additive effects of dexamethasone and calcium on the calcitonin mRNA level in adrenalectomized rats. FEBS Lett. 1989;258:293–296. doi: 10.1016/0014-5793(89)81677-1. [DOI] [PubMed] [Google Scholar]
- 3.Boess FG, Martin IL. Molecular biology of 5-HT receptors. Neuropharmacology. 1994;33:275–317. doi: 10.1016/0028-3908(94)90059-0. [DOI] [PubMed] [Google Scholar]
- 4.Bouchelet I, Cohen Z, Case B, Seguela P, Hamel E. Differential expression of sumatriptan-sensitive 5-hydroxytryptamine receptors in human trigeminal ganglia and cerebral blood vessels. Mol Pharmacol. 1996;502:219–223. [PubMed] [Google Scholar]
- 5.Brain SD, Williams TJ, Tippins JR, Morris HR, MacIntyre I. Calcitonin gene-related peptide is a potent vasodilator. Nature. 1985;313:54–56. doi: 10.1038/313054a0. [DOI] [PubMed] [Google Scholar]
- 6.Bruinvels AT, Landwehrmeyer B, Moskowitz MA, Hoyer D. Evidence for the presence of 5-HT1B receptor messenger RNA in neurons of the rat trigeminal ganglia. Eur J Pharmacol. 1992;227:357–359. doi: 10.1016/0922-4106(92)90017-p. [DOI] [PubMed] [Google Scholar]
- 7.Buzzi MG, Carter WB, Shimizu T, Heath H, III, Moskowitz MA. Dihydroergotamine and sumatriptan attenuate levels of CGRP in plasma in rat superior sagittal sinus during electrical stimulation of the trigeminal ganglia. Neuropharmacology. 1991;30:1193–1200. doi: 10.1016/0028-3908(91)90165-8. [DOI] [PubMed] [Google Scholar]
- 8.Buzzi MG, Bonamini M, Moskowitz MA. Neurogenic model of migraine. Cephalalgia. 1995;15:277–280. doi: 10.1046/j.1468-2982.1995.1504277.x. [DOI] [PubMed] [Google Scholar]
- 9.Clark MS, Lanigan TM, Page NM, Russo AF. Induction of a serotonergic and neuronal phenotype in thyroid C-cells. J Neurosci. 1995a;15:6167–6178. doi: 10.1523/JNEUROSCI.15-09-06167.1995. [DOI] [PMC free article] [PubMed] [Google Scholar]
- 10.Clark MS, Lanigan TM, Russo AF. Serotonergic neuronal properties in C-cell lines. Methods. 1995b;7:253–261. [Google Scholar]
- 11.Cote GJ, Gagel RF. Dexamethasone differentially affects the levels of calcitonin and calcitonin gene-related peptide mRNAs as expressed in a human medullary thyroid carcinoma cell line. J Biol Chem. 1986;261:15524–15528. [PubMed] [Google Scholar]
- 12.deBustros A, Baylin SB, Levine MA, Nelkin BD. Cyclic AMP and phorbol esters separately induce growth inhibition, calcitonin secretion, and calcitonin gene transcription in cultured human medullary thyroid carcinoma. J Biol Chem. 1986;261:8036–8041. [PubMed] [Google Scholar]
- 13.deBustros A, Ball DW, Peters R, Compton D, Nelkin BD. Regulation of human calcitonin gene transcription by cyclic AMP. Biochem Biophys Res Commun. 1992;198:1157–1164. doi: 10.1016/0006-291x(92)92325-r. [DOI] [PubMed] [Google Scholar]
- 14.Dolmetsch RE, Lewis RS, Goodnow CC, Healy JI. Differential activation of transcription factors induced by Ca2+ response amplitude and duration. Nature. 1997;386:855–858. doi: 10.1038/386855a0. [DOI] [PubMed] [Google Scholar]
- 15.Durham PL, Nanthakumar EJ, Snyder JM. Developmental regulation of surfactant-associated proteins in rabbit fetal lung in vivo. Exp Lung Res. 1992;18:775–793. doi: 10.3109/01902149209031707. [DOI] [PubMed] [Google Scholar]
- 16.Edvinsson L, Goadsby PJ. Neuropeptides in migraine and cluster headache. Cephalalgia. 1994;14:320–327. doi: 10.1046/j.1468-2982.1994.1405320.x. [DOI] [PubMed] [Google Scholar]
- 17.Ferrari MD, Saxena PR. On serotonin and migraine: a clinical and pharmacological review. Cephalalgia. 1993;13:151–165. doi: 10.1046/j.1468-2982.1993.1303151.x. [DOI] [PubMed] [Google Scholar]
- 18.Ghosh A, Greenberg MA. Calcium signaling in neurons: molecular mechanisms and cellular consequences. Science. 1995;268:239–247. doi: 10.1126/science.7716515. [DOI] [PubMed] [Google Scholar]
- 19.Ginty DD. Calcium regulation of gene expression: isn’t that spatial? Neuron. 1997;18:183–186. doi: 10.1016/s0896-6273(00)80258-5. [DOI] [PubMed] [Google Scholar]
- 20.Goadsby PJ, Edvinsson L. The trigeminovascular system and migraine: studies characterizing cerebrovascular and neuropeptide changes seen in humans and cats. Ann Neurol. 1993;33:48–56. doi: 10.1002/ana.410330109. [DOI] [PubMed] [Google Scholar]
- 21.Goadsby PJ, Edvinsson L. Human in vivo evidence for trigeminovascular activation in cluster headache. Neuropeptide changes and effects of acute attacks therapies. Brain. 1994;117:427–434. doi: 10.1093/brain/117.3.427. [DOI] [PubMed] [Google Scholar]
- 22.Goadsby PJ, Edvinsson L, Ekman R. Release of vasoactive peptides in the extracerebral circulation of humans and the cat during activation of the trigeminovascular system. Ann Neurol. 1988;23:193–196. doi: 10.1002/ana.410230214. [DOI] [PubMed] [Google Scholar]
- 23.Hamblin MW, Metcalf MA, McGuffin RW, Karpells S. Molecular cloning and functional characterization of a human 5-HT1B serotonin receptor: a homologue of the rat 5-HT1B receptor with 5-HT1D-like pharmacological specificity. Biochem Biophys Res Commun. 1992;184:752–759. doi: 10.1016/0006-291x(92)90654-4. [DOI] [PubMed] [Google Scholar]
- 24.Jacobs J, Simpson WE, Penschow J, Hudson P, Coghlan J, Niall H. Characterization and localization of calcitonin messenger ribonucleic acid in rat thyroid. Endocrinology. 1983;113:1616–1622. doi: 10.1210/endo-113-5-1616. [DOI] [PubMed] [Google Scholar]
- 25.Jaquette J, Segaloff DL. Temperature sensitivity of some mutants of the lutropin/choriogonadotropin receptor. Endocrinology. 1997;138:85–91. doi: 10.1210/endo.138.1.4902. [DOI] [PubMed] [Google Scholar]
- 26.Kennet GA, Wood MD, Bright F, Cilia J, Piper DC, Gager T, Thomas D, Baxter GS, Forbes IT, Ham P, Blackburn TP. In vitro and in vivo profile of SB 206553, a potent 5-HT2C/5-HT2B receptor antagonist with anxiolytic-like properties. Br J Pharmacol. 1996;117:427–434. doi: 10.1111/j.1476-5381.1996.tb15208.x. [DOI] [PMC free article] [PubMed] [Google Scholar]
- 27.Lanigan T, Russo AF. Binding of upstream stimulatory factor and a cell-specific activator to the calcitonin/calcitonin gene-related peptide enhancer. J Biol Chem. 1997;272:18316–18324. doi: 10.1074/jbc.272.29.18316. [DOI] [PubMed] [Google Scholar]
- 28.Lanigan TM, Tverberg LA, Russo AF. Retinoic acid repression of cell-specific helix-loop-helix-octamer activation of the calcitonin/calcitonin gene-related peptide enhancer. Mol Cell Biol. 1993;13:6079–6088. doi: 10.1128/mcb.13.10.6079. [DOI] [PMC free article] [PubMed] [Google Scholar]
- 29.MacArthur L, Eiden L. Neuropeptide genes: targets of activity-dependent signal transduction. Peptides. 1996;17:721–728. doi: 10.1016/0196-9781(95)02100-0. [DOI] [PubMed] [Google Scholar]
- 30.McCulloch J, Uddman R, Kingman TA, Edvinsson L. Calcitonin gene-related peptide: functional role in cerebrovascular regulation. Proc Natl Acad Sci USA. 1986;83:5731–5735. doi: 10.1073/pnas.83.15.5731. [DOI] [PMC free article] [PubMed] [Google Scholar]
- 31.Monia YT, Peleg S, Gagel RF. Cell type-specific regulation of transcription by cyclic adenosine 3′,5′-monophosphate-responsive elements within the calcitonin promoter. Mol Endocrinol. 1995;9:784–793. doi: 10.1210/mend.9.7.7476962. [DOI] [PubMed] [Google Scholar]
- 32.Mulkey RM, Endo S, Shenolikar S, Malenka RC. Involvement of a calcineurin/inhibitor-1 phosphatase cascade in hippocampal long-term depression. Nature. 1994;369:486–489. doi: 10.1038/369486a0. [DOI] [PubMed] [Google Scholar]
- 33.Neale RF, Fallon SL, Boyar WC, Wasley JWF, Martin LL, Stone GA, Glaeser BS, Sinton CM, Williams M. Biochemical and pharmacological characterization of CGS 12066B, a selective serotonin-1B agonist. Eur J Pharmacol. 1987;136:1–9. doi: 10.1016/0014-2999(87)90772-2. [DOI] [PubMed] [Google Scholar]
- 34.O’Conner TP, Van der Kooy D. Enrichment of vasoactive neuropeptide calcitonin gene-related peptide in the trigeminal sensory projections to the intracranial arteries. J Neurosci. 1988;8:2468–2476. doi: 10.1523/JNEUROSCI.08-07-02468.1988. [DOI] [PMC free article] [PubMed] [Google Scholar]
- 35.Peleg S, Abruzzese RV, Cooper CW, Gagel RF. Down-regulation of calcitonin gene transcription by vitamin D requires two widely separated enhancer sequences. Mol Endocrinol. 1993;7:999–1008. doi: 10.1210/mend.7.8.8232320. [DOI] [PubMed] [Google Scholar]
- 36.Rebeck GW, Maynard KI, Hyman BT, Moskowitz MA. Selective 5-HT1Dα serotonin receptor gene expression in trigeminal ganglia: implications for antimigraine drug development. Proc Natl Acad Sci USA. 1994;91:3666–3669. doi: 10.1073/pnas.91.9.3666. [DOI] [PMC free article] [PubMed] [Google Scholar]
- 37.Rosenfeld MG, Mermod JJ, Amara SG, Swanson LW, Sawchenko PE, Rivier J, Vale WW, Evans RM. Production of a novel neuropeptide encoded by the calcitonin gene via tissue-specific RNA processing. Nature. 1983;304:129–135. doi: 10.1038/304129a0. [DOI] [PubMed] [Google Scholar]
- 38.Russo AF, Lanigan TM. Neuronal properties of thyroid C-cell tumor lines. In: Nelkin BD, editor. Genetic mechanisms in multiple endocrine neoplasia type 2. Chapman and Hall; New York: 1996. pp. 137–162. [Google Scholar]
- 39.Russo AF, Clark MS, Durham PL. Thyroid parafollicular cells: an accessible model for the study of serotonergic neurons. Mol Neurobiol. 1996;13:257–276. doi: 10.1007/BF02740626. [DOI] [PubMed] [Google Scholar]
- 40.Salomon Y. Adenylate cyclase assay. In: Brooker G, Greengard P, Robinson GA, editors. Advances in cyclic nucleotide research. Raven; New York: 1979. pp. 35–55. [PubMed] [Google Scholar]
- 41.Sharma RV, Chapleau MW, Hajduczok G, Wachtel RE, Waite LJ, Bhalla RC, Abboud FM. Mechanical stimulation increases intracellular calcium concentration in nodose sensory neurons. Neuroscience. 1995;66:433–441. doi: 10.1016/0306-4522(94)00560-r. [DOI] [PubMed] [Google Scholar]
- 42.Stolarsky-Fredman L, Leff SE, Klein ES, Crenshaw EB, III, Yeakley J, Rosenfeld MG. A tissue-specific enhancer in the rat-calcitonin/CGRP gene is active in both neuronal and endocrine cell types. Mol Endocrinol. 1990;4:497–504. doi: 10.1210/mend-4-3-497. [DOI] [PubMed] [Google Scholar]
- 43.Sun P, Enslen H, Myung PS, Maurer RA. Differential activation of CREB by Ca2+/calmodulin-dependent protein kinases type II and type IV involves phosphorylation of a site that negatively regulates activity. Genes Dev. 1994;8:2527–2539. doi: 10.1101/gad.8.21.2527. [DOI] [PubMed] [Google Scholar]
- 44.Thiagalingam A, deBustros A, Borges M, Jasti R, Compton D, Diamond L, Mabry M, Ball DW, Baylin SB, Nelkin BD. RREB-1, a novel zinc finger protein, is involved in the differentiation response to ras in human medullary thyroid carcinomas. Mol Cell Biol. 1996;16:5335–5345. doi: 10.1128/mcb.16.10.5335. [DOI] [PMC free article] [PubMed] [Google Scholar]
- 45.Tverberg LA, Russo AF. Cell-specific glucocorticoid repression of calcitonin/calcitonin gene-related peptide transcription. J Biol Chem. 1992;267:17567–17573. [PubMed] [Google Scholar]
- 46.Tverberg LA, Russo AF. Regulation of the calcitonin/calcitonin gene-related peptide gene by cell-specific synergy between helix-loop-helix and octamer-binding transcription factors. J Biol Chem. 1993;268:15965–15973. [PubMed] [Google Scholar]
- 47.Unsworth D, Molinoff PB. Regulation of the 5-hydroxytryptamine1B receptor in opossum kidney cells after exposure to agonists. Mol Pharmacol. 1992;42:464–470. [PubMed] [Google Scholar]
- 48.Vedder H, Otten U. Biosynthesis and release of tachykinins from rat sensory neurons in culture. J Neurosci Res. 1991;30:288–299. doi: 10.1002/jnr.490300203. [DOI] [PubMed] [Google Scholar]
- 49.Zeytin FN, Rusk S, Leff SE. Calcium, dexamethasone, and the antiglucocorticoid RU-486 differentially regulate neuropeptide synthesis in a rat C-cell line. Endocrinology. 1987;121:361–370. doi: 10.1210/endo-121-1-361. [DOI] [PubMed] [Google Scholar]
- 50.Zgombick JM, Borden LA, Cochran TL, Kucharewicz SA, Weinshank RL, Branchek TA. Dual coupling of cloned human 5-hydroxytryptamine1Dα and 5-hydroxytryptamine1Dβ receptors stably expressed in murine fibroblasts: inhibition of adenylate cyclase and elevation of intracellular calcium concentrations via pertussis toxin-sensitive G-proteins. Mol Pharmacol. 1993;44:575–582. [PubMed] [Google Scholar]