

Abstract
The transcriptional activator retinoic acid (RA) has been shown to influence the early patterning of the vertebrate eye. Models for the establishment of the retinofugal projection postulate gradients of cell-surface markers across the retinal surface that are expressed by ganglion cells and mediate the correct connection of fibers within central target fields. Spatial asymmetries of RA and RA-producing enzymes, as have been found in the eyes of mice and zebrafish, could induce the required asymmetry in gene expression. Here we exploited the large size of the retina of the embryonic chick to analyze the spatial and temporal characteristics of the RA system by HPLC in combination with a reporter cell assay. As in other embryonic vertebrates, the chick retina was found to contain different RA-generating enzymes segregated along the dorsoventral axis. The major RA isomer in both dorsal and ventral retina was all-trans RA, and no 9-cis RA could be detected. This excludes a difference in production of these two isomers as an explanation for the expression of different RA-generating enzymes. At developmental stages embryonic days (E) 4 and 5, the ventral retina contained higher all-trans RA levels than the dorsal retina. After E8, however, the difference disappeared, and in embryos at E9 and older the RA concentration was slightly higher in dorsal than ventral retina.
Keywords: retinoic acid, aldehyde dehydrogenase, retinaldehyde, retina, chick embryo, eye, high pressure liquid chromatography (HPLC)
The positional information required for the establishment of the retinofugal projection in vertebrates is believed to be encoded in gradients of cell-surface markers across the retina and its central projection fields (Bonhoeffer and Gierer, 1994). For the anteroposterior axes of the retina and optic tectum, several graded cell-surface molecules have been identified recently that confer spatial recognition properties onto retinal ganglion cells (Cheng et al., 1995; Drescher et al., 1995). Also for the dorsoventral axis of the embryonic retina, graded cell-surface molecules have been described, but the mechanism of their action is not yet understood (Holash and Pasquale, 1995; Kenny et al., 1995; Marcus et al., 1996;Holash et al., 1997). The graded expression of cell-surface molecules has to be preceded by a mechanism that establishes it, presumably an axial asymmetry in gene transcription and protein translation.
A candidate for an asymmetry-creating mechanism along the dorsoventral retinal axis has been identified in the transcriptional activator retinoic acid (RA). Embryonic mice and zebrafish express different RA-generating enzymes in dorsal and ventral retinal compartments, an arrangement that results in a ventrodorsal RA difference, as detected with a bioassay (McCaffery et al., 1992; Marsh-Armstrong et al., 1994). Because the small lipid RA will diffuse for some distance through solid tissue, the compartmental difference in RA-generating enzymes ought to equilibrate to ventrodorsal RA gradients in small embryonic retinas. Because different genes have different RA response thresholds (Simeone et al., 1990; Boncinelli et al., 1991), an asymmetry in ligand concentration ought to result in asymmetrical gene expression, even if the RA receptors are distributed uniformly throughout the retina (Dollé et al., 1990, 1994).
Experiments in zebrafish indicate that the dorsoventral asymmetry in RA-generating enzymes is determined by an RA-mediated polarization event during a brief critical period at the eye anlage stage. Inhibition of endogenous RA synthesis at this stage prevents formation of the ventral eye (Marsh-Armstrong et al., 1994), and local or global excess of RA induces normally dorsal eye regions to assume ventral properties by activating expression of the ventral RA-generating enzyme at the expense of the dorsal enzyme (Hyatt et al., 1996). The lasting segregated expression of RA-generating dehydrogenases perpetuates the orientation of the transient polarization event throughout later developmental stages, when axial cues are needed for the establishment of retinofugal projections (Dräger and McCaffery, 1997).
The direct biochemical consequence of the axially segregated expression of different RA-generating enzymes remains an unsolved problem. With an RA reporter cell line that responds mainly to all-trans RA (Wagner et al., 1992), higher activity can be measured in the ventral retina (McCaffery et al., 1992). In addition to all-transRA, however, several other RA isomers and RA metabolites have been implicated in biological functions of retinoids (Pijnappel et al., 1993; Stenkamp et al., 1993; Blumberg et al., 1996). In particular, an asymmetry in 9-cis RA seemed plausible, because genetic elimination of a 9-cis RA receptor (retinoid X receptor), the RXRα, causes preferentially a defect of the ventral eye (Kastner et al., 1994). Here we made use of the large size of the embryonic chick retina, as compared with mouse and zebrafish, to measure directly the spatial distribution of retinoid isomers by HPLC and in combination with the all-trans RA-sensitive reporter cell line. The HPLC measurements are compared with a detailed spatial and temporal analysis of RA-synthesizing enzymes during the period when retinal ganglion cells differentiate and form central connections. We wished to determine whether different RA isomers are involved in retinal development and how the distribution of synthesizing enzymes can account for the distribution of RA isomers.
MATERIALS AND METHODS
Tissue preparation. To obtain chick embryos ranging from 4 to 18 d of development, fertilized eggs of the white Leghorn strain were incubated for the desired periods at 38°C and 80% humidity. Embryos were staged according to Hamburger and Hamilton (1951). All steps of tissue preparation were performed in ice-cold saline under amber light or with a dissecting microscope whose light source was equipped with a red cutoff filter to protect retinoids from exposure to light <500 nm. After decapitation of the embryos and removal of the eyes, the retinas were dissected as described previously (Mey and Thanos, 1991).
For investigation of enzyme activities, the retinas were freed from the vitreous body and pigmented epithelium, spread onto black nitrocellulose filters (Sartorius, Göttingen/Germany), and either cut circumferentially into sectors or cut from dorsal to ventral into five consecutive slices (see Fig. 1). In preparations of stages younger than embryonic day (E) 5 and older than E15, the pigmented epithelium could not be separated from the retina, and at all stages the retina samples contained some remnants of contaminating pigment epithelium. Tissue samples were collected in ice-cold dissecting buffer in weighed 1.5 ml vials and spun down for 1 min at 8000 × g, and after removal of supernatants their wet weights were determined. Samples were sonicated for 15 sec in an equal amount of hypotonic buffer containing 10 mm phosphate buffer (PB), 30 mm NaCl, and a cocktail of protease inhibitors (Sigma, St. Louis, MO) consisting of 1 μl/ml aprotinin (of a 90 mg/ml stock solution), 10 μl/ml PMSF (100 mm stock solution in isopropanol), 1 μl/ml leupeptin (1 mm stock solution), and 1 μl/ml pepstatin (1 mm stock solution in methanol).
Fig. 1.
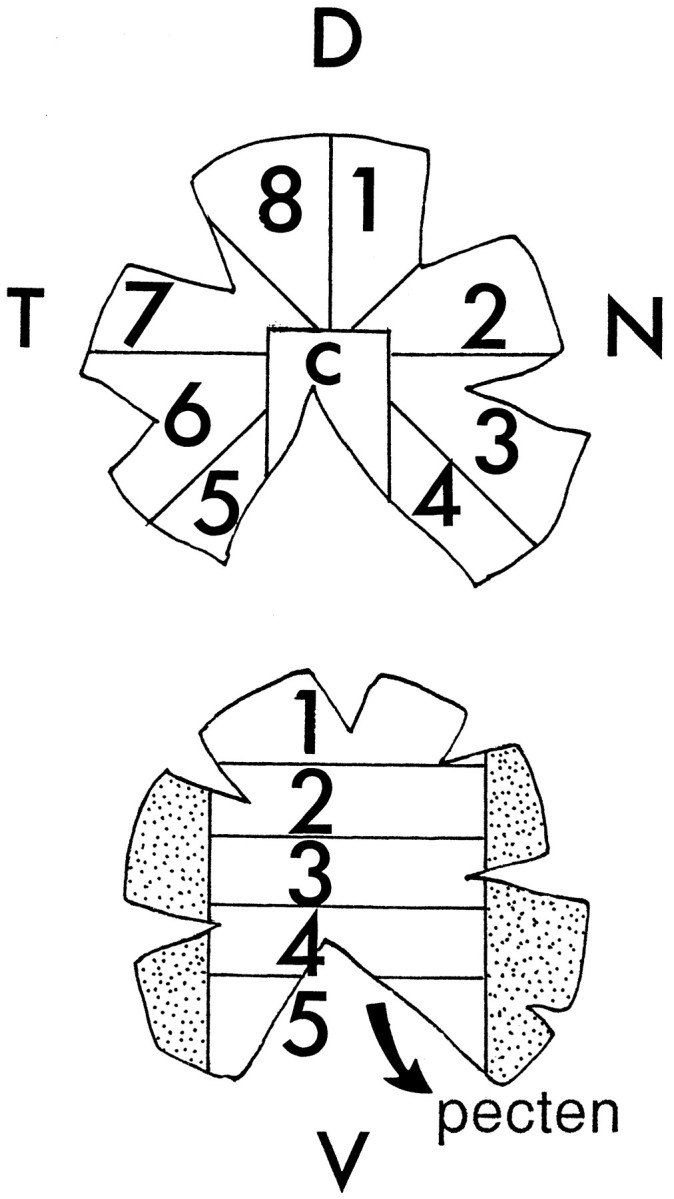
Dissections of chick retinas. Embryonic retinas were spread onto nitrocellulose filters and cut circumferentially into eight sectors and a central field [top drawing: sectors1–4, nasal (N);5–8, temporal (T);7, 8, 1, 2, dorsal (D);3–6, ventral; c, central]. For the investigation of dorsal–ventral differences of enzyme activities, the tissue was cut into five slices as shown in the bottom drawing. The pecten was removed first and assayed separately.
For the determination of retinoid content, the eye cups were cut either into dorsal and ventral halves (E4) or into three parts from dorsal to ventral (E5–E18), of which the middle thirds were discarded. Retinas, which included the retinal pigment epithelium at later stages (>E12), were dissected from the eyecups. Samples collected from 6 (E18) to 40 (E4) eyes were sonicated in 50–100 μl homogenizing buffer without protease inhibitors and stored at −20°C in darkness.
Isoelectric focusing (IEF) and immunoblotting. To normalize the samples for protein content, 2 μl of homogenates were diluted 1:1000 in 10 mm PB, and the protein concentrations were determined with the Micro BCA protein assay reagent kit (Pierce, Rockford, IL). Sample volumes were adjusted for equal amounts of protein per lane. IEF was performed in an Isobox IEF apparatus (Hoefer Scientific, San Francisco, CA) with commercially obtained agarose gels (100 mm × 142 mm × 1 mm, pH 3–10; Isolab, Akron, OH), following the protocol recommended by the manufacturer. To mark pH positions in the gel, a combination of marker proteins with isoelectric points pI 3.6, 4.6, 5.1, 6.6, 6.8, 7.2, 8.2, 8.6, and 8.8 (all from Sigma) was loaded at 12 μg of protein each. Lanes with pI markers were fixed and stained with Coomassie G250.
For immunological detection, the separated proteins were transferred onto a nitrocellulose membrane by means of a simple capillary blotting technique. The nitrocellulose membrane, soaked in 0.1 mPBS, was pressed against the gel, covered with filter paper (Whatman), a stack of paper towels, and a 50 gm weight. Blotting lasted for 1 hr at room temperature, which allowed for complete transfer of proteins. Then the membrane was washed with distilled water to remove ampholytes, and protein bands were stained with Ponceau-S (Sigma P7767). After removal of the Ponceau-S solution with 3 × 5 min washes in 0.1m PB, blots were processed for immunological detection. Blocking of nonspecific binding was performed overnight with 20% neonatal calf serum (NCS) at 4°C. This step was followed directly by incubation of the blot for 2 hr at room temperature with a rabbit polyclonal antiserum against class-1 aldehyde dehydrogenase (a gift from R. Lindahl) diluted 1:3000 in 20% NCS/0.1 m PB blocking solution. After the first antiserum was washed off, a goat anti-rabbit IgG second antiserum, conjugated to alkaline phosphatase (Sigma, A9919) and diluted 1:2000 in blocking solution, was applied for 2 hr at room temperature. After several washing steps, the blot was immersed in buffer for the phosphatase reaction, which contained 5.84 gm/l NaCl, 12.14 gm/l Tris base, and 1.02 gm/l MgCl2, and was adjusted to pH 9.2 with HCl. To visualize alkaline phosphatase activity, blots were developed for 5–30 min with 30 ml of this buffer, 99 μl of 5-bromo-4-chloro-3-indoly phosphate, 50 mg/ml (Sigma, B8503; dissolved in dimethyl formamide), and 198 μl of nitro blue tetrazolium, 80 mg/ml (Sigma, N6876; a 70% solution in dimethyl formamide).
Zymography assay. RA-synthesizing activities were detected, as described previously, with an assay based on an RA-responsive reporter cell line (Wagner et al., 1992; McCaffery et al., 1993). The reporter cell line, a gift from M. Wagner and T. Jessell, consists of F9 teratocarcinoma cells transfected with the β-galactosidase gene under control of the RA-responsive element from the RA receptor β (RARβ) (Wagner et al., 1992). Tests of the reporter cells with RA stereoisomers show them to be most sensitive to all-transRA, with a detection threshold of 10−12m. For 13-cis RA ∼100-fold higher concentrations and for 9-cis RA ∼300-fold higher concentrations are necessary to match the color reaction elicited by all-trans RA (McCaffery and Dräger, 1994a). The cells were grown in CO2-buffered L15 tissue culture medium (Specialty Media) supplemented with 20% fetal calf serum, penicillin/streptomycin (Sigma, P3539), and 0.8 gm/l Geneticin (Life Technologies, Gaithersburg, MD). After separation of retina proteins by IEF, the gel lanes were sectioned into consecutive slices with a cutting device consisting of 40 Exacto blades mounted on two threaded shafts and spaced 1.8 mm apart. The slices were distributed into 96-well plates that contained 50 μl of L15 medium with 0.6 mg/ml dithiothreitol per well. Then another 50 μl of L15 containing 1.6 mg/ml NAD+ (Sigma) and 1.25 × 10⁻⁷m all-transretinaldehyde (a gift from Hoffmann LaRoche) was added to each well. The plates were incubated for 3 hr at 37°C for RA synthesis. After the enzyme reaction, 25 μl of the medium samples from each well was transferred into 96-well plates with confluent cultures of RA reporter cells and 75 μl/well of L15 medium. Detection of RA by the reporter cells indicated the presence of RA-synthesizing enzymes in the IEF fractions in these wells.
RA bioassay. For the RA assay, reporter cells were plated into gelatin-coated 96-well microtiter plates, grown to confluency, and cultured for ∼12 hr with samples diluted in L15 medium. To visualize the induction of β-galactosidase, the cells were fixed with 1% glutaraldehyde, washed thoroughly with 0.1 m PBS, and incubated for 3–8 hr at 37°C with 45 μl/well of 0.1 mPBS containing 3.3 mm K4Fe(CN)6 × 3 H2O, 3.3 mm K3Fe(CN)6× 3 H2O, 6 mm MgCl2, and 2 mg/ml 5-bromo-4-chloro-3-indoyl-β-d-galactopyranoside (dissolved in dimethyl formamide as 40 mg/ml aliquots). The intensity of the blue reaction product was measured with an ELISA reader (Fisher Biotech BT100) at 630 nm.
HPLC. To detect retinoids in addition to all-trans RA and to distinguish between different RA isomers, we measured retinoids by HPLC. All procedures were performed under amber light. After the tissues were sonicated in 0.7 ml hypotonic buffer (10 mm PB, pH 7.2, 30 mm NaCl), the homogenates were suspended in 5 ml of 0.05 m KOH/50% ethanol plus 0.1% butylated hydroxytoluene (BHT) antioxidant and extracted with 10 ml hexane. This extract containing many lipids was discarded. The remaining aqueous phase was acidified with 500 μl of 4N HCl and extracted four times with 5 ml hexane/0.1% BHT; the extracts were pooled in 50 ml polypropylene centrifuge tubes, evaporated under N2, and reconstituted with 4× 300 μl hexane to be transferred into 2 ml vials. The hexane was again evaporated, and the samples were reconstituted in 50–100 μl of mobile phase for HPLC injection.
Reverse-phase (RP)-HPLC analysis was performed on a C18 column (Spherisorb ODS2, 15 cm × 4.6 mm, 3 μm, 100 Å, with additional C18 guard column; Keystone), using a mobile phase of 75% methanol/25% 40 mm ammonium acetate. The composition of the mobile phase changed in 20 min in a linear gradient to 100% methanol at a flow rate of 1 ml/min. Retinoids were detected at 340 nm. The identification of the synthesized substance as all-trans RA was based on its retention time, and this was confirmed by a normal phase, isocratic HPLC protocol using a polyvinyl alcohol-bonded silica column (25 cm × 0.6 mm, 5 μm, 100 Å), with a mobile phase consisting of 5% dioxane and 95% hexane. For normal-phase chromatography the flow rate was 2 ml/min. In addition, 200 μl fractions of the RP-HPLC eluate was collected every 0.2 min and tested for biological activity with the reporter cells. For this procedure, 4 μl of each fraction was diluted to 5% in L15 medium and incubated with the reporter cells overnight at 37°C, 5% CO2. Processing of the reporter cells was performed as for the enzyme assay described above.
RESULTS
RA-synthesizing enzymes
Characterization of spatial and temporal expression of RA synthesizing activities
For an investigation of the spatial distributions of RA-producing enzymes, embryonic chick retinas were dissected either into circumferential sectors or into consecutive slices from dorsal to ventral, as sketched in Figure 1. Crude cytosolic fractions were prepared from the tissues, adjusted to equal protein content, and separated by IEF, and the charge-separated protein fractions were tested for the capacity to convert all-transretinaldehyde into RA in the presence of NAD+. Four enzyme activity peaks with distinct isoelectric points were detected in the retina homogenates, all of which had characteristic spatial distributions, as illustrated for the E16 retina in Figure2.
Fig. 2.
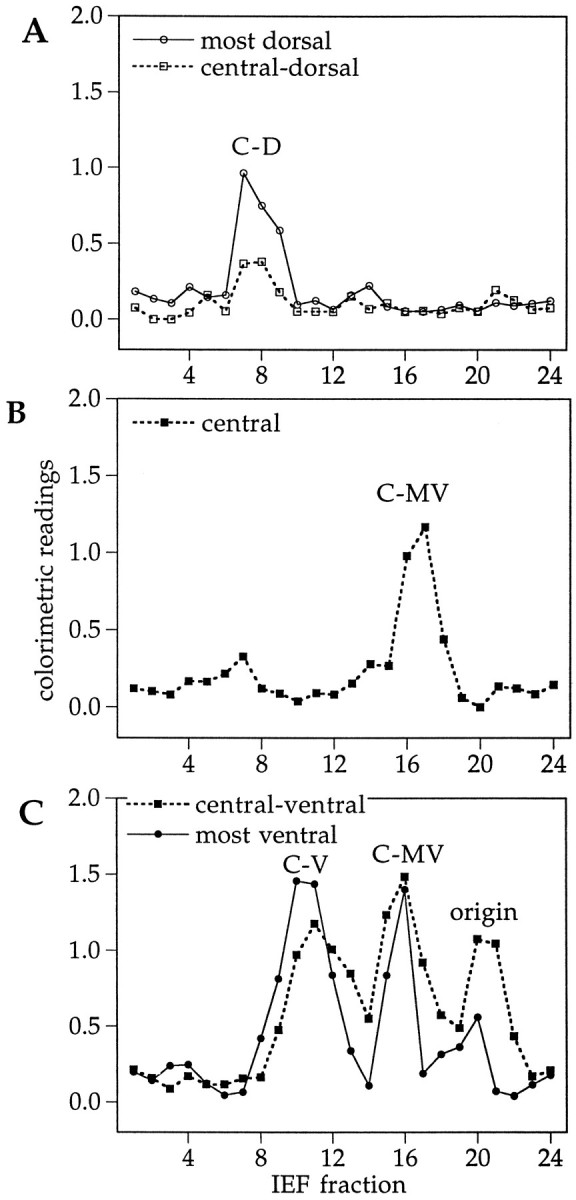
Distribution of different RA-producing activities along the dorsoventral axis of the retina. Two E16 retinas were cut into slices from dorsal to ventral as shown in Figure 1(bottom). Tissue samples were homogenized, their soluble proteins separated by native IEF, and the charge-separated fractions, plotted along the abscissa, were tested for RA synthesis. The bioassay with the RA-sensitive reporter cells provided a semiquantitative indicator of enzymatic activity, measured as colorimetric readings plotted along the y-axis. A, Zymograph for the dorsal retina; B, zymograph for the central retina; C, zymograph for the ventral retina, which at E16 contained traces of pigment epithelium. The pH gradient along the abscissa extended from basic on the left side to acidic fractions on the right side. The point of sample application corresponded to fraction number 21. The enzyme activity peaks, as described in the text, are marked as C-D(chick dorsal), C-MV (chick medioventral),C-V (chick ventral), and origin (the gel loading site).
The most basic of the activities, with a pI of 6.4–6.7, was restricted to the dorsal third of the retina (Fig. 2A, labeledC-D for “chick dorsal”). A different activity peak, with a slightly more acidic pI of 5.9–6.3, was present in the ventral third (Fig. 2C, labeled C-V for “chick ventral”), and a third, even more acidic enzyme activity with pI 5.2–5.5 was found in the middle and ventral half of the retina (Fig.2B,C, labeled C-MV for “chick medioventral”). Assays of other ocular tissues (not shown) revealed an activity with properties indistinguishable from C-MV as the only RA-generating enzyme detectable in the retinal pigment epithelium. In several homogenates from the ventral retina, a fraction of catalytic activity remained at or close to the point of sample application in the gel, corresponding to a pI of 4.8–5.1 in the IEF gels used (Fig.2C, origin). The size of this origin peak varied between different preparations, indicating that it may not represent a single independent enzyme but a mixture of enzymes, and mostly C-V activity, partially trapped in membrane vesicles, precipitated at the gel loading site. The spatial distributions of the enzyme activities were analyzed throughout embryonic development from E4, the earliest stage during which dorsoventral dissections with sufficient tissue yield could be performed, until E19, when most processes of eye development are completed. The dorsoventral expression pattern of the four activity peaks remained similar throughout development, as illustrated for E4, E8, and E12 in Figure3.
Fig. 3.

RA-producing activities during development. Enzyme activities in IEF fractions from dorsal and ventral retinas of three embryonic stages: E4, E8, and E12. Together with the E16 data shown in Figure 1, these assays on ages that cover practically the entire period of embryonic development in the chick illustrate a constant enzyme pattern.
For an estimate of the developmental changes in overall enzyme activity, whole retina homogenates of different ages were normalized for protein content and tested with the RA reporter cells for RA production from 10−7m retinaldehyde in the presence of 1.2 mm NAD+ (Fig.4). Under these conditions the colorimetric readings measured in the reporter cells fell by approximately two-thirds between E4 and E18. Taking into account the dose–response characteristics of the reporter cells (Wagner et al., 1992; McCaffery et al., 1993), this response decline corresponds roughly to a >10-fold decrease in RA production between the early and late embryonic retinas. For the most part, the decline was attributable to a decreasing enzyme activity in the ventral retina.
Fig. 4.

Developmental changes in RA synthesis in ventral and dorsal compartments of the eye. Retinal homogenates at concentrations of 15 μg protein per assay were incubated with 10−7m all-transretinaldehyde and 2.2 mm NAD+ as coenzyme. Catalytic activity in the homogenates was detected through accumulation of RA measured with the reporter cells. In addition to the data shown here, tests were performed with concentrations of 10−8, 10−9, and 10−10m retinaldehyde and without substrate. Error bars indicate SEM.
Distribution of class-1 aldehyde dehydrogenase immunoreactivity
As in the mouse retina, the dorsal retinal enzyme in chick has been identified as a class-1 aldehyde dehydrogenase (Godbout et al., 1996). Because we had observed that an antiserum raised against class-1 aldehyde dehydrogenase of the rat (Lindahl et al., 1983) cross-reacts with the corresponding chick enzyme, we probed retina sectors, as sketched in Figure 1, by immunoblotting. Expression of the chick class-1 dehydrogenase was restricted to the dorsal third of the retina, with even distribution across the temporonasal axis (Fig.5A). Consistent with the functional assays described above, the enzyme was detected at all embryonic stages tested, from E4 to E18, and the dorsal–ventral distribution did not change during development (Fig.5B,C).
Fig. 5.

Spatial distribution of chick class-1 aldehyde dehydrogenase during embryonic development. A, E8 retinas were cut circumferentially as shown in Figure 1. Homogenates from these tissues were subjected to IEF and blotted onto nitrocellulose membranes. Immunostaining with antibodies against the rodent class-1 aldehyde dehydrogenase (arrow) revealed that a chick equivalent to this enzyme was restricted to the dorsal third of the retina. Similar results were obtained for E14 and E16. In agreement with the scheme in Figure 1, lanes are marked asC, central retina; 1, 8, dorsal (D); 2, 3, nasal; 4, 5, ventral (V); 6, 7, temporal. B, C, Immunoblots of dorsal and ventral retina thirds demonstrate that the class-1 aldehyde dehydrogenase remained confined to the dorsal retina throughout development. B, Blots of embryonic stages E4, E6, E8;C, stages E10, E12, E14, and E16.
Effect of substrate concentration on RA synthesis
When RA synthesis was measured with the reporter cells as a function of different substrate concentrations, the colorimetric readings of the ventral extracts exceeded the dorsal activity at the lower retinaldehyde concentration from 10−11 to 10−7m (Fig.6). The ventral activity peaked at 10−7m retinaldehyde and decreased at higher substrate concentrations. The dorsal activity was relatively more tolerant of high retinaldehyde concentrations: it reached a maximum at a concentration of 10−6mand then declined. The decreasing RA production by ventral homogenates at 10−6 and 10−5mretinaldehyde suggested that one or more of the ventral enzymes were inhibited at high substrate levels, and the decline of both ventral and dorsal activities at very high retinaldehyde was probably caused by an inhibition of the reporter cell response to the high retinaldehyde concentration. The observation of higher ventral than dorsal activity at low substrate concentrations, and of substrate inhibition of synthesis at higher retinaldehyde levels, did not change with development, indicating that these are constant enzymatic features.
Fig. 6.

Effect of substrate concentration on RA synthesis. RA synthesis in dorsal and ventral retina homogenates at increasing concentrations of the substrate all-trans retinaldehyde. The reporter cell response to the respective retinaldehyde concentration in the absence of homogenate was subtracted before the data were plotted. All reactions were performed in vitroin the presence of 1.2 mm NAD+. Data from various embryonic stages were pooled. Error bars indicate SEM.
Distribution of RA
The expression of different RA-synthesizing enzymes in dorsal and ventral embryonic retina is likely to create a dorsoventral difference in enzyme products. To investigate the nature and magnitude of such a difference, we analyzed dorsal and ventral thirds of embryonic retinas for endogenous retinoid content by HPLC. Fractions eluting from the HPLC column were then collected and tested with the RA reporter cells. In this way the high sensitivity of the bioassay could be combined with the advantage of HPLC as an analytic technique.
RA detection by HPLC
RP-HPLC allowed us to separate retinaldehyde from RA and various isomers of these substances (Fig.7A). The limit of the photometric detection was below 5 pmol, but the reporter cells were so sensitive that significant biological activity could still be detected when samples of the HPLC fractions containing all-trans RA amounts near the threshold for HPLC detection were diluted 50-fold. HPLC–bioassay analyses were performed with hexane extracts from dorsal and ventral retinas of embryonic stages E4, E5, E8, E9, E10, E12, E14, and E16, and examples of chromatograms for E4, E9, and E14 are shown in Figure 8. In all samples, a peak with the retention time of all-trans RA was detected (peak5 in Fig. 7A and peak a in Fig.7B,C), but no traces of 13-cis RA or 9-cis RA. When extractions were performed in a way to include retinaldehyde, this compound was also detected (peak6 in Fig. 7A). The peak b prominent in the HPLC traces did not comigrate with any retinoid standard; it did not activate transcription, but it was toxic to the reporter cells (Fig.8). Its identity is not clear.
Fig. 7.

HPLC assays of the embryonic chick retina. Hexane extracts of retina homogenates were separated by RP-HPLC, and absorbance was monitored at 340 nm. A, Retinoid standards were separated by this method. Peak 1corresponds to 4 ng 4-oxo-all-trans RA; peak2 represents 9 ng 13-dimethyl RA; peak 3represents 6 ng 3,4-didehydro RA; peak 4 represents 10 pmol 9-cis RA; peak 5 represents 10 pmol all-trans RA; and peak 6 represents 10 pmol all-trans retinaldehyde. Not shown is 13-cis RA, which had a retention time between peaks3 and 4. Other isomers of retinaldehyde eluted shortly before all-trans retinaldehyde but did not separate from each other. The range of absorbance was 0.005 AU.B, Chromatograms from extracts of dorsal (top trace) and ventral (bottom trace) retinas at embryonic stage E8. Peak a had the same retention time as all-trans RA; it was much larger in the extracts from ventral retina. Peak b did not comigrate with any of the standards used. It is marked here because it represents a prominent toxic peak in the reporter cell assays (see Fig. 8) that was useful as internal standard; its identity is not known. Absorbance range was 0.01. C, Separation of dorsal and ventral retina extracts from combined E10 and E14 retinas. At these ages the peak with retention time corresponding to all-trans RA (a) was larger in the dorsal extracts (top trace). Absorbance range was 0.005. In addition to the changing patterns in the expression of retinoids between E4 and E10, the different absorbance ranges and variations in the extraction procedures account for the differences between chromatograms in Band C.
Fig. 8.
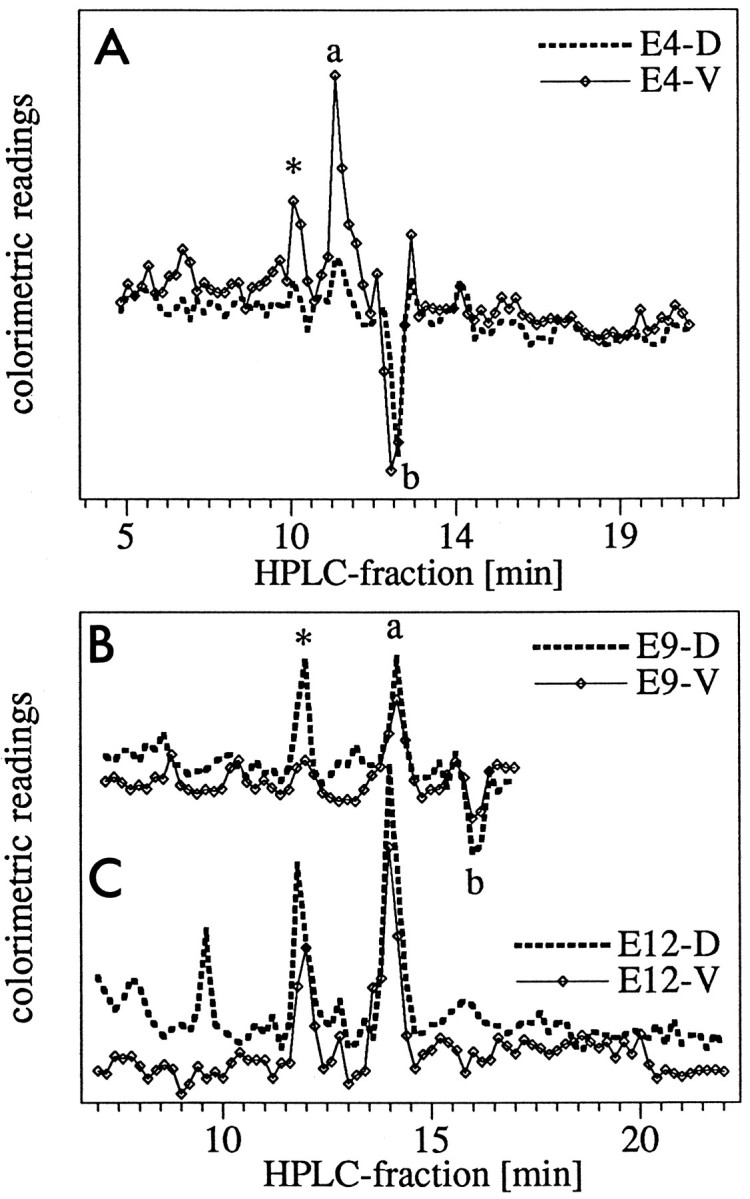
RA activity in HPLC fractions. To test the biological activity of the chromatographic peaks, HPLC fractions of 200 μl were collected, diluted 1:50 in cell culture medium, and applied to the RA-sensitive reporter cells. Relative activity, measured as colorimetric readings of the reporter cells, is plotted against the chromatographic fractions, which are separated by 12 sec.D, Dorsal; V, ventral. A, Activity plots of HPLC fractions from E4 retina extracts;B, activities in E9 retinas; C, activities in E12 retinas. Each data point represents the mean value from three independent experiments. The positive peak (markeda) corresponded to the retention time of all-trans RA, also marked as a in the HPLC traces in Figure 7B. The negative peak (markedb) indicates an unidentified compound that had a toxic effect on the reporter cells. This activity was contained in the peaks designated as b in Figure 7B,C. Why theb peak was not toxic in 8C is not known. At E4 the ventral retina showed a much higher all-transRA activity than the dorsal retina, and at the two later ages, the all-trans RA activity was slightly stronger in the dorsal than in the ventral samples. A second peak of biological activity (marked *) was detected at all ages tested in fractions 11.6–12.2; it could not be correlated with a chromatographic peak. The spatial distribution of this component followed the developmental pattern of all-trans RA. In the E12 dorsal sample, a third peak of unidentified biological activity was apparent.
Comparisons of dorsal and ventral retina thirds revealed a changing pattern of RA distribution. At E4 and E5, the ventral retina fractions contained higher amounts of all-trans RA than the dorsal samples (Fig. 7B). In E8 retinas the RA peaks of dorsal and ventral retinas were equal, and in all older preparations the dorsal RA component slightly exceeded the ventral one (Fig. 7C). The identity of the major RA species in the embryonic chick retina as all-trans RA was corroborated by analyzing retinal extracts with normal-phase HPLC in parallel experiments (not shown).
Reporter-cell analysis of HPLC fractions
The chromatographic results were confirmed by testing the HPLC fractions with the reporter cells, which are preferentially activated by all-trans RA (Wagner et al., 1992). The HPLC peak with retention time of all-trans RA exhibited biological activity, and the magnitude of this activity correlated with the size of the HPLC peak. Consistent with the chromatographic analysis, the RA activity detected by the reporter cells was higher in ventral retina fractions at E4 and E5, and the pattern changed at later ages (Fig.8).
In addition to the activity maximum associated with the retention time of all-trans RA (marked by a in Fig. 8), we detected a second substance that activated the RA reporter construct (marked by asterisk) and exhibited the same dorsal–ventral pattern as all-trans RA: it was higher ventrally than dorsally at E4 but reversed to a dorsal > ventral difference at stages E9 and older. This peak could not be identified with any of the retinoid standards available to us, namely 9-cis RA, 13-cis RA, three isomers of retinaldehyde, 3,4-didehydro RA, 4-oxo-all-trans RA, and 1,3-dimethyl RA. As judged by its retention time, it was slightly more polar than 3,4-didehydro RA. In addition, in several preparations the RA reporter cells revealed very high biological activity in extracts from an HPLC fraction with a very short retention time, indicating a polar substance. This component, which was not 4-oxo-all-trans RA, also could not yet be identified, but it may be a product of oxidative RA degradation.
In addition to the evaluation of peak areas from chromatograms for RA activity with the reporter cells, we tested crude homogenates of dorsal and ventral retina samples, normalized for protein content. Like the isolated fractions, the total homogenates showed an early ventral > dorsal RA difference, and at later stages the dorsal retina contained higher activity (not shown).
DISCUSSION
RA-producing enzymes
Retina samples of the embryonic chick were found to contain three distinct RA-generating enzyme activities, as detected with an RA-responsive reporter cell line in charge-separated protein fractions probed for catalytic activities. Expression of the three activities was segregated along the dorsoventral retinal axis. The first enzyme, characterized as a cytosolic class-1 aldehyde dehydrogenase by its immunoreactivity, was found only in the dorsal third of the retina (C-D). It was characterized by a neutral to slightly basic pI in IEF gels. Its distribution confirms a previous report that a class-1 aldehyde dehydrogenase is expressed in the dorsal third of the embryonic chick retina (Godbout et al., 1996), and it agrees with findings of the aldehyde dehydrogenase AHD2 in the dorsal retina of mice (McCaffery et al., 1991). The second aldehyde dehydrogenase was detected in samples containing the middle and ventral retina (C-MV); it has an acidic pI. The C-MV enzyme was indistinguishable from the only RA-generating enzyme detectable in the pigment epithelium. It is likely to represent the chick homolog to the murine V2/RALDH2 dehydrogenase, the major and most effective RA-generating enzyme in the mouse (Zhao et al., 1996; Niederreither et al., 1997). In the mouse eye, V2/RALDH2 is expressed in the pigment epithelium and not the neural retina, but it is often present in ventral retina samples, which include the optic fissure. Biochemical detection of the C-MV enzyme in chick retina samples, as for V2/RALDH2, is likely to reflect some adherence of pigment epithelium to neural retina and inclusion in the samples of the transition zone between retina and pigment epithelium at the optic fissure. The third enzyme activity with a slightly acidic pI was restricted to the ventral third of the retina (C-V). Like the murine V1 enzyme expressed in ventral retina (McCaffery et al., 1992), the C-V activity represents the main source of RA production in the neural retina at early developmental stages. Apart from a relative decline of activities in the ventral retinal homogenates, the enzyme patterns did not change during embryonic development of the chick from stages E4 to E18. Overall, the spatial and temporal distributions of RA-generating enzymes in the chick were found to be similar to those in the mouse (McCaffery et al., 1993).
Differences in all-trans RA
The similarity in enzyme patterns between chick and mouse makes it likely that the functional consequence of the arrangement is similar between the two species. A main motivation for the present analysis was the question of whether the different RA-producing enzymes differ in generation of RA isomers, an obvious possibility suggested, among others, by observations on RXR knock-out mice that show ventral retina defects (Kastner et al., 1994). The main retinoid activating the RXR is 9-cis RA, but RXR can also act in a ligand-independent fashion (Mangelsdorf and Evans, 1995). Fractions of retinas of different ages were dissected from retinal regions defined by the enzyme pattern and analyzed for retinoid content by HPLC. Endogenous retinoids were compared with standards of 4-oxo, 13-cis, 9-cis, and all-trans RA. The most important result from the present analysis is that the enzymes do not differ in production of the major RA isomers: the main RA isomer generated in both dorsal and ventral embryonic retina was found to be all-trans RA, and no 9-cis RA was detected. In addition, however, the HPLC fractions contained other, unidentified bioactive components that may be produced by the different retinaldehyde oxidizing enzymes.
The relative all-trans RA content of dorsal and ventral retina fractions changed with developmental age. During early stages of embryonic development (E4, E5), the ventral retina contained higher all-trans RA concentrations, as detected both by HPLC and with the reporter cells. At later stages, however, the distribution switched around: after E9, all-trans RA was higher in the dorsal than in the ventral retina. The ventrodorsal shift in RA levels was not as obvious in the levels of RA-generating enzymes, which seemed to undergo fewer changes with developmental age. This might be attributable to changing levels of retinaldehyde with age, which could not be assayed in the small samples tested; retinaldehyde levels affect the relative enzyme activities (Fig. 5). Other factors, which were not assayed for and which might influence the relative retinoid content, are axially segregated expression patterns of RA binding proteins (Boylan and Gudas, 1992; McCaffery et al., 1993; Fiorella and Napoli, 1994). The ventrodorsal switch in the all-trans RA maximum in the chick retina is similar to the mouse, except that in the mouse the switch occurs in the first postnatal week (McCaffery et al., 1993). This difference is likely attributable to the different schedules of visual maturation: chickens are precocial birds, with a fully functional visual system at hatching, but mice do not open their eyes until the end of the second postnatal week. Thus the reversal in retinal RA distribution represents a homology of growth processes in mammals and birds.
Other biologically active retinoids
When HPLC fractions of retina extracts were tested with the reporter cells, at least one other substance was detected that activated the RARβ response element driving the reporter gene. This bioactive molecule, which was more polar than 13-cis RA and less polar than 4-oxo-all-trans RA, showed a spatiotemporal distribution similar to all-trans RA, suggesting that it might be a metabolite of this isomer. In the E4 chick retina it was higher ventrally than dorsally, and at E9 and in older retinas it showed a higher dorsal concentration. Evidence points to a physiological involvement of other retinoids in addition to all-trans RA in eye development: in tests on dissociated neurons, retinol, which remained unmetabolized except for the formation of a small quantity of retinyl acetate, proved to be most effective in promoting the survival and differentiation of chick photoreceptors, more so than RA (Stenkamp et al., 1993).
What is the relevance of different RA-producing enzymes?
The spatial expression pattern of different aldehyde dehydrogenases is highly conserved among vertebrates, and also the particular characteristics of the enzymes are similar (Dräger and McCaffery, 1997). The enzyme in dorsal retina has a broad substrate selectivity for different aldehydes, including retinaldehyde; it is highly sensitive to oxidation, and it acts as a binding protein for steroids (Pereira et al., 1991) and thyroid hormone (Yamauchi and Tata, 1994). Although the enzyme in ventral retina is much more selective for retinaldehyde than the dorsal enzyme, it also oxidizes some other substrates: in the embryonic mouse, the two enzymes oxidize γ-aminobutyraldehyde to GABA, creating a ventrodorsal GABA gradient in the embryonic retina (Eliasson et al., 1997). The ventral enzyme is much more effective in RA production than the dorsal enzyme. In the embryonic mouse retina, the dorsal AHD2 dehydrogenase is present in at least 1000-fold higher protein concentrations than the ventral dehydrogenase (McCaffery and Dräger,1993), but RA levels are higher ventrally than dorsally. The present study represents the first determination of RA isomers in spatially defined regions of the retina. It seems plausible that a similar all-trans RA distribution is present in the embryonic mouse retina, which contains overall high all-trans RA levels (McCaffery et al., 1993). Retinas of some other embryonic vertebrates, however, may contain a range of different RA isomers, because measurements on nonocular tissue samples show differences in composition of retinoid isomers between different species (Schuh et al., 1993; Costaridis et al., 1996). The dorsoventral arrangement of different aldehyde dehydrogenases is probably more conserved than the use of particular retinoid species.
As one of the consequences of the enzyme arrangement, we have shown here a dorsoventral differential in all-trans RA levels. Because RA gradients can be generated, however, by expression of different levels of a single aldehyde dehydrogenase, there must be additional reasons for the conserved use of distinct enzymes (Dräger and McCaffery, 1997). One of the possible explanations may be that the regulation of two genes provides a more precise tool for creating spatiotemporal RA gradients than can be achieved with one enzyme. Another explanation may be linked to a possible role in protein translation: a range of different NAD+-using enzymes has been shown to influence protein translation by interacting with RNA through the coenzyme binding site (Hentze, 1994). Because protein levels of the dorsal aldehyde dehydrogenase exceed ventral enzyme levels by several orders of magnitude, the enzyme arrangement could create a dorsoventral differential in translational control. The possibility of a differential post-translational regulation in aldehyde dehydrogenase activities is provided by the low threshold of the dorsal enzyme for reversible oxidation (McCaffery and Dräger, 1994b), which in other systems has been linked to a redox regulation of enzyme activities (Brigelius, 1985). Finally, in addition to synthesizing the ligand for the RA receptors, the aldehyde dehydrogenases may influence gene transcription by mediating cross-talk with other members of the nuclear receptor family through local accumulation of their ligands. The thyroid hormone affinity of the dorsal class-1 aldehyde dehydrogenase (Yamauchi and Tata, 1994) is likely to cause higher triiodothyronine (T3) levels in dorsal retina. This assumption is consistent with the observation that T3, in addition to RA, is required for differentiation of cone photoreceptors (Kelley et al., 1995) and that the spatial distribution of cones follows the pattern of the two enzymes in the mouse (Szél et al., 1992). A higher thyroid hormone concentration in dorsal retina may result in a dorsoventral asymmetry in levels of free RXR, the heterodimeric partner for several different types of nuclear receptors, including receptors for all-trans RA and thyroid hormone (Mangelsdorf and Evans, 1995). Differences in levels of available RXR will result in differential activation of gene transcription mediated by a range of nuclear receptors.
Footnotes
This work was supported by a fellowship from the Deutsche Forschungsgemeinschaft (J.M.) and Grant EY01938 from the National Eye Institute (U.D.). We thank Dr. Michael Wagner for the RA reporter cells, Dr. Joseph Grippo at Hoffman-LaRoche for the all-trans and 9-cis RA retinoid standards, Dr. Y. Fulmer Shealy at the Southern Research Institute for 4-oxo RA and 3,4 didehydro RA, and Dr. W. Lambert, University of Ghent, Belgium, for all-trans 13-demethyl RA.
Correspondence should be addressed to Ursula Dräger, E. Kennedy Shriver Center, 200 Trapolo Road, Waltham MA 02254.
Dr. Mey’s present address: Institut für Biologie II, Rheinisch Westfaelische Technische Hochschule, D-52056 Aachen, Germany.
REFERENCES
- 1.Blumberg B, Bolado J, Jr, Derguini F, Craig AG, Moreno TA, Chakravarti D, Heyman RA, Buck J, Evans RM. Novel retinoic acid receptor ligands in Xenopus embryos. Proc Natl Acad Sci USA. 1996;93:4873–4878. doi: 10.1073/pnas.93.10.4873. [DOI] [PMC free article] [PubMed] [Google Scholar]
- 2.Boncinelli E, Simeone F, Acampora D, Mavilio F. Hox gene activation by retinoic acid. Trends Genet. 1991;7:329–334. doi: 10.1016/0168-9525(91)90423-n. [DOI] [PubMed] [Google Scholar]
- 3.Bonhoeffer F, Gierer A. How do retinal axons find their targets on the tectum? Trends Neurosci. 1994;7:378–381. [Google Scholar]
- 4.Boylan JF, Gudas LJ. The level of CRABP-I expression influences the amounts and types of all-trans-retinoic acid metabolites in F9 teratocarcinoma stem cell. J Biol Chem. 1992;267:21486–21491. [PubMed] [Google Scholar]
- 5.Brigelius R. Mixed disulfides: biological functions and increase in oxidative stress. In: Sies H, editor. Oxidative stress. Academic; London: 1985. pp. 243–272. [Google Scholar]
- 6.Cheng H-J, Nakamoto M, Bergemann AD, Flanagan J. Complementary gradients in expression and binding of ELF-1 and Mek4 in development of the topographic retinotectal projection map. Cell. 1995;82:371–381. doi: 10.1016/0092-8674(95)90426-3. [DOI] [PubMed] [Google Scholar]
- 7.Costaridis P, Horton C, Zeitlinger J, Holder N, Maden M. Endogenous retinoids in the zebrafish embryo and adult. Dev Dyn. 1996;205:41–51. doi: 10.1002/(SICI)1097-0177(199601)205:1<41::AID-AJA4>3.0.CO;2-5. [DOI] [PubMed] [Google Scholar]
- 8.Dollé P, Ruberte E, Leroy P, Morriss-Kay G, Chambon P. Retinoic acid receptors and cellular retinoic binding proteins. I. A systematic study of their differential pattern of transcription during mouse organogenesis. Development. 1990;110:1133–1151. doi: 10.1242/dev.110.4.1133. [DOI] [PubMed] [Google Scholar]
- 9.Dollé P, Fraulob Y, Kastner P, Chambon P. Developmental expression of murine retinoid X receptor (RXR) genes. Mech Dev. 1994;45:91–104. doi: 10.1016/0925-4773(94)90023-x. [DOI] [PubMed] [Google Scholar]
- 10.Dräger U, McCaffery P. Retinoic acid and development of the retina. Prog Ret Eye Res. 1997;16:323–346. [Google Scholar]
- 11.Drescher U, Kremoser C, Handwerker C, Löschinger J, Noda M, Bonhoeffer F. In vitro guidance of retinal ganglion cell axons by RAGS, a 25 kDa tectal protein related to ligands for Eph receptor tyrosine kinases. Cell. 1995;82:359–370. doi: 10.1016/0092-8674(95)90425-5. [DOI] [PubMed] [Google Scholar]
- 12.Eliasson M, McCaffery P, Baughman RW, Dräger UC. A ventro-dorsal GABA gradient in the embryonic retina prior to expression of GAD. Neuroscience. 1997;79:863–869. doi: 10.1016/s0306-4522(97)00032-8. [DOI] [PubMed] [Google Scholar]
- 13.Fiorella PD, Napoli JL. Microsomal retinoic acid metabolism. J Biol Chem. 1994;269:10538–10544. [PubMed] [Google Scholar]
- 14.Godbout R, Packer M, Poppema S, Dabbagh L. Localization of cytosolic aldehyde dehydrogenase in the developing chick retina: in situ hybridization and immunohistochemical analysis. Dev Dyn. 1996;205:319–331. doi: 10.1002/(SICI)1097-0177(199603)205:3<319::AID-AJA11>3.0.CO;2-#. [DOI] [PubMed] [Google Scholar]
- 15.Hamburger V, Hamilton HL. A series of normal stages in the development of the chick embryo. J Morphol. 1951;88:49–92. [PubMed] [Google Scholar]
- 16.Hentze MW. Enzymes as RNA-binding proteins: a role for (di)nucleotide-binding domains? Trends Biochem Sci. 1994;19:101–103. doi: 10.1016/0968-0004(94)90198-8. [DOI] [PubMed] [Google Scholar]
- 17.Holash JA, Pasquale EB. Polarized expression of the receptor protein kinase Cek5 in the developing avian visual system. Dev Biol. 1995;172:683–693. doi: 10.1006/dbio.1995.8039. [DOI] [PubMed] [Google Scholar]
- 18.Holash JA, Soans C, Chong LD, Shao H, Dixit YM, Pasquale EB. Reciprocal expression of the Eph receptor Cek5 and its ligand(s) in the early retina. Dev Biol. 1997;182:256–269. doi: 10.1006/dbio.1996.8496. [DOI] [PubMed] [Google Scholar]
- 19.Hyatt GA, Schmitt EA, Marsh-Armstrong N, McCaffery P, Dräger UC, Dowling JE. Retinoic acid establishes ventral retinal characteristics. Development. 1996;122:195–204. doi: 10.1242/dev.122.1.195. [DOI] [PubMed] [Google Scholar]
- 20.Kastner P, Grondona JM, Mark M, Gansmuller A, LeMeur M, Decimo D, Yonesch J-L, Dollé P, Chambon P. Genetic analysis of RXRα developmental function: convergence of RXR and RAR signaling pathways in heart and eye morphogenesis. Cell. 1994;78:987–1003. doi: 10.1016/0092-8674(94)90274-7. [DOI] [PubMed] [Google Scholar]
- 21.Kelley MW, Turner JK, Reh TA. Ligands of steroid/thyroid receptors induce cone photoreceptors in vertebrate retina. Development. 1995;121:3777–3785. doi: 10.1242/dev.121.11.3777. [DOI] [PubMed] [Google Scholar]
- 22.Kenny D, Bronner-Fraser M, Marcelle C. The receptor tyrosine kinase QEK5 mRNA is expressed in a gradient within the neural retina and the tectum. Dev Biol. 1995;172:708–716. doi: 10.1006/dbio.1995.8083. [DOI] [PubMed] [Google Scholar]
- 23.Lindahl R, Clark R, Evces S. Histochemical localization of aldehyde dehydrogenase during rat hepatocarcinogenesis. Cancer Res. 1983;43:5972–5977. [PubMed] [Google Scholar]
- 24.Mangelsdorf DJ, Evans RM. The RXR heterodimers and orphan receptors. Cell. 1995;83:841–850. doi: 10.1016/0092-8674(95)90200-7. [DOI] [PubMed] [Google Scholar]
- 25.Marcus RC, Gale NW, Morrison ME, Mason CA, Yancopoulos GD. Eph family receptors and their ligands distribute in opposing gradients in the developing mouse retina. Dev Biol. 1996;180:786–789. doi: 10.1006/dbio.1996.0347. [DOI] [PubMed] [Google Scholar]
- 26.Marsh-Armstrong N, McCaffery P, Gilbert W, Dowling JE, Dräger UC. Retinoic acid is necessary for development of the ventral retina in zebrafish. Proc Natl Acad Sci USA. 1994;91:7286–7290. doi: 10.1073/pnas.91.15.7286. [DOI] [PMC free article] [PubMed] [Google Scholar]
- 27.McCaffery P, Dräger UC. Retinoic acid synthesis in the developing retina. Adv Exp Med Biol. 1993;328:181–190. doi: 10.1007/978-1-4615-2904-0_20. [DOI] [PubMed] [Google Scholar]
- 28.McCaffery P, Dräger UC. Hotspots of retinoic acid synthesis in the developing spinal cord. Proc Natl Acad Sci USA. 1994a;91:7194–7197. doi: 10.1073/pnas.91.15.7194. [DOI] [PMC free article] [PubMed] [Google Scholar]
- 29.McCaffery P, Dräger UC. High levels of a retinoic-acid generating dehydrogenase in the meso-telencephalic dopamine system. Proc Natl Acad Sci USA. 1994b;91:7772–7776. doi: 10.1073/pnas.91.16.7772. [DOI] [PMC free article] [PubMed] [Google Scholar]
- 30.McCaffery P, Tempst P, Lara G, Dräger UC. Aldehyde dehydrogenase is a positional marker in the retina. Development. 1991;112:693–702. doi: 10.1242/dev.112.3.693. [DOI] [PubMed] [Google Scholar]
- 31.McCaffery P, Lee M-O, Wagner MA, Sladek NE, Dräger UC. Asymmetrical retinoic acid synthesis in the dorso-ventral axis of the retina. Development. 1992;115:371–382. doi: 10.1242/dev.115.2.371. [DOI] [PubMed] [Google Scholar]
- 32.McCaffery P, Posch KC, Napoli JL, Gudas L, Dräger UC. Changing patterns of the retinoic acid system in the developing retina. Dev Biol. 1993;158:390–399. doi: 10.1006/dbio.1993.1197. [DOI] [PubMed] [Google Scholar]
- 33.Mey J, Thanos S. Ontogenetic changes in the regenerative ability of chick retinal ganglion cells as revealed by organ explants. Cell Tissue Res. 1991;264:347–355. doi: 10.1007/BF00313973. [DOI] [PubMed] [Google Scholar]
- 34.Napoli JL. Retinol metabolism in LLC-PK1 cells. Characterization of retinoic acid synthesis by an established mammalian cell line. J Biol Chem. 1986;261:13592–13597. [PubMed] [Google Scholar]
- 35.Niederreither K, McCaffery P, Dräger UC, Chambon P, Dollé P. Restricted expression and retinoic acid-induced downregulation of the retinaldehyde dehydrogenase type 2 (RALDH-2) gene during mouse development. Mech Dev. 1997;62:67–78. doi: 10.1016/s0925-4773(96)00653-3. [DOI] [PubMed] [Google Scholar]
- 36.Pereira F, Rosenmann E, Nylen E, Kaufman M, Pinsky L, Wrogemann K. The 56 kDa androgen binding protein is an aldehyde dehydrogenase. Biochem Biophys Res Commun. 1991;175:831–838. doi: 10.1016/0006-291x(91)91640-x. [DOI] [PubMed] [Google Scholar]
- 37.Pijnappel WWM, Hendriks HFJ, Folkers GE, van den Brink CE, Dekker EJ, Edelenbosch C, van der Saag PT, Durston AJ. The retinoid ligand 4-oxo-retinoic acid is a highly active modulator of positional specification. Nature. 1993;366:340–344. doi: 10.1038/366340a0. [DOI] [PubMed] [Google Scholar]
- 38.Schuh TJ, Hall BL, Creech Kraft J, Privalsky ML, Kimelman D. v-erbA and citral reduce the teratogenic effects of all-trans retinoic acid and retinol, respectively, in Xenopus embryogenesis. Development. 1993;119:785–798. doi: 10.1242/dev.119.3.785. [DOI] [PubMed] [Google Scholar]
- 39.Simeone A, Acampora D, Arcioni L, Andrews PW, Boncinelli E, Mavilio F. Sequential activation of Hox2 homeobox genes by retinoic acid in human embryonal carcinoma cells. Nature. 1990;346:763–766. doi: 10.1038/346763a0. [DOI] [PubMed] [Google Scholar]
- 40.Stenkamp DL, Gregory JK, Adler R. Retinoid effects in purified cultures of chick embryo retina neurons and photoreceptors. Invest Ophthalmol Vis Sci. 1993;34:2425–2436. [PubMed] [Google Scholar]
- 41.Szél A, Röhlich P, Caffé AR, Juliusson B, Aguirre G, van Veen T. Unique topographic separation of two spectral classes of cones in the mouse retina. J Comp Neurol. 1992;325:327–342. doi: 10.1002/cne.903250302. [DOI] [PubMed] [Google Scholar]
- 42.Wagner M, Han B, Jessell TM. Regional differences in retinoid release from embryonic neural tissue detected by an in vitro reporter assay. Development. 1992;115:55–66. doi: 10.1242/dev.116.1.55. [DOI] [PubMed] [Google Scholar]
- 43.Yamauchi K, Tata JR. Purification and characterization of a cytosolic thyroid-hormone-binding protein (CTBP) in Xenopus liver. Eur J Biochem. 1994;225:1105–1112. doi: 10.1111/j.1432-1033.1994.1105b.x. [DOI] [PubMed] [Google Scholar]
- 44.Zhao D, McCaffery P, Ivins KJ, Neve RL, Hogan P, Chin WW, Dräger UC. Molecular identification of a major retinoic-acid synthesizing enzyme: a retinaldehyde-specific dehydrogenase. Eur J Biochem. 1996;240:15–22. doi: 10.1111/j.1432-1033.1996.0015h.x. [DOI] [PubMed] [Google Scholar]