

Abstract
Specific patterns of neural impulses regulate genes controlling nervous system development and plasticity, but it is not known how intracellular signaling cascades and transcriptional activation mechanisms can regulate specific genes in response to specific patterns of action potentials. Studies using electrical stimulation of mouse dorsal root ganglion neurons in culture show that the temporal dynamics of intracellular signaling pathways are an important factor. Expression of c-fos varied inversely with the interval between repeated bursts of action potentials. Transcription was not dependent on a large or sustained increase in intracellular Ca2+, and high Ca2+ levels separated by long interburst intervals (5 min) produced minimal increases in c-fos expression. Levels of the transcription factor cAMP-responsive element binding protein (CREB), phosphorylated at Ser-133, increased rapidly in response to brief action potential stimulation but remained at high levels several minutes after an action potential burst. These kinetics limited the fidelity with which P-CREB could follow different patterns of action potentials, and P-CREB levels were not well correlated withc-fos expression. The extracellular-regulated kinase (ERK) mitogen-activated protein kinases (MAPK) also were stimulated by action potentials of appropriate temporal patterns. Bursts of action potentials separated by long intervals (5 min) did not activate MAPK effectively, but they did increase CREB phosphorylation. This was a consequence of the more rapid dephosphorylation of MAPK in comparison to CREB. High expression of c-fos was dependent on the combined activation of the MAPK pathway and phosphorylation of CREB. These observations show that temporal features of action potentials (and associated Ca2+transients) regulate expression of neuronal genes by activating specific intracellular signaling pathways with appropriate temporal dynamics.
Keywords: CREB phosphorylation, calcium, c-fos, signal transduction, activity-dependent plasticity, LTP, MAP kinase, SRE
How specificity is maintained between stimulus and transcription of specific genes is a fundamental problem in cell biology. In neurobiology an additional complexity arises, because information in the nervous system is coded in the temporal pattern of impulse activity. Although there is considerable information on the multiple signal transduction pathways leading from membrane depolarization to gene transcription, it is not fully understood how these reactions operate as a system to extract and transmit information from temporally varying stimulation. This is an important question, considering the fundamental role of action potential-dependent gene regulation in brain function and nervous system development. Neuronal electrical activity has an important influence on development and postnatal shaping of neuronal connections (Shatz, 1990; Fields and Nelson, 1992; Goodman and Shatz, 1993; Gu and Spitzer, 1995). It is well established that specific patterns of action potentials can regulate the expression of specific genes, including those coding neural cell adhesion molecules (Itoh et al., 1995), ion channels (Li et al., 1966; Garcia et al., 1994), neurotransmitters (Hodaie et al., 1995), and immediate early (IE) genes (Sheng et al., 1993; Worley et al., 1993).
The concentration of second messengers and differences in activation thresholds for calcium-dependent signaling reactions are important factors in controlling cellular responses to stimulation (Clapham, 1995; Ghosh and Greenberg, 1995). In addition, subcellular heterogeneity in the concentration dynamics of second messengers can contribute to stimulus–response specificity (Bading and Greenberg, 1993; Bootman and Berridge, 1995). The objective of the present study was to investigate whether differences in the temporal dynamics of the second messenger Ca2+ and integration by downstream signaling elements could contribute to specific activation of genes in response to specific patterns of neuronal firing.
Patterns of stimulation were delivered that resembled normal bursting activity in utero (Meister et al., 1991; Fitzgerald and Fulton, 1992). Stimulus parameters were developed that would produce similar or countervailing differences in the magnitude of calcium increase (residual, peak, and time-integrated Ca2+) but that differed in specific temporal features (e.g., the interval of time between repeated bursts). In contrast to chemical stimulation of neurons in vitro, which drives cellular signaling systems to steady-state equilibrium, electrical stimulation in multicompartment cell cultures can model the important dynamics of intracellular signaling systems driven by impulse activity. Dorsal root ganglion (DRG) neurons do not form synapses and lack spontaneous impulse activity in culture. They respond to brief electrical stimulation with a single action potential, enabling precise regulation of the pattern of impulse activity (Fields et al., 1992). Electrical stimulation is the most direct means of depolarizing the membrane to stimulate gene expression.
The relation among neural impulse pattern, intracellular calcium transients, activation of MAP kinase (mitogen-activated protein kinase; MAPK) and the transcription factor cAMP-responsive element binding protein (CREB), and induction of c-fos mRNA and Fos-β-galactosidase were studied in mouse primary DRG neurons. The results provide insight into how information encoded in the temporal pattern of action potentials is transmitted and integrated within the neuron to control the expression of a gene implicated in adaptive responses in neurons.
Abstracts of portions of this work have appeared previously (Sheng et al., 1992; Fields et al., 1996).
MATERIALS AND METHODS
Multicompartment cell culture and stimulation.Multicompartment chambers were made of Teflon and attached to collagen-coated 35 mm culture dishes as described (Fields et al., 1992). DRG neurons were dissociated from 13.5 d mouse fetuses, and 0.25 × 10⁶ cells were plated into the two side compartments. Culture medium contained 5% horse serum and 50 ng/ml nerve growth factor, as described previously (Fields et al., 1990;Sheng et al., 1993). Mitosis of non-neuronal cells was inhibited by adding 13 μg/ml fluoro-2-deoxyuridine 1–2 d after the initial cell plating. Cultures were fed twice a week with half changes of fresh medium. Cultures were used for experiments 3–4 weeks after plating to allow time for most DRG neurons in the side compartments to extend axons under the barrier between the side and central compartments. Axons traversing the barrier were stimulated through platinum electrodes on opposite sides of this barrier. Twenty-four hours before stimulation, cultures were washed three times in serum-free medium lacking added NGF to minimize the serum and neurotrophin response of the c-fos gene.
Stimulation parameters and electrophysiological responses to stimulation have been reported previously for DRG neurons in these multicompartment chambers (Fields et al., 1990, 1992; Sheng et al., 1993). DRG neurons in this preparation respond to 5 V, 200 μsec biphasic pulsed stimulation with a single action potential. This permits precise control of the frequency and pattern of action potential activity. These cells follow stimulation reliably and indefinitely at rates up to 3 Hz, and they follow 10 Hz stimulation for several seconds or 30 Hz for short periods (Fields et al., 1990; Sheng et al., 1993). In addition to testing various stimulus frequencies from 0.1 Hz to 10 Hz and different durations of stimulation (up to 30 min), we applied four intermittent pulse train stimuli. These consisted of 1.8, 3.6, 5.4, and 9 sec duration 10 Hz bursts repeated at 1, 2, 3, and 5 min intervals, respectively. Pulse train stimulation was applied for 30 min to deliver a total of 540 action potentials for each different stimulus pattern.
RNA preparation and RT-PCR analysis. Total RNA from each culture dish was extracted with 400 μl of TRIzol reagent (Life Technologies, Gaithersburg, MD). RNA was reverse-transcribed into cDNA with Superscript II (Life Technologies) and c-fos-specific or random hexamers. Approximately 1/10 fraction was added to the PCR reaction and amplified in a solution containing 10 mmTris-HCl, pH 8.3, 50 mm KCl, 0.2 mm individual dNTPs, 1.5 mm MgCl2, 1 μmeach primer, and 1 U of Taq DNA polymerase (Perkin-Elmer Cetus, Norwalk, CT) in a final volume of 50 μl. PCR conditions included a 1 min 94°C denaturation, 1 min 60°C annealing, and 1 min 72° primer extension for 20–28 cycles.
The oligonucleotide sequence of the forward and reverse primers corresponds to nucleotides 1392–1414 and 2232–2254 of the mousec-fos gene (Van Beveren et al., 1983). The primers flank introns 2 and 3, yielding a 341 bp RT-PCR product. Neuron-specific enolase (NSE) was coamplified as an internal target for normalization of cell count, RNA extraction, and PCR amplification. NSE primers GGA CAG CAA GAA AGA GGC TCC (downstream) and CTC TAC CAG GAC TTT GTC CGC (upstream) were based on the published sequence from rat brain (Sakimura et al., 1985). Preliminary experiments were performed to determine the range of nonsaturated amplification, using serial dilution of cDNA and variable cycle numbers. NSE cDNA was amplified colinearly with that of c-fos under the conditions described above. NSE is specific for neurons, and it is not regulated by electrical stimulation. Constant expression of NSE in our system was confirmed by comparing NSE mRNA levels with those of GADPH. The PCR products were electrophoresed in 6% polyacrylamide or 3% NuSieve 3:1 (FMC Bioproducts, Rockland, ME) gels and stained with 0.5 μg/ml ethidium bromide. After electrophoresis a picture of the gel was taken, and the intensity of the bands was quantified by densitometry (Image 1, Universal Imaging, West Chester, PA). The results were normalized with respect to the intensity of the NSE band and expressed as a percentage change from nonstimulated cultures. The specificity of the PCR product was judged by the expected size of the band in the gel and by hybridization to a specific probe for c-fos (1919–1942) under stringent conditions (Sheng et al., 1993).
Intracellular calcium. The intracellular calcium concentration was measured by ratiometric fluorescence video microscopy (Image 1, Universal Imaging), using the calcium-sensitive dye fura-2/AM as described previously (Fields et al., 1993). Neurons were washed in a balanced salt solution containing 2% bovine serum albumin and 5 μm fura-2/AM (Molecular Probes, Eugene, OR) for 10 min at 37°C. Cells were incubated at room temperature for 15 min and then washed and maintained at room temperature for 30 min to allow for hydrolysis of the acetoxymethyl ester from the dye. Electrically evoked changes in calcium concentration were measured in the cell bodies of neurons plated in the side compartments of the multicompartment chambers. Images were obtained with a 40× Zeiss lens on an inverted Zeiss microscope (Oberkochen, Germany) equipped with a quartz collector, using an image intensifier and a video camera. Image acquisition was triggered from the electrical stimulus delivered to the cell cultures to synchronize measurement of responses to electrical stimuli of different patterns. Excitation was switched between 340 and 380 nm with a filter wheel (Sutter Instruments, Novato, CA), and the fluorescent images were acquired and ratioed at rates of ∼1/sec. In experiments requiring the highest possible acquisition speed with this system, fluorescence intensity was measured at video rate in response to excitation at one wavelength, and an identical electrical stimulus was repeated after a 5 min rest to allow measurements to be acquired by using the other excitation wavelength. Then the fluorescent intensities from the two wavelengths were ratioed.
Confocal microscopy in single line and X-Y scan mode were used to study subcellular heterogeneity of electrically evoked calcium transients in DRG neurons stimulated in multicompartment chambers. Measurements were performed on a Bio-Rad 1024 visible/UV confocal microscope (Hercules, CA) and a Nikon 40× oil immersion objective on a Nikon inverted microscope (Tokyo, Japan). Quantitative calcium measurements were made with ratiometric measurements at a fluorescence intensity at 480 and 405 nm in DRG neurons loaded with Indo-1/AM and excited by an argon ion laser. These were confirmed by single wavelength measurements with Fluo-3/AM excited by a krypton/argon laser.
CREB phosphorylation. Cultures of DRG neurons were stimulated electrically or with 60 mm KCl and fixed immediately after stimulation with 1% paraformaldehyde for 20 min at room temperature. Cells were permeabilized with 0.2% Triton X-100 for 2 min, and endogenous peroxidase was blocked with 3% H2O2 for 5 min, followed by 3% normal goat serum (NGS) for 30 min. Cultures were incubated for 4 hr with antibody against unphosphorylated CREB or CREB phosphorylated at serine-133 (Ginty et al., 1993) (Upstate Biotechnology, Lake Placid, NY, and New England Biolabs, Beverly, MA) at a concentration of 0.25 μg/ml in PBS containing 1% NGS. After washing, the cultures were incubated for 30 min with biotinylated goat anti-rabbit IgG and localized by the ABC method (Vector Laboratories, Burlingame, CA) according to the manufacturer’s protocol. The relative intensity of the nuclear stain was quantified by using imaging densitometry on a video microscope (Image 1, Universal Imaging).
CREB phosphorylation also was analyzed by Western immunoblotting as described previously (Ginty et al., 1993). Cells lysates made in boiling sample buffer (125 mm Tris-HCl, pH 6.8, 4% SDS, 10% β-mercaptoethanol, 20% glycerol, and 0.04% bromphenol blue), were boiled for 5 min and resolved in 10% SDS polyacrylamide minigels and electrotransferred to polyvinylidene fluoride membranes (Immobilon-P, Millipore, Bedford, MA). Membranes were blocked with 5% dry milk in TTBS (10 mm Tris-HCl, pH 7.5, 150 mm NaCl, 0.1% Tween-20) for 1 hr at room temperature, washed, and incubated in the CREB or P-CREB antibodies (1:2500) overnight at 4°C. Immunocomplexes were visualized by enhanced chemiluminescence reagent (Amersham, Arlington Heights, IL) according to the manufacturer’s protocol.
MAP kinase activation. The in vivo MAP kinase activation was measured in cultured DRG neurons after four different action potential patterns were elicited. The activation of the extracellular-regulated kinase (ERK) MAP kinases was determined by Western immunoblotting as described above, except that polyclonal antibodies raised against dual phosphorylated/active epitope in ERK1 and ERK2 (12.5 ng/ml) (Anti-ACTIVE MAPK, Promega, Madison, WI) and total ERK1/ERK2 MAP kinases (5 ng/ml) (New England Biolabs) were used. The immunocomplexes were detected with either DAB (Vector Laboratories) or enhanced chemiluminescence reagent (Amersham) according to the manufacturers’ protocols. Digitized images of the immunoblots or autoradiograms were used for densitometric measurements with the Intelligent Quantifier software (Bio Image, Ann Arbor, MI). Relative enzyme activation was determined by normalization of the density of images from phosphorylated enzyme with that of the total ERK1 MAP kinase from parallel experiments in the same sample.
Data analysis and experimental design. Calcium responses to electrical stimulation were measured in multiple cells in several dishes from multiple dissections (sample size given with Results). The calcium responses over time for all cells at each stimulus frequency were pooled and plotted as the mean response at every time point ± the SEM. Statistical analysis was performed by ANOVA with data analysis computer software (Minitab, State College, PA). Calcium responses were measured in response to different frequencies of stimulation and in response to bursts of 10 Hz stimulation for durations up to 9 sec. Long-term calcium recordings also were performed to monitor changes in intracellular calcium during the 30 min stimulation period with the four different pulse train stimulus patterns used in studies of c-fos expression. The sampling rate was varied systematically by computer program to provide higher temporal resolution during stimulus bursts than during the intervals between bursts. The activation and recovery kinetics of calcium influx in response to different durations of 10 Hz stimulation were modeled with nonlinear regression software (Table Curve, Jandel Scientific, San Rafael, CA). The equation of best fit was selected on the basis of high regression coefficient and most uniform distribution of residuals.
The relative intensity of nuclear staining after immunocytochemistry, using antibodies against CREB or P-CREB, was compared by imaging densitometry in multiple cells from multiple dishes and multiple dissections (sample size reported with Results). Statistical comparisons were made by ANOVA on differences in nuclear staining intensity after 30 min of stimulation with the four different stimulus patterns used in experiments on c-fos expression or after 10 min of depolarization with 60 mm KCl. Differences in staining were also compared after 30 min of stimulation at 1 and 10 Hz and after fixation after 10 sec and 1, 5, and 10 min of 10 Hz stimulation. Fixation was begun immediately after stimulation was stopped. Dephosphorylation of CREB at Ser-133 was studied by stimulating cultures at 10 Hz for 5 min and fixing cultures immediately or 1, 5, 10, and 25 min after terminating the stimulus. Images were acquired from at least 15 randomly chosen fields in each culture with a Nuvicon video camera and digitized by computer for storage and display. The mean intensity of staining was quantified in the nucleus of every neuron in each field. All cultures from a given experiment were analyzed together to maintain uniformity. All values were normalized to the mean intensity of nuclear staining in unstimulated cultures to allow for pooling replicate experiments [arbitrary optical units = (((nuclear staining density/average staining density of control nuclei) × 100) −100)]. The results were presented as mean ± SEM, and statistical comparisons were evaluated by ANOVA or two-samplet test. The images were digitized by an eight-bit digitizer, which yields an intensity scale from 0–255 (pure white to pure black). The average intensity of unstimulated nuclei was ∼100; therefore, the maximal possible increase in staining intensity = 155%. All experimental designs were balanced to include each stimulus condition and unstimulated cultures to allow normalizing intensities relative to unstimulated controls.
RESULTS
Calcium transients evoked by trains of action potentials
Calcium is a critical second messenger mediating intracellular signaling and regulating gene expression in neurons (Ghosh and Greenberg, 1995; Fields, 1996; Ginty, 1997), but there is little quantitative data on the relation between calcium transients and gene expression. It is not yet clear how changes in resting calcium concentration, amplitude of calcium transient, and dynamics of calcium increase and recovery after stimulation relate to transcriptional activation of c-fos and other IE genes. Intracellular calcium concentration was measured in response to specific patterns of action potentials to test the hypothesis that the temporal dynamics of intracellular calcium transients could be an important factor in regulating c-fos mRNA levels, apart from differences in the concentration of intracellular calcium (peak levels, residual calcium, and total integral calcium).
Calcium imaging, using the fluorescent calcium probe fura-2, showed that calcium transients in response to action potentials exhibited rapid on rates, temporal summation, and relatively slower recovery (Fig. 1). Quantitative analysis of electrically evoked calcium transients was performed to allow prediction of changes in intracellular calcium in response to a wide range of possible stimulus patterns. The immediate objective was to define a set of stimulus patterns that would produce similar or countervailing increases in the amount of cytoplasmic calcium but that differed in temporal parameters, such as the interval between repeated bursts. The kinetics of increase in calcium produced by 1–90 action potentials (delivered at a frequency of 10 Hz) were well fit by nonlinear regression to an equation of the form:
| Equation 1 |
where y = the calcium concentration,a = the prestimulus calcium concentration,b = the amplitude of the calcium increase, andt = the duration of stimulation at 10 Hz; cis the constant ranging from 1.02 for a single action potential to 0.459 for 90 action potentials (Fig. 1H–N, Table1). Even a single action potential produced a small (∼20 nm) but measurable increase in intracellular calcium concentration (Fig. 1G,N).
Fig. 1.
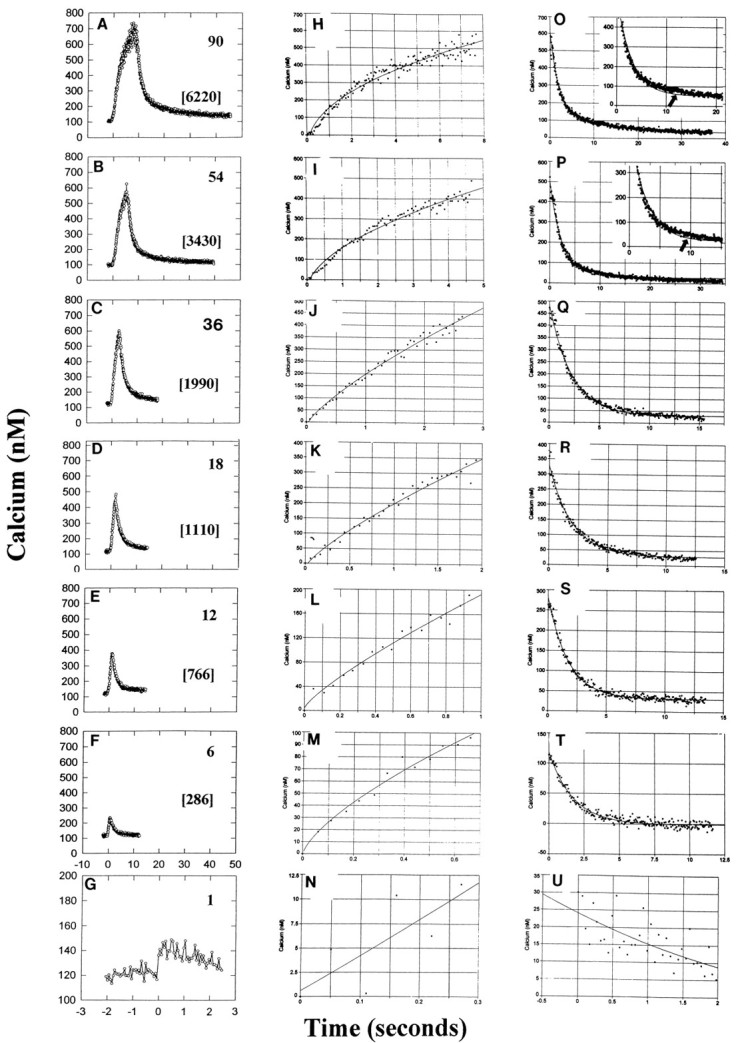
Electrically evoked intracellular calcium concentration in the cell body of DRG neurons measured by calcium imaging with fura-2. Responses to 1, 6, 12, 18, 36, 54, and 90 action potentials at 10 Hz are shown, with the total calcium concentration–time integral indicated for each stimulus in brackets (nm min; A–G). A rapid increase in intracellular calcium and slower recovery after the stimulus is stopped are evident for all stimulus durations. A single action potential produces a small but detectable increase in [Ca2+]i in the cell body. The kinetics of calcium increase are well fit by a power function, using nonlinear regression (H–N) (see Table 1). The kinetics of recovery after the stimulus is terminated are well fit by a single exponential equation for stimulus durations <54 impulses (Q–U), but the recovery deviates from this function for longer bursts by having a longer sustained increase in intracellular calcium at ∼10 sec poststimulus (Table 1;arrow in insets to O,P). A double exponential function is required to adequately fit this slower recovery in the following 54 (P) and 90 (O) action potential bursts (see Table 1).
Table 1.
Parameter fits using nonlinear regression to electrically induced calcium transients in the cell bodies of DRG neurons after action potential stimulation at 10 Hz for various durations
| Number of action potentials | Fitted parameter values | |||||
|---|---|---|---|---|---|---|
| a | b | c | d | e | r2 | |
| Calcium increase y = a + b tc | ||||||
| 1 | 0.608 | 38.1 | 1.02 | – | – | 0.603 |
| 6 | −1.00 | 132 | 0.686 | – | – | 0.978 |
| 12 | 3.63 | 189 | 0.798 | – | – | 0.973 |
| 18 | −15.1 | 214 | 0.764 | – | – | 0.976 |
| 36 | −16.6 | 215 | 0.752 | – | – | 0.980 |
| 54 | −47.1 | 204 | 0.560 | – | – | 0.975 |
| 90 | −91.8 | 246 | 0.459 | – | – | 0.955 |
| Calcium recovery y = a + b exp (−t/c) | ||||||
| 1 | −12.0 | 36.0 | 3.60 | – | – | 0.484 |
| 6 | −1.03 | 119 | 1.69 | – | – | 0.966 |
| 12 | 31.0 | 251 | 1.73 | – | – | 0.986 |
| 18 | 28.5 | 300 | 1.96 | – | – | 0.984 |
| 36 | 29.3 | 452 | 2.24 | – | – | 0.989 |
| 54 | 23.2 | 460 | 2.71 | – | – | 0.9791-160 |
| 90 | 51.2 | 504 | 2.99 | – | – | 0.9681-160 |
| Calcium recovery y = a + b exp (−ct) + d exp (−et) | ||||||
| 54 | 24.4 | 450 | 0.439 | 27.5 | 0.103 | 0.981 |
| 90 | 27.6 | 447 | 0.545 | 130 | 0.0789 | 0.987 |
y, Intracellular calcium; t, time; r2, regression coefficient.
F1-160: A poor fit at approximately t = 10 sec because of sustained calcium increase.
Next it was necessary to determine the rate at which the calcium concentration returns to normal after a stimulus burst, to predict how calcium levels are affected by repeated bursts of impulses. The recovery function followed nonlinear kinetics that differed for long and short stimulus bursts. For stimulus bursts of <54 impulses (Fig.1Q–U), the kinetics of recovery were well fit by a single exponential equation of the form:
| Equation 2 |
with a time constant in the range of 1.7–3.6 sec.
For longer duration bursts, the kinetics of recovery deviated from the single exponential decay function by having a more sustained increase than expected at ∼10 sec after the stimulus was terminated (Fig. 1,insets to O,P). This plateau response (Fig. 1O,P, Table 1) was better fit by a double exponential equation of the form:
| Equation 3 |
Similar plateau responses after intense stimulation have been reported previously (Thayer and Miller, 1990; Bowie et al., 1994).
High concentrations of intracellular calcium in these neurons would be reached within the first few seconds of stimulation at a frequency of 10 Hz, with relatively smaller differences in peak calcium concentration produced after longer duration stimuli. After the stimulus was terminated, calcium recovered to near prestimulus levels within seconds after 1–18 impulse bursts (at 10 Hz) (Fig.1R–U), but tens of seconds were required to recover from 36 to 90 impulse bursts (Fig. 1O–Q). These kinetics were confirmed by measuring mean peak calcium responses to electrical stimulation in a larger number of neurons (n= 42), which were stimulated with 10 Hz bursts of seven different durations ranging from 0.1 to 9 sec (Fig.2A).
Fig. 2.
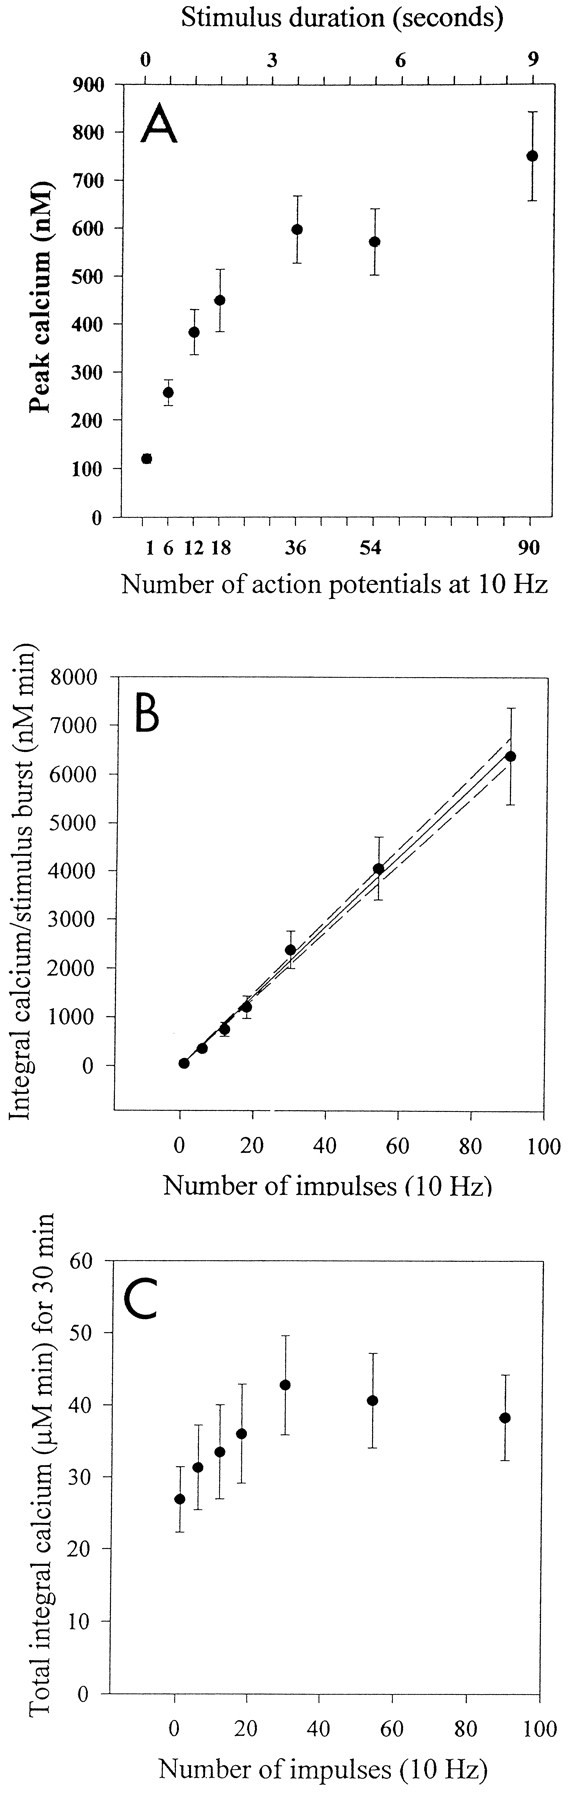
Summary of pooled data from measurements on several neurons (mean and SEM) on the relation between action potential pattern and intracellular calcium transients. A, The peak concentration of intracellular calcium increases proportionately less for longer stimulus durations. This is consistent with the kinetics of calcium increase measured in single neurons, which follows a power function relation between action potential duration and calcium increase (Fig.1H–N) (n = 48 neurons, 6 neurons for each stimulus pattern). B, The calcium–time integral during one stimulus burst of 1–90 impulses. The integral calcium includes the increase in calcium from stimulation to recovery after the stimulus burst. The magnitude of the calcium–time integral for different burst durations is well fit by a linear regression to the duration of the burst (solid line= linear regression fit; dotted line = 95% confidence interval; n = 38 neurons).C, The total increase in calcium experienced during 30 min of stimulation. The comparison shown is for an equal number of impulses (540 impulses total during the 30 min stimulus) but delivered in 10 Hz bursts of 1, 6, 12, 18, 36, 54, and90 impulses and repeated at regular intervals (e.g., from one action potential every 3.3 sec to six bursts of 90 action potentials repeated every 5 min). Note that the total elevation in calcium experienced by the cell during the 30 min stimulus period (calcium–time integral) is relatively similar for stimulus bursts longer than ∼18 impulses (n = 38 neurons).
Previous research has suggested that, rather than correlating with the peak levels of calcium during a given stimulus burst, gene expression might be related more closely to the net increase in intracellular calcium produced during the entire period of stimulation (30 min; Sheng et al., 1993). The total calcium–time integral, representing the net increase in intracellular calcium during the period of calcium influx and recovery from stimulation, increased as a linear function of the duration of an individual stimulus burst of 1.8–9 sec duration (Fig.2B).
Neural impulse activity and c-fos expression
c-fos is implicated in a wide range of nervous system processes, including the conversion of short-term stimuli into long-term changes in neurons (Sheng and Greenberg, 1990; Morgan and Curran, 1991; Hughes and Dragunow, 1995), response to brain injury, sensory stimulation, activation of neurotransmitter receptors, stress, circadian rhythms, and long-term changes in synaptic strength (e.g., long-term potentiation) (Hughes and Dragunow, 1995). Temporal features of action potential activity may be relevant in regulating certain functional response of c-fos activity.
Expression of c-fos differed in response to different patterns of action potential stimulation. The amount ofc-fos mRNA increased as an exponential function of the stimulus frequency over the range of 0.1–10 Hz, confirming previous research (Sheng et al., 1993). One action potential every 10 sec (0.1 Hz) was near threshold stimulation frequency for elevatingc-fos expression. Expression increased from 145% of unstimulated values in response to 0.1 Hz stimulation to ∼600% of control after stimulation for 30 min at frequencies of 3 Hz or higher (data not shown).
Previous work has shown that c-fosexpression increases with increasing duration of stimulation in DRG neurons (Sheng et al., 1993). However, natural firing patterns are modeled more closely by pulse train stimulation than by constant frequency stimulation (Meister et al., 1991; Fitzgerald and Fulton, 1992). To investigate effects of bursts of action potentials that produced similar changes in intracellular calcium, but which differed in the amount of time between bursts, we used bursts of 1.8 sec or longer (Fig. 2A). To avoid saturating stimulus conditions, we delivered the number of action potentials that produced ∼50% maximal c-fos expression (540 action potentials) in 30 min of constant frequency stimulation but grouped into four different stimulus patterns. These four pulsed patterns consisted of repeated bursts of 1.8, 3.6, 5.4, and 9 sec duration (at 10 Hz) separated by 1, 2, 3, and 5 min intervals, respectively (Fig.3A).
Fig. 3.
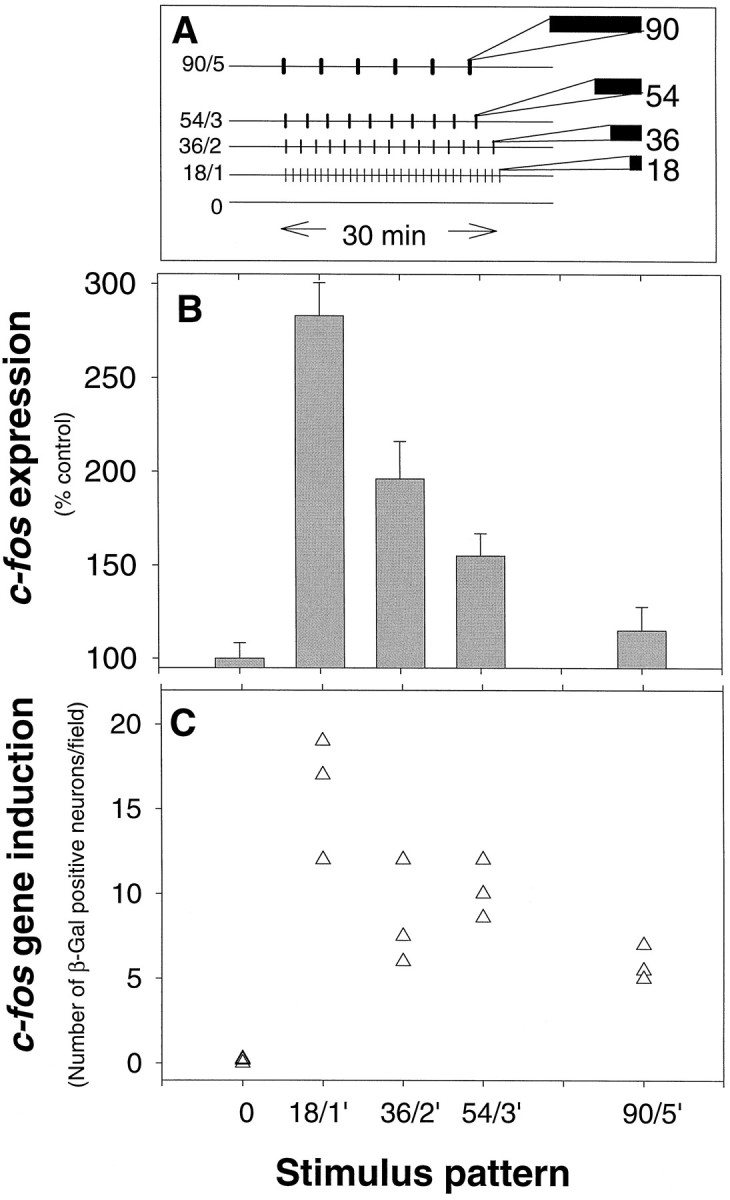
Regulation of c-fos expression in response to different patterns of neural impulses. A, The effect of pulse train stimulation on c-fosexpression was studied by delivering the same number of impulses (540) in a 30 min period, but grouped into repeated bursts (10 Hz) of 1.8, 3.6, 5.4, and 9.0 sec, separated by 1, 2, 3, and 5 min interburst intervals, respectively. B, Expression ofc-fos mRNA was related inversely to the interval between bursts. This correlation held despite the countervailing increase in the duration of stimulus bursts (n = 31 cultures).C, Consistent with differences in c-fosmRNA in electrically stimulated cultures, Fos-β-galactosidase in DRG cultures from transgenic mice carrying the fos/LacZreporter gene decreases with increasing interburst intervals. The mean number of β-gal-positive neurons per microscope field is plotted for each culture. Means were determined from counts of neurons in 10 microscope fields in each culture, and differences in expression among the cultures stimulated with the four different impulse patterns were analyzed by ANOVA. The results indicate a highly significant difference among stimulus groups (p < 0.001;n = 15 cultures).
Levels of c-fos mRNA differed significantly after these different patterns of 540 action potentials (Fig. 3B). An inverse correlation was evident between c-fos expression and the interval between successive bursts of action potentials. This correlation held despite countervailing differences in the duration of bursts. Maximal expression was produced by short (1.8 sec) bursts (10 Hz) repeated at 1 min intervals (18/1), but bursts repeated at 5 min intervals produced minimal increase in c-fos mRNA, although the individual bursts were five times longer (9 sec). Shorter bursts of stimulation repeated at 5 min intervals do not produce a paradoxical increase in c-fos expression (data not shown). Thus, the interval between bursts of action potentials is a critical parameter in regulating c-fos mRNA levels. The same pattern of expression in response to these different stimulus patterns was observed at the protein level (Fig. 3C) in DRG neurons cultured from transgenic mice containing the human fos/lacZ fusion gene (Schilling et al., 1991).
Calcium signaling and c-fos expression
The concentration dynamics of intracellular Ca2+ might encode differences in action potential firing pattern to produce the differences in c-fosexpression seen after the various stimuli. This was not the case for the set of pulsed stimuli tested in this study. Instead,c-fos expression correlated better with the temporal dynamics, i.e., expression declined with increasing intervals of time between periods of calcium influx (Fig.4). Peak calcium level, total calcium–time integral, and residual calcium produced by the various pulse trains of action potentials were not correlated withc-fos expression. For example, long duration bursts (9 sec) were not effective in stimulating c-fos expression when separated by 5 min intervals (Fig. 4L) although the stimulus raised calcium to the highest level (735 nm) (Figs. 2A, 4J). Shorter stimulus bursts, e.g., 1.8 sec, were effective in activatingc-fos gene expression if repeated at more frequent intervals (Fig. 4C), although short bursts raised calcium the least (485 nm) (Figs. 2A,4A). It is clear that a sustained elevation in intracellular calcium is not necessary for stimulating c-fosexpression, because the kinetics of recovery are sufficiently rapid to restore calcium to near prestimulus levels well within the 1–5 min period separating the bursts (Fig. 4A,D,G,J). Differences in total calcium load to the neuron (calcium–time integral) were relatively minor (not statistically significant;p = 0.69) for the four stimulus patterns (Fig.2C). For example, six bursts of 90 action potentials would produce 38.3 μm calcium/min, and 30 bursts of 18 action potentials would produce 35.9 μm calcium/min over the 30 min period of stimulation. Thus, this variable is not likely to have a controlling influence on differences in gene expression produced by the four different stimulus patterns.
Fig. 4.

Relation between electrically induced calcium transients and c-fos expression in response to different patterns of electrical stimulation. DRG neurons were stimulated with a total of 540 action potentials delivered in four different patterns for 30 min, as in Figure 3A, and the intracellular calcium transient was measured in the cell body by using ratiometric fluorescence imaging of cells loaded with the calcium indicator fura-2.A, D, G, J, The average calcium response of several neurons (n = 27, 35, 42, and 52 neurons) is shown in response to a single burst of stimulation at 10 Hz for different durations (1.8–9 sec). Higher peak calcium levels are reached after longer duration stimulus bursts, but the differences are small relative to the increase produced by a 1.8 sec burst (A vsJ). B, E, H, K, Long-term calcium recordings showing the average intracellular calcium levels in response to stimulus bursts repeated at different intervals (1–5 min). Note the full recovery of calcium to prestimulus levels after all stimulus patterns. C, F, I, L, Expression ofc-fos, measured by semiquantitative PCR (n = 31 cultures), does not correlate with the amplitude of the calcium transient but does correlate with the interval between stimulus bursts. This relation holds despite the countervailing differences in peak calcium produced by longer duration bursts.
The possibility that subcellular heterogeneity in calcium signaling in the nucleus versus the cytoplasm may account for the differences in c-fos expression (Hardingham et al., 1997) is not supported by experimental evidence in DRG neurons. Ratiometric fluorescence confocal microscopy with the calcium indicator Indo-1 was used to compare calcium responses in the nucleus and cytoplasm of DRG neurons. Cytoplasmic and nuclear calcium transients were nearly identical in response to membrane depolarization by trains of action potentials (Fig. 5). These results agree with previous studies of this question in DRG neurons (O’Malley, 1994).
Fig. 5.

No differences in nuclear versus cytoplasmic calcium concentrations are seen by using confocal microscopy in response to action potential stimulation in mouse DRG neurons. Neurons were stimulated in multicompartment preparations with different burst durations (0.1–5 sec at 10 Hz) to stimulate calcium influx over a wide range of concentrations. The change in intracellular calcium was monitored by confocal microscopy along a line from the plasma membrane to the nucleus of each neuron, using ratiometric confocal microscopy in single line-scan mode in neurons loaded with the calcium indicator Indo-1. The intracellular calcium concentration in a region of interest adjacent to the plasma membrane and in the center of the nucleus is plotted. The points are well fit by linear regression with a slope of 1 (r2= 0.99;n = 14 test stimuli in six neurons from six cultures).
CREB phosphorylation in response to action potentials
Nuclear transcription factors are key substrates for calcium-activated protein kinases. Phosphorylation of the nuclear transcription factor CREB protein at Ser-133 is critical in regulating transcription of the c-fos gene in response to cAMP or calcium (Gonzales and Montminy, 1989; Lamph et al., 1990; Dash et al., 1991; Sheng et al., 1991) and in consolidating long-term memory inDrosophila (Tully et al., 1994; Yin et al., 1994),Aplysia (Dash et al., 1990; Kaang et al., 1993; Alberini et al., 1994), and mice (Bourtchuladze et al., 1994; Frank and Greenberg, 1994; Stevens, 1994). The best relation between calcium transients andc-fos expression for the present set of stimuli was not the concentration of the second messenger calcium but the interval of time between the bursts of calcium influx (Fig.4B,E,H,K). This suggests that, for these stimuli, integration by a signaling element downstream from calcium has a time constant of decay that outlasts the period of calcium increase and persists for 1–2 min but fails to propagate signals regulating gene expression if interrupted by 5 min intervals. The dynamics of CREB phosphorylation could account for this behavior, and this hypothesis was tested directly.
Using an antibody specific for CREB phosphorylated at Ser-133 (P-CREB) (Ginty et al., 1993), we studied the kinetics of phosphorylation of this transcription factor in response to action potential stimulation of different patterns and correlated this with c-fosexpression and the changes in intracellular calcium produced by the stimulus (Fig. 6). The specificity of immunocytochemical staining to CREB and P-CREB was confirmed by immunoblotting. This antibody showed an increase in staining intensity of a protein with a molecular weight of ∼41 kDa, after 10 Hz electrical stimulation (Fig. 7), consistent with the increase in nuclear staining in neurons stimulated electrically (Fig. 6). No change in total CREB staining was evident in the nucleus (Fig. 6) or in immunoblots (Fig. 7) after chemical or electrical stimulation. The results show that (1) phosphorylation of CREB at Ser-133 has a low activation threshold, (2) levels of phosphorylated CREB increase rapidly in the nucleus, and (3) phosphorylated CREB in the nucleus decreases slowly after stimulation is stopped.
Fig. 6.

CREB phosphorylation at Ser-133 in response to electrical stimulation of different patterns. Phosphorylation was determined by nuclear staining using an antibody that recognizes CREB phosphorylated at Ser-133 (P-CREB). The intensity of immunocytochemical staining was quantified in the nucleus of stimulated cells by densitometry of digitized images on a scale of 0–255. All values were normalized to the mean intensity of nuclear staining in unstimulated cells (A). A 10 min incubation in 60 mm KCl caused a large increase in the number and intensity of nuclei staining for P-CREB (F), which is evident by the rightward shift in the histogram of nuclear staining intensities. After electrical stimulation, localization of P-CREB in the nucleus varies with different stimulus patterns (B–E). The highest levels of nuclear staining were produced by short bursts repeated frequently (1.8 sec at 10 Hz, every minute) (B) or longer duration bursts repeated infrequently (9 sec at 10 Hz, every 5 min) (E). The intermediate patterns of stimulation produced less CREB phosphorylation at Ser-133 (C, D). No change in nuclear staining was evident after any stimulus when an antibody that recognizes both the phosphorylated and dephosphorylated forms of the protein was used (A–E).
Fig. 7.

Western blot analysis of phosphorylation and activation of CREB. The antibody used for immunocytochemical studies stained a single band on immunoblots, consistent with the molecular weight of CREB. After electrical stimulation (10 Hz for 10 min), an increased amount of P-CREB was detected, as compared with unstimulated controls (Cnt.). Stimulation did not change the total amount of CREB (detected with an antibody that recognized both phosphorylated and nonphosphorylated CREB).
Phosphorylation of CREB at Ser-133 increased in proportion to stimulus frequency between frequencies of 1 and 10 Hz (Fig.8A), but high-frequency stimulation clearly was not required to phosphorylate CREB at Ser-133. A significant increase in levels of phosphorylated CREB was produced after 30 min of 1 Hz stimulation (p < 0.001). Phosphorylation of CREB in response to action potentials at a frequency of 10 Hz was rapid, reaching significantly elevated levels (p < 0.001) in <10 sec of stimulation (Fig.8B). Stimulation for 10 min produced significantly higher levels of phosphorylation (p < 0.001), but stimulus durations from 10 sec to 5 min produced relatively similar effects (Fig. 8B).
Fig. 8.
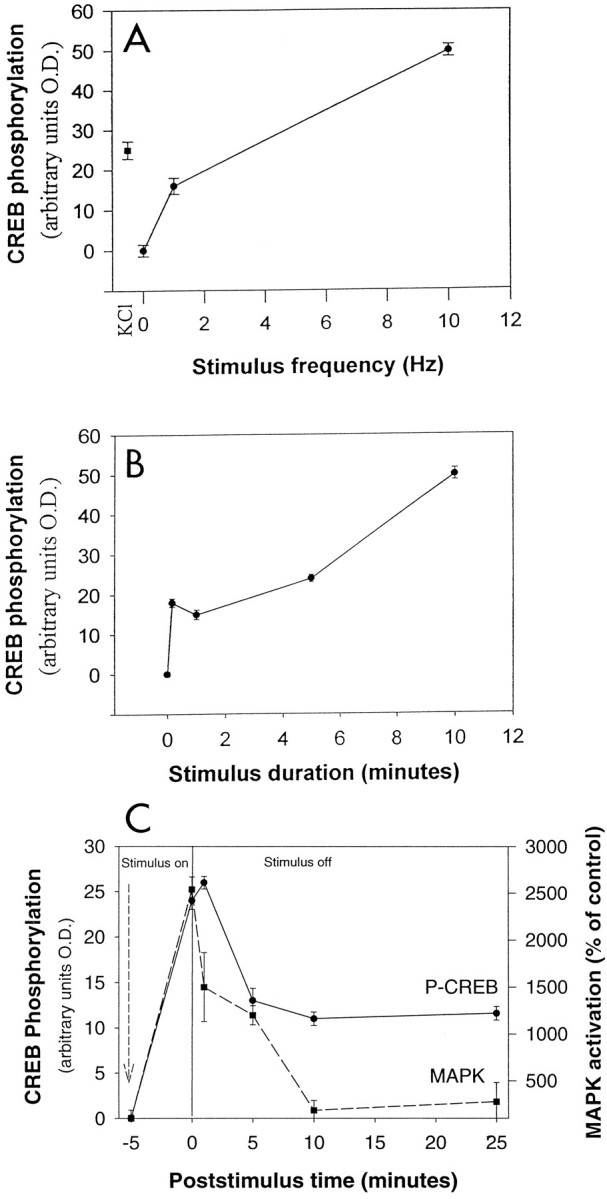
The kinetics of changes in phosphorylated CREB in the nucleus of DRG neurons after electrical stimulation and comparison to MAPK. A, Stimulation at 1 or 10 Hz for 10 min caused a significant increase in CREB phosphorylation at Ser-133 (p < 0.001), with a greater increase in phosphorylation produced by higher stimulation frequency. Depolarization with 60 mm KCl induced a comparable increase in staining intensity (n = 589 neurons).B, The kinetics of CREB phosphorylation at Ser-133 are relatively rapid, with a significant increase detected after only 1 min of 10 Hz stimulation (p < 0.001). Near-maximal levels of CREB phosphorylation at Ser-133 are seen after 10 min of 10 Hz stimulation (n = 789).C, Dephosphorylation of CREB at Ser-133 followed slower kinetics than phosphorylation. Cells were stimulated at 10 Hz for 5 min to induce phosphorylation (poststimulus time = 0) and then fixed (P-CREB) or lysed (MAPK) between 1 and 25 min after the stimulus was stopped. Dephosphorylation was much more rapid for MAPK than for CREB. No significant dephosphorylation of CREB could be detected 1 min after the stimulus was terminated, but levels of MAPK phosphorylation were reduced by ∼50%. A small but sustained increase in P-CREB persisted 25 min after the 5 min stimulus was terminated (p < 0.001 relative to control; no significant difference between 5 and 10 min or 5 and 25 min; n = 1392 neurons) (p < 0.01 by ANOVA for MAPK;n = 17 dishes).
Dephosphorylation of CREB at the critical site of Ser-133, however, proceeded with a much slower time course, declining by one-half within ∼5 min after a brief stimulus burst, but remaining elevated even 30 min after stimulation was stopped (Fig. 8C). The slow kinetics of CREB dephosphorylation suggest that activation of this transcription factor could serve to sustain the signaling reaction during the interval between stimulus bursts. However, the sustained response makes CREB phosphorylation a relatively poor indicator of stimulus pattern, and therefore phosphorylated CREB would not be expected to account for the differences in c-fos expression produced by the different patterns of action potentials investigated in this study. This was tested by measuring CREB phosphorylation in response to pulse train stimulation.
The four stimulus patterns used in experiments of c-fosexpression produced significantly different levels of CREB phosphorylation at Ser-133 after 30 min of stimulation (p < 0.001) (Figs. 6,9B). Differences were also evident by the rightward shift in frequency histograms of the staining intensity of all DRG nuclei stimulated with KCl or stimulated electrically (Fig. 6) and in terms of the mean staining intensity of nuclei (Fig. 9B). All four patterns of electrical stimulation increased phosphorylation of CREB at Ser-133 significantly, with KCl stimulation producing the greatest increase (Figs. 6,9B). Levels of phosphorylated CREB in response to pulse train stimulation were not as would have been predicted simply from the kinetics of CREB phosphorylation and dephosphorylation in response to constant frequency stimulation. Either brief stimuli repeated frequently (18 impulses at 10 Hz every minute) or long stimuli repeated infrequently (90 impulses at 10 Hz every 5 min) produced comparable large increases in CREB phosphorylation after 30 min (p = 0.21 comparing these two patterns), and these levels were higher than the phosphorylation produced by the intermediate patterns (36/2 and 54/3; p < 0.001) (Fig.9B).
Fig. 9.
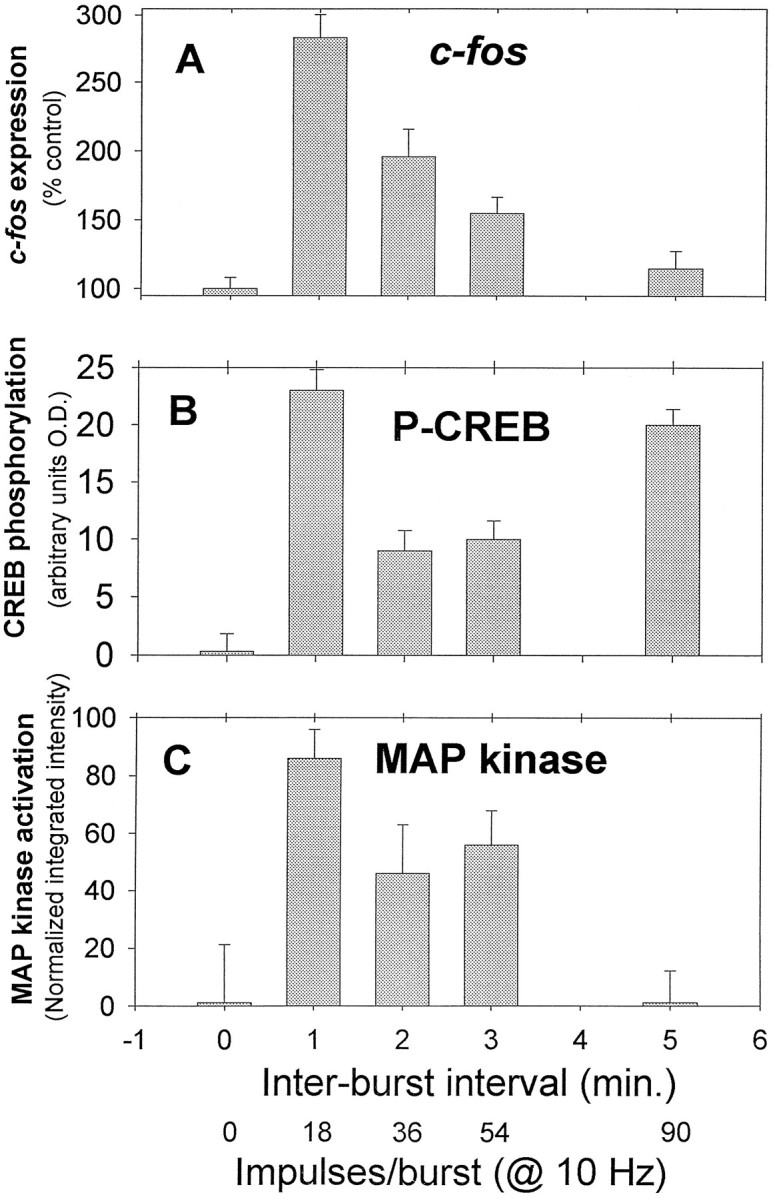
Relation among c-fos expression, activation of CREB, and MAPK in response to different patterns of electrical stimulation. Expression of c-fos(A) did not correlate well with phosphorylation of CREB at Ser-133 (B). Phosphorylation of CREB was increased significantly after 30 min of 1.8 sec bursts repeated at 1 min intervals or 9 sec bursts repeated at 5 min, butc-fos expression was not increased in response to the latter stimulus. No increase in MAPK activation was observed in response to the stimulus that failed to induce expression ofc-fos (90/5). Phosphorylated CREB levels are summarized as the mean intensity of nuclear staining in DRG neurons ± SEM after electrical stimulation and normalized with respect to controls (n = 1547 neurons). C, In vivoactivation of the MAP kinase ERK1 was measured by Western immunoblotting, using the DAB detection method. Results are integrated intensity values normalized with respect to controls (mean ± SEM;n = 20 cultures).
The total amount of P-CREB integrated over the 30 min stimulus period did not differ substantially for the two extreme stimulus patterns (18/1 vs 90/5), suggesting that differences in time-integrated P-CREB do not account for the large difference in c-fos expression induced by these two stimulus patterns. Measurement of P-CREB after a single 1.8 sec burst is beyond the limits of the method (highly variable results; our unpublished observations), but stimulation for 10 sec elevated P-CREB levels significantly (Fig.10A). P-CREB reached high levels in <14 min in response either to brief pulses (1.8 sec) repeated at 1 min intervals (p < 0.001 relative to control) or long pulses (9 sec) repeated at 5 min intervals (p < 0.001 relative to control) (Fig.10A). By the end of the 30 min stimulus period with either a 9 or 1.8 sec pulses, P-CREB had reached maximal levels, because a subsequent stimulus pulse produced no further increase in P-CREB (no significant difference).
Fig. 10.

Time course of increase in CREB phosphorylation and MAPK activation in response to action potential bursts of 1.8 sec duration (10 Hz) repeated at 1 min intervals (18/1;filled symbols) and 9.0 sec duration repeated at 5 min intervals (90/5; open symbols) for 30 min. Neurons were analyzed just before the stimulus burst to estimate the residual increase in activation (t = 14.5 and 29.5 min) and compared with unstimulated controls (t = 0). A, Levels of CREB activation increase to near-maximal values in <14.5 min of stimulation with either stimulus pattern (18/1 = filled circles;90/5 = open triangles).B, A similar increase in MAPK activation with stimulus time is seen in response to stimulus bursts repeated at 1 min intervals (18/1 = filled circles). A single burst of stimulation at the end of the 30 min period of stimulation with these pulse patterns produces no further increase in CREB or MAPK activation (squares). A significant increase in P-CREB is produced from a single 10 sec burst of action potentials (arrow). A 9 sec burst increases MAPK activation significantly (open square; p < 0.05). Activation of MAPK was not sustained over 5 min interburst intervals, as shown by the failure to summate during the 30 min stimulus period (open circles; differences not significant comparing 0, 14, and 29.5 min). n = 1306 neurons in A and 42 cultures inB.
The basis for the nonlinear relation between P-CREB staining in the nucleus and stimulus pattern is not evident in the associated calcium transients. Ca2+ levels correlated directly with stimulus burst duration, and the peak increase in [Ca2+]i was not limiting for CREB phosphorylation in these experiments. The shortest stimulus burst (1.8 sec) produced the least increase in Ca2+concentration (383 ± 47 nm) but the highest level of CREB phosphorylation (Fig. 9B). The high level of CREB phosphorylation at Ser-133 produced by 9 sec duration bursts repeated at 5 min intervals might be explained by sustained activation of a kinase (Hanson and Schulman, 1992) or by inhibition of phosphatase activity (Bito et al., 1996), perhaps in response to the high Ca2+ concentration produced by the long-duration stimulus bursts. Phosphatase activity (Bito et al., 1996) and calcium-dependent protein kinase activity (Hanson and Schulman, 1992) are known to exhibit nonlinearities with respect to the concentration of calcium.
MAP kinase activation in response to different action potential firing patterns
The MAP kinase cascade is involved in neurotrophin-inducedc-fos transcription through the phosphorylation of CREB at Ser-133 (Ginty et al., 1994; Xing et al., 1996) or phosphorylation of ternary complex factors, which, in association with serum response factor (SRF), bind to the SRE element of the c-fos promoter (Triesman, 1996; Xia et al., 1966). The MAP kinase cascade has been associated more closely with growth factor and serum stimulation, but recent work indicates activation of MAP kinase in response to increased [Ca2+] by way of Ras activation (Finkbeiner and Greenberg, 1996; Rosen and Greenberg, 1996). We tested whether (1) the MAP kinase pathway was activated by action potential firing in DRG neurons, (2) whether c-fos expression in response to action potential firing involved MAP kinase activation, and (3) whether the relative activation of CREB and the ERK MAP kinases differed depending on the pattern of action potential firing.
Selective inhibition with pharmacological agents revealed that both the calcium–calmodulin-dependent protein kinase (CaM kinase) and MAP kinase pathways were activated by action potential stimulation in DRG neurons to stimulate c-fos expression (Fig.11). Inhibition of the CaM kinase-dependent pathway was indicated by inhibition ofc-fos mRNA levels in response to a 1.8 sec electrical stimulation repeated at 1 min intervals in neurons pretreated with 30 μm KN-62 (Fig. 11). Similar results were obtained by preincubation with 50 μm PD098059, a MEK1 (ERK-activating kinase) inhibitor (Dudley et al., 1995), or a combination of the two inhibitors (Fig. 11).
Fig. 11.

Electrically induced expression ofc-fos is blocked by inhibitors of MAPK and CaM kinase. DRG neurons pretreated with 30 μm KN-62 (CaM kinase inhibitor), 50 μm PD098059 (MEK1 inhibitor), or both at the indicated concentrations for 1 hr showed no significant increase inc-fos mRNA levels after 30 min of electrical stimulation, as compared with controls (p = 0.53 by ANOVA). Stimulation was delivered in 1.8 sec bursts at 10 Hz, repeated at 1 min intervals (n = 22 dishes; *p < 0.003).
The amount of MAPK activation differed significantly in response to the four different pulse train patterns of action potentials (Figs.9C, 12; p < 0.001). Maximal activation of the ERK MAP kinases was measured after stimulation with 1.8 sec pulses repeated at 1 min intervals (p < 0.009 vs control). Increasing interburst interval was associated with less MAPK activation. No activation of MAPK was detected relative to unstimulated controls in response to 9 sec pulses repeated at 5 min intervals for 30 min (Figs. 9C,12; p = 0.63). In contrast to CREB phosphorylation, MAP kinase activation increased during the 30 min stimulus period in response to short bursts of action potentials (1.8 sec) repeated at 1 min intervals, but not in response to longer duration bursts (9 sec) repeated at 5 min intervals (Fig. 10B). This indicates a threshold of <5 min interpulse interval for integration by the MAP kinase enzyme. The difference between CREB and MAPK in responding to stimulus patterns with different interburst intervals is a consequence of the relatively faster dephosphorylation rate of MAPK (Fig. 8C). No significant decrease in CREB phosphorylation was detected 1 min after stopping a 5 min 10 Hz stimulus, but MAPK phosphorylation levels had declined by ∼50% at this point (Fig.8C).
Fig. 12.

MAPK activation in response to patterned action potentials. Activation of the ERK1 (p44) and ERK2 (p42) MAPK was determined in DRG neurons after eliciting a total of 540 impulses at 10 Hz in 1.8, 3.6, 5.4, and 9 sec bursts separated by 1, 2, 3, and 5 min intervals, respectively. The Western immunoblotting analysis was performed for activated MAPK after normalizing for total ERK1 by quantitative immunoblotting.
DISCUSSION
We conclude that the temporal dynamics of intracellular signaling pathways are critical in controlling the expression of neuronal genes in response to specific patterns of action potentials. The most critical determinant of c-fos expression was the interval of time between bursts of action potentials. Brief but frequently repeated bursts can induce the coordinated activation of MAP kinase and CREB to induce expression of c-fos. Bursts of action potentials separated by long intervals (5 min) did not effectively activate the MAP kinase cascade, but this stimulus did increase CREB phosphorylation. Maximal induction of c-fos expression required the combined activation of both the MAP kinase pathway and CREB phosphorylation.
CREB phosphorylation and intracellular Ca2+signals display different temporal dynamics in response to action potentials. Phosphorylation of CREB at Ser-133 paralleled the rapid rate of increase in [Ca2+]i, but [Ca2+]i recovered to normal levels within several seconds. This recovery was much faster than CREB dephosphorylation, which remained elevated even 25 min after a 5 min, 10 Hz stimulus was stopped. The persistence in signaling between bursts of action potentials (and calcium transients) is mediated in part by the slow dephosphorylation of CREB at Ser-133; however, the slow kinetics of CREB dephosphorylation at Ser-133 make P-CREB a poor or at least nonlinear transducer of temporal features of action potential stimulation. The high P-CREB levels in the nucleus under stimulus conditions that failed to induce c-fos expression show that CREB phosphorylation at Ser-133 need not be the limiting factor inc-fos expression. This was an unexpected result, given that phosphorylation of CREB at Ser-133 is critical in activating transcription of Ca2+/CRE containing genes, and dephosphorylation of CREB at this site mediates transcriptional shut-off in some experiments (Hagiwara et al., 1992;Hunter, 1995; Thompson et al., 1995). However, multiple regulatory elements in the c-fos promoter and multiple signaling pathways cooperate in the transcriptional activation ofc-fos (Gilman et al., 1986; Hill and Treisman, 1995). The lack of correlation between CREB phosphorylation at Ser-133 produced by long but infrequent stimulus bursts suggests that other elements in the signaling system or transcription process must be limitingc-fos expression. MAP kinase is a convergence point for many signaling pathways in neurons (Seger and Krebs, 1995). Inhibitor studies and immunoblots showed that the MAPK cascade is activated in DRG neurons by membrane depolarization induced by antidromic action potential firing in cultures lacking synapses and that activation of this pathway is dependent on the pattern of action potential firing. In contrast to P-CREB, which shows sustained activation over long interburst intervals, MAPK is unable to integrate bursts of action potentials separated by intervals of ∼5 min. Thus, the inability of MAP kinase to integrate bursts of action potentials separated by intervals of 5 min can partly explain the weak c-fos gene response for this pattern of firing. Differences in nuclear versus cytoplasmic Ca2+ (Hardingham et al., 1997) do not explain the differences in MAP kinase and CREB activation, because measurements using confocal microscopy show no difference in peak calcium response in the nucleus and cytoplasm of DRG neurons. The results suggest that the different rates of activation and inactivation of CREB and MAPK impose different temporal limitations on these two regulatory molecules in integrating repeated bursts of stimuli.
The diminished MAP kinase response did not influence CREB phosphorylation, which was high after stimuli repeated at 5 min intervals. Thus, phosphorylation of CREB in response to this stimulus can be attributed to other Ca2+-dependent signaling enzymes (Hanson and Schulman, 1992; Enslen et al., 1994; Bito et al., 1996; Liu and Graybiel, 1996). SRF and the ternary complex factor elk1 and SAP-1 are important regulators of c-fos transcription, and these are important targets of MAP kinases (Triesman, 1996;Janknecht and Hunter, 1997). The lack of c-fos expression in response to 9 sec bursts at 5 min intervals may result from insufficient phosphorylation of the ternary transcriptional complex associated with SRE. This is consistent with work showing the dependence of c-fos transcription on the combined action of all DNA binding proteins in the promoter into a three-dimensional transcriptional complex (Robertson et al., 1995).
Relevance to nervous system development and synaptic plasticity
The importance of the interval between bursts in regulating gene expression may be relevant to activity-dependent regulation of genes during development of the nervous system. Prenatal spontaneous electrical activity is often low frequency, with long intervals between bursts (Fitzgerald, 1987). In fetal ferrets, for instance, 2–4 sec bursts of activity sweep across the unstimulated retina at intervals of 1–2 min (Meister et al., 1991). This type of stimulus pattern was highly effective in activating c-fos expression in the present study. The highly coordinated spatiotemporally patterned electrical activity is thought to be critical for fine-tuning the connections between neurons in the visual system (Shatz, 1990). Similarly, calcium currents and the number of L-type calcium channels in DRG neurons are downregulated after 1–2 d of electrical stimulation in culture (Li et al., 1996). The efficacy of stimulation in reducing calcium currents varies inversely with the interval between bursts. In developing Xenopus spinal neurons, the frequency of spontaneous calcium transients correlates with discrete effects on development (Gu and Spitzer, 1995). Low-frequency calcium transients regulate neurite outgrowth, and high-frequency calcium transients regulate maturation of potassium channels. No relation was evident between these developmental processes and the number of calcium transients, peak calcium concentration, duration, or time integral of the calcium transient. Recent work on Drosophila shows that multiple training sessions with a rest interval between them (spaced training) produces stronger, longer-lasting memory than the same number of training sessions with no rest interval (massed training) (Yin et al., 1995). Remarkably low frequencies of stimuli, which would cause minimal changes in concentration of intracellular signaling molecules, can be effective in regulating gene expression in the nervous system. Expression of the T-type calcium currents in DRG neurons can be decreased by stimulus frequencies as low as 0.5 Hz. Expression ofc-fos and the cell adhesion molecule L1 genes is regulated by single action potential stimulation delivered at 10 sec intervals, but not 1–3 sec intervals (Itoh et al., 1995).
These results may have relevance to activity-dependent synaptic plasticity, but, in contrast to hippocampal neurons, there is no evidence that stimulus–transcription coupling in DRG neurons is restricted to postsynaptic neurons or dependent on a specialized subsynaptic calcium sensor to activate CREB phosphorylation (Deisseroth et al., 1996). Phosphorylation of CREB in hippocampal neurons has been reported to require synaptic activity, but rapid action potential firing fails to increase CREB phosphorylation (Deisseroth et al., 1996). This is not the case for DRG neurons, because stimulation was provided by electrical depolarization of axons in cultures that lack synapses and that were not spontaneously active or able to interact in an excitatory network to produce more complex firing patterns.
Resonant signal transduction: a dynamical perspective
Differences in MAP kinase activity and CREB phosphorylation are critical in regulating c-fos expression in response to different patterns of stimulation in the present experiment, but it would be reasonable to expect that other patterns of stimulation might produce different correlations between signaling molecules and gene expression. Rather than attributing the input–output function between stimulus pattern and c-fos expression to a response of any one element in the signaling cascade, these results might be better viewed as a dynamic property of the system of signaling reactions transducing patterned membrane depolarization to the transcriptional activation of genes. Nonlinearities and complex behavior could result from a convolution of many different signaling and transcriptional processes under dynamic conditions that may be saturated or not activated in steady-state stimulus conditions. This could include parallel protein kinases, phosphatases, other transcription factors, coactivators or transcription factor binding proteins, or differential effects of Ca2+ on initiation of transcription versus elongation of mRNA transcripts (Lee and Gilman, 1994). Different temporal patterns of stimulation also might regulate CREB binding via dimerization with related bZIP repressor proteins (Meyer and Habener, 1993) or via interdependencies between multiple DNA binding proteins (Robertson et al., 1995; Thompson et al., 1995; Nakajima et al., 1996). Each of these processes may have kinetic features or threshold effects that limit their involvement to certain patterns of stimulation.
Concentration thresholds and subcellular spatial heterogeneity of intracellular signaling components are two important means for providing stimulus–transcription specificity. The present results suggest that differences in temporal dynamics of intracellular signaling pathways can be responsible for selective activation of genes by specific action potential firing patterns. Given the importance of temporal coding in the nervous system, the dynamic aspects of intracellular signaling could be particularly important in regulating intracellular responses to action potentials (Fields and Nelson, 1994;Fields, 1996).
Footnotes
We thank J. Morgan, T. Curran, and L. Robertson for generously providing the fos/LacZ transgenic mouse strain and D. Abebe for establishing and maintaining the colony of transgenic mice.
Correspondence should be addressed to Dr. R. Douglas Fields, Head, Neurocytology and Physiology Unit, National Institutes of Health, National Institute of Child Health and Human Development, Laboratory of Developmental Neurobiology, Building 49, Room 5A38, Bethesda, MD 20892.
Dr. Itoh’s present address: Tokyo Metropolitan Institute of Medical Science, Tokyo 113, Japan.
REFERENCES
- 1.Alberini CM, Ghirardi M, Metz R, Kandel ER. C/EBP is an immediate-early gene required for the consolidation of long-term facilitation in Aplysia. Cell. 1994;76:1099–1114. doi: 10.1016/0092-8674(94)90386-7. [DOI] [PubMed] [Google Scholar]
- 2.Bading H, Ginty DD, Greenberg ME. Regulation of gene expression in hippocampal neurons by distinct calcium signaling pathways. Science. 1993;260:181–186. doi: 10.1126/science.8097060. [DOI] [PubMed] [Google Scholar]
- 3.Bito H, Deisseroth K, Tsien RW. CREB phosphorylation and dephosphorylation: a Ca2+ and stimulus duration-dependent switch for hippocampal gene expression. Cell. 1996;87:1203–1214. doi: 10.1016/s0092-8674(00)81816-4. [DOI] [PubMed] [Google Scholar]
- 4.Bootman MD, Berridge MJ. The elemental principles of calcium signaling. Cell. 1995;83:675–678. doi: 10.1016/0092-8674(95)90179-5. [DOI] [PubMed] [Google Scholar]
- 5.Bourtchuladze R, Frenguelli B, Blendy J, Cioffi D, Schutz G, Silva AJ. Deficient long-term memory in mice with a targeted mutation of the cAMP-responsive element-binding protein. Cell. 1994;79:59–68. doi: 10.1016/0092-8674(94)90400-6. [DOI] [PubMed] [Google Scholar]
- 6.Bowie D, Feltz P, Schlichter R. Subpopulations of neonatal rat sensory neurons express functional neurotransmitter receptors which elevate intracellular calcium. Neuroscience. 1994;58:141–149. doi: 10.1016/0306-4522(94)90161-9. [DOI] [PubMed] [Google Scholar]
- 7.Clapham DE. Calcium signaling. Cell. 1995;80:259–268. doi: 10.1016/0092-8674(95)90408-5. [DOI] [PubMed] [Google Scholar]
- 8.Dash PK, Hochner B, Kandel ER. Injection of the cAMP-responsive element into the nucleus of Aplysia sensory neurons blocks long-term facilitation. Nature. 1990;345:718–721. doi: 10.1038/345718a0. [DOI] [PubMed] [Google Scholar]
- 9.Dash PK, Karl KA, Colicos MA, Prywes R, Kandel ER. cAMP response element-binding protein is activated by Ca2+-calmodulin- as well as cAMP-dependent protein kinase. Proc Natl Acad Sci USA. 1991;88:5061–5065. doi: 10.1073/pnas.88.11.5061. [DOI] [PMC free article] [PubMed] [Google Scholar]
- 10.Deisseroth K, Bito H, Tsien RW. Signaling from synapse to nucleus: postsynaptic CREB phosphorylation during multiple forms of hippocampal synaptic plasticity. Neuron. 1996;16:89–101. doi: 10.1016/s0896-6273(00)80026-4. [DOI] [PubMed] [Google Scholar]
- 11.Dudley DT, Pang L, Decker SJ, Bridges AJ, Saltiel AR. A synthetic inhibitor of the mitogen-activated protein kinase cascade. Proc Natl Acad Sci USA. 1995;92:7668–7689. doi: 10.1073/pnas.92.17.7686. [DOI] [PMC free article] [PubMed] [Google Scholar]
- 12.Enslen HP, Sun D, Brickey SH, Soderling SH, Kalmo E, Soderling TR. Characterization of Ca2+ calmodulin-dependent kinase. IV. Role in transcriptional regulation. J Biol Chem. 1994;269:15520–15527. [PubMed] [Google Scholar]
- 13.Fields RD. Signaling from neural impulses to genes. Neuroscientist. 1996;2:315–325. [PMC free article] [PubMed] [Google Scholar]
- 14.Fields RD, Nelson PG. Activity-dependent development of the vertebrate nervous system. Int Rev Neurobiol. 1992;34:133–214. doi: 10.1016/s0074-7742(08)60098-7. [DOI] [PubMed] [Google Scholar]
- 15.Fields RD, Nelson PG. Resonant activation of calcium signal transduction in neurons. J Neurobiol. 1994;25:281–293. doi: 10.1002/neu.480250308. [DOI] [PubMed] [Google Scholar]
- 16.Fields RD, Neale EA, Nelson PG. Effects of patterned electrical activity on neurite outgrowth from mouse sensory neurons. J Neurosci. 1990;10:2950–2964. doi: 10.1523/JNEUROSCI.10-09-02950.1990. [DOI] [PMC free article] [PubMed] [Google Scholar]
- 17.Fields RD, Yu C, Neale EA, Nelson PG. Recording chambers in cell culture. In: Kettenmann H, Grantyn R, editors. Electrophysiological methods for in vitro studies in vertebrate neurobiology. Liss; New York: 1992. pp. 67–76. [Google Scholar]
- 18.Fields RD, Guthrie PG, Russell JT, Kater SB, Malhotra BS, Nelson PG. Accommodation of mouse DRG growth cones to electrically induced collapse: kinetic analysis of calcium transients and set-point theory. J Neurobiol. 1993;24:1080–1098. doi: 10.1002/neu.480240807. [DOI] [PubMed] [Google Scholar]
- 19.Fields RD, Itoh K, Stevens B, Eshete F. Regulation of c-fos expression by neural impulses: relation between stimulus pattern, intracellular calcium, and CREB phosphorylation. Soc Neurosci Abstr. 1996;22:736.7. [Google Scholar]
- 20.Finkbeiner S, Greenberg ME. Ca2+-dependent routes to Ras: mechanisms for neuronal survival, differentiation, and plasticity? Neuron. 1996;16:233–236. doi: 10.1016/s0896-6273(00)80040-9. [DOI] [PubMed] [Google Scholar]
- 21.Fitzgerald M. Spontaneous and evoked activity of fetal primary afferents in vivo. Nature. 1987;326:603–605. doi: 10.1038/326603a0. [DOI] [PubMed] [Google Scholar]
- 22.Fitzgerald M, Fulton BP. The physiological properties of developing sensory neurons. In: Scott SA, editor. Sensory neurons, diversity development, and plasticity. Oxford UP; New York: 1992. pp. 287–308. [Google Scholar]
- 23.Frank DA, Greenberg ME. CREB: a mediator of long-term memory from mollusks to mammals. Cell. 1994;79:5–8. doi: 10.1016/0092-8674(94)90394-8. [DOI] [PubMed] [Google Scholar]
- 24.Garcia DE, Cavalie A, Lux HD. Enhancement of voltgage-gated Ca2+ currents induced by daily stimulation of hippocampal neurons with glutamate. J Neurosci. 1994;14:545–553. doi: 10.1523/JNEUROSCI.14-02-00545.1994. [DOI] [PMC free article] [PubMed] [Google Scholar]
- 25.Ghosh A, Greenberg ME. Calcium signaling in neurons: molecular mechanisms and cellular consequences. Science. 1995;268:239–247. doi: 10.1126/science.7716515. [DOI] [PubMed] [Google Scholar]
- 26.Gilman MZ, Wilson RN, Weinberg RA. Multiple protein binding sites in the 5′-flanking region regulate c-fos expression. Mol Cell Biol. 1986;6:4305–4316. doi: 10.1128/mcb.6.12.4305. [DOI] [PMC free article] [PubMed] [Google Scholar]
- 27.Ginty DD. Calcium regulation of gene expression: isn’t that spatial? Neuron. 1997;18:183–186. doi: 10.1016/s0896-6273(00)80258-5. [DOI] [PubMed] [Google Scholar]
- 28.Ginty DD, Kornhauser JM, Thompson MA, Bading H, Mayo KE, Takahashi JS, Greenberg ME. Regulation of CREB phosphorylation in the suprachiasmatic nucleus by light and a circadian clock. Science. 1993;260:238–241. doi: 10.1126/science.8097062. [DOI] [PubMed] [Google Scholar]
- 29.Ginty DD, Bonni A, Greenberg ME. Nerve growth factor activates a ras-dependent protein kinase that stimulates c-fos transcription by phosphorylation of CREB. Cell. 1994;77:713–725. doi: 10.1016/0092-8674(94)90055-8. [DOI] [PubMed] [Google Scholar]
- 30.Gonzales GA, Montminy MR. Cyclic AMP stimulates somatostatin gene transcription by phosphorylation of CREB at Ser-133. Cell. 1989;59:675–680. doi: 10.1016/0092-8674(89)90013-5. [DOI] [PubMed] [Google Scholar]
- 31.Goodman CS, Shatz CJ. Developmental mechanisms that generate precise patterns of neuronal connectivity. Cell. 1993;72:77–98. doi: 10.1016/s0092-8674(05)80030-3. [DOI] [PubMed] [Google Scholar]
- 32.Gu X, Spitzer NC. Distinct aspects of neuronal differentiation encoded by frequency of spontaneous Ca2+ transients. Nature. 1995;375:784–787. doi: 10.1038/375784a0. [DOI] [PubMed] [Google Scholar]
- 33.Hagiwara M, Alberts A, Brindle P, Meinkoth J, Feramisco J, Deng T, Karin M, Shenolikar S, Montminy M. Transcriptional attenuation following cAMP induction requires PP-1-mediated dephosphorylation of CREB. Cell. 1992;70:105–113. doi: 10.1016/0092-8674(92)90537-m. [DOI] [PubMed] [Google Scholar]
- 34.Hanson PI, Shulman H. Neuronal Ca2+/calmodulin-dependent kinases. Annu Rev Biochem. 1992;61:559–601. doi: 10.1146/annurev.bi.61.070192.003015. [DOI] [PubMed] [Google Scholar]
- 35.Hardingham GE, Chawla S, Johnson CM, Bading H. Distinct functions of nuclear and cytoplasmic calcium in the control of gene expression. Nature. 1997;385:260–265. doi: 10.1038/385260a0. [DOI] [PubMed] [Google Scholar]
- 36.Hill CS, Treisman R. Differential activation of c-fos promoter elements by serum, lysophosphatidic acid, GF proteins, and polypeptide growth factors. EMBO J. 1995;14:5037–5047. doi: 10.1002/j.1460-2075.1995.tb00186.x. [DOI] [PMC free article] [PubMed] [Google Scholar]
- 37.Hodaie M, Jeevaratnam P, Salter MW, Roach A. Regulation of intracellular calcium and preprotachykinin neurotransmitter precursor gene expression by patterned electrical stimulation in rat sympathetic neurons. Neurosci Lett. 1995;13:195–198. doi: 10.1016/0304-3940(95)11260-4. [DOI] [PubMed] [Google Scholar]
- 38.Hughes P, Dragunow M. Induction of immediate-early genes and the control of neurotransmitter-regulated gene expression within the nervous system. Pharmacol Rev. 1995;47:133–178. [PubMed] [Google Scholar]
- 39.Hunter T. Protein kinases and phosphatases: the yin and yang of protein phosphorylation and signaling. Cell. 1995;80:225–236. doi: 10.1016/0092-8674(95)90405-0. [DOI] [PubMed] [Google Scholar]
- 40.Itoh K, Stevens B, Schachner M, Fields RD. Regulation of the neural cell adhesion molecule L1 by specific patterns of neural impulses. Science. 1995;270:1369–1372. doi: 10.1126/science.270.5240.1369. [DOI] [PubMed] [Google Scholar]
- 41.Janknecht R, Hunter T. Convergence of MAP kinase pathways on the ternary complex factor Sap-1a. EMBO J. 1997;16:1620–1627. doi: 10.1093/emboj/16.7.1620. [DOI] [PMC free article] [PubMed] [Google Scholar]
- 42.Kaang B, Kandel ER, Grant SGN. Activation of cAMP-responsive genes by stimuli that produce long-term facilitation in Aplysia sensory neurons. Neuron. 1993;10:427–435. doi: 10.1016/0896-6273(93)90331-k. [DOI] [PubMed] [Google Scholar]
- 43.Lamph WW, Dwarki VJ, Ofir R, Montminy M, Verma IM. Negative and positive regulation by transcription factor cAMP response element-binding protein is modulated by phosphorylation. Proc Natl Acad Sci USA. 1990;87:4320–4324. doi: 10.1073/pnas.87.11.4320. [DOI] [PMC free article] [PubMed] [Google Scholar]
- 44.Lee G, Gilman M. Dual modes of control of c-fos mRNA induction by intracellular calcium in T cells. Mol Cell Biol. 1994;14:4579–4587. doi: 10.1128/mcb.14.7.4579. [DOI] [PMC free article] [PubMed] [Google Scholar]
- 45.Li M, Jia M, Fields RD, Nelson PG. Modulation of calcium currents by electrical activity. J Neurophysiol. 1996;76:2595–2607. doi: 10.1152/jn.1996.76.4.2595. [DOI] [PubMed] [Google Scholar]
- 46.Liu F-C, Graybiel AM. Spatiotemporal dynamics of CREB phosphorylation: transient versus sustained phosphorylation in the developing striatum. Neuron. 1996;17:1133–1144. doi: 10.1016/s0896-6273(00)80245-7. [DOI] [PubMed] [Google Scholar]
- 47.Meister M, Wong ROL, Baylor DA, Shatz CJ. Synchronous bursts of action potentials in ganglion cells of the developing mammalian retina. Science. 1991;252:939–943. doi: 10.1126/science.2035024. [DOI] [PubMed] [Google Scholar]
- 48.Meyer TE, Habener JF. Cyclic adenosine 3′,5′-monophosphate response element binding protein (CREB) and related transcription-activating deoxyribonucleic acid binding proteins. Endocr Rev. 1993;14:269–290. doi: 10.1210/edrv-14-3-269. [DOI] [PubMed] [Google Scholar]
- 49.Morgan JI, Curran T. Stimulus–transcription coupling in the nervous system: involvement of the inducible proto-oncogenes fos and jun. Annu Rev Neurosci. 1991;14:421–451. doi: 10.1146/annurev.ne.14.030191.002225. [DOI] [PubMed] [Google Scholar]
- 50.Nakajima T, Fukamizu A, Takahashi J, Gage FH, Fisher T, Blenis J, Montminy MR. The signal-dependent coactivator CBP is a nuclear target for pp90RSK. Cell. 1996;86:465–474. doi: 10.1016/s0092-8674(00)80119-1. [DOI] [PubMed] [Google Scholar]
- 51.O’Malley DM. Calcium permeability of the neuronal nuclear envelope: evaluation using confocal volumes and intracellular perfusion. J Neurosci. 1994;14:5741–5758. doi: 10.1523/JNEUROSCI.14-10-05741.1994. [DOI] [PMC free article] [PubMed] [Google Scholar]
- 52.Robertson LM, Kerppola TK, Vendrell M, Luk D, Smeyne RJ, Bocchiaro C, Morgan JI, Curran T. Regulation of c-fos expression in transgenic mice requires multiple interdependent transcription control elements. Neuron. 1995;14:241–252. doi: 10.1016/0896-6273(95)90282-1. [DOI] [PubMed] [Google Scholar]
- 53.Rosen LB, Greenberg ME. Stimulation of growth factor receptor signal transduction by activation of voltage-sensitive calcium channels. Proc Natl Acad Sci USA. 1996;93:1113–1118. doi: 10.1073/pnas.93.3.1113. [DOI] [PMC free article] [PubMed] [Google Scholar]
- 54.Sakimura K, Kushiya E, Obinata E, Odani S, Takahashi Y. Molecular cloning and the nucleotide sequence of cDNA for neuron-specific enolase messenger RNA of rat brain. Proc Natl Acad Sci USA. 1985;82:7453–7457. doi: 10.1073/pnas.82.21.7453. [DOI] [PMC free article] [PubMed] [Google Scholar]
- 55.Schilling K, Luk D, Morgan JI, Curran T. Regulation of a fos-lacZ fusion gene: a paradigm for quantitative analysis of stimulus–transcription coupling. Proc Natl Acad Sci USA. 1991;88:5665–5669. doi: 10.1073/pnas.88.13.5665. [DOI] [PMC free article] [PubMed] [Google Scholar]
- 56.Seger R, Krebs EG. The MAPK signaling cascade. FASEB J. 1995;9:726–735. [PubMed] [Google Scholar]
- 57.Shatz CJ. Impulse activity and the patterning of connections during CNS development. Neuron. 1990;5:745–756. doi: 10.1016/0896-6273(90)90333-b. [DOI] [PubMed] [Google Scholar]
- 58.Sheng HZ, Fields RD, Nelson PG. Differential c-fos activation by patterned stimulation. Soc Neurosci Abstr. 1992;18:1333. [Google Scholar]
- 59.Sheng HZ, Fields RD, Nelson PG. Specific regulation of immediate early genes by patterned neuronal activity. J Neurosci Res. 1993;35:459–467. doi: 10.1002/jnr.490350502. [DOI] [PubMed] [Google Scholar]
- 60.Sheng M, Greenberg ME. The regulation and function of c-fos and other immediate-early genes in the nervous system. Neuron. 1990;4:477–485. doi: 10.1016/0896-6273(90)90106-p. [DOI] [PubMed] [Google Scholar]
- 61.Sheng M, Thompson MA, Greenberg ME. CREB: a Ca2+ regulated transcription factor phosphorylated by calmodulin-dependent kinases. Science. 1991;252:1427–1430. doi: 10.1126/science.1646483. [DOI] [PubMed] [Google Scholar]
- 62.Stevens CF. CREB and memory consolidation. Neuron. 1994;13:769–770. doi: 10.1016/0896-6273(94)90244-5. [DOI] [PubMed] [Google Scholar]
- 63.Thayer SA, Miller RJ. Regulation of intracellular free calcium concentration in single rat dorsal root ganglion neurons in vitro. J Physiol (Lond) 1990;425:85–115. doi: 10.1113/jphysiol.1990.sp018094. [DOI] [PMC free article] [PubMed] [Google Scholar]
- 64.Thompson MA, Ginty DD, Bonni A, Greenberg ME. L-type voltage-sensitive Ca2+ channel activation regulates c-fos transcription at multiple levels. J Biol Chem. 1995;270:4224–4235. doi: 10.1074/jbc.270.9.4224. [DOI] [PubMed] [Google Scholar]
- 65.Treisman R. Regulation of transcription by MAP kinase cascades. Curr Opin Cell Biol. 1996;8:205–215. doi: 10.1016/s0955-0674(96)80067-6. [DOI] [PubMed] [Google Scholar]
- 66.Tully T, Preat T, Boynton SC, Del Vecchio M. Genetic dissection of consolidated memory in Drosophila. Cell. 1994;79:35–47. doi: 10.1016/0092-8674(94)90398-0. [DOI] [PubMed] [Google Scholar]
- 67.Van Beveren C, van Straaten F, Curran T, Muller R, Verma IM. Analysis of FBJ-MuSv provirus and c-fos (mouse) gene reveals that viral and cellular fos gene products have different carboxy termini. Cell. 1983;32:1241–1255. doi: 10.1016/0092-8674(83)90306-9. [DOI] [PubMed] [Google Scholar]
- 68.Worley RF, Bhat RV, Baraban JM, Erickson CA, McNaughton BL, Barnes CA. Thresholds for synaptic activation of transcription factors in hippocampus: correlation with long-term enhancement. J Neurosci. 1993;13:4776–4786. doi: 10.1523/JNEUROSCI.13-11-04776.1993. [DOI] [PMC free article] [PubMed] [Google Scholar]
- 69.Xia Z, Dudek H, Miranti CK, Greenberg ME. Calcium influx via the NMDA receptor induces immediate early gene transcription by a MAP kinase/ERK-dependent mechanism. J Neurosci. 1996;16:5425–5436. doi: 10.1523/JNEUROSCI.16-17-05425.1996. [DOI] [PMC free article] [PubMed] [Google Scholar]
- 70.Xing J, Ginty DD, Greenberg ME. Coupling of the RAS-MAPK pathway to gene activation by RSK2, a growth factor-regulated CREB kinase. Science. 1996;273:959–963. doi: 10.1126/science.273.5277.959. [DOI] [PubMed] [Google Scholar]
- 71.Yin JCP, Wallach JS, Del Vecchio M, Wilder EL, Zhou H, Quinn WG, Tully T. Induction of a dominant-negative CREB transgene blocks long-term memory in Drosophila. Cell. 1994;81:107–115. doi: 10.1016/0092-8674(94)90399-9. [DOI] [PubMed] [Google Scholar]
- 72.Yin JCP, Del Vecchio M, Zhou H, Tully T. CREB as a memory modulator: induced expression of dCREB2 activator isoform enhances long-term memory in Drosophila. Cell. 1995;81:107–115. doi: 10.1016/0092-8674(95)90375-5. [DOI] [PubMed] [Google Scholar]