

Abstract
An in vitro injury model was used to examine the electrophysiological changes that accompany reactive gliosis. Mechanical scarring of confluent spinal cord astrocytes led to a threefold increase in the proliferation of scar-associated astrocytes, as judged by bromodeoxyuridine (BrdU) labeling. Whole-cell patch-clamp recordings demonstrated that current profiles differed absolutely between nonproliferating (BrdU−) and proliferating (BrdU+) astrocytes. The predominant current type expressed in BrdU− cells was an inwardly rectifying K+ current (KIR; 1.3 pS/pF). BrdU− cells also expressed transient outward K+ currents, accounting for less than one-third of total K+ conductance (G). In contrast, proliferating BrdU+ astrocytes exhibited a dramatic, approximately threefold reduction in KIR (0.45 pS/pF) but showed a twofold increase in the conductance of both transient (KA) (0.67–1.32 pS/pF) and sustained (KD) (0.42–1.10 pS/pF) outwardly rectifying K+ currents, with aGKIR:GKD ratio of 0.4. Relative expression ofGKIR:GKD led to more negative resting potentials in nonproliferating (−60 mV) versus proliferating astrocytes (−53 mV; p = 0.015). Although 45% of the nonproliferating astrocytes expressed Na+ currents (0.47 pS/pF), the majority of proliferating cells expressed prominent Na+ currents (0.94 pS/pF). Injury-induced electrophysiological changes are rapid and transient, appearing within 4 hr postinjury and, with the exception of KIR, returning to control conductances within 24 hr. These differences between proliferating and nonproliferating astrocytes are reminiscent of electrophysiological changes observed during gliogenesis, suggesting that astrocytes undergoing secondary, injury-induced proliferation recapitulate the properties of immature glial cells. The switch in predominance from KIR to KD appears to be essential for proliferation and scar repair, because both processes were inhibited by blockade of KD.
Keywords: gliosis, BrdU, patch clamp, potassium currents, proliferation, sodium currents
Unlike neurons, glial cells are able to proliferate in the postnatal and mature brain (Korr, 1986), and gliogenesis continues throughout childhood in most mammals (Gensert and Goldman, 1996). In the adult, proliferation-competent glial cells are thought to participate in glial scar formation (reactive gliosis). Gliosis may involve induction of formerly postmitotic cells to dedifferentiate and proliferate (Hatten et al., 1991) and can be associated with trauma (Reier, 1986), infarct lesions (Kraig and Jaeger, 1990), Alzheimer’s plaques (Murphy et al., 1992), epileptic seizure foci (Pollen and Trachtenberg, 1970), neurotoxicity (Niquet et al., 1994), ischemic injury (Kraig and Jaeger, 1990), and mechanical injury (Reier, 1986). Thus, gliogenesis and gliosis are temporally and functionally distinct modes of glial proliferation, the former prevailing during early brain development and the latter an integral part of wound healing.
Proliferating glial cells differ from nonproliferating cells in their growth factor and cytokine responsiveness (Westermark et al., 1995), cytoskeletal protein expression (Dahl et al., 1981; Gallo and Armstrong, 1995), and electrophysiological properties. The latter have been characterized most comprehensively in O-2A glial progenitor cells, which are endowed with voltage- and ligand-activated ion channels (Bevan et al., 1987; Barres et al., 1990a,b; Sakatani et al., 1992;Gallo et al., 1994). On commitment to either astrocyte or oligodendrocyte lineage, their ion channel complement changes markedly (Sontheimer et al., 1989; Barres et al., 1990b). Several studies suggest that these changes are necessary in determining cell cycle progression. Specifically, the expression and/or activity of potassium channels have been linked to glial proliferation. Thus in O2-A cells (Gallo et al., 1996), Schwann cells (Chiu and Wilson, 1989), retinal glial cells (Puro et al., 1989), and spinal cord astrocytes (Pappas et al., 1994), blockade of K+ channels retards proliferation. Underlying mechanisms are not well understood, but studies suggest that intracellular pH (Pappas et al., 1994) or intracellular Na+ (Knutson et al., 1997) are critically important. Moreover, involvement of ion channel activity in cell cycle control has been documented for other inexcitable cells (for review, see Sontheimer, 1995).
Little is known concerning changes in membrane properties in glial cells undergoing secondary, injury-induced proliferation, and the goal of the present study was to fill this void. Our studies were facilitated by the development of an in vitro scar model (Yu et al., 1993), resembling reactive gliosis in many respects (Yu et al., 1993; Hou et al., 1995). In this in vitro model, astrocytes show upregulation of both mitotic activity and glial fibrillary acidic protein (GFAP) expression, comparable to that seen in vivo(Bignami and Dahl, 1976; Armaducci, 1981; Aquino, 1988). We compared electrophysiological properties of scar-associated glial cells with uninjured control astrocytes. On being induced to proliferate, scar-associated cells demonstrated a rapid and transient switch in K+ channel complement from inwardly to outwardly rectifying K+ channels. These changes are reminiscent of those seen during glial development, suggesting that secondary proliferation recapitulates membrane properties seen during gliogenesis. Pharmacological blockade of outwardly rectifying potassium currents retards glial proliferation and scar healing, suggesting that their activity is essential for these processes.
MATERIALS AND METHODS
Cell culture. Primary spinal cord astrocyte cultures were obtained from P0–P1 Sprague Dawley rat pups. Pups were put on ice, and spinal cords were dissected from midcervical to lumbar regions. Tissue was excised in filter-sterilized Complete saline solution (CSS) containing the following (in mm): 137 NaCl, 5.3 KCl, 1 MgCl2, 25 glucose, 10 HEPES, and 3 CaCl2, adjusted to pH 7.2 by NaOH. Then tissue was stripped of meninges and blood vessels, minced, and incubated for 20 min at 37°C and 95%O2/5%CO2 in CSS plus 0.5 mm EDTA, 1.65 mml-cysteine, and 30 U/ml papain (Worthington, Freehold, NJ). Enzyme solution was aspirated, and tissue was rinsed with Earle’s Minimal Essential Media (EMEM; Life Technologies, Grand Island, NY) supplemented with 20 mmglucose, 10% fetal calf serum (FCS; HyClone, Logan, UT), 500 U/ml of penicillin/streptomycin, 1.0 mg/ml trypsin inhibitor, and 1.0 mg/ml BSA. Tissue was dissociated by trituration (20×) with a fire-polished Pasteur pipette. Cells were plated on poly-ornithine/laminin-coated 12 mm glass coverslips (MacAlaster Bicknell, New Haven, CT) at a density of 1.0 × 10⁶/ml. Cells were maintained at 37°C and 95%O2/5%CO2 in EMEM supplemented with 20 mm glucose, 10% FCS (HyClone), and 500 U/ml penicillin/streptomycin. The medium was changed every 3–4 d. Cultures were >95% positively immunoreactive for GFAP (rabbit monoclonal, INCSTAR, Stillwater, MN). All chemicals were obtained from Sigma (St. Louis, MO), unless otherwise stated.
Electrophysiology. Whole-cell voltage-clamp recordings were obtained via standard methods (Hamill et al., 1981). Patch pipettes were made from thin-walled (outer diameter 1.5 mm, inner diameter 1.12 mm) borosilicate glass (TW150F-4, WPI, Sarasota, FL). Electrodes typically had resistances of 4–6.5 MΩ when filled with a solution containing (in mm) 145 KCl, 1 MgCl2, 10 EGTA, 10 HEPES sodium salt, and 0.8 mg/ml of Lucifer yellow dilithium salt, with the pH adjusted to 7.3 with Tris(hydroxymethyl)aminomethane (Tris). Recordings were made from astrocytes >8 d in vitroon the stage of an inverted Nikon Diaphot microscope equipped with Hoffman Modulation Contrast optics. Cells were perfused continuously at room temperature with saline containing (in mm) 130 NaCl, 5 KCl, 1.2 MgSO4, 1.6 Na2HPO4, 0.4 NaH2PO4, 10.5 glucose, and 32.5 HEPES, adjusted to pH 7.4 with NaOH. Added to the saline just before recording was 1 mm CaCl2.
Current recordings were obtained with an Axopatch 1-B amplifier (Axon Instruments, Foster City, CA). Current signals were low-pass-filtered at 2 kHz and were digitized on-line at 2.5–333 kHz, using a Digidata 1200 digitizing board (Axon Instruments) interfaced with an IBM-compatible computer (Dell P100). Data acquisition and storage were conducted with the use of pClamp 6 (Axon Instruments). Cell capacitances and series resistances were measured directly from the amplifier, and series resistance compensation was set at ∼80% to reduce voltage errors. The entrance potential of the cell served as an estimate of the resting potential of the cell. Unless otherwise stated, currents were leak-subtracted (P/5). Currents in response to varied voltage steps were analyzed and measured with Clampfit (Axon Instruments); the resulting raw data were graphed and plotted with Origin 4.0 (MicroCal, Northampton, MA). Ionic conductances were calculated by dividing peak current amplitudes by the ionic driving force [Ipeak/(Em− Erev)]. The ionic reversal potentials calculated for the solutions used were as follows:EK = −86 mV; ENa = 65 mV; ECl = 2 mV. Specific conductance densities (pS/pF) were calculated by dividing the ionic conductance by the cell capacitance. Unless otherwise stated, all values are reported as mean ± SEM, with n being the number of cells sampled. Normalized peak conductance values were plotted versus membrane potential for individual cells, and the resulting activation and inactivation curves were fit to the Boltzmann equation (given below). Then the mean and SD of these curves were plotted and fit to the Boltzmann equation:
Phase contrast photomicrographs of individual cells were acquired during recording by using a CCD camera and a frame grabber (Snappy; Play, Incorporated, Rancho Cordova, CA).
Pharmacology. Pharmacological properties of K+ currents were determined by perfusing with the following compounds diluted in recording media: 100 μmCsCl or 2 mm 4-aminopyridine (4-AP). For experiments determining the sensitivity to tetraethylammonium chloride (TEA-Cl), 20 mm NaCl and 20 mm HEPES were removed from the normal bath solution and replaced with 40 mm TEA-Cl. To determine the tetrodotoxin (TTX) sensitivity of sodium currents, we diluted TTX in bath solution and applied it by microperfusion directly above the cell. To facilitate kinetic recordings, we isolated Na+ currents by recording in a solution that replaced the KCl in the pipette solution with 20 mm TEA-Cl, 30 mm glucose, and 125 mmN-methyl-d-glucamine (NMDG).
Bromodeoxyuridine (BrdU) correlation. BrdU was incorporated into proliferating cells during S-phase. Two hours before electrophysiological recording, cells were incubated with BrdU labeling reagent (Zymed Laboratories, South San Francisco, CA). Recorded cells were filled with Lucifer yellow during recording (see pipette solution), and postrecordings were fixed for at least 24 hr in the dark in 4% paraformaldehyde. A biotinylated mouse anti-BrdU monoclonal (Zymed) was used as the primary antibody, followed by a rhodamine-conjugated avidin/streptavidin secondary antibody (Vector Laboratories, Burlingame, CA). BrdU-correlated cells were identified individually by their Hoffman contrast photomicrograph taken during recording and by double labeling for Lucifer yellow and BrdU.
Proliferation assays. Mechanically scarred coverslips and their age-matched controls were labeled for 2 hr with BrdU at various time points postscar, rinsed, and fixed in 70% ethanol at −20°C and stained by a biotinylated BrdU antibody and a streptavidin-peroxidase and diaminobenzidine (DAB) developing kit with a hematoxylin counterstain (Zymed). At a magnification of 20×, eight random fields of fixed size were selected, and a ratio of BrdU-positive/negative cells was calculated per total number of cells. For scar preparations, fields of identical size and cell numbers as the control fields, but adjacent to the scar, were selected. Changes in the number of proliferating cells were expressed as a percentage of control.
Incorporation of 3H-thymidine was used as a quantitative marker for DNA synthesis. Cells were incubated with 1 μCi/ml radiolabeled thymidine ([methyl-3H]thymidine) for 120 min at 37°C. Culture dishes were rinsed once with ice-cold PBS, 1N perchloric acid, 0.5N perchloric acid, and 95% ethanol and solubilized with 0.3N NaOH for 30 min at 37°C. An aliquot (50 μl) was used for cell protein determination, using the bicinchroninic assay (Pierce, Rockford, IL) (Goldschmidt and Kimelberg, 1989). The remaining cell suspension was mixed with Ultima Gold, and radioactivity was determined with a scintillation counter.
Time-lapse video microscopy. For time-lapse experiments astrocytes were cultured, plated, and maintained as described for electrophysiological recordings. Coverslips were scarred mechanically and placed on the stage of a LU-CB-1 tissue culture chamber (Medical Systems, Greenvale, NY) equipped with an NP-2 incubator (Nikon, Japan), which maintained temperature at 37°C and atmosphere at 95% O2/5% CO2. Cells were visualized by a Nikon Diaphot inverted microscope with phase-contrast optics and a 20× objective. Images were captured on a time-lapse VHS video recorder/player and digitized off-line by a frame grabber (Snappy). Cells were incubated with control growth media (see above) or growth media supplemented with 20 μm cytosine β-d-arabinofuranoside (Ara-C), 2 mm 4-AP, 40 mm TEA, or 10 μm TTX.
Statistical analysis. All statistical analysis was done with GraphPAD (InStat). Student’s unpaired, two-tailed t test was used for data that followed normal SD distributions.
RESULTS
To study the membrane properties of astrocytes at gliotic scars, we used a culture model of glial cell injury recently characterized byYu et al. (1993). Purified primary cultures of neonatal spinal cord astrocytes were grown to confluency (>8 d in vitro) before being scarred mechanically by gently scratching the cell monolayer with a sterile pipette tip, resulting in scars that were 150–200 μm wide (Fig. 1). For simplicity, we refer to this injury as an in vitro glial scar without claiming that this injury model duplicates glial scarring in vivo. Astrocytes associated with the in vitro scar, however, display several of the hallmarks of gliosis in vivo, including upregulation of glial fibrillary acidic protein (GFAP; Fig.1C,D), cell proliferation (Fig. 3C,D), and responsiveness to basic fibroblast growth factor (Yu et al., 1993; Hou et al., 1995).
Fig. 1.
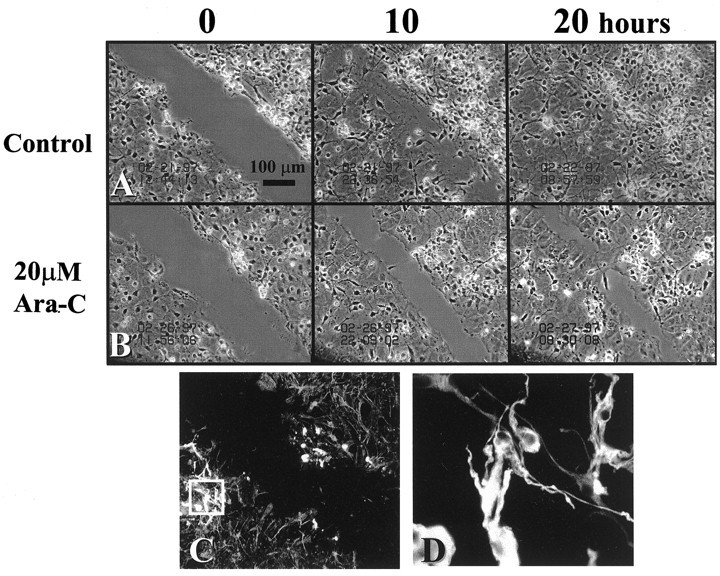
Time-lapse micrographs of in vitroscar at 0, 10, and 20 hr postinjury. A, Scar closure in the presence of normal growth medium. B, Scar-associated proliferation was inhibited primarily under the influence of the antimitotic agent Ara-C (20 μm), and scar closure at 20 hr resulted primarily from cell migration. C, GFAP immunoreactivity at the scar (magnification, 20×). At 10 hr postinjury, astrocytes within 250 μm from the scar are intensely GFAP-immunoreactive. D, The boxed area in C, shown at 100× magnification, illustrates specific filament staining organized around the nucleus.
Fig. 3.
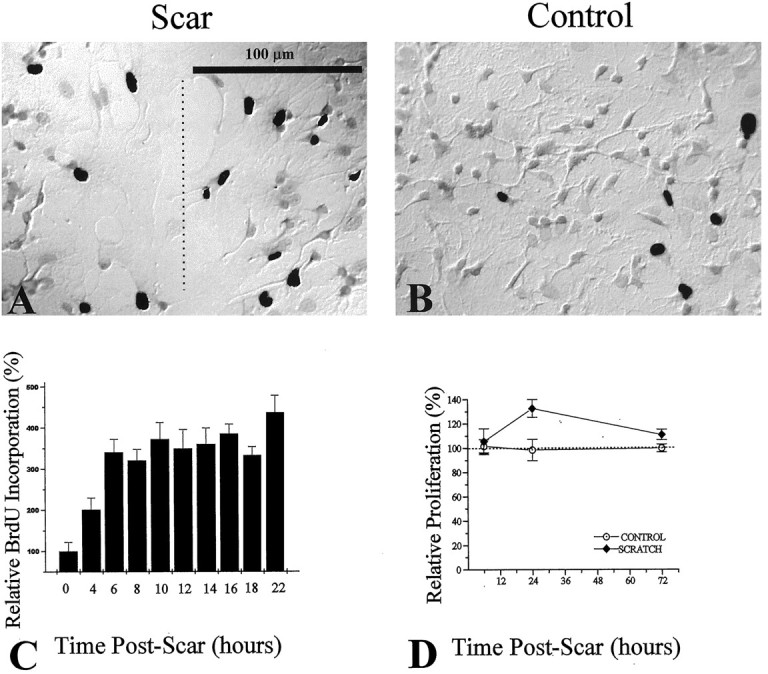
Assessment of scar-associated proliferation, using BrdU and [3H]-thymidine incorporation. BrdU incorporation was visualized by using a biotinylated monoclonal antibody against BrdU and a streptavidin-peroxidase/DAB enzyme reaction. BrdU+ cells are indicated by DAB-reacted cells, which appear as black nuclei in the grayscale photograph. A, After a 2 hr pulse with BrdU labeling reagent, an injury-induced increase in the number of BrdU-positive cells at the region of the scar (dashed line) was observed, as compared with noninjured control cultures (B). C, Ratios of BrdU-positive/total cell number were assessed as a function of time postinjury. Ratios for each time point were normalized to control ratios (control = 0 hr postscar). D, Changes in proliferation were assessed by [3H]-thymidine incorporation relative to control. An increase in proliferation was seen at 24 hr postinjury and peaked at 35% above control proliferation.
Using time-lapse video microscopy, we monitored scar closure as cells became confluent with the surrounding cell monolayer, which typically was achieved within 20 hr (Fig. 1A). Scar closure resulted from both migration and proliferation of scar-associated cells. Cell bodies routinely were observed condensing, rounding-up, and pulling apart to give rise to sister cells (Fig.2). When cell proliferation was inhibited by incubation with the mitogenic inhibitor Ara-C (20 μm), scar closure was delayed and greatly retarded (Fig.1B). Under those conditions scar closure primarily involved the migration of postmitotic cells into the scar, resulting in noticeably lower cell densities at the scar region (Fig.1B at 20 hr).
Fig. 2.

Proliferating cells are associated with in vitro scar. After mechanical injury, mitotic events were observed routinely via time-lapse video microscopy. Consecutive time-lapse frames depict three scar-associated cells dividing within the same field of view. Mitotic cells are indicated by anumber to their right and, after mitosis, this number remains next to one of the sister cells. The first frame was taken at 18 hr postinjury and was set arbitrarily at time =0. Subsequent panels indicate the time course in minutes in the bottom left corner. The three mitotic events occur within a total of 90 min. Scale bar, 50 μm.
To assess quantitatively the proliferation of astrocytes associated with the scar, we used BrdU and 3H-thymidine, DNA markers that are incorporated selectively by dividing cells in S-phase. The monolayer of cells was incubated for 2 hr with BrdU labeling reagent and then stained for BrdU reactivity with a biotinylated anti-BrdU monoclonal and a streptavidin-peroxidase/DAB resolution kit with a hematoxylin counterstain. We used the same 2 hr BrdU labeling pulse for scarred coverslips, but we staggered the labeling episodes every 2 hr over the course of scar closure so that proliferation could be determined at any given time from 4 to 22 hr postinjury. Figure3 shows photomicrographs with representative examples of BrdU immunoreactivity of scar-associated cells 14 hr postinjury (Fig. 3A) and noninjured control sister cultures (Fig. 3B). BrdU-positive cells are depicted as dark nuclei resulting from the DAB reaction. Their number was greatly enhanced within 250 μm from the scar, as compared with control cultures. The percentage of BrdU-positive cells was determined for eight random fields on both control and scarred coverslips at various times (4–22 hr) after injury, and mean values were plotted in Figure 3C. In uninjured control cultures only 3% of cells were BrdU-positive after a 2 hr pulse of BrdU. This is similar to values previously reported for confluent spinal cord astrocytes (Pappas et al., 1994). At 4 hr postinjury there was a twofold increase in the percentage of proliferating cells at the scar (p= 0.014); after 6 hr, proliferation was enhanced more than threefold (p = 0.006). This increase in the percentage of proliferating cells at the scar remained elevated for 22 hr postinjury. Cells within 250 μm from the scar showed intense labeling with GFAP antibodies, as did the majority of the uninjured cell monolayer (>95%; Fig. 1C,D).
Using 3H+-thymidine uptake as a quantitative marker for DNA synthesis, we determined the relative change in scar-induced glial proliferation over that of control sister cultures for the entire coverslip (Fig. 3D). Because scars were inflicted after confluency had been reached (>8 d in vitro), proliferation rates before the insult were relatively small and accounted for <5% of the total proliferation observed at ≥3 d in vitro. Postinjury, proliferation showed a transient increase that peaked ∼24 hr. Overall, proliferation increased by 10% (SD 5.5%) with a maximum increase of 35%. This transient rise in proliferation was inhibited completely by the antimitotic agent Ara-C (20 μm), which also inhibited scar-associated proliferation during time-lapse studies (Fig.1B).
Changes in ion channel complement induced by in vitro scarring
Several studies have established independently that proliferating glial progenitors vary electrophysiologically from differentiated astrocytes or oligodendrocytes (Sontheimer et al., 1989; Ransom and Sontheimer, 1995; Roy and Sontheimer, 1995), suggesting that the transition from progenitor to differentiated, nondividing cell correlates with profound changes in ion channel expression. In light of these findings, we were curious as to whether biophysical changes accompany dedifferentiation and injury-induced “secondary” proliferation of astrocytes. To assess such changes, we obtained whole-cell recordings at defined time periods over 32 hr postinjury. Individual cells were preincubated with BrdU labeling reagent for 2 hr, filled with Lucifer yellow during whole-cell recording, and immunoreacted for BrdU postrecording. This allowed for the identification of individual cells and the correlation of their current profile to their proliferative status.
A representative example of a BrdU-positive cell recorded at a scar is shown in Figure 4. Photomicrographs show the phase image (Fig. 4A), Lucifer yellow fill (Fig.4B), and BrdU staining (Fig. 4C). Although only the recorded cell was filled with Lucifer yellow, at least two neighboring cells were also BrdU+. Shown in addition are representative whole-cell recordings characteristic of all BrdU-positive cells from which recordings were obtained (Fig.4D–I). Of 317 scar-associated cells recorded, 58 were identified conclusively as BrdU-positive, 32 were BrdU-negative, and the rest either were not recovered for staining or were equivocal. The current–voltage relationship of BrdU+ cells consistently showed strong outward rectification (Fig. 4D). With both de- and hyperpolarizing voltage steps (10 msec), all BrdU+cells expressed predominantly outward currents (Fig.4E), with the predominant inward currents being sodium. To activate fully any inwardly rectifying potassium currents (KIR), we used a voltage step protocol that depolarized the cell to 0 mV and then stepped the membrane to voltages between −10 and −180 mV. Although this protocol still activated outward K+ currents, it removed all transient outward current components. In response to this protocol, BrdU+ cells showed little KIR current (Fig. 4F). Figure 4, G–I, shows the isolation of transient K+ current by standard procedures (Connor and Stevens, 1971). Currents were recorded first from a prepulse potential of −110 mV. When a more depolarized prepulse (−50 mV) was applied, a transient outward potassium current that resembled the “A-type” current (KA) was inactivated completely, and the sustained or “delayed” current (KD) was isolated (Fig. 4H). Point-by-point subtraction of the current obtained with a prepulse of −50 mV from that obtained with the prepulse at −110 mV allowed for the isolation of this transient potassium current (Fig.4I).
Fig. 4.

Physiological properties of scar-associated BrdU+ cells. A–C, Representative examples of Hoffman contrast, Lucifer yellow, and BrdU/TRITC photomicrographs, respectively. The asterisk indicates the location of the scar. Scale bar, 20 μm. D–I, Current traces from a BrdU-positive cell at the scar as elicited by the voltage protocols (insets to the right).D, The current–voltage relationship showed that BrdU-positive cells demonstrate predominantly outward currents.E, Inward sodium currents and large outward potassium currents were activated by hyperpolarizing and depolarizing voltage steps. F, A tail current protocol elicited virtually no inwardly rectifying potassium currents in proliferating cells.G, Transient and sustained outwardly rectifying potassium currents were elicited in proliferating cells.H, The sustained current was isolated by depolarizing steps from a −50 mV prepulse. Point-by-point subtraction of the sustained current from the composite outward current allowed for the isolation of the transient outward potassium current (G − H =I).
Transient and sustained outward currents were differentially sensitive to TEA and 4-AP. As is the case for most neuronal A-currents (Rudy, 1988), the transient outward potassium currents in astrocytes were insensitive to 40 mm TEA (Fig.5B) but were inhibited almost completely by the addition of 2 mm 4-AP (Fig.5C). In contrast, sustained K+ currents were equally sensitive to TEA and 4-AP, each reducing currents by ∼50%. TEA and 4-AP in combination essentially blocked all outward currents (Fig. 5).
Fig. 5.
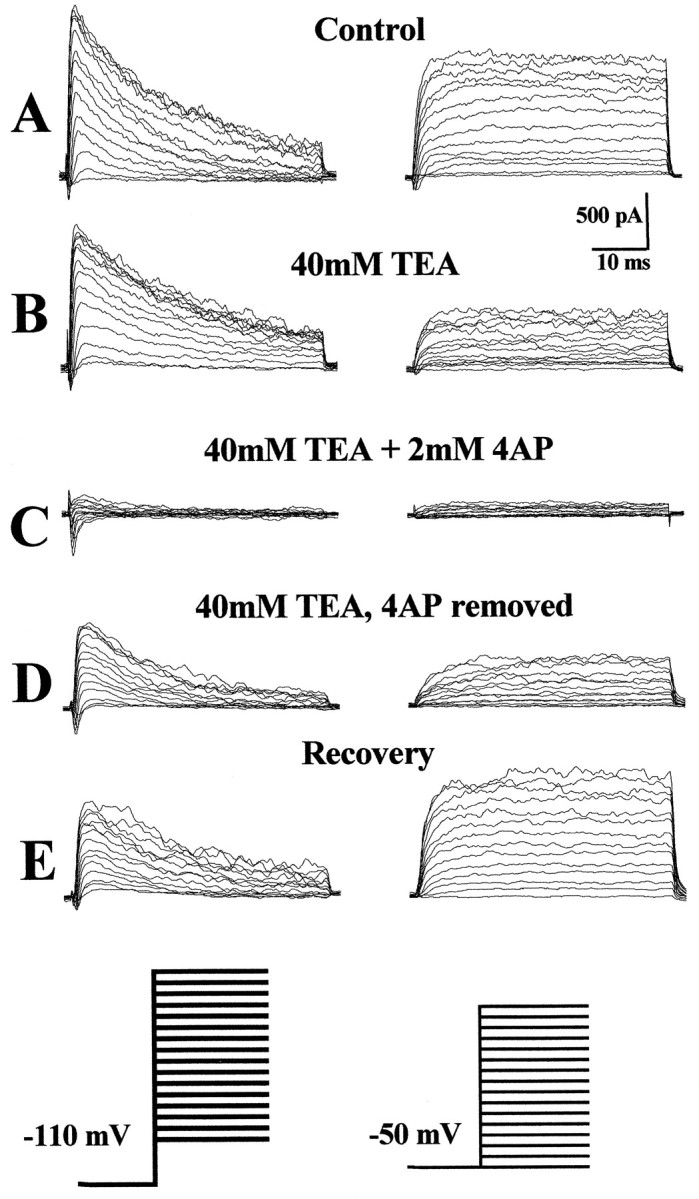
Pharmacological properties of K+ currents observed in BrdU+cells. A–E, The isolated transient and sustained outwardly rectifying potassium currents from a typical scar-associated cell (6 hr postinjury) recorded before and after the application of potassium channel blockers, as indicated. A, In normal recording solution large transient and sustained currents are recorded.B, Application of 40 mm TEA inhibited the sustained K+ current by ∼50% but had no effect on the transient current. C, The addition of 4-AP (2 mm) completely inhibited the transient potassium currents and also inhibited the residual sustained K+ current that was not inhibited by TEA. D, To demonstrate that 4-AP inhibition of the sustained current is specific and not attributable to current rundown or time-dependent TEA inhibition, we show that, in the absence of 4-AP but in the presence of TEA, currents recover to levels previously seen in the presence of TEA alone.E, Currents show partial recovery on removal of potassium channel blockers. A–E, n= 14.
BrdU-negative cells express primarily inwardly rectifying potassium currents
For comparison, recordings were obtained from nonproliferating BrdU-negative cells on noninjured control coverslips. Figure 6 shows photomicrographs and representative recordings of a BrdU-negative cell. MicrographsA through C depict the Hoffman contrast, Lucifer yellow, and BrdU staining, respectively. A total of 111 control cells were recorded, of which 55 cells were identified unequivocally as BrdU-negative, whereas the remainder were either BrdU-positive or equivocal. We applied the same voltage step protocols described for scar-associated cells. The current–voltage relationship (Fig.6D) showed marked inward rectification. Both inward and outward currents could be identified by 80 msec voltage steps ranging from −130 to 100 mV (Fig. 6E). Because the outward current activated by this protocol was much smaller than the inward current, these currents were not leak-subtracted. Voltage protocols to isolate transient outward currents revealed the consistent presence of A-currents in these cells (Fig. 6F), which, as in BrdU+ cells, was sensitive to 4-AP (data not shown). Large, inwardly rectifying potassium currents (KIR) were activated when a prepulse of 0 mV was applied and cells were stepped to more negative potentials (Fig.6G). This KIR current was identical in its kinetics and voltage dependence to those previously described for spinal cord astrocytes in vitro and in situ(Sontheimer et al., 1992; Ransom and Sontheimer, 1995). As we (Ransom and Sontheimer, 1995) and others (Barres et al., 1988; Tse et al., 1992; Newman, 1993) have described previously, KIR currents were highly sensitive to 100 μm extracellular Cs+ (Fig. 6G).
Fig. 6.

Physiological properties of BrdU-negative control cells. A–C, The Hoffman contrast, Lucifer yellow, and BrdU/TRITC photomicrographs, respectively, for a nonproliferating control cell. D–G, The current responses of a BrdU-negative cell to the applied voltage protocols (insets to right). D, The current–voltage relationship demonstrated predominantly inwardly rectifying conductance. E, Both inward and outward potassium currents were elicited by hyperpolarizing/depolarizing voltage steps. In this example, no detectable sodium currents were seen; however, ∼45% of nonproliferating cells demonstrateINa+. F, Outward currents were mediated predominantly by transient potassium currents shown after point-by-point subtraction (see Results).G, A tail current protocol typically elicited large KIR currents in BrdU-negative cells. These currents were sensitive to 100 μm Cs+ and demonstrated partial recovery on its removal (n = 8).
Interestingly, BrdU− cells associated with the scar expressed KIR currents at comparable conductance density (1.07 pS/pF ± 0.2, n = 32) to those of nonscarred controls (1.30 pS/pF ± 0.2). Similarly, the KIRconductance density of control cells that were BrdU+(0.47 pS/pF ± 0.1, n = 10) was comparable to that seen in scar-associated cells (0.45 pS/pF ± 0.05), suggesting that the proliferative state rather than the preceding injury determines KIR current expression.
Sodium currents in scar-associated versus control cells
In 79% of scar-associated and ∼45% of control cells, transient inward currents could be evoked by 8 msec depolarizing voltage steps from −70 to 80 mV, preceded by a prepulse of −110 mV (Fig.7A). Using isolation solutions, we determined the steady-state inactivation of these currents by using a protocol that applied varied prepulse potentials between −160 and −30 mV (200 msec), followed by a step at which currents were maximally activated (−10 mV) (Fig. 7B). In both proliferating and nonproliferating cells, currents activated at approximately −40 mV, peaked near −10 mV, and reversed at 60 mV, which is near the predicted reversal potential for Na+ ions (65 mV) (Fig. 7C;n = 11). We also determined steady-state activation and inactivation of sodium currents for control (Fig. 7D) and scar-associated cells (Fig. 7E). The half-maximal inactivation was −66 mV in control cells (n = 4) and −60 mV in scar-associated cells (n = 8); values for half-maximal activation were −35 mV (n = 4) and −25 mV (n = 13), respectively. To confirm that these currents were mediated by Na+ channels, we applied 10 μm TTX, which completely inhibited currents on both control and scar-associated coverslips (Fig. 7F,G).
Fig. 7.

Sodium currents in scar-associated and control cells. A, Activation of Na+ currents was studied using a protocol of a prepulse at −110 mV to remove sodium inactivation and then steps to voltages ranging from −70 to 80 mV.B, Steady-state inactivation of Na+currents was determined by applying a varied prepulse potential ranging from −160 to −30 mV, followed by a voltage step at which sodium currents were maximally activated (−10 mV). C, The peakINa+ amplitude was averaged for 11 cells and plotted as a function of voltage. Sodium currents activated at approximately −40 mV reached a maximum near −10 mV and reversed at 60 mV, which is close to theENa of 65 mV. D,E, For inactivation curves the normalized peak current for each cell (n = 6) was plotted as a function of membrane potential, and each was fit to the Boltzmann equation. The mean normalized peak current and mean Boltzmann fit were graphed. For the activation curve normalized peak conductance was plotted versus membrane potential, and the mean of the individual activation curves and the mean Boltzmann fit were graphed. The half-maximal inactivation was −66 mV in control cells (n = 4) and −60 mV in scar-associated cells (n = 8); values for half-maximal activation were −35 mV (n = 4) and −25 mV (n = 13), respectively. F, G, Sodium currents in both control and scar-associated cells were inhibited completely by 10 μm TTX.
To compare changes in ion channel expression between BrdU-positive and BrdU-negative cells, we determined specific conductance densities for each of the current components by dividing conductances by whole-cell capacitance (pS/pF). These values, along with resting membrane potential and whole-cell capacitance values, were summarized and analyzed statistically (Table 1). BrdU-positive cells were significantly smaller in cell size, as measured by membrane capacitance, and had significantly more positive resting potentials than nonproliferating cells. Moreover, there was a striking twofold increase in the specific conductance of both the sustained (KD) and transient (KA) outward potassium currents in BrdU-positive cells (p < 0.0001 for both). In addition, there was a twofold increase in sodium conductance in BrdU-positive cells (p = 0.041). The most dramatic difference observed was with respect to changes in KIR conductance. In proliferating cells, it decreased to 35% of that in nonproliferating cells (p < 0.0001). We saw no significant difference between the two groups in terms of outward potassium/sodium conductance ratios (GKD/GNa andGKtotal/GNa); however, the ratio ofGKIR/GNa was significantly larger in nonproliferating cells (p = 0.003), which indicates that these cells have a much larger inward potassium current at rest.
Table 1.
BrdU-positive cells versus BrdU-negative cells
| BrdU-negative | BrdU-positive | Significance | |
|---|---|---|---|
| Cell capacitance, pF | 16.0 ± 2.1 | 9.30 ± 0.7 | p = 0.0025 |
| n = 55 | n = 58 | ||
| Resting potential, mV | −60 ± 1.6 | −53 ± 2.3 | p = 0.015 |
| n = 55 | n = 58 | ||
| SpecificGKD, pS/pF | 0.420 ± 0.1 | 1.10 ± 0.1 | p < 0.0001 |
| n = 55 | n = 57 | ||
| Specific GKA, pS/pF | 0.67 ± 0.1 | 1.32 ± 0.1 | p < 0.0001 |
| n = 55 | n = 58 | ||
| SpecificGNa, pS/pF | 0.47 ± 0.1 | 0.94 ± 0.2 | p = 0.041 |
| n = 55 | n = 58 | ||
| Specific GKIR, pS/pF | 1.30 ± 0.2 | 0.45 ± 0.05 | p < 0.0001 |
| n = 55 | n = 58 | ||
| RatioGKD/GKIR, pS/pF | 0.94 ± 0.3 | 2.94 ± 0.4 | p = 0.0001 |
| n = 53 | n = 51 | ||
| RatioGKD/GNa, pS/pF | 1.09 ± 0.3 | 1.31 ± 0.2 | Not significant |
| n = 29 | n = 46 | ||
| RatioGKIR/GNa, pS/pF | 1.20 ± 0.3 | 0.39 ± 0.1 | p = 0.003 |
| n = 25 | n = 43 | ||
| RatioGΣK/GNa, pS/pF | 3.59 ± 0.6 | 3.92 ± 0.5 | Not significant |
| n = 29 | n = 46 |
Electrophysiological changes over time postinjury
To assess the time over which these electrophysiological changes occurred after injury, we determined the changes in the conductance densities of the various current types as a function of time postinjury. This analysis was restricted to those cells unequivocally identified as BrdU+ (n = 58) or BrdU− (n = 55). Mean values of conductance densities for the four main current types described were plotted as a function of time postinjury for BrdU+and BrdU− cells (Fig.8; BrdU− values = 0 hr postscar). These data suggest that electrophysiological changes are rapid, with the most significant changes in the membrane properties of proliferating cells occurring within 4 hr postinjury. With the exception of KIR, all other conductances return nearly to control values within 24 hr postinjury, a time at which scar closure is complete (see Fig. 1). A twofold increase in the specific conductance of the KD (Fig. 8, filled squares) was observed at 4 hr postinjury (p = 0.0005). Likewise, a significant increase in the specific conductance of the KA current (Fig. 8,filled circles) was seen within 4 hr (p = 0.05); however, the maximal increase over control conductance values was seen at 6 hr postscar (p = 0.002). Sodium conductances (Fig. 8,shaded triangles) also increased significantly within 4 hr (p = 0.05) and reached maximal values over control at 6 hr postinjury (p < 0.0001). A significant decrease in the conductance of the KIR (Fig. 8,x) was observed as early as 4 hr postscar (p = 0.05) and remained significantly decreased even at 24 hr postinjury (p = 0.03).
Fig. 8.

Time course of electrophysiological changes after injury. A total of 58 BrdU-positive cells were recorded at various time points, and the mean specific conductances of KD, KA, Na+, and KIR were plotted as a function of time postinjury. The mean specific conductances for 55 BrdU-negative (control) cells were plotted at 0 hr. Significant (asterisk) electrophysiological changes in all ionic conductances were observed at 4 hr postinjury. There was a twofold increase in the specific conductance of the KD(filled squares) at 4 hr postinjury (p = 0.0005). The specific conductance of the KA current (filled circles) increased within 4 hr (p = 0.05); however, the maximal increase over control conductance values was observed at 6 hr postscar (p = 0.002). Sodium conductances (shaded triangles) increased significantly within 4 hr (p = 0.05) and reached maximal values over control at 6 hr postinjury (p < 0.0001). In contrast, the conductance of the KIR(x) decreased significantly within 4 hr postscar (p = 0.05) and remained at this level for up to 24 hr postinjury (p = 0.03).
K+ channel activity is required for astrocyte proliferation and scar closure
Because we observed changes in the relative expression of Na+ and K+ channels in cells that were induced to proliferate, we used time-lapse video microscopy to investigate whether selective pharmacological blockade of Na+ or K+ channels affectedin vitro scar closure (Fig. 9) Injury in the presence of growth medium alone resulted in rapid scar closure (20 hr). Scar closure was retarded when growth medium was supplemented with 2 mm 4-AP, which partially blocks sustained outwardly rectifying potassium currents and completely blocks A-type K+ currents (Fig. 9B). Proliferation and scar closure also were inhibited by TEA (40 mm), which selectively blocked only the sustained outwardly rectifying potassium currents (Fig. 9C). These data suggest that the activity of the sustained outwardly rectifying K+ channels, in particular, was essential to the process of injury-induced astrocyte proliferation and scar closure. In comparison, 10 μm TTX did not affect scar closure, and complete confluence was achieved after 20 hr, as in control conditions. This suggests that, although sodium conductance was augmented in scar-associated cells, blockade of these currents did not deter proliferation.
Fig. 9.
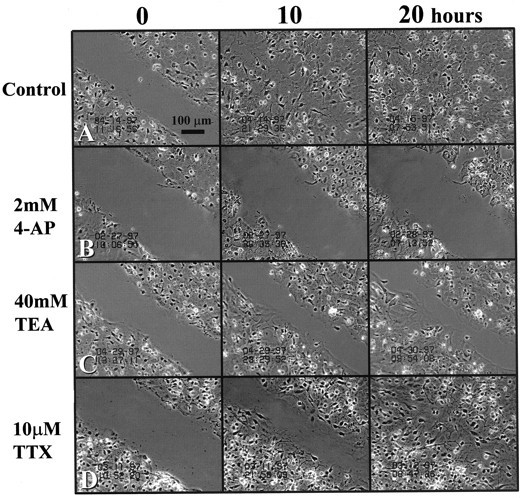
Effects of ion channel blockers on scar repair. Time-lapse micrographs of the in vitro scar at0, 10, and 20 hr postinjury. A, Scar closure in the presence of growth medium. B, Scar closure was inhibited completely by 4-AP (2 mm), which nonselectively blocks outwardly rectifying potassium channels. C, Scar proliferation also was primarily inhibited by TEA (40 mm), which selectively inhibits the sustained outwardly rectifying potassium current.D, In contrast, 10 μm TTX, a concentration that completely inhibited all sodium currents, had no inhibitory effect on scar repair. Results suggest that astrocyte proliferation depends particularly on the activity of sustained outward K+channels and not on the activity of Na+ channels. Scale bar, 100 μm.
DISCUSSION
This study demonstrates considerable electrophysiological changes in astrocytes undergoing injury-induced secondary proliferation. Proliferation was associated with a switch in K+ current expression: outwardly rectifying potassium currents were upregulated with a concurrent downregulation of inwardly rectifying potassium currents. In addition, scar-associated cells exhibited increased sodium conductance. These changes were transient and occurred within a few hours after the insult. Blockade of outwardly rectifying K+ channels by TEA or 4-AP inhibited glial proliferation and retarded scar repair, whereas blockade of Na+ channels with TTX was ineffective, suggesting that K+ channel activity is of particular functional importance in injury-induced proliferation and scar repairin vitro. Indeed, our pharmacological analysis suggests that KD currents, which are sensitive to both TEA and 4-AP, are of key importance in proliferation.
The in vitro model used does not do justice to the complex cell–cell interactions that underlie gliosis in vivo. Nevertheless, in vitro scars show some of the hallmarks described for glial scars in vivo, including GFAP upregulation and increased mitosis (Yu et al., 1993). Our cultures did not contain neurons, and, consequently, our scars could not respond to messengers released by dying neurons. Glial scars in vivo, however, also are devoid of neurons and provide a relatively pure glial environment. Although the limitations of the model constrain the interpretation of our results as they pertain to gliosis in vivo, the simplicity of the model allowed for the assessment of injury under conditions than would not be possible in vivo. Moreover, it permitted the assessment of scar closure via time-lapse video microscopy, which would not readily be possible in vivo. Despite limitations, we are encouraged that the findings of this study also may apply to in vivo gliosis. Astrocytes acutely isolated from gliotic tissue of patients with intractable epilepsy showed a conspicuous absence of KIR channels and an upregulation of Na+ channels (de Lanerolle et al., 1994), which is consistent with the present data. Furthermore, the decrease in KIR during gliosis may explain why gliotic tissue in experimental models of epilepsy demonstrate impaired potassium clearance (Lewis et al., 1977), because KIRchannels are believed to be of key importance in potassium buffering (Newman, 1993; Ransom and Sontheimer, 1995). Clearly, our future studies must evaluate gliosis by in vivo methods.
Electrophysiological changes in gliosis mirror those associated with gliogenesis
Changes in the electrophysiological properties of glial cells during development have been studied extensively in vitro. Most notably, O-2A glial progenitor cells express KD, KA, and Na+ currents but, on commitment to the oligodendrocyte lineage, express primarily KIR currents (Bevan et al., 1987; Sontheimer et al., 1989; Barres et al., 1990a,b).In vitro, spinal cord astrocytes switch from outwardly to inwardly rectifying K+ currents at 4–7 d in vitro (Roy and Sontheimer, 1995). Similarly, 50% of hippocampal astrocytes in situ lack KIR currents in slices from postnatal day 5 (P5) rats, a time at which many astrocytes are still mitotically active, but virtually all astrocytes acutely dissociated (Tse et al., 1992) or in acute slices of animals >P14 express KIR currents (Kressin et al., 1995; Bordey and Sontheimer, 1996). The observed loss of KIR and upregulation of KD and KA after injury thus can be interpreted as a recapitulation of the more immature current profile seen during development, wherein the majority of astrocytes is mitotically active.
Changes in K+ channel activity accompany cell cycle: a common phenomenon
A functional relationship between K+ channel activity and cell proliferation was demonstrated first in lymphocytes (DeCoursey et al., 1984), where pharmacological blockade of outwardly rectifying K+ currents inhibited cell proliferation. Numerous studies have demonstrated since then that blockade of outward potassium currents is also antiproliferative for brown fat cells (Pappone and Ortizmiranda, 1993), melanoma cells (Nilius and Wohlrab, 1992), human breast cancer cells (Woodfork et al., 1995), retinal glial cells (Puro et al., 1989), Schwann cells (Chiu and Wilson, 1989), O2-A progenitor cells (Gallo et al., 1996), and astrocytes (Pappas et al., 1994). Cell cycle-dependent changes in K+ current expression have been studied more directly in a few cell preparations, which provide evidence for a loss of KIR activity during proliferation, consistent with our data. For example, proliferating human leukemia cells generally lack expression of KIRcurrents, but currents are upregulated rapidly on induction to differentiate into macrophages (Wieland et al., 1990). Mouse embryos (Day et al., 1993), HeLa cells (Takahashi et al., 1994), and neuroblastoma cells (Arcangeli et al., 1995) all exhibit a downregulation of KIR currents on entrance into S-phase of cell cycle. These studies and ours suggest that differentiated, postmitotic cells express KIR channels as their major channel type, whereas proliferating cells show upregulation of KD and a loss of KIR.
The mechanism by which changes in K+ channel complement translate into an altered proliferative status is unclear. Several hypotheses have been put forward involving membrane depolarization and changes in intracellular [Na+], [Ca2+], and pH ([Na+]i, [Ca2+]i, and pHi). It is important to note that no conclusive “mechanistic” explanation has been provided to date. It seems indisputable, however, that K+ channel activity follows a pattern of expression in dividing versus nondividing cells that is independent of the mode of proliferation, be it primary (development), secondary (injury-induced), or cancerous. In the absence of any mechanistic explanation, we hypothesize that the observed changes in astrocyte ion channel complement do not cause altered cell cycle progression; rather, altered K+ channel activity establishes an appropriate intracellular ionic milieu that aids cell proliferation.
A relationship between membrane potential and cell proliferation was proposed first by Cone (1970), showing that cancerous cells are more depolarized than noncancerous cells. Similarly, glial progenitor cells are consistently 20 mV more depolarized than are oligodendrocytes or astrocytes (Sontheimer et al., 1989). A recent study showed that proliferation of O-2A cells could be inhibited by numerous depolarizing reagents, including conditions that increased intracellular Na+ (Knutson et al., 1997), suggesting that O-2A proliferation is controlled by changes in membrane potential. Yet, two studies in astrocytes (Pappas et al., 1994) and Schwann cells (Moor and Cole, 1963) showed antiproliferative effects of K+channel blockers even in the absence of significant membrane depolarization. Taken together, membrane potential changes may be important in the cell cycle regulation of some cells; however, the mechanisms by which changes in membrane potential lead to altered gene expression are unknown. It has been suggested that more depolarized membrane potentials lead to increased [Na+]i and [Ca2+]i. Changes in [Ca2+]i have been associated with cell cycle progression in a number of cell types (Lewis and Cahalan, 1990;Means, 1994; Baran, 1996; Isfort et al., 1996). Surprisingly, however, studies investigating such a relationship in glial progenitor cells (Knutson et al., 1997) and astrocytes (Pappas et al., 1994) failed to show a conclusive dependence of cell cycle progression on changes in [Ca2+]i. Alterations in intracellular ions may induce gene expression, providing an attractive framework to explore further the interdependence among K+ channel expression, membrane depolarization, [Na+]i, [Ca2+]i, and cell proliferation.
Using a combination of electrophysiological recordings and ratiometric fluorescence imaging, Pappas et al. (1994) showed that the antiproliferative effect of blocking K+ channels is correlated with an alkaline shift in pHi. These authors proposed that leakage of H+ through K+ channels may modulate pHi, which in turn establishes conditions that are either permissive or nonpermissive for astrocyte proliferation. Consistent with this model, alkaline pHi shifts inhibit astrocyte proliferation even in the absence of ion channel blockers (Pappas et al., 1994).
Some studies are shedding light on the interactions among oncogenes, tumor suppressor genes, and ion channel function. The transfection of fibroblasts with ras21 or exposure of fibroblasts to epidermal growth factor or platelet-derived growth factor leads to the induction of a novel Ca2+-activated K+ channel that is essential for cell cycle progression in these cells (Huang and Rane, 1994). In Drosophila, the tumor suppressor genedlg interacts with A-type K+ channels, leading to channel clustering (Tejedor et al., 1997). Clearly, further studies are needed to establish how changes in K+channel expression may translate into altered gene expression and cell proliferation.
Na+ currents
Although Na+ channel activity is markedly upregulated at the scar and is expressed in the majority of scar-associated cells, their functional role is unclear. Pharmacological blockade of Na+ channels by 10 μm TTX had no effect on astrocyte proliferation at the scar and did not affect scar repair. Thus, the antiproliferative effects of both TEA and 4-AP suggest that inhibition of the KD current alone is effective in hindering the processes of astrocyte proliferation and scar repair.
Implications
Gliosis accompanies not only acute trauma but a number of chronic conditions, including Alzheimer’s disease, stroke, and epilepsy. The question of whether glial scarring is beneficial or detrimental to functional recovery after injury has been raised frequently (Hatten et al., 1984; Reier, 1986), yet no conclusive answer has been provided. It has been demonstrated convincingly that astrocytes forming glial scars retard neurite outgrowth. This is, in part, the result of astrocytes forming a physical barrier that prevents penetration of neurites, but it is also attributable to the release of modulatory extracellular matrix molecules (Reier, 1986; Canning et al., 1996), neurotrophic factors (Winter et al., 1995), and cytokines (Selmaj et al., 1990; Giulian et al., 1994). On the basis of these data one would expect that inhibition of gliosis should facilitate functional recovery after injury. A better understanding of the physiological and molecular processes associated with injury-induced astrocyte proliferation may provide an avenue for the suppression of glial scar formation.
Footnotes
This work was supported by National Institutes of Health Grants RO1-NS31234 and P50-HD-32901.
Correspondence should be addressed to Stacey Nee MacFarlane, Department of Neurobiology, University of Alabama, Birmingham, 1719 Sixth Avenue South, Building CIRC, Room 545, Birmingham, AL 35294-0021.
REFERENCES
- 1.Aquino DA, Chiu FC, Brosnan CF, Norton WT. Glial fibrillary acidic protein increases in the spinal cord of Lewis rats with acute experimental autoimmune encephalitis. J Neurochem. 1988;51:1085–1096. doi: 10.1111/j.1471-4159.1988.tb03072.x. [DOI] [PubMed] [Google Scholar]
- 2.Arcangeli A, Bianchi L, Becchetti A, Faravelli L, Coronnello M, Mini E, Olivotto M, Wanke E. A novel inward-rectifying K+ current with a cell-cycle dependence governs the resting potential of mammalian neuroblastoma cells. J Physiol (Lond) 1995;489:455–471. doi: 10.1113/jphysiol.1995.sp021065. [DOI] [PMC free article] [PubMed] [Google Scholar]
- 3.Armaducci L, Forno KI, Eng LF. Glial fibrillary acidic protein in cryogenic lesions of the rat brain. Neurosci Lett. 1981;21:27–32. doi: 10.1016/0304-3940(81)90052-5. [DOI] [PubMed] [Google Scholar]
- 4.Baran I. Calcium and cell cycle progression: possible effects of external perturbations on cell proliferation. Biophys J. 1996;70:1198–1213. doi: 10.1016/S0006-3495(96)79679-0. [DOI] [PMC free article] [PubMed] [Google Scholar]
- 5.Barres BA, Chun LLY, Corey DP. Ion channel expression by white matter glia. I. Type 2 astrocytes and oligodendrocytes. Glia. 1988;1:10–30. doi: 10.1002/glia.440010104. [DOI] [PubMed] [Google Scholar]
- 6.Barres BA, Chun LLY, Corey DP. Ion channels in vertebrate glia. Annu Rev Neurosci. 1990a;13:441–474. doi: 10.1146/annurev.ne.13.030190.002301. [DOI] [PubMed] [Google Scholar]
- 7.Barres BA, Koroshetz WJ, Swartz KJ, Chun LLY, Corey DP. Ion channel expression by white matter glia: the O2A glial progenitor cell. Neuron. 1990b;4:507–524. doi: 10.1016/0896-6273(90)90109-s. [DOI] [PubMed] [Google Scholar]
- 8.Bevan S, Lindsay RM, Perkins MN, Raff MC. Voltage-gated ionic channels in rat cultured astrocytes, reactive astrocytes, and an astrocyte–oligodendrocyte progenitor cell. J Physiol (Paris) 1987;82:327–335. [PubMed] [Google Scholar]
- 9.Bignami A, Dahl D. The astroglial response to stabbing. Immunofluorescence studies with antibodies to astrocyte-specific GFAP in mammalian and submammalian vertebrates. Neuropathol Appl Neurobiol. 1976;2:99–110. [Google Scholar]
- 10.Bordey A, Sontheimer H. Postnatal development of ionic currents in rat hippocampal astrocytes in situ. J Neurophysiol. 1997;78:461–477. doi: 10.1152/jn.1997.78.1.461. [DOI] [PubMed] [Google Scholar]
- 11.Canning DR, Höke A, Malemud CJ, Silver J. A potent inhibitor of neurite outgrowth that predominates in the extracellular matrix of reactive astrocytes. Int J Dev Neurosci. 1996;14:153–175. doi: 10.1016/0736-5748(96)00004-4. [DOI] [PubMed] [Google Scholar]
- 12.Chiu SY, Wilson GF. The role of potassium channels in Schwann cell proliferation in Wallerian degeneration of explant rabbit sciatic nerves. J Physiol (Lond) 1989;408:199–222. doi: 10.1113/jphysiol.1989.sp017455. [DOI] [PMC free article] [PubMed] [Google Scholar]
- 13.Cone CJ. Variation of the transmembrane potential level as a basic mechanism of mitosis control. Oncology. 1970;24:438–470. doi: 10.1159/000224545. [DOI] [PubMed] [Google Scholar]
- 14.Connor JA, Stevens CF. Voltage-clamp studies of a transient outward membrane current in gastropod neural somata. J Physiol (Lond) 1971;213:21–30. doi: 10.1113/jphysiol.1971.sp009365. [DOI] [PMC free article] [PubMed] [Google Scholar]
- 15.Dahl D, Rueger DC, Bignami A, Weber K, Osborn M. Vimentin, the 57,000 molecular weight protein of fibroblast filaments, is the major cytoskeletal component in immature glia. Eur J Cell Biol. 1981;24:191–196. [PubMed] [Google Scholar]
- 16.Day ML, Pickering SJ, Johnson MH, Cook DI. Cell-cycle control of a large-conductance K+ channel in mouse early embryos. Nature. 1993;365:560–562. doi: 10.1038/365560a0. [DOI] [PubMed] [Google Scholar]
- 17.DeCoursey TE, Chandy G, Gupta S, Cahalan MD. Voltage-gated K+ channels in human T lymphocytes: a role in mitogenesis? Nature. 1984;307:465–468. doi: 10.1038/307465a0. [DOI] [PubMed] [Google Scholar]
- 18.de Lanerolle NC, O’Connor ER, Sontheimer H. Expression of voltage-activated Na+ and K+ channels in human astrocytes. Soc Neurosci Abstr [Suppl] 1994;20:1113. [Google Scholar]
- 19.Gallo V, Armstrong RC. Developmental and growth factor-induced regulation of nestin in oligodendrocyte lineage cells. J Neurosci. 1995;15:394–406. doi: 10.1523/JNEUROSCI.15-01-00394.1995. [DOI] [PMC free article] [PubMed] [Google Scholar]
- 20.Gallo V, Patneau DK, Mayer ML, Vaccarino FM. Excitatory amino acid receptors in glial progenitor cells: molecular and functional properties. Glia. 1994;11:94–101. doi: 10.1002/glia.440110204. [DOI] [PubMed] [Google Scholar]
- 21.Gallo V, Zhou JM, McBain CJ, Wright P, Knutson PL, Armstrong RC. Oligodendrocyte progenitor cell proliferation and lineage progression are regulated by glutamate receptor-mediated K+ channel block. J Neurosci. 1996;16:2659–2670. doi: 10.1523/JNEUROSCI.16-08-02659.1996. [DOI] [PMC free article] [PubMed] [Google Scholar]
- 22.Gensert JM, Goldman JE. In vivo characterization of endogenous proliferating cells in adult rat subcortical white matter. Glia. 1996;17:39–51. doi: 10.1002/(SICI)1098-1136(199605)17:1<39::AID-GLIA4>3.0.CO;2-2. [DOI] [PubMed] [Google Scholar]
- 23.Giulian D, Li J, Li X, George J, Rutecki PA. The impact of microglia-derived cytokines upon gliosis in the CNS. Dev Neurosci. 1994;16:128–136. doi: 10.1159/000112099. [DOI] [PubMed] [Google Scholar]
- 24.Goldschmidt RC, Kimelberg HK. Protein analysis of mammalian cells in monolayer culture using the bicinchroninic assay. Anal Biochem. 1989;177:41–45. doi: 10.1016/0003-2697(89)90010-9. [DOI] [PubMed] [Google Scholar]
- 25.Hamill OP, Marty A, Neher E, Sakmann B, Sigworth FJ. Improved patch-clamp techniques for high-resolution current recording from cells and cell-free membrane patches. Pflügers Arch. 1981;391:85–100. doi: 10.1007/BF00656997. [DOI] [PubMed] [Google Scholar]
- 26.Hatten ME, Mason CA, Liem RK, Edmondson JC, Bovolenta P, Shelanski ML. Neuron–astroglial interactions in vitro and their implications for repair of CNS injury: review. Cent Nerv Syst Trauma. 1984;1:15–27. doi: 10.1089/cns.1984.1.15. [DOI] [PubMed] [Google Scholar]
- 27.Hatten ME, Liem RK, Shelanski ML, Mason CA. Astroglia in CNS injury. Glia. 1991;4:233–243. doi: 10.1002/glia.440040215. [DOI] [PubMed] [Google Scholar]
- 28.Hou Y-J, Yu ACH, Garcia JMRZ, Aotaki-Keen A, Lee Y-L, Eng LF, Hjelmeland LJ, Menon VK. Astrogliosis in culture. IV. Effects of basic fibroblast growth factor. J Neurosci Res. 1995;40:359–370. doi: 10.1002/jnr.490400310. [DOI] [PubMed] [Google Scholar]
- 29.Huang Y, Rane SG. Potassium channel induction by the Ras/Raf signal transduction cascade. J Biol Chem. 1994;269:31183–31189. [PubMed] [Google Scholar]
- 30.Isfort RJ, Cody DB, Stuard SB, Ridder GM, LeBoeuf RA. Calcium functions as a transcriptional and mitogenic repressor in Syrian hamster embryo cells: roles of intracellular pH and calcium in controlling embryonic cell differentiation and proliferation. Exp Cell Res. 1996;226:363–371. doi: 10.1006/excr.1996.0237. [DOI] [PubMed] [Google Scholar]
- 31.Korr H. Proliferation and cell cycle parameters of astrocytes. In: Fedoroff S, Vernadakis A, editors. Astrocytes, cell biology, and pathology of astrocytes. Academic; Orlando, FL: 1986. pp. 77–127. [Google Scholar]
- 32.Knutson P, Ghiani CA, Zhou J-M, Gallo V, McBain C. K+ channel expression and cell proliferation are regulated by intracellular sodium and membrane depolarization in oligodendrocyte progenitor cells. J Neurosci. 1997;17:2669–2682. doi: 10.1523/JNEUROSCI.17-08-02669.1997. [DOI] [PMC free article] [PubMed] [Google Scholar]
- 33.Kraig RP, Jaeger CB. Ionic concomitants of astroglial transformation to reactive species. Stroke. 1990;21:III184–III187. [PubMed] [Google Scholar]
- 34.Kressin K, Kuprijanova E, Jabs R, Seifert G, Steinhäuser C. Developmental regulation of Na+ and K+ conductances in glial cells of mouse hippocampal brain slices. Glia. 1995;15:173–187. doi: 10.1002/glia.440150210. [DOI] [PubMed] [Google Scholar]
- 35.Lewis DV, Mutsuga N, Schuette WH, Van Buren J. Potassium clearance and reactive gliosis in the alumina gel lesion. Epilepsia. 1977;18:499–506. doi: 10.1111/j.1528-1157.1977.tb04997.x. [DOI] [PubMed] [Google Scholar]
- 36.Lewis RS, Cahalan MD. Ion channels and signal transduction in lymphocytes: review. Annu Rev Physiol. 1990;52:415–430. doi: 10.1146/annurev.ph.52.030190.002215. [DOI] [PubMed] [Google Scholar]
- 37.Means AR. Calcium, calmodulin, and cell cycle regulation. FEBS Lett. 1994;347:1–4. doi: 10.1016/0014-5793(94)00492-7. [DOI] [PubMed] [Google Scholar]
- 38.Moor JW, Cole KS. Voltage clamp techniques. Phys Tech Biol Res. 1963;6:263–321. [Google Scholar]
- 39.Murphy GM, Jr, Ellis WG, Lee YL, Stultz KE, Shrivastava R, Tinklenberg JR, Eng LF. Astrocytic gliosis in the amygdala in Down’s syndrome and Alzheimer’s disease. Prog Brain Res. 1992;94:475–483. doi: 10.1016/s0079-6123(08)61774-4. [DOI] [PubMed] [Google Scholar]
- 40.Newman EA. Inward-rectifying potassium channels in retinal glial (Müller) cells. J Neurosci. 1993;13:3333–3345. doi: 10.1523/JNEUROSCI.13-08-03333.1993. [DOI] [PMC free article] [PubMed] [Google Scholar]
- 41.Nilius B, Wohlrab W. Potassium channels and regulation of proliferation of human melanoma cells. J Physiol (Lond) 1992;445:537–548. doi: 10.1113/jphysiol.1992.sp018938. [DOI] [PMC free article] [PubMed] [Google Scholar]
- 42.Niquet J, Ben-Ari Y, Represa A. Glial reaction after seizure-induced hippocampal lesion: immunohistochemical characterization of proliferating glial cells. J Neurocytol. 1994;23:641–656. doi: 10.1007/BF01191558. [DOI] [PubMed] [Google Scholar]
- 43.Pappas CA, Ullrich N, Sontheimer H. Reduction of glial proliferation by K+ channel blockers is mediated by changes in pHi. NeuroReport. 1994;6:193–196. doi: 10.1097/00001756-199412300-00049. [DOI] [PubMed] [Google Scholar]
- 44.Pappone PA, Ortizmiranda SI. Blockers of voltage-gated K-channels inhibit proliferation of cultured brown fat cells. Am J Physiol. 1993;264:C1014–C1019. doi: 10.1152/ajpcell.1993.264.4.C1014. [DOI] [PubMed] [Google Scholar]
- 45.Pollen DA, Trachtenberg MC. Neuroglia: gliosis and focal epilepsy. Science. 1970;167:1252–1253. doi: 10.1126/science.167.3922.1252. [DOI] [PubMed] [Google Scholar]
- 46.Puro DG, Roberge F, Chan CC. Retinal glial cell proliferation and ion channels: a possible link. Invest Ophthalmol Vis Sci. 1989;30:521–529. [PubMed] [Google Scholar]
- 47.Ransom CB, Sontheimer H. Biophysical and pharmacological characterization of inwardly rectifying K+ currents in rat spinal cord astrocytes. J Neurophysiol. 1995;73:333–345. doi: 10.1152/jn.1995.73.1.333. [DOI] [PubMed] [Google Scholar]
- 48.Reier PJ. Gliosis following CNS injury: the anatomy of astrocytic scars and their influences on axonal elongation. In: Fedoroff S, Vernadakis A, editors. Astrocytes, cell biology, and pathology of astrocytes. Academic; Orlando, FL: 1986. pp. 263–324. [Google Scholar]
- 49.Roy M-L, Sontheimer H. β-Adrenergic modulation of glial inwardly rectifying potassium channels. J Neurochem. 1995;64:1576–1584. doi: 10.1046/j.1471-4159.1995.64041576.x. [DOI] [PubMed] [Google Scholar]
- 50.Rudy B. Diversity and ubiquity of K channels. Neuroscience. 1988;25:729–750. doi: 10.1016/0306-4522(88)90033-4. [DOI] [PubMed] [Google Scholar]
- 51.Sakatani K, Black JA, Kocsis JD. Transient presence and functional interaction of endogenous GABA and GABAA receptors in developing rat optic nerve. Proc R Soc Lond [Biol] 1992;247:155–161. doi: 10.1098/rspb.1992.0022. [DOI] [PubMed] [Google Scholar]
- 52.Selmaj KW, Farooq M, Norton WT, Raine CS, Brosnan CF. Proliferation of astrocytes in vitro in response to cytokines. A primary role for tumor necrosis factor. J Immunol. 1990;144:129–135. [PubMed] [Google Scholar]
- 53.Sontheimer H. Glial neuronal interactions: a physiological perspective. Neuroscientist. 1995;1:328–337. [Google Scholar]
- 54.Sontheimer H, Trotter J, Schachner M, Kettenmann H. Channel expression correlates with differentiation stage during development of oligodendrocytes from their precursor cells in culture. Neuron. 1989;2:1135–1145. doi: 10.1016/0896-6273(89)90180-3. [DOI] [PubMed] [Google Scholar]
- 55.Sontheimer H, Black JA, Ransom BR, Waxman SG. Ion channels in spinal cord astrocytes in vitro. I. Transient expression of high levels of Na+ and K+ channels. J Neurophysiol. 1992;68:985–1000. doi: 10.1152/jn.1992.68.4.985. [DOI] [PubMed] [Google Scholar]
- 56.Takahashi A, Yamaguchi H, Miyamoto H (1994) Change in density of K+ current of HeLa cells during the cell cycle. Jpn J Physiol 44[Suppl 2]:S321–S324. [PubMed]
- 57.Tejedor FJ, Bokhari A, Rogero O, Gorczyca M, Zhang J, Kim E, Sheng M, Budnik V. Essential role for dlg in synaptic clustering of Shaker K+ channels in vivo. J Neurosci. 1997;17:152–159. doi: 10.1523/JNEUROSCI.17-01-00152.1997. [DOI] [PMC free article] [PubMed] [Google Scholar]
- 58.Tse FW, Fraser DD, Duffy S, MacVicar BA. Voltage-activated K+ currents in acutely isolated hippocampal astrocytes. J Neurosci. 1992;12:1781–1788. doi: 10.1523/JNEUROSCI.12-05-01781.1992. [DOI] [PMC free article] [PubMed] [Google Scholar]
- 59.Westermark B, Heldin CH, Nister M. Platelet-derived growth factor in human glioma: review. Glia. 1995;15:257–263. doi: 10.1002/glia.440150307. [DOI] [PubMed] [Google Scholar]
- 60.Wieland SJ, Chou RH, Gong QH. Macrophage-colony-stimulating factor (CSF-1) modulates a differentiation-specific inward-rectifying potassium current in human leukemic (HL-60) cells. J Cell Physiol. 1990;142:643–651. doi: 10.1002/jcp.1041420326. [DOI] [PubMed] [Google Scholar]
- 61.Winter CG, Saotome Y, Levison SW, Hirsh D. A role for ciliary neurotrophic factor as an inducer of reactive gliosis, the glial response to central nervous system injury. Proc Natl Acad Sci USA. 1995;92:5865–5869. doi: 10.1073/pnas.92.13.5865. [DOI] [PMC free article] [PubMed] [Google Scholar]
- 62.Woodfork KA, Wonderlin WF, Peterson VA, Strobl JS. Inhibition of ATP-sensitive potassium channels causes reversible cell-cycle arrest of human breast cancer cells in tissue culture. J Cell Physiol. 1995;162:163–171. doi: 10.1002/jcp.1041620202. [DOI] [PubMed] [Google Scholar]
- 63.Yu AC, Lee YL, Eng LF. Astrogliosis in culture. I. The model and the effect of antisense oligonucleotides on glial fibrillary acidic protein synthesis. J Neurosci Res. 1993;34:295–303. doi: 10.1002/jnr.490340306. [DOI] [PubMed] [Google Scholar]