

Abstract
The inferior colliculus (IC) is a major auditory structure that integrates synaptic inputs from ascending, descending, and intrinsic sources. Intracellular recording in situ allows direct examination of synaptic inputs to the IC in response to acoustic stimulation. Using this technique and monaural or binaural stimulation, responses in the IC that reflect input from a lower center can be distinguished from responses that reflect synaptic integration within the IC. Our results indicate that many IC neurons receive synaptic inputs from multiple sources. Few, if any, IC neurons acted as simple relay cells. Responses often displayed complex interactions between excitatory and inhibitory sources, such that different synaptic mechanisms could underlie similar response patterns. Thus, it may be an oversimplification to classify the responses of IC neurons as simply excitatory or inhibitory, as is done in many studies. In addition, inhibition and intrinsic membrane properties appeared to play key roles in creating de novo temporal response patterns in the IC.
Keywords: inferior colliculus, intracellular recordings, auditory pathways, auditory signal processing, binaural hearing, synaptic physiology
The inferior colliculus (IC) is a major auditory station where information ascending from lower centers must synapse. These inputs can be inhibitory or excitatory (e.g.,Irvine, 1986; Oliver and Heurta, 1992). For example, excitation from stimulation of one ear could come from the contralateral cochlear nucleus, contralateral lateral superior olive (LSO), and ipsilateral medial superior olive (MSO), whereas inhibition could arise from the ventral nuclei of the lateral lemniscus (VNLL) and the dorsal nuclei of the lateral lemniscus (DNLL) (e.g., Glendenning and Masterton, 1983;Adams and Mugnaini, 1984; Penney et al., 1984). Excitation from the stimulation of the other ear could come from the ipsilateral LSO and MSO, whereas inhibition could arise from the ipsilateral LSO and the DNLL of both sides (Saint Marie et al., 1989; Glendenning et al., 1992).
Additionally, IC neurons also receive intrinsic inputs from local collaterals (Oliver et al., 1991). These intrinsic inputs can presumably be excitatory or inhibitory, because many IC neurons are GABAergic, whereas many are not (Oliver et al., 1994).
The auditory cortex also provides input to the IC (Diamond et al., 1969; Rockel and Jones, 1973; Andersen et al., 1980). Electrical stimulation of the auditory cortex can evoke EPSPs and IPSPs, or both, in IC neurons (Mitani et al., 1983).
Thus, the multitude of inputs suggests considerable synaptic integration in the IC. However, extracellular techniques cannot reveal synaptic potentials and therefore offer a limited view of synaptic integration. Extracellular recordings have described heterogeneous response types to monaural and binaural stimulation (for review, seeIrvine, 1986), many of which are consistent with the influence of convergent inputs. Pharmacological studies have shown that specific transmitters influence synaptic integration (for review, see Faingold et al., 1991b). However, this method is limited because the pharmacological agents may also influence neighboring cells that provide inputs to the one under study.
Intracellular recording in situ allows direct examination of synaptic inputs in response to acoustic stimulation. Thus, synaptic integration in the IC can be distinguished from a simple input from a lower center. Furthermore, the time course of different synaptic events can be viewed. The classic intracellular study of Nelson and Erulkar (1963) provided a glimpse into synaptic integration in the IC. Recently, Pedemonte et al. (1997) corroborated and added to their findings, and Covey et al. (1996) provided an in-depth analysis of synaptic integration in the IC of the bat. Still, more information is needed about synaptic responses of IC neurons to a wider variety of acoustic signals.
In the present study, we made intracellular recordings from the IC of anesthetized cats and examined the synaptic and action potentials to monaural and binaural sounds using sharp microelectrodes. After the responses of a neuron were characterized, we stained the impaled neuron by injecting horseradish peroxidase through the recording pipette. The morphological features of these neurons have been reported (Oliver et al., 1991). Here we report that many neurons reflected interactions between synaptic inputs that generated new response profiles.
MATERIALS AND METHODS
Experimental preparation. Some of the procedures have been described previously (Oliver et al., 1991) but will be summarized here for the reader’s convenience. We used adult cats with clean external and middle ears. Our procedures conformed to the Guide for the Humane Care and Use of Laboratory Animals (National Institutes of Health, United States Public Health Service, Bethesda, MD). Under general anesthesia (sodium pentobarbital, 35 mg/kg, i.p.), cats underwent a tracheotomy, femoral vein catheterization, and removal of both pinnae. Supplemental doses of sodium pentobarbital were delivered through the intravenous cannula as needed to maintain areflexia throughout the experiment. The dorsal and lateral surfaces of the right IC were exposed by aspiration of the occipital cortex and removal of the bony tentorium. Sometimes a small stainless steel foot plate was attached to the skull via a stainless steel wire and used to retract the anterior surface of the cerebellum. A Plexiglas chamber centered over the IC was cemented to the skull, filled with mineral oil, and sealed with a glass plate. The microelectrode was inserted through a sleeve in the glass plate and placed onto the exposed surface of the IC.
Acoustic stimuli. In almost all cases, acoustic stimuli to each ear were produced by two independently controlled digital generators (Rhode, 1976). In a few animals, we used analog oscillators to generate the acoustic stimuli. Sounds were delivered through earphones (Beyer DT-48 or Telex 140) connected to hollow earpieces. Before recording from each animal, the level [sound pressure level (SPL) in decibels referenced to 20 μPa] of tone bursts were calibrated (60–40,000 Hz in 20 Hz steps) via a probe tube coupled to a 0.5 inch condenser microphone (Bruel & Kjaer). The tip of the probe tube was 1–2 mm from the tympanic membrane. The calibrations were stored in the computer and used to deliver calibrated sounds. Either a Harris 6024/5 or a Digital Equipment Corp. LSI 11/73 computer was used to control calibration, stimulus delivery, and spike collection. Action potentials were discriminated and timed with a resolution of 10 μsec.
Electrodes. The microelectrodes were pulled on a Flaming–Brown micropipette puller (Sutter P-80/PC). They were filled with 4% HRP in 0.5 m KCl and 0.04 m Tris buffer, pH 8.6. A jet stream beveler (Ogden et al., 1978) was used to lower the resistance of the electrode from 200–400 to 30–100 MΩ. An Ag–AgCl wire was used to couple the microelectrode to a high-impedance DC amplifier. The animal ground was an Ag–AgCl pellet or wire placed under the skin.
Recording procedure. Recordings were conducted in a double-walled, sound-insulated room (IAC). A Trent–Wells or Burleigh microdrive was used to advance the electrode. Electrode advancement and sound delivery were controlled from outside the sound-insulated chamber.
Cells were impaled by advancing the electrode in small steps (1–2 μm) or by delivering positive (5–100 nA) current pulses (100 msec) through the microelectrode. A sudden negative DC shift and the presence of synaptic potentials indicated an intracellular impalement, which was often verified by passing positive current to evoke action potentials.
Once a cell was impaled, tone bursts (50–1100 msec duration) delivered to the contralateral ear were used to determine its responsive frequency range (usually at an intensity of 50–90 dB SPL). The contralateral stimulus parameters then were used to measure the response of the neuron to ipsilateral and binaural stimulation. Time permitting, binaural response properties were examined further. Sensitivity to interaural time differences (ITDs) was usually assessed using the binaural-beat stimulus (Yin and Kuwada, 1983a). Sensitivity to interaural level differences (ILDs) was usually assessed near the best frequency of the neuron by holding the stimulus level to the contralateral ear constant while varying the level to the ipsilateral ear.
After assessing the responses of a neuron to acoustic stimuli, cells were injected with HRP by delivering positive current pulses (5–15 nA, 100 msec on, 100 msec off for 2–3 min). After an injection, the electrode was retracted, and hyperpolarizing pulses were applied for calibration purposes. Successive electrode penetrations were spaced 1–2 mm apart, using the surface vasculature as a reference. No more than five penetrations were made per animal.
During recording, intracellular waveforms and stimulus-timing pulses were stored on a multichannel AM/FM tape recorder (Hewlett-Packard 3968A or EMI-SE-7000), using a 0–2500 Hz bandwidth. To analyze the intracellular responses, the taped recordings were digitized off-line at sampling rates between 5120 and 11,377 Hz. In some cases, responses to multiple presentations of the same stimulus were averaged to enhance potentials not readily apparent in the responses to a single stimulus presentation.
In one illustration (see Fig. 15), we display responses from an IC neuron in a rabbit. These responses were recorded extracellularly with glass-coated platinum/tungsten microelectrodes in a restrained, unanesthetized rabbit (for details, see Fitzpatrick et al., 1995).
Fig. 15.

An ITD-sensitive neuron recorded extracellularly in the IC of an unanesthetized rabbit that displayed response properties consistent with the intracellular records in Figure 14.A, Poststimulus time histogram (PSTH) to contralateral (contra) tone bursts (70 dB SPL, 50 repetitions).B, PSTH to ipsilateral (ipsi) tone bursts (same parameters as in A, but 20 repetitions).C, PSTH to a 1 Hz binaural-beat stimulus (contra, 600 Hz; ipsi, 601 Hz; both 70 dB SPL; 4 repetitions).
RESULTS
Recordings from 52 neurons were obtained from the IC of 22 adult cats. This sample includes only recordings that showed the presence of acoustically evoked synaptic potentials. The distribution of resting potentials was bimodal; most neurons (28 of 52) had resting potentials between −30 and −74 mV (mean, 47.8; SD, 10.6 mV), whereas the rest were between −29 and −4 mV (mean, −17.0; SD, 7.2 mV).
We were able to classify 37 neurons as being binaural (26 of 37) or monaural (11 of 37). Binaural neurons responded to acoustic stimulation of either ear, or their response to binaural stimulation differed from that to monaural stimulation. Monaural cells responded only to contralateral stimulation, and their binaural response was indistinguishable from their response to contralateral stimulation.
Monaural responses
Neurons in the IC displayed a variety of synaptic responses to acoustic stimulation that often reflected both excitatory and inhibitory inputs. Such complex responses could be evoked by stimulation of the contralateral or ipsilateral ear.
Responses to contralateral stimulation
A substantial proportion of the neurons tested with contralateral stimulation (n = 50) responded with a mixture of EPSPs and IPSPs (40%). A nearly equal proportion responded with only EPSPs (42%), whereas the rest (18%) displayed only IPSPs. Figure1 illustrates the responses of nine neurons to a contralateral tone burst (50 msec duration) at or near the best frequency of the neuron. Figure 1A is an example of a response with only inhibitory potentials; Figure1B–D (also see Figs. 9E–H,13A, 14A) shows responses with both excitatory and inhibitory potentials; and Figure1E–I shows responses with only excitatory potentials.
Fig. 1.

Examples of responses to contralateral stimulation from nine IC neurons (A–I). In each case, the responses to the initial presentation of a 50 msec tone burst at or near the best frequency of the neuron are shown. Horizontal bars in this and subsequent figures represent the stimulus duration. Frequency and intensity of the tone bursts are indicated.
Fig. 9.

A neuron that showed inhibition to ipsilateral stimulation, complex excitation, and inhibition to contralateral stimulation, and yet the binaural response resembled that to contralateral stimulation. In all records, the responses to six identical tone bursts (65 dB SPL) were averaged at each of the frequencies indicated. A–D (first column), Responses to stimulation of the ipsilateral (IPSI) ear. In all cases, ipsilateral tone bursts evoked a short-latency hyperpolarization that slowly decayed over the stimulus duration. E–H (second column), Responses to stimulation of the contralateral (CONTRA) ear. Tone bursts evoked a transient depolarization, followed by a transient hyperpolarization, which was then followed by a sustained depolarization that lasted throughout the stimulus duration.I–L (third column), Predicted binaural response was estimated by summing the ipsilateral (first column) and contralateral (second column) responses.M–P (fourth column), Actual responses to binaural stimulation (same stimulus parameters as in thefirst and second columns). Responses are from the same neuron as in Figures 5 (right column) and 7.
Fig. 13.
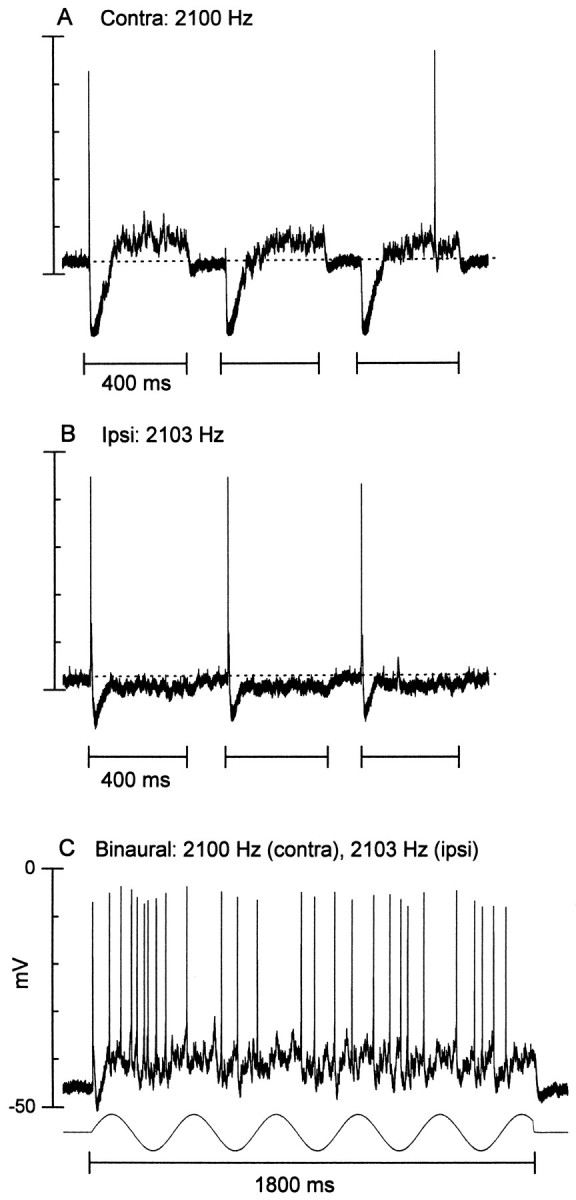
An ITD-sensitive neuron that had an inhibitory–excitatory response to contralateral stimulation and an excitatory–inhibitory response to ipsilateral stimulation.A, Response to three sequential contralateral (Contra) tone bursts (80 dB SPL). B, Response to three sequential ipsilateral (Ipsi) tone bursts (80 dB SPL). C, Response to a 3 Hz binaural-beat stimulus (contra, 2100 Hz; ipsi, 2103 Hz; both at 80 dB SPL). The sinusoid (bottom) is at the beat frequency. The discharge follows the beat frequency, and this is seen more clearly in Figure 11C, where the response to the binaural-beat stimulus is plotted as a function of ITD.
Fig. 14.

An ITD-sensitive neuron that had a predominant inhibitory response to contralateral, ipsilateral, and binaural stimulation. A, Averaged response (35 repetitions) to contralateral (contra) tone bursts (65 dB SPL).B, Averaged response (10 repetitions) to ipsilateral (ipsi) tone bursts (same stimulus parameters as inA). C, Averaged response (3 repetitions) to a 3 Hz binaural-beat stimulus (contra, 1000 Hz;ipsi, 1003 Hz; both at 65 dB SPL). The horizontal dotted line indicates the resting potential.
Responses to ipsilateral stimulation
Ipsilateral tones could also evoke a variety of responses that indicated different combinations of excitatory and inhibitory inputs. Of the neurons tested with ipsilateral stimulation (n = 41), responses with only inhibitory potentials were the most prominent (29%), followed by those with both excitatory and inhibitory potentials (22%), and then by those with only excitatory potentials (17%). However, 31% showed no response to ipsilateral stimulation.
Figure 2 displays four examples of responses to an ipsilateral tone burst using the same format as Figure1. Ipsilateral stimulation could evoke a sustained hyperpolarization (Fig. 2A; also see Fig. 13B) or a transient hyperpolarization (Fig. 2B; also see Figs.6D, 9C), which could be preceded by an action potential (Fig. 2B; also see Fig.13B). The response of the neuron in Figure 2Cconsisted of a long-latency action potential that rode on a transient depolarization. The response of the neuron in Figure2D was more complex. It also displayed a long-latency transient depolarization, but this was later followed by another excitatory period. This later excitation was not an “off” response, because the depolarization started during the stimulus.
Fig. 2.

Examples of responses to ipsilateral stimulation from four IC neurons (A–D). Same format as Figure 1. The inhibition in A was more clearly evident when the response to 15 stimulus repetitions was averaged (not shown).
Fig. 6.

A neuron that showed binaural suppression occurring within the IC. Shown are the responses to the first two tone bursts at the frequencies and levels indicated. Action potentials have been cropped. A, D, G (left column), Responses to ipsilateral (IPSI) tone bursts. A transient hyperpolarization (arrows) near stimulus onset was seen in all records. B, E, H (middle column), Responses to contralateral (CONTRA) tone bursts, which evoked a sustained depolarization and action potentials that were tightly coupled to the stimulus onset. C, F, I(right column), Responses to binaural stimulation.. Binaural responses were attenuated relative to contralateral responses both in the number of action potentials and level of sustained depolarization. The best excitatory response of the neuron was near 3500 Hz. Same neuron as in Figures 1G and 3 (right column).
The monaural responses displayed in Figures 1 and 2 indicate that the same temporal pattern of action potentials could be produced by different synaptic mechanisms. This was the case for onset, pauser, and long-latency responses.
Onset responses
The simplest onset response was a transient depolarization accompanied by an action potential or two near stimulus onset (e.g., Figs. 1E, 2C) and was consistent with inputs that had an onset discharge pattern. Other onset responses appeared to be created by an interplay of initial excitation followed immediately by inhibition (e.g., Figs. 1D,2B). Still others displayed a sustained depolarization throughout the stimulus duration (Fig.1F). This type of onset response appeared to be a consequence of the membrane properties of the neuron (Feng et al., 1994).
Pauser responses
These responses also appeared to be created in different ways. Some pauser responses were associated with a slight drop in depolarization during the pause [e.g., Fig. 1G; also see Figs. 3D (same neuron as in Fig. 1G) and 12A]. Such responses are consistent with the neuron receiving a pauser pattern input. In other neurons (e.g., Fig. 1H), there was no drop in the membrane potential during the pause. In such neurons, the pause may have been produced by the membrane properties of the neuron (Manis, 1990). A third type of pauser neuron displayed a hyperpolarization during the pause period (see Fig. 9G), indicating that the pause could be created by an inhibitory input.
Fig. 3.

Two neurons that displayed inhibitory side bands.A–F (left column), Responses of one neuron to tone bursts from 500 to 5000 Hz. Each panel is the response to two successive tone bursts (80 dB SPL) at the frequencies indicated. The best frequency was 3500 Hz (D).Arrows mark the transient hyperpolarizations seen at the edges of the response area of this neuron (A, F). Action potentials have been cropped. Responses are from the neuron of Figure 1G. G–L (right column), Responses of another neuron to tone bursts from 5 to 11 kHz. Here, the responses to six identical tone bursts (65 dB SPL) were averaged at each of the frequency indicated. Best frequency is near 9 kHz (J).
Long-latency responses
These responses provide further evidence that similar discharge patterns can be created by different mechanisms. In some cases, action potentials rode on a long-latency, transient depolarization (e.g., Fig. 2C,D; also see Fig.8A,B), indicating that the inputs arrived with a long latency, perhaps from the auditory cortex. In other neurons the long-latency discharge was created by a gradual build-up of depolarization (e.g., Fig. 1I) and could have been a consequence of the membrane properties of the neuron (Manis, 1990). Long-latency responses could also be created by an inhibitory input that preceded excitation (e.g., Fig. 1B,C; also see Fig. 13A).
Fig. 8.

A binaural neuron that showed a long-latency excitation to stimulation of either ear. A, Ipsilateral (IPSI) responses to two sequential tone bursts (1.5 kHz) reveals a late depolarization accompanied by a spike or two.B, Same stimulus as in A delivered to the contralateral (CONTRA) ear evoked a similar response.C–F (right column), Responses to binaural stimulation at the contralateral and ipsilateral levels indicated. Binaural responses systematically declined as the level to the ipsilateral ear was reduced until the response resembled the response to contralateral stimulation (F). Binaural responses were not tested at the same levels as the monaural responses.
Inhibitory side bands
We observed three examples of neurons with inhibitory side bands in their frequency response areas, and they are illustrated in Figures 3 and 4. The neuron in Figure 3,left column, had a best frequency of 3500 Hz. At the lower (Fig. 3A) and higher (Fig. 3F) edges of its frequency range, a transient hyperpolarization (arrows) was evident near the stimulus onset. At intermediate frequencies, the hyperpolarization was replaced by depolarization, and, at best frequency, a pauser pattern was evident. This pattern is mirrored in the temporal profile of the sustained depolarization.
Fig. 4.

A third example of a neuron that displayed inhibitory side bands. The responses of the cell to a single tone burst (50 dB SPL) at the frequencies indicated are shown. Dotted lines indicate the resting potential of the neuron. Driven action potentials occurred near stimulus onset (arrows). Spontaneous activity was ∼31 spikes/sec. A, Lower-frequency inhibitory side band (14 kHz); B, best frequency of the neuron (17 kHz); C, upper-frequency inhibitory side band (20 kHz).
The responses of the second neuron (Fig. 3G–L) displayed a similar pattern. Here, the responses to tone bursts at each frequency were averaged (n = 6) to display the summed synaptic potentials. At the lower (Fig. 3G) and higher (Fig.3L) edges of the frequency range of the neuron, a relatively sustained hyperpolarization was present. At intervening frequencies the response was more complex, i.e., a transient depolarization, followed by a transient hyperpolarization, and then a longer-lasting, sustained depolarization.
The responses of a third cell are illustrated in Figure 4. This cell displayed a sustained hyperpolarization (dashed linesindicate resting membrane potential) at the edges of its responsive frequency range (Fig. 4A,C). At or near its best frequency (Fig. 4B), action potentials riding on a fast EPSP (arrow) were seen near the stimulus onset. The later potentials in this response may be spontaneous, because their waveforms resembled those in the absence of stimulation.
The temporal characteristics of the central excitation could differ from those of the side band regions (Fig.5). Here, the neuron in Figure 3,right column, was tested with a binaural-envelope beat stimulus (3 Hz) created by delivering sinusoidally amplitude-modulated tones with a 3 Hz difference in the modulation frequencies to each ear. The unit was not ITD-sensitive, because there was no following to the binaural-envelope beat stimulus. However, there were rapid fluctuations that rode on the sustained depolarization (Fig. 5B,C), reflecting a precise following to the contralateral (100 Hz) modulation frequency. The fast Fourier transforms (Fig. 5, right column) show a sharp peak only at this frequency. The following response was evident only at frequencies that evoked a sustained depolarization (Fig. 5B,C) and not at flanking frequencies that evoked inhibition (Fig. 5A,D). This suggests that the envelope information is either not present in the inputs at the flanking frequencies, or it is filtered out.
Fig. 5.

A neuron that displayed inhibitory side bands and synchronized to the envelope of sinusoidally amplitude-modulated tones only in the excitatory region. A–D, Left column, Averaged responses (n = 6) to a 3 Hz binaural-envelope beat stimulus (contralateral modulation, 100 Hz; ipsilateral modulation, 103 Hz) at the carrier frequencies indicated.Horizontal dotted lines indicate the resting potential. Synchronized oscillations that followed the contralateral modulation frequency were present at excitatory frequencies (B, C) but little, if any, synchrony at inhibitory carrier frequencies (A, D). A–D, Right column, Frequency content of each response obtained by Fourier analysis. Amplitudes are peak to peak. A peak at the contralateral modulation frequency (100 Hz) was present only at excitatory frequencies. Same neuron as in Figure 3(right column).
All three neurons with inhibitory side bands were classified as stellate (Oliver et al., 1991). The two neurons in Figure 3 had moderately oriented dendrites; both were located near the border of the central nucleus and dorsal cortex, one (Fig. 3A) in the dorsal cortex (Oliver et al., 1991, their Fig. 13) and the other (Fig.3B) in the central nucleus (Oliver et al., 1991, their Fig. 12). Their dendrites were oriented so that they crossed the presumed frequency layers of the IC. The third cell (Fig. 4) was located in the upper part of the dorsal cortex (Oliver et al., 1991, their Fig. 19) and had unoriented dendrites.
The structural basis for inhibitory side bands was suggested by the stellate morphology of the cells that displayed them. Dendrites of stellate neurons receive inputs from several layers, each tuned to a narrow range of frequencies. The soma, as well as dendrites within the same layer, may receive excitatory inputs centered around a particular frequency, whereas the dendrites in the flanking layers may receive inhibitory inputs tuned to side band frequencies.
Binaural responses
Subtractive interactions
Most neurons in the IC are excited by contralateral stimulation. Here we describe neurons that had binaural responses that were suppressed relative to their contralateral responses. Such suppression can be attributable to ipsilateral inhibition in the IC itself, as shown in Figure 6. In this neuron, ipsilateral stimulation (Fig. 6, left column) evoked a transient hyperpolarization at stimulus onset (arrows) at all frequencies illustrated. In contrast, contralateral stimulation (Fig. 6, middle column) evoked a sustained depolarization accompanied by action potentials at stimulus onset and an occasional spike at longer latencies (Fig. 6E,H). Binaural stimulation (Fig. 6, right column) evoked a weaker sustained depolarization and fewer action potentials compared with contralateral stimulation alone. The weaker binaural response is consistent with the convergence of inhibitory ipsilateral potentials and contralateral excitatory potentials. However, the time course of the ipsilateral inhibition is shorter than the effective suppression seen in the binaural responses. This suggests that this cell also received inputs from a site where a subtractive interaction occurred.
Binaural suppression in the IC can also reflect nonprimary binaural interactions, i.e., those that occurred at an antecedent site. For the neuron in Figure 7, the average binaural level was held constant at 60 dB SPL. There was no response to ipsilateral stimulation alone (Fig. 7A). Contralateral stimulation at all intensities evoked two action potentials tightly locked to the stimulus onset, which rode on a transient depolarization (Fig. 7B,D,G). Despite the absence of an ipsilateral response, the binaural response (Fig. 7C,E,H) was suppressed relative to the contralateral response. Binaural stimulation typically evoked no action potentials, and the transient depolarization was progressively attenuated at higher ipsilateral intensities. Only when the contralateral level was raised to 80 dB and the ipsilateral level was lowered to 40 dB (Fig. 7H) did the binaural response begin to resemble the contralateral response. However, even then, the binaural response was less robust than that evoked by contralateral stimulation alone.
Fig. 7.

A binaural neuron that displayed a transient excitation to contralateral stimulation but did not respond to ipsilateral stimulation. Illustrated are the records to two sequential tone bursts (11 kHz) at the intensities indicated. A, Ipsilateral (IPSI) stimulation did not evoke a response. B, D, G (middle column), Contralateral (CONTRA). Each tone burst evoked a transient depolarization and two closely spaced action potentials that were tightly coupled to stimulus onset. C, E, H(right column), Binaural responses were attenuated relative to contralateral responses both in the number of action potentials and level of the transient depolarization. F, Contralateral response when resting potential was large relative to the other records displayed. Response profiles to identical stimuli (F, G) were similar despite differences in the magnitude of the resting and action potentials.
As an aside, the magnitude of the resting potential usually did not affect the response pattern. For example, the record in Figure7F reflects the response pattern when the resting potential of the neuron was about −65 mV. Both the discharge and synaptic pattern closely resembled those obtained when the resting potential had declined to approximately −14 mV (Fig. 7G).
Additive interaction
The above two neurons (Figs. 6 and 7) displayed subtractive binaural interactions. In contrast, the neuron in Figure8 displayed additive binaural interactions, i.e., the binaural responses were greater than either of the monaural responses. The responses to ipsilateral (Fig.8A) and contralateral (Fig. 8B) tone bursts both showed a long-latency depolarization on which rode one or two action potentials. The binaural response was facilitated compared with the monaural responses when the ipsilateral level was high (Fig. 8C, 80 dB SPL). It gradually declined as the ipsilateral level was lowered and eventually approached that of the contralateral response (Fig. 8F). The long-latency depolarization seen in the monaural responses appeared to be facilitated in the binaural responses (Figs.8D–F) and could reflect additive interactions at this cell. However, a shorter latency depolarization and accompanying action potential were present in the binaural responses when the ipsilateral level was high. This may be attributable to an excitatory input that is activated by adequate binaural stimulation.
Complex interactions
We also observed complex binaural interactions that could not be explained by a subtractive or additive mechanism. The responses of one such neuron are displayed in Figure 9. This neuron was transiently inhibited by ipsilateral tones (Fig. 9, first column). The response to contralateral tones (Fig. 9, second column) consisted of a transient depolarization followed by a transient hyperpolarization and then a sustained depolarization. However, the responses to binaural tones (Fig. 9, fourth column) were very similar to the contralateral responses. The predicted binaural response (Fig. 9,third column) based on the sum of the ipsilateral and contralateral responses, indicated that the transient hyperpolarization should have been enhanced. Thus, the binaural response did not appear to reflect a simple linear interaction between the monaural inputs. This scenario suggests that the ipsilaterally evoked inhibition comes from a source that is itself inhibited by contralateral stimulation. One candidate is the ipsilateral LSO. The functional significance of such a circuit is unclear but could operate to localize a sound source when the signal at the contralateral ear is weak relative to that at the ipsilateral ear.
Sensitivity to ITDs
Sensitivity to ITDs was tested in low-frequency neurons (<3000 Hz) by delivering slightly disparate frequencies to each ear, i.e., a binaural-beat stimulus. This creates a cyclic variation in the ongoing ITD with a period equal to that of the beat frequency (Kuwada et al., 1979; Yin and Kuwada, 1983a).
We encountered two IC neurons that appeared to largely reflect ITD processing that occurred in the MSO, and we illustrate the responses of one of them in Figure 10. Consistent with this view, like MSO neurons (Goldberg and Brown, 1969), this neuron showed excitatory responses to contralateral and ipsilateral stimulation (Fig. 10A,B). The contralateral response was followed by an after-hyperpolarization. The neuron synchronized strongly to a binaural-beat stimulus (Fig. 10C) as evidenced by bursts of action potentials riding on the crests of a depolarization that followed the beat frequency. However, between these bursts, the membrane potential fell slightly below the resting level (dotted lines). This fall may be related to the after-hyperpolarization seen in the contralateral responses.
Fig. 10.

An ITD-sensitive neuron that responded with excitation to stimulation of either ear. A, Response to three sequential contralateral (Contra) tone bursts (40 dB SPL). B, Response to ipsilateral (Ipsi) stimulation using same stimulus parameters as inA. C, response to a 3 Hz binaural-beat stimulus (contra, 450 Hz; ipsi, 453 Hz; both at 40 dB SPL).
Figure 11A displays the discharge rate of the neuron in Figure 10, plotted as a function of ITD (for details, see Yin and Kuwada, 1983b). Also shown are the discharge rates evoked by contralateral (filled square) and ipsilateral (open square) stimulation. The spike discharge to ITDs was facilitated at favorable ITDs (i.e., the maximum discharge exceeded the sum of the monaural responses) and suppressed at unfavorable ITDs (i.e., the minimum discharge was less than the contralateral or ipsilateral response).
Fig. 11.
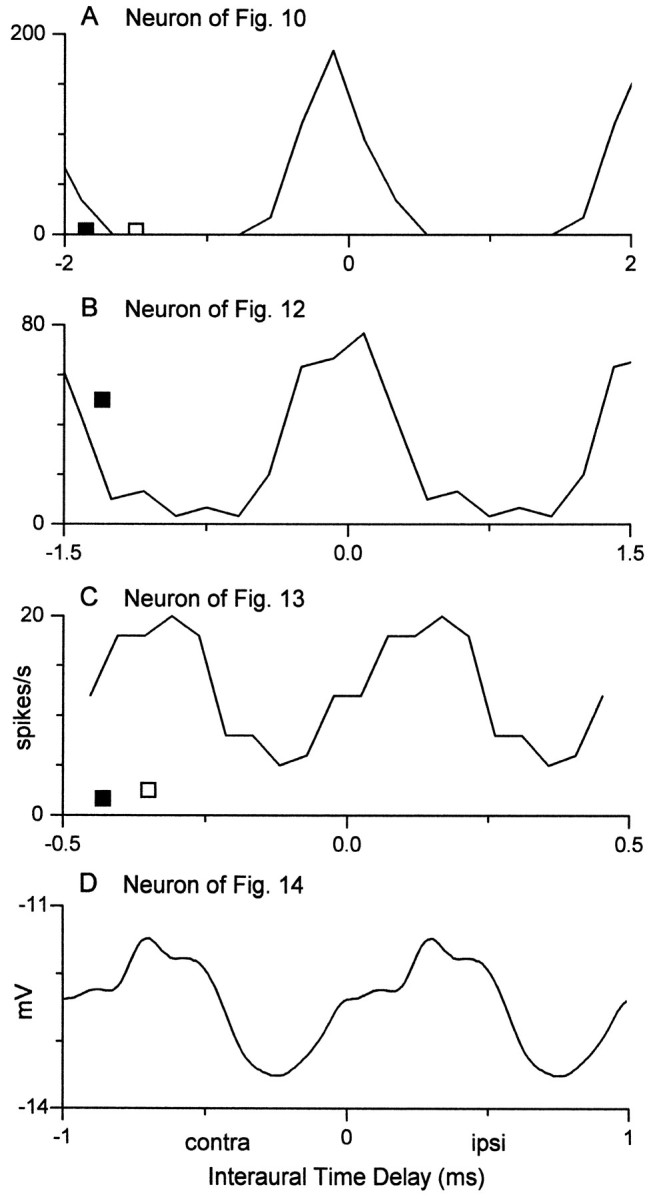
Interaural delay curves generated from the response to the binaural-beat stimulus (for details, see Yin and Kuwada, 1983; Kuwada et al., 1987). A–D, From neurons in Figures 10, 12, 13, and 14, respectively. A–Creflect spike rates, whereas D was derived from the synaptic potentials synchronized to the beat frequency in Figure 14. Response in C represents average spike rates to 25 cycles of the binaural-beat frequency. Open andfilled squares denote spike rates (spikes per second) to contralateral (contra) and ipsilateral (ipsi) stimulation, respectively.
In contrast to the above neuron, which appeared to largely reflect ITD processing that occurred in the MSO, the following three neurons (Figs.12, 13, 14) provide examples of ITD-sensitive neurons that displayed more complex inputs. In response to contralateral tone bursts, the neuron in Figure 12 produced a sustained discharge of action potentials that rode on a sustained depolarization. The depolarization and discharge rate increased as a function of stimulus level, and at higher levels it became a pauser response pattern. During the binaural-beat stimulus, the action potentials occurred at the crests of the cyclic depolarizations that followed the beat frequency. Unlike the neuron of Figure 10, the membrane potential never approached the resting level at unfavorable delays, and an after-hyperpolarization was not seen. Also, unlike the preceding neuron, facilitation was not strong; i.e., the maximal discharge was not substantially different from the contralateral discharge rate (Fig. 11B).
Fig. 12.

An ITD-sensitive neuron that displayed a pauser response pattern to contralateral stimulation at 60–90 dB SPL. The response to ipsilateral stimulation was not tested. A, Responses to contralateral (Contra) tone bursts at the stimulus levels indicated. B, Response to a 3 Hz binaural-beat stimulus (contra, 600 Hz;ipsi, 603 Hz; both at 80 dB SPL).
The second example of a neuron that displayed complex ITD processing is illustrated in Figure 13. In contrast to the preceding neurons, this cell displayed both excitation and inhibition to monaural stimulation (Fig. 13A,B). The discharge to the binaural-beat stimulus followed the beat frequency (3 Hz). This was seen more clearly when the discharge was plotted as a function of ITD for 25 cycles of the binaural beat (Fig.11C). Facilitation was strong, but suppression was not evident (Fig. 11C). Like the neuron of Figure 12, the binaural-beat stimulus evoked a sustained depolarization that did not approach the resting level at unfavorable ITDs.
Our final example of complex ITD processing is a neuron that displayed predominantly inhibitory influences to monaural (Fig.14A,B) and binaural (Fig. 14C) stimulation. The averaged records to contralateral tone bursts showed an onset spike followed by a hyperpolarization that slowly decayed and was still present beyond the stimulus duration. The response to ipsilateral tone bursts had a similar pattern, except that the onset spike was absent. The response to a 3 Hz binaural-beat stimulus exhibited a sustained and cyclic hyperpolarization that followed the beat frequency. Figure11D displays the average cyclic hyperpolarization as a function of ITD.
Extracellular responses of some neurons in the IC of the unanesthetized rabbit (e.g., Fig. 15) are consistent with the behavior of the neuron in Figure 14. In the unanesthetized preparation, spontaneous activity is common, permitting identification of inhibitory responses. The discharge pattern to contralateral (Fig.15A) and ipsilateral (Fig. 15B) tone bursts showed a suppression of the spontaneous activity during the burst duration. Like the neuron in Figure 14, an onset response was associated with contralateral and not ipsilateral stimulation. The discharge to a 1 Hz binaural-beat stimulus followed the beat frequency, but this following response was modulated below the level of the spontaneous activity. Such a pattern is consistent with the cyclical inhibitory pattern seen in the neuron of Figure 14.
The location and morphology of ITD-sensitive neurons mirrored the heterogeneity in their response profiles. Anatomical correlations were obtained for four recordings. The neuron of Figure 10 was located in the central nucleus and had unoriented dendrites; i.e., it was a stellate cell (Oliver et al., 1991, their Fig. 16). The neuron of Fig.12 and another ITD-sensitive neuron (responses not shown) were located in the superficial layers of the dorsal cortex, and both had highly oriented dendrites (Oliver et al., 1991, their Figs. 4, 5). Injection of HRP after the recordings of Figure 13 resulted in labeling of two neurons with juxtaposed cell bodies (Fig.16) in the lateral part of the central nucleus of the IC where low frequencies are represented. Because the two impregnated cells had very similar morphology (Fig.16A,B), we are not particularly concerned with which of the two cells produced the responses of the neuron in Figure 13. They were similar in size, their dendrites were moderately covered with spines, and when viewed on-edge (Fig. 16C,D) were highly oriented, i.e., disk-shaped, and in the same plane. This plane is the same as the orientation of the fibrodendritic layers in the central nucleus.
Fig. 16.

Iontophoretic injection of HRP after completing the recordings in Figure 13 resulted in two impregnated neurons that abutted each other and had similar morphological features.A, Sagittal view indicated a medium-sized neuron with spine-covered dendrites. B, sagittal view of the second cell had features similar to those of the neuron in A.C, coronal view of the neuron in A. Dendrites were highly oriented. D, coronal view of the neuron in B. Dendrites were highly oriented and lay in the same plane as C. D, Sagittal section through the lateral part of the IC indicates the position of the 2 cells. D–V, Dorsal–ventral plane; C–R, caudal–rostral plane.
DISCUSSION
Intracellular recording in situ is a technically demanding procedure that results in small quantities of data. Previous studies reported a yield of approximately one to three neurons per animal (Nelson and Erulkar, 1963; Covey et al., 1996; Pedemonte et al., 1997), which is similar to our yield (approximately two per cat).
We chose to report on all neurons that displayed synaptic potentials and did not impose an arbitrary cutoff based on their resting potentials. The range of resting potentials and spike amplitudes reported by Nelson and Erulkar (1963) is similar to those reported here. They argued that, although small spike amplitudes may reflect cellular damage, spike elimination per se does not greatly affect the EPSPs (Eccles et al., 1961). Moreover, spike amplitude is affected by the location of the recording site relative to the spike generator and by the electrode capacitance. We believe our observations from cells with low resting potentials are valid, because similar synaptic and firing patterns could be identified both within (e.g., Fig.7F,G) and between (e.g., Figs. 1D,14A) cells, independent of their resting potential. Moreover, the response patterns of our cells to acoustic stimulation were consistent with discharge patterns reported using extracellular recording techniques.
Inhibitory potentials may have been more numerous than suggested by our results, because leakage of chloride ions into the cell from the electrode may have attenuated or even reversed inhibitory potentials. The observed IPSPs may have been potentiated by the pentobarbital anesthesia (Kuwada et al., 1989).
Complexity of monaural and binaural responses
The responses of many neurons to monaural stimulation reflected both excitatory and inhibitory influences. Other intracellular studies (Nelson and Erulkar, 1963; Covey et al., 1996; Pedemonte et al., 1997) and pharmacological studies (Faingold et al., 1991a; Pollak and Park, 1993; Le Beau et al., 1996) observed this also. Thus, the excitatory and inhibitory classification used for neurons in the superior olivary complex (SOC) (Goldberg and Brown, 1969) is an oversimplification when used in the IC and most likely at all higher centers.
Many IC neurons may receive inputs from binaural sources and also receive monaural inputs that may participate in binaural interactions (i.e., local binaural processing). Such duality of binaural processing in the IC has been suggested by Batra et al. (1993). Local binaural processing has been demonstrated using locally applied pharmacological agents (Faingold et al., 1991a; Park and Pollak, 1993). The functionality of local binaural processing in the IC has been demonstrated by Sally and Kelly (1992) in which ILD sensitivity was present after bilateral lesions of the SOC.
Inhibitory side bands indicate that frequency tuning is actively maintained in the IC and is not a simple reflection of frequency-tuned inputs. A similar observation has been made in the IC of the bat (Covey et al., 1996). Pharmacological studies have shown that GABA or glycine blockers can broaden the frequency tuning of IC neurons, indicating that side band suppression is via inhibitory mechanisms (Vater et al., 1992; Yang et al., 1992).
Different mechanisms underlie similar discharge patterns
In the IC, the same temporal discharge pattern can be generated in one of three ways. It can be a consequence of the intrinsic membrane properties of a neuron, can reflect the interplay of excitatory and inhibitory inputs, or can mirror the temporal pattern of an input.
The role of membrane properties in determining the response pattern has been delineated in the cochlear nucleus (Wu and Oertel, 1984; Manis, 1990; Feng et al., 1994). Our results suggest that membrane properties are also responsible for the discharge patterns of some IC neurons. For example, IC neurons can display different discharge patterns to depolarizing current (Peruzzi and Oliver, 1995).
Integration of excitation and inhibition can produce the same suite of discharge patterns as the intrinsic membrane characteristics of a neuron. The role of inhibition in shaping onset and pauser responses has been demonstrated by pharmacological blocking studies (Faingold et al., 1991a; Pollak and Park, 1993; Le Beau et al., 1996). The early inhibition responsible for some long-latency responses was observed byCovey et al. (1996) and inferred from extracellular responses recorded in unanesthetized animals (Bock et al., 1972; Kuwada et al., 1989) and in the responses of neurons in anesthetized animals to interaurally delayed clicks (Carney and Yin, 1989).
The response of some neurons appeared to mirror the discharge pattern of an input from a lower center. Onset and pauser patterns do occur in lower nuclei that project to the IC (Pfeiffer, 1966; Guinan et al., 1972a, b; Rhode, 1991; Covey, 1993). Pauser responses are seen in the projection neurons of the dorsal cochlear nucleus (DCN). Semple and Aitkin (1980) demonstrated that IC neurons that received a direct input from the DCN also displayed a pauser discharge pattern. However, Irvine (1986) observed that the pauser patterns in the IC differ from those in the DCN. The pause duration is much longer (12–70 msec) than in the DCN (<10 msec). Furthermore, pauser patterns where the pause is accompanied by a drop to near resting-levels (Fig. 3) may still be attributable to inhibition, as suggested by IPSPs at side band frequencies.
Neurons with the same discharge pattern may play different roles in processing complex stimuli. For example, the different types of onset neurons may respond to sounds in a reverberant environment in different ways. When presented with two successive clicks, onset neurons that mirror an onset response of an input, and those that acquire their response as a result of intrinsic membrane properties, may respond well to both clicks even when the time between the clicks is brief. This is because neurons in lower centers show little suppression to the lagging click (Fitzpatrick et al., 1995; Parham et al., 1996). In contrast, onset neurons that reflect an inhibitory input would be expected to respond weakly to the second click at short interclick intervals. Such a population of neurons with slow recovery times has been observed in the IC (Yin, 1994; Fitzpatrick et al., 1995).
Interaural time differences: heterogeneity of responses
Neurons sensitive to ITDs were a heterogeneous group. Some neurons primarily reflected ITD-sensitive inputs from the MSO. They displayed excitatory influences to monaural stimulation and displayed facilitation and suppression as a function of ITD. Moreover, their delay curves had a central peak at ITDs within the physiological range of the cat (±400 μsec; Roth et al., 1980). These are common features seen in extracellular recordings of MSO neurons (Goldberg and Brown, 1969; Yin and Chan, 1990).
Other neurons displayed response patterns that were not consistent with a simple input from a lower center. Heterogeneous response features of ITD-sensitive neurons have been observed in extracellular recordings (Kuwada and Yin, 1983; Yin and Kuwada, 1983a,b; Kuwada et al., 1984, 1987; Stanford et al., 1992). Complex responses were indicated by the presence of both excitatory and inhibitory potentials, a maintained depolarization at unfavorable ITDs, or the presence of after-hyperpolarization. The most unusual form of ITD sensitivity was displayed by the neuron in Figure 14, in which inhibitory mechanisms appear to play a dominant role. Such ITD sensitivity might be attributable to inhibitory inputs from ITD-sensitive neurons in the DNLL (Brugge et al., 1970; Adams and Mugnaini, 1984; Penney et al., 1984).
The variety in the location and morphology of our ITD-sensitive neurons further indicates the heterogeneity of ITD processing in the IC. Neurons were found in the central nucleus and dorsal cortex of the IC. Both stellate and disk-shaped cells in the central nucleus (FitzPatrick, 1975; Morest and Oliver, 1984; Oliver and Morest, 1984) could be ITD-sensitive. Interestingly, three of four neurons had highly oriented dendrites, one in the central nucleus and two in the dorsal cortex. Their presence in the dorsal cortex is consistent with findings that show MSO fibers penetrating into the low-frequency part of the dorsal cortex (Henkel and Spangler, 1983; Oliver and Beckius, 1993). Thus, both subdivisions may inherit their ITD sensitivity from a common input.
Functional significance
Local interactions transform IC inputs to create de novo response patterns. Such transformations have also been observed in previous intracellular studies (Nelson and Erulkar, 1963;Covey et al., 1996; Pedemonte et al., 1997) and extracellular experiments using lesions and pharmacological techniques (e.g., Irvine, 1986; Faingold et al., 1991a; Sally and Kelly, 1992; Pollak and Park, 1993; Le Beau et al., 1996). Often, these new patterns involve inhibitory inputs. The functional role of these transformations is not clear, but speculations can be made.
Inhibition appears to be a mechanism for local regulation of frequency tuning and ILD sensitivity. Inhibitory side bands have been observed in structures that project to the IC, but the presence of inhibitory potentials in the side bands of IC neurons indicates that this information is not simply relayed to the IC. Inhibition also appears to create ILD sensitivity in IC neurons. ILD is a major cue for localizing high-frequency sounds along the azimuth. Because LSO neurons are also sensitive to ILDs, and they project to the IC, it was surprising to encounter ILD sensitivity created in the IC. The presence of locally produced inhibitory side bands and ILD sensitivity suggests redundancy in the auditory pathways.
Inhibition was also present in ITD-sensitive neurons. The ITD tuning that corresponds to the width of the receptive field is sharper in IC neurons compared with those in the SOC (Fitzpatrick et al., 1995). The mechanism for this sharpening is proposed to involve inhibitory inputs from ITD-sensitive neurons in the LSO and DNLL (Kuwada et al., 1997). The presence of inhibition in our ITD-sensitive neurons is compatible with this hypothesis.
Footnotes
This work was supported by National Institutes of Health Grants DC02178, NS18027, DC00189, and DC00116. We thank Ms. Gretchen E. Beckius for reconstructing the cells.
Correspondence should be addressed to Dr. Shigeyuki Kuwada, Department of Anatomy, University of Connecticut Health Center, Farmington, CT 06032.
REFERENCES
- 1.Adams JC, Mugnaini E. Dorsal nucleus of the lateral lemniscus: a nucleus of GABAergic projection neurons. Brain Res Bull. 1984;13:585–590. doi: 10.1016/0361-9230(84)90041-8. [DOI] [PubMed] [Google Scholar]
- 2.Andersen RA, Snyder RL, Merzenich MM. The topographic organization of corticocollicular projections from physiologically identified loci in the AI, AII, and anterior cortical fields of the cat. J Comp Neurol. 1980;191:479–494. doi: 10.1002/cne.901910310. [DOI] [PubMed] [Google Scholar]
- 3.Batra R, Kuwada S, Stanford TR. High-frequency neurons in the inferior colliculus that are sensitive to interaural delays of amplitude-modulated tones: evidence for dual binaural influences. J Neurophysiol. 1993;70:64–80. doi: 10.1152/jn.1993.70.1.64. [DOI] [PubMed] [Google Scholar]
- 4.Bock GR, Webster WR, Aitkin LM. Discharge patterns of single units in inferior colliculus of the alert cat. J Neurophysiol. 1972;35:265–277. doi: 10.1152/jn.1972.35.2.265. [DOI] [PubMed] [Google Scholar]
- 5.Brugge JF, Anderson DJ, Aitkin LM. Responses of neurons in the dorsal nucleus of the lateral lemniscus of cat to binaural tonal stimulation. J Neurophysiol. 1970;33:441–458. doi: 10.1152/jn.1970.33.3.441. [DOI] [PubMed] [Google Scholar]
- 6.Carney LH, Yin TC. Responses of low-frequency cells in the inferior colliculus to interaural time differences of clicks: excitatory and inhibitory components. J Neurophysiol. 1989;62:144–161. doi: 10.1152/jn.1989.62.1.144. [DOI] [PubMed] [Google Scholar]
- 7.Covey E. The monaural nuclei of the lateral lemniscus: parallel pathways from cochlear nucleus to the midbrain. In: Merchan MA, Juiz JM, Godfrey DA, editors. The mammalian cochlear nuclei. Plenum; New York: 1993. [Google Scholar]
- 8.Covey E, Kauer JA, Casseday JH. Whole-cell patch-clamp recording reveals subthreshold sound-evoked postsynaptic currents in the inferior colliculus of awake bats. J Neurosci. 1996;16:3009–3018. doi: 10.1523/JNEUROSCI.16-09-03009.1996. [DOI] [PMC free article] [PubMed] [Google Scholar]
- 9.Diamond IT, Jones EG, Powell TPS. The projection of the auditory cortex upon the diencephalon and brain stem in the cat. Brain Res. 1969;15:305–340. doi: 10.1016/0006-8993(69)90160-7. [DOI] [PubMed] [Google Scholar]
- 10.Eccles JC, Eccles RM, Iggo A, Lundberg A. Electrophysiological investigations on Renshaw cells. J Physiol (Lond) 1961;159:461–478. doi: 10.1113/jphysiol.1961.sp006821. [DOI] [PMC free article] [PubMed] [Google Scholar]
- 11.Faingold CL, Boersma Anderson CA, Caspary DM. Involvement of GABA in acoustically-evoked inhibition in inferior colliculus neurons. Hear Res. 1991a;52:201–216. doi: 10.1016/0378-5955(91)90200-s. [DOI] [PubMed] [Google Scholar]
- 12.Faingold CL, Gehlbach G, Caspary DM. Functional pharmacology of inferior colliculus neurons. In: Altschuler RA, Bobbin RP, Clopton BM, Hoffman DW, editors. Neurobiology of hearing: the central auditory system. Raven; New York: 1991b. pp. 223–252. [Google Scholar]
- 13.Feng JJ, Kuwada S, Ostapoff E-M, Batra R, Morest DK. A physiological and structural study of neuron types in the cochlear nucleus. I. Intracellular responses to acoustic stimulation and current injection. J Comp Neurol. 1994;346:1–18. doi: 10.1002/cne.903460102. [DOI] [PubMed] [Google Scholar]
- 14.Fitzpatrick DC, Kuwada S, Batra R, Trahiotis C. Neural Responses to simple simulated echoes in the auditory brain stem of the unanesthetized rabbit. J Neurophysiol. 1995;74:2469–2486. doi: 10.1152/jn.1995.74.6.2469. [DOI] [PubMed] [Google Scholar]
- 15.FitzPatrick KA. Cellular architecture and topographic organization of the inferior colliculus of the squirrel monkey. J Comp Neurol. 1975;164:185–208. doi: 10.1002/cne.901640204. [DOI] [PubMed] [Google Scholar]
- 16.Glendenning KK, Masterton RB. Acoustic chiasm: efferent projections of the lateral superior olive. J Neurosci. 1983;3:1521–1537. doi: 10.1523/JNEUROSCI.03-08-01521.1983. [DOI] [PMC free article] [PubMed] [Google Scholar]
- 17.Glendenning KK, Baker BN, Hutson KA, Masterton RB. Acoustic chiasm V: inhibition and excitation in the ipsilateral and contralateral projections of LSO. J Comp Neurol. 1992;319:100–122. doi: 10.1002/cne.903190110. [DOI] [PubMed] [Google Scholar]
- 18.Goldberg JM, Brown PB. Response properties of binaural neurons of dog superior olivary complex to dichotic tonal stimuli: some physiological mechanisms of sound localization. J Neurophysiol. 1969;32:613–636. doi: 10.1152/jn.1969.32.4.613. [DOI] [PubMed] [Google Scholar]
- 19.Guinan JJ, Guinan SS, Norris BE. Single auditory units in the superior olivary complex I: Responses to sounds and classifications based on physiological properties. Int J Neurosci. 1972a;4:101–120. [Google Scholar]
- 20.Guinan JJ, Norris BE, Guinan SS. Single auditory units in the superior olivary complex II: locations of unit categories and tonotopic organization. Int J Neurosci. 1972b;4:147–166. [Google Scholar]
- 21.Henkel CK, Spangler KM. Organization of the efferent projections of the medial superior olivary nucleus in the cat as revealed by HRP and autoradiographic tracing methods. J Comp Neurol. 1983;221:416–428. doi: 10.1002/cne.902210405. [DOI] [PubMed] [Google Scholar]
- 22.Irvine DRF. The auditory brainstem. In: Ottoson D, editor. Progress in sensory physiology, Vol 7. Springer; Berlin: 1986. pp. 79–226. [Google Scholar]
- 23.Kuwada S, Yin TCT. Binaural interaction in low-frequency neurons in inferior colliculus of the cat. I. effects of long interaural delays, intensity, and repetition rate on interaural delay function. J Neurophysiol. 1983;50:981–999. doi: 10.1152/jn.1983.50.4.981. [DOI] [PubMed] [Google Scholar]
- 24.Kuwada S, Yin TCT, Wickesberg RE. Response of cat inferior colliculus neurons to binaural beat stimuli: possible mechanisms for sound localization. Science. 1979;206:586–588. doi: 10.1126/science.493964. [DOI] [PubMed] [Google Scholar]
- 25.Kuwada S, Yin TCT, Syka J, Buunen TJF, Wickesberg RE. Binaural interaction in low-frequency neurons in inferior colliculus of the cat IV. Comparison of monaural and binaural response properties. J Neurophysiol. 1984;51:1306–1325. doi: 10.1152/jn.1984.51.6.1306. [DOI] [PubMed] [Google Scholar]
- 26.Kuwada S, Stanford TR, Batra R. Interaural phase-sensitive units in the inferior colliculus of the unanesthetized rabbit: effects of changing phase. J Neurophysiol. 1987;57:1338–1360. doi: 10.1152/jn.1987.57.5.1338. [DOI] [PubMed] [Google Scholar]
- 27.Kuwada S, Batra R, Stanford TR. Monaural and binaural response properties of neurons in the inferior colliculus of the rabbit: effects of sodium pentobarbital. J Neurophysiol. 1989;61:269–282. doi: 10.1152/jn.1989.61.2.269. [DOI] [PubMed] [Google Scholar]
- 28.Kuwada S, Batra R, Fitzpatrick DC. Neural processing of binaural temporal cues. In: Gilkey RH, Anderson TR, editors. Binaural and spatial hearing in real and virtual environments. Erlbaum; Mahwah, NJ: 1997. pp. 399–426. [Google Scholar]
- 29.Le Beau FEN, Rees A, Malmierca MS. Contribution of GABA- and glycine-mediated inhibition to the monaural temporal response properties of neurons in the inferior colliculus. J Neurophysiol. 1996;75:902–919. doi: 10.1152/jn.1996.75.2.902. [DOI] [PubMed] [Google Scholar]
- 30.Manis PB. Membrane properties and discharge characteristics of guinea pig dorsal cochlear nucleus neurons studied in vitro. J Neurosci. 1990;10:2338–2351. doi: 10.1523/JNEUROSCI.10-07-02338.1990. [DOI] [PMC free article] [PubMed] [Google Scholar]
- 31.Mitani A, Shimokouchi M, Nomura S. Effects of stimulation of the primary auditory cortex upon colliculogeniculate neurons in the inferior colliculus of the cat. Neurosci Lett. 1983;42:185–189. doi: 10.1016/0304-3940(83)90404-4. [DOI] [PubMed] [Google Scholar]
- 32.Morest DK, Oliver DL. The neuronal architecture of the inferior colliculus in the cat: defining the functional anatomy of the auditory midbrain. J Comp Neurol. 1984;222:209–236. doi: 10.1002/cne.902220206. [DOI] [PubMed] [Google Scholar]
- 33.Nelson PG, Erulkar SD. Synaptic mechanisms of excitation and inhibition in the central auditory pathway. J Neurophysiol. 1963;26:908–923. doi: 10.1152/jn.1963.26.6.908. [DOI] [PubMed] [Google Scholar]
- 34.Ogden TE, Citron MC, Pieranto R. Jet stream microbeveler-inexpensive way to bevel ultrafine glass micropipettes. Science. 1978;201:469–470. doi: 10.1126/science.663670. [DOI] [PubMed] [Google Scholar]
- 35.Oliver DL, Beckius GE. Ascending projections from the cochlear nucleus to the inferior colliculus and their interactions with projections from the superior olivary complex. In: Merchan MA, Juiz JM, Godfrey DA, editors. The mammalian cochlear nuclei: organization and function. Plenum; New York: 1993. pp. 335–347. [Google Scholar]
- 36.Oliver DL, Heurta MF. Inferior and superior colliculi. In: Webster DB, Popper AN, Fay RR, editors. The mammalian auditory pathway, Vol 1, Neuroanatomy. Springer; New York: 1992. pp. 168–221. [Google Scholar]
- 37.Oliver DL, Morest DK. The central nucleus of the inferior colliculus in the cat. J Comp Neurol. 1984;222:237–264. doi: 10.1002/cne.902220207. [DOI] [PubMed] [Google Scholar]
- 38.Oliver DL, Kuwada S, Yin TCT, Haberly L, Henkel CK. Dendritic and axonal morphology of HRP-injected neurons in the inferior colliculus of the cat. J Comp Neurol. 1991;303:75–100. doi: 10.1002/cne.903030108. [DOI] [PubMed] [Google Scholar]
- 39.Oliver DL, Winer JA, Beckius GE, Saint Marie RL. Morphology of GABAergic neurons in the inferior colliculus of the cat. J Comp Neurol. 1994;340:27–42. doi: 10.1002/cne.903400104. [DOI] [PubMed] [Google Scholar]
- 40.Parham K, Zhao B, Kim DO. Responses of auditory nerve fibers of the unanesthetized decerebrate cat to click pairs as simulated echoes. J Neurophysiol. 1996;76:17–29. doi: 10.1152/jn.1996.76.1.17. [DOI] [PubMed] [Google Scholar]
- 41.Park TJ, Pollak GD. GABA shapes sensitivity to interaural intensity disparities in the mustache bat’s inferior colliculus: implications for encoding sound location. J Neurosci. 1993;13:2050–2067. doi: 10.1523/JNEUROSCI.13-05-02050.1993. [DOI] [PMC free article] [PubMed] [Google Scholar]
- 42.Pedemonte M, Torterolo P, Velluti RA. In vivo intracellular characteristics of inferior colliculus neurons in guinea pigs. Brain Res. 1997;759:24–31. doi: 10.1016/s0006-8993(97)00123-6. [DOI] [PubMed] [Google Scholar]
- 43.Penney GR, Conley M, Schmechel DE, Diamond IT. The distribution of glutamic acid decarboxylase immunoreactivity in the diencephalon of the opposum and rabbit. J Comp Neurol. 1984;228:38–56. doi: 10.1002/cne.902280106. [DOI] [PubMed] [Google Scholar]
- 44.Peruzzi D, Oliver DL. Intrinsic membrane properties and morphology of neurons in the rat inferior colliculus. Assoc Res Otolaryngol Abstr. 1995;18:129. [Google Scholar]
- 45.Pfeiffer RR. Classification of response patterns of spike discharges for units in the cochlear nucleus: tone burst stimulation. Exp Brain Res. 1966;1:220–235. doi: 10.1007/BF00234343. [DOI] [PubMed] [Google Scholar]
- 46.Pollak GD, Park TJ. The effects of GABAergic inhibition on monaural response properties of neurons in the mustache bat’s inferior colliculus. Hear Res. 1993;65:99–117. doi: 10.1016/0378-5955(93)90205-f. [DOI] [PubMed] [Google Scholar]
- 47.Rhode WS. A digital system for auditory neurophysiological research. In: Brown P, editor. Current computer technology in neurobiology. Hemisphere; Washington, DC: 1976. pp. 543–567. [Google Scholar]
- 48.Rhode WS. Physiological–morphological properties of the cochlear nucleus. In: Altschuler RA, Bobbin RP, Clopton BM, Hoffman DW, editors. Neurobiology of hearing: the central auditory system. Raven; New York: 1991. pp. 47–78. [Google Scholar]
- 49.Rockel AJ, Jones EG. The neuronal organization of the inferior colliculus of the adult cat. II. The pericentral nucleus. J Comp Neurol. 1973;149:301–334. doi: 10.1002/cne.901490303. [DOI] [PubMed] [Google Scholar]
- 50.Roth GL, Kochar RK, Hind JE. Interaural time differences: implications regarding the neurophysiology of sound localization. J Acoust Soc Am. 1980;68:1643–1651. doi: 10.1121/1.385196. [DOI] [PubMed] [Google Scholar]
- 51.Saint Marie RL, Ostapoff E-M, Morest DK. Glycine-immunoreactive projection of the cat lateral superior olive: possible role in midbrain ear dominance. J Comp Neurol. 1989;279:382–396. doi: 10.1002/cne.902790305. [DOI] [PubMed] [Google Scholar]
- 52.Sally SL, Kelly JB. Effects of superior olivary complex lesions on binaural responses in rat inferior colliculus. Brain Res. 1992;572:5–18. doi: 10.1016/0006-8993(92)90444-e. [DOI] [PubMed] [Google Scholar]
- 53.Semple MN, Aitkin LM. Physiology of pathway from dorsal cochlear nucleus to inferior colliculus revealed by electrical and auditory stimulation. Exp Brain Res. 1980;41:19–28. doi: 10.1007/BF00236675. [DOI] [PubMed] [Google Scholar]
- 54.Stanford TR, Kuwada S, Batra R. A comparison of the interaural time sensitivity of neurons in the inferior colliculus and thalamus of the unanesthetized rabbit. J Neurosci. 1992;12:3200–3216. doi: 10.1523/JNEUROSCI.12-08-03200.1992. [DOI] [PMC free article] [PubMed] [Google Scholar]
- 55.Vater M, Habbicht H, Kössl M, Grothe B. The functional role of GABA and glycine in monaural and binaural processing in the inferior colliculus of horseshoe bats. J Comp Physiol [A] 1992;171:541–553. doi: 10.1007/BF00194587. [DOI] [PubMed] [Google Scholar]
- 56.Wu SH, Oertel D. Intracellular injection with horseradish peroxidase of physiologically characterized stellate and bushy cells in slices of mouse anteroventral cochlear nucleus. J Neurosci. 1984;4:1577–1588. doi: 10.1523/JNEUROSCI.04-06-01577.1984. [DOI] [PMC free article] [PubMed] [Google Scholar]
- 57.Yang L, Pollak GD, Resler C. GABAergic circuits sharpen tuning curves and modify response properties in the mustache bat inferior colliculus. J Neurophysiol. 1992;68:1760–1774. doi: 10.1152/jn.1992.68.5.1760. [DOI] [PubMed] [Google Scholar]
- 58.Yin TCT. Physiological correlates of the precedence effect and summing localization in the inferior colliculus of the cat. J Neurosci. 1994;14:5170–5186. doi: 10.1523/JNEUROSCI.14-09-05170.1994. [DOI] [PMC free article] [PubMed] [Google Scholar]
- 59.Yin TC, Chan JC. Interaural time sensitivity in medial superior olive of cat. J Neurophysiol. 1990;64:465–488. doi: 10.1152/jn.1990.64.2.465. [DOI] [PubMed] [Google Scholar]
- 60.Yin TCT, Kuwada S. Binaural interaction in low-frequency neurons in inferior colliculus of the cat. II. Effects of changing rate and direction of interaural phase. J Neurophysiol. 1983a;50:1000–1019. doi: 10.1152/jn.1983.50.4.1000. [DOI] [PubMed] [Google Scholar]
- 61.Yin TCT, Kuwada S. Binaural interaction in low-frequency neurons in inferior colliculus of the cat. III. Effects of changing frequency. J Neurophysiol. 1983b;50:1020–1042. doi: 10.1152/jn.1983.50.4.1020. [DOI] [PubMed] [Google Scholar]