

Abstract
Spinocerebellar ataxia type 1 (SCA1) is an autosomal dominant neurological disorder caused by the expansion of a CAG repeat encoding a polyglutamine tract. Work presented here describes the behavioral and neuropathological course seen in mutant SCA1 transgenic mice. Behavioral tests indicate that at 5 weeks of age mutant mice have an impaired performance on the rotating rod in the absence of deficits in balance and coordination. In contrast, these mutantSCA1 mice have an increased initial exploratory behavior. Thus, expression of the mutant SCA1 allele within cerebellar Purkinje cells has divergent effects on the motor behavior of juvenile animals: a compromise of rotating rod performance and a simultaneous enhancement of initial exploratory activity. With age, these animals develop incoordination with concomitant progressive Purkinje neuron dendritic and somatic atrophy but relatively little cell loss. Therefore, the eventual development of ataxia caused by the expression of a mutant SCA1 allele is not the result of cell death per se, but the result of cellular dysfunction and morphological alterations that occur before neuronal demise.
Keywords: transgenic mice, neurodysfunction, CAG repeat, spinocerebellar ataxia type 1, Purkinje cell, motor behavior
Spinocerebellar ataxia type 1 (SCA1) is an autosomal dominant neurological disorder characterized by ataxia and cranial motor neuropathies. Although the basis of the ataxia probably is multifactorial, a consistent neuropathological finding is loss of Purkinje cells in the cerebellar cortex and loss of neurons in the inferior olivary nuclei (Gilman et al., 1996). Many patients also have atrophy of the basal pontine nuclei. The reason for the divergence of the pathological abnormalities remains unclear.
SCA1 is caused by the expansion of a CAG trinucleotide repeat in the SCA1 gene that results in the expansion of a polyglutamine tract within the SCA1 gene product, ataxin-1 (Orr et al., 1993). Both transcription and translation of the expandedSCA1 allele have been shown in SCA1 patients (Orr et al., 1993; Servadio et al., 1995). Although the SCA1 gene is expressed ubiquitously (Banfi et al., 1994), only a subset of neurons is affected in the disease. Among the neuronal populations most affected are the Purkinje cells of the cerebellar cortex (Koeppen, 1991). Developmental expression studies performed in the mouse have detected a transient burst of Sca1 expression in the Purkinje cells of the cerebellum at postnatal day 14 (P14) (Banfi et al., 1996), the time at which the murine cerebellar cortex becomes physiologically functional.
In addition to SCA1, the expansion of an unstable CAG repeat causes Huntington’s disease (HD) (Huntington’s Disease Collaborative Research Group, 1993), spinal and bulbar muscular atrophy (SBMA) (LaSpada et al., 1991), dentatorubral–pallidoluysian atrophy (DRPLA) (Koide et al., 1994), Machado–Joseph disease (MJD/SCA3) (Kawaguchi et al., 1994), spinocerebellar ataxia type 2 (SCA2) (Imbert et al., 1996;Pulst et al., 1996; Sanpei et al., 1996), and spinocerebellar ataxia type 6 (SCA6) (Zhuchenko et al., 1997). These disorders share several characteristics that have led to the suggestion of a common mechanism of pathogenesis. Among the shared features are an autosomal dominant mode of inheritance, except for X-linked SBMA, and genetic anticipation on paternal transmission of an affected allele. Except for SCA6, the size ranges of the CAG repeat tract within each gene are similar, both on unaffected chromosomes (∼6–37 repeats) as well as on affected chromosomes (∼36–121 repeats). Interestingly, each disease has a unique and often cell-specific pattern of pathology despite the common ubiquitous expression profile for each of the associated genes.
As part of efforts to understand the role of the expanded CAG/polyglutamine tracts in the genesis of disease, transgenic mice displaying neurological abnormalities have been established for SCA1 (Burright et al., 1995), MJD/SCA3 (Ikeda et al., 1996), and HD (Mangiarini et al., 1996). Although lines of transgenic animals that expressed a wild-type human SCA1 allele had no neurological disease, all lines of transgenic mice that expressed the mutant form of the SCA1 gene developed ataxia. The work presented here describes the neurological and structural correlates of the behavioral abnormalities and ataxia in the SCA1 transgenic mice.
MATERIALS AND METHODS
Transgenic mice. Transgene configuration and establishment of the B05/+ and A02/+ lines carrying a mutantSCA1 allele with 82 CAG repeats and an interruptedSCA1 allele with 30 repeats, respectively, have been described (Burright et al., 1995).
Footprint analysis.After the coating of their hind feet with a nontoxic paint, animals were allowed to walk through a dark 40-cm-long, 9-cm-wide, 6-cm-high tunnel. Then the footprint patterns made on the paper lining the floor of the tunnel were scored for four step parameters. Step Length, average distance of forward movement between alternate steps; step length was calculated by measuring the distance of travel through the tunnel divided by the number of steps used to traverse that distance. Gait Width, average lateral distance between opposite left and right steps; the gait width was determined by measuring the perpendicular distance of a given step to a line connecting its opposite preceding and succeeding steps. Alternation Coefficient, calculated value describing the uniformity of step alternation; a perfect tandem alternating gait in which all alternate steps fell exactly equidistant between the preceding and succeeding opposite steps would have a calculated alternation coefficient of zero. Conversely, a shuffle gait in which all alternate steps fell exactly beside the preceding opposite steps would have a calculated value of 0.5. The alternation coefficient was calculated by determining the mean of the absolute values of 0.5 minus the ratio of right–left step distance to right–right step distance for every right–left step pair taken in the tunnel. Linear Movement, average change in angle between consecutive right–right steps; this measurement was calculated by drawing a line perpendicular to the direction of travel, starting at the first right footprint. The angle between this perpendicular line and each subsequent right footprint was determined, and differences in angle were calculated between each consecutive step pair. The absolute values of all angle differences were summed and divided by the number of steps scored. A large linear movement measurement would be indicative of nonlinear movement, or weaving, through the tunnel.
Accelerating rotating rod test. The rotating rod apparatus (Accelerating Model, Ugo Basile Biological Research Apparatus, Varese, Italy) was used to measure the ability of mice to improve motor skill performance with training. Only naive animals were used in this study. Mice were placed on the rod (3 cm in diameter) for four trials per day for 4 consecutive days. Each trial lasted a maximum of 10 min, during which time the rotating rod underwent a linear acceleration from 4 to 40 rpm over the first 5 min of the trial and then remained at maximum speed for the remaining 5 min. Animals were scored for their latency to fall (in seconds) for each trial. Animals rested a minimum of 10 min between trials to avoid fatigue and exhaustion. To investigate whether B05/+ mice at 5 weeks of age had a preexisting motor performance deficit on the rotating rod, we tested a separate set of untrained, naive wild-type and B05/+ mice for their ability to remain on the rotating rod at maximum speed (40 rpm). The results were analyzed by a two-way repeated measures ANOVA that factors genotype, day, and trial.
Bar cross test. The bar-crossing apparatus, as designed byGerlai et al. (1993), tests for balance and motor coordination. The apparatus consists of a horizontal U-shaped platform made of Formica supported on 30 cm legs. The two parallel 30-cm-long bars of the U were wide enough (18 mm) for the mice to walk easily, whereas the piece connecting them, the challenge bar, was also 30 cm long but only 2 mm wide. Animals were placed on one of the wide bars and allowed to move about on the apparatus for 10 min. After the spontaneous activity portion of the bar cross test, animal were subjected to a forced crossing of the challenge bar. In this task, animals were placed in the middle of the challenge bar to force a cross attempt. A maximum of 120 sec was allowed for mice to stay on the bar, and the latency to fall (Fall) or cross (Cross) successfully was measured in seconds. A Forced Cross score was calculated as follows: if Cross was >0, then Forced Cross= 120 − Cross; if Fall was >0, thenForced Cross = Fall − 120. Each individual animal was assigned a value between +120 (most agile) and −120 (least agile). The surface of the apparatus was cleaned with a 70% ethanol solution and air-dried between mice. Animal performances on the bar cross apparatus were videotaped and later manually scored for the following spontaneous motor behaviors as defined (Crusio and Van Abeelen, 1986; Crusio et al., 1989; Gerlai et al., 1993):Locomotion Time, duration of motor activity;Passivity, duration of inactivity; Turns, frequency of 180° turns on the wide bars; Cross Attempts, frequency of an animal’s placing at least two feet onto the challenge bar and elongating its body in an attempt to cross; Slips, frequency of an animal having one or more legs unexpectedly slip off the wide bar or challenge bar; Sniff Up, frequency of pointing nose upward while making movements of nasal passages;Sniff Down, frequency of placing head below the platform while making movements of nasal passages; Falls, frequency of falling off the platform; Grooming Time, duration of wipes, licks, combs, and scratches while the animal has assumed a sitting position with arched back; Full Cross, frequency of successfully crossing the challenge bar; Half Cross, frequency of starting to cross the challenge bar but turning back before reaching the other side; Urination and Defecation, frequency of. Tests were performed on mice between 10:00 A.M. and 4:00 P.M.
Open field test. This test was used to assess exploratory behavior and general locomotor activity. Fifteen wild-type and 14 B05/+ mice were analyzed. Mice were placed into the center of a 60 × 60 cm open arena containing a 10 × 10 cm gridded floor and were allowed to move under indirect illumination for 15 min per test for 6 consecutive days. The surface of the arena was cleaned with a 70% ethanol solution and air-dried between mice. On the fourth day three different objects were placed in the arena. These objects remained in the arena on the fifth day, but the positions of two of the objects were reversed on day 6. Activities of animals in the arena were videotaped and later were scored for the total number of grid crossings in each of three intervals of 5 min for each day’s test and for the latency of the animal to initially reach the periphery of the arena after introduction into it.
Statistical analysis. Behavioral scores were subjected to either single-factor ANOVA or repeated measures ANOVA with the SuperANOVA package software version 1.11 for Macintosh (Abacus Concepts, Berkeley, CA).
Histological examination and immunohistochemistry.Brains of transgenic and nontransgenic mice were immersion-fixed in 10% phosphate-buffered formalin for a minimum of 3 d. Tissue was processed as previously described (Burright et al., 1995). Sections were cut on a rotary microtome (6–8 μm) or vibratome at (30–50 μm). Routine histological examination of microtome sections was done after staining with hematoxylin and eosin. Immunohistochemical detection of calbindin (6–8 and 30–50 μm sections) was performed by using mouse monoclonal antibodies to calbindin (Sigma). Paraffin sections (6–8 μm) of tissues were rehydrated via xylol and graded alcohols. After they were blocked with 10% normal horse serum for 1 hr, the sections were incubated with mouse anti-calbindin overnight at 4°C. The sections were washed with two changes of PBS and then incubated with the secondary antibody, horse anti-mouse IgG (Vector Laboratories, Burlingame, CA). Sections were incubated with avidin–biotin complex (ABC; Vector) for 30 min at room temperature, rinsed with PBS, and then treated with DAB (Vector) to visualize substrate. Vibratome sections were incubated in normal donkey serum for at least 1 hr at room temperature (5% serum in 0.2 mPBS/0.3% Triton X-100; PBS-T). After the removal of blocking solution, sections were incubated with anti-calbindin primary antibody overnight at 4°C. The tissue was washed with at least three changes of PBS-T and then incubated with donkey anti-mouse (H+L)–Cy3 secondary antibody (Zymed, San Francisco, CA) for 2 hr at room temperature or overnight at 4°C. After being washed, the sections were mounted onto coverslips in 1.3% noble agar, dehydrated in alcohol, and cleared in methyl salicylate.
Quantitation of Purkinje cells. Paraffin-embedded sagittally oriented 5 μm sections of mouse brains were cut at 50 μm intervals. Comparable sections from vermis, medial hemisphere, and lateral hemisphere were used for cell mapping and counting. Sections from 12-week-old animals were stained with hematoxylin and eosin, whereas sections from 24-week-old animals were immunostained with PKCγ (Sigma) and counterstained with hematoxylin to better identify the shrunken Purkinje cells. Four B05/+ and three littermate control mice were examined at each site. A Leitz Orthoplan microscope coordinated with Bioquant System IV (R & M Biometrics, Nashville, TN) software was used to map the x–y coordinates and to count the numbers of Purkinje cells after visual identification. The raw coordinate data obtained by the Bioquant software were analyzed with Macintosh Panda software and programs written especially for this purpose. Statistical significance was determined by Student’s t test.
All behavioral tests and morphometric studies were performed and assessed without knowledge of the genetic identity of the mice.
RESULTS
Progression of neurological alterations in SCA1transgenic mice
Previously, we have described the generation and initial characterization of transgenic animals expressing either a normal humanSCA1 allele (A0− lines; 30 CAG repeats) or a mutant humanSCA1 allele (B0− lines; 82 CAG repeats) (Burright et al., 1995). Although the home cage behavior of A0− transgenic animals, including A02, is indistinguishable from nontransgenic age-matched animals, heterozygous B05 transgenic mice develop signs of neurological abnormality, as assessed by home cage behavior, at ∼12 weeks of age. The initial abnormal neurological signs include a gentle swaying of the head while walking and mild incoordination. These abnormalities progressively worsen over the following weeks until the animals become clearly ataxic when walking. To assess further the neurological consequences of the expression of unaffected and affectedSCA1 alleles in transgenic mice, we subjected wild-type (+/+) nontransgenic, unexpanded SCA1 transgenic (A02/+), and expanded SCA1 transgenic (B05/+) mice to several tests of motor skill and behavior.
Gait abnormalities in SCA1 transgenic mice
Gait parameters of transgenic mice were compared with those of nontransgenic mice by appraising footprint patterns (Fig.1) of 6-week-old, 12-week-old, and 1-year-old animals. The rear paws of transgenic and nontransgenic littermates were inked, and the mice were allowed to walk through a tunnel with a piece of paper on its floor. The resulting footprint patterns were assessed quantitatively by four measurements: step length, gait width, step alternation coefficient, and linearity of movement (Fig. 1C–F). With these criteria the gait pattern of 6-week-old B05/+ SCA1 transgenic mice did not differ from that of their age-matched nontransgenic littermates, whereas A02/+ animals had an increased step length, a decreased gait width, and a decreased alternation coefficient. At 12 weeks of age, when the abnormalities in B05/+ home cage behavior first become apparent (Burright et al., 1995), B05/+ animals had no significant alterations in the footprint patterns except in step length (mean for B05/+ was 21.4 vs 25.5 mm for wild-type animals; p = 0.0094). At 1 year of age, the footprint patterns of B05/+ animals differed dramatically in all measured parameters from the patterns generated by 1-year-old nontransgenic littermates. Instead of walking along a straight line with a smooth alternating gait as did wild-type animals, 1-year-old B05/+ mice weaved from side to side while moving through the tunnel, using a wider base and shorter steps in a gait that lacked a normal, uniform alternating left–right step pattern. A02/+ transgenic animal footprint patterns were indistinguishable from wild-type controls at 1 year of age (Fig. 1C–F).
Fig. 1.

Analysis of footprint patterns produced by wild-type, A02/+, and B05/+ animals. Representative footprint patterns of 1-year-old wild-type (A) and B05/+ (B) animals are shown. Footprint patterns of 6-week-old, 12-week-old, and 1-year-old wild-type, A02/+, and B05/+ animals were quantitatively assessed for step length (C), gait width (D), step alternation (E), and linearity of movement (F). Although A02/+ animals had slightly increased step length and decreased gait width and alternation coefficients at 6 weeks of age, their footprint patterns were indistinguishable from those produced by wild-type animals at 1 year. B05/+ animals showed no abnormalities in footprint patterns at 6 weeks of age. By 1 year of age, B05/+ animals displayed a significantly shorter step length, broader gait width, higher alternation coefficient (indicating irregular step alternation), and increased linear movement measure (indicating a nonlinear movement) as compared with similarly aged wild-type animals. *p < 0.05; **p < 0.01; ***p < 0.001. Error bars indicate SEM and are shown when they are within the resolution of the graph.
Performance on the accelerating rotating rod apparatus
A rotating rod apparatus was used to measure the motor performance ability of the mice during repeated exposure to the task. All data were collected on naive animals. In contrast to other measures of motor performance, analysis of B05/+ mice on the rotating rod revealed a significant deficiency in these mice at the earliest age tested, 5 weeks. Repeated measures ANOVA performed on the complete data set containing wild-type, A02/+, and B05/+ animals confirmed a day by genotype interaction (p = 0.0011); post hoc analysis of wild-type versus B05/+ animals revealed a significant day by genotype interaction (p = 0.0003). Compared with age-matched nontransgenic animals, 5-week-old B05/+ transgenic mice performed equally well on the rotating rod during the four trials on the first day (Fig.2A). However, on the succeeding 3 d of trials the performance of B05/+ mice was significantly below that of nontransgenic wild-type animals (Fig.2A,E). Although the performance of 5-week-old B05/+ transgenic mice did improve significantly from day 1 to day 2, there was no further significant improvement in performance beyond day 2 (Fig. 2A,E). This impairment by 5-week-old B05/+ mice on the accelerating rotating rod task occurred at a time when the transgenic animals showed no abnormalities in home cage behavior and did not have an impaired gait.
Fig. 2.

Performance of A02/+, wild-type +/+, and B05/+ animals on an accelerating rotating rod apparatus. Five-week-old (A), 12-week-old (B), 19-week-old (C), and 1-year-old animals (D) were tested for four trials per day for 4 consecutive days on an accelerating RotaRod. B05/+ animals showed impaired performance improvement (A–C) or failed to improve their performance (D) as compared with age-matched wild-type and A02/+ animals. Repeated measures ANOVA confirmed a day by genotype interaction for 5-week-old (p = 0.0011), 12-week-old (p = 0.0355), 19-week-old (p = 0.0002), and 1-year-old (p = 0.0001) animals. pvalues obtained by performing post hoc analyses comparing the daily performances of wild-type, A02/+, and B05/+ animals are shown in E. Differences in daily performances between wild-type and A02/+ animals (wild-type vs A02/+) approach statistical significance only on day 2 in both 5-week-old and 1-year-old animals; wild-type animals perform significantly better than B05/+ animals (wild-type vs B05/+) on days 2–4 at 5 and 12 weeks and on days 1–4 at 19 weeks and 1 year of age. Comparison of performance on consecutive days (Day vs Day-1) indicates that wild-type animals are able to improve their performance significantly from days 1 to 2 and from 2 to 3 at 5, 12, and 19 weeks of age, and from day 1 to 2 at 1 year of age. A02/+ animals improve day to day in a manner similar to wild-type animals at the ages tested. Conversely, B05/+ animals are unable to improve their performance significantly from day to day after day 2, beginning at 5 weeks of age, and are incapable of any day to day performance improvement at 1 year of age.
B05/+ transgenic animals remain capable of limited performance improvement on the rotating rod at 12 and 19 weeks of age (Fig.2B,C). At 1 year of age performance on the rotating rod is impaired dramatically. Even on the first day of trials, 1-year-old B05/+ mice are unable to perform as well as age-matched wild-type littermates and show no evidence of performance improvement either from Trial 1 to Trial 4 on the first day or during the remaining 3 d of trials (Fig. 2D,E). Thus the initial phase of neurological abnormality in B05/+ animals is characterized by a diminished capability to improve performance on the rotating rod, whereas the later stages of disease in these mice include both the impairment and inability to improve performance on this motor task.
To assess whether 5-week-old B05/+ mice had a preexisting defect in performance on the rotating rod, we tested a separate set of wild-type (n = 15) and B05/+ (n = 14) animals for their ability to remain on the rotating rod when it was spun at maximum speed (40 rpm). Before this test these animals had not been trained on the rotating rod. Wild-type and B05/+ animals had virtually identical means for latency to fall, 27.9 and 27.8 sec, respectively (p = 0.9922). This result demonstrates that naive B05/+ animals have the motor ability to perform as well as wild-type mice at this test.
Mice from the transgenic line A02/+, which expresses an SCA1transgene with an interrupted CAG repeat with 30 triplets (Bur-right et al., 1995), also were examined for their performance on the rotating rod. At 5 weeks of age, A02/+ mice were able to improve their performance such that by day 4 there was no significant difference in the performance level of A02/+ and wild-type controls (Fig. 2A,E). However, the rate of performance improvement seemed to be somewhat diminished in the A02/+ transgenic mice. The absolute level of performance by A02/+ animals on the rotating rod was less than that of wild-type mice on days 2–4. However, this difference was statistically significant only on day 2 (Fig. 2E). At 1 year of age both the level of performance and improvement in performance of A02/+ mice were virtually the same as those of wild-type animals.
Performance on the bar cross apparatus
As a means to assess more fully the fine motor coordination and balance capabilities of wild-type, A02/+, and B05/+ animals,SCA1 transgenic and nontransgenic animals were examined using a bar cross apparatus (Gerlai et al., 1993). The test was performed at an age when B05/+ mice first manifest deficits on the accelerating rotating rod. Figure 3presents the results obtained for wild-type, A02/+, and B05/+ animals at 5 weeks of age on the bar-crossing apparatus. In those activities that assess balance and coordination, i.e., Turns, Slips, Falls, and Forced Cross, the B05/+ transgenic animals performed equally well as their wild-type littermates except for Slips, for which the B05/+ mice appeared to have an increased frequency. However, this increase in Slips may, in fact, be attributable to the surprising observation that the B05/+ animals exhibited significant evidence of enhanced levels of spontaneous motor activity when compared with their wild-type littermates, based on the analysis of Locomotion Time, Passivity Time, Cross Attempts, Sniff Up, and Sniff Down. Most notably, single-factor ANOVA of wild-type and B05/+ Locomotion Times (mean = 67.5 and 128.7 sec, respectively; p = 0.0009) and Passivity Times (mean = 111.5 and 45.6 sec, respectively; p= 0.0002) indicates that B05/+ animals exhibited significantly more spontaneous motor activity than wild-type littermates (Fig. 3). Thus the observed increase in Slips for the B05/+ mice is very likely the result of these animals having significantly higher levels of overall motor activity. In support of this conclusion is the observation that the B05/+ animals are as coordinated as the wild-type animals, as assessed by the Forced Cross test. This test clearly shows that the B05/+ mice and the wild-type littermates are equally agile (Fig. 3). A02/+ transgenic mice performed similarly to B05/+ animals in all parameters scored except in Turns and Grooming Time, in which they had significantly lower levels of activity than wild-type animals (Fig.3).
Fig. 3.
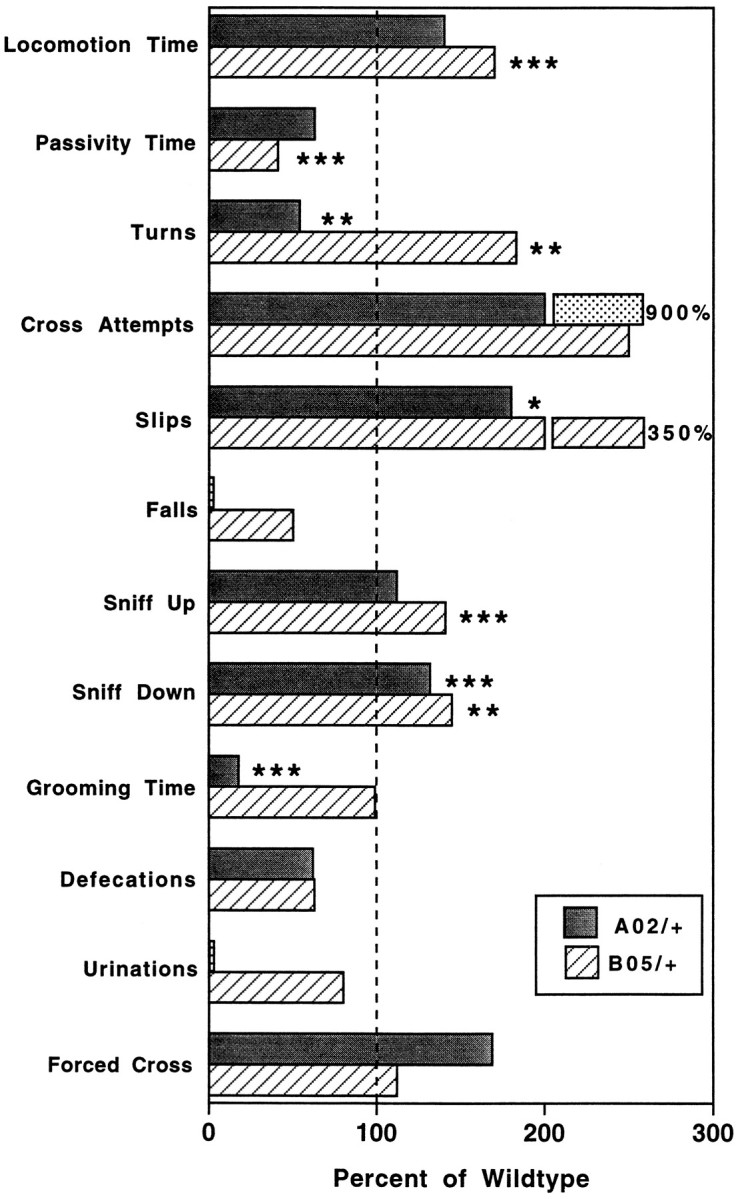
Behavior of A02/+ and B05/+ transgenic animals in the bar cross test. The mean performance values of A02/+ and B05/+ transgenic 5-week-old animals are graphed as the percentage of wild-type animal activity levels. The performance level in each of the described parameters (see Materials and Methods) was analyzed by single-factor ANOVA. In general, B05/+ animals and, to a lesser extent, A02/+ animals displayed increased spontaneous motor activity (Locomotion Time, Passivity Time,Cross Attempts, Sniff Up, andSniff Down) and similar levels of motor coordination (Turns, Slips, Falls, andForced Cross) when compared with wild-type littermate controls (see Results for full description). *p < 0.05; **p < 0.01; ***p < 0.001.
At 1 year of age most B05/+ mice fell repeatedly from the wide platform of the bar cross apparatus, making it impossible to score reliably for specific spontaneous bar-crossing behaviors. Except in Passivity Time, in which A02/+ animals spent less time inactive than wild-type controls (p = 0.0030; data not shown), there were no significant differences between 1-year-old A02/+ and wild-type animals in any of the bar cross behavioral parameters scored.
Performance in the open field test
To assess further the motor activity of the B05/+ transgenic mice, we performed the open field test. This test is used to study novelty-induced exploratory activities (Crusio et al., 1989). The results obtained in the open field test for 6-week-old B05/+ and wild-type littermates are presented in Figure4. Single-factor ANOVA indicated a significant difference between B05/+ and wild-type animals only on the first interval of the first day of testing (Fig. 4A;p = 0.0230). Single-factor ANOVA also indicated that B05/+ animals had a lower latency time to reach the periphery of the open field arena on the first day of testing than did the wild-type animals (13.5 vs 27.9 sec; Fig. 4B; p= 0.0349). These results suggest that B05/+ and wild-type animals differ in their initial spontaneous motor activity when introduced into the open field arena. This difference, however, does not persist beyond the first 5 min interval, at which time their levels of motor activity are essentially equivalent. Neither the introduction nor repositioning of objects within the open field arena induced significant increases in motor activity of either genotype of animal (Fig.4A).
Fig. 4.

Grid crossings and latency to the periphery in the open field test by 6-week-old wild-type and B05/+ animals. Wild-type (n = 15) and B05/+ transgenic (n = 14) animals were scored for total grid crossings for three 5 min intervals per day for 6 consecutive days. The mean number of grid crossings for each scored interval is shown (A). For both wild-type and B05/+ animals, the number of grid crossings in each scored interval decreased on a given day. In addition, there is an overall trend for decreased activity on each subsequent day. Single-factor ANOVA indicated no significant differences between the number of grid crossings made by B05/+ transgenic mice and wild-type animals except in interval one on the first day (351 vs 283 crossings, respectively; p = 0.0230). The daily mean latencies for animals to reach the periphery of the open field arena are shown (B). B05/+ animals reach the periphery significantly faster than wild-type animals on the first day of testing. *p < 0.05.
Time course of histopathology in SCA1transgenic mice
Examination of the cerebellum from B05/+ mice at 10, 12, 14, and 16 d (Fig. 5A) showed normal progression of cerebellar development. The transgenic animals could not be distinguished from nontransgenic littermate controls at any of these times. The earliest time examined at which there was a morphological abnormality was at P25. At that time some of the Purkinje cell somata contained clear cytoplasmic vacuoles (Fig. 5B). By 8 weeks of age there was mild gliosis of the molecular layer (Fig.5C). Some of the Purkinje cells also had cytoplasmic vacuoles. Electron microscopic examination performed at this time revealed that the vacuoles were distended cisternal structures (data not shown). At 12 weeks of age, when abnormalities in home cage behavior are first apparent, there was slightly increased gliosis of the molecular layer, along with the persistence of cytoplasmic vacuoles (Fig. 5D). At 15 weeks the histopathology became more striking, with obvious shrinkage of the molecular layer and the presence of heterotopic Purkinje cells well within the molecular layer (Fig. 5E). At 6–7 months these changes were even more evident (Fig. 5F). Vacuolar changes were present in many Purkinje neurons at this time as well. In addition, there were many Purkinje cells with more than one dendrite issuing from the cell body.
Fig. 5.
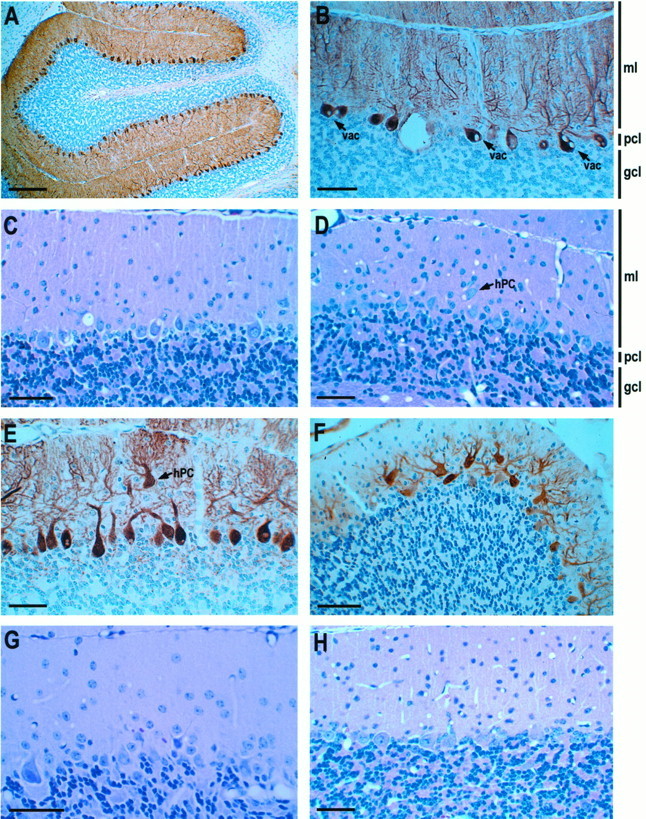
Cerebellar histology of SCA1transgenic mice. A, Postnatal day 16 B05/+ transgenic animal with normal cerebellar cortex structure. B, B05/+ animal at P25 with cytoplasmic vacuoles (vac) present in many Purkinje cells. C, B05/+ animal at 8 weeks of age displaying mild gliosis of the molecular layer and the persistence of cytoplasmic vacuoles. D, B05/+ animal at 12 weeks of age with increased gliosis of the molecular layer. Occasional Purkinje cells were localized heterotopically (hPC) in the molecular layer. E, B05/+ animal at 15 weeks of age with shrinkage of the molecular and a heterotopic Purkinje cell.F, B05/+ animal at 24 weeks of age with occasional Purkinje cells with more than one primary dendrite and reduced calbindin immunoreactivity. G, B05/+ animal at 1 year of age showing Purkinje cell loss and altered morphology.H, One-year-old A02/+ transgenic animal with normal cerebellar cortical structure and cell morphology. A, B, E, and F are stained immunohistochemically for calbindin and counterstained with hematoxylin. C, D, G, and H are stained with hematoxylin and eosin. Scale bars: 150 μm in A; 30 μm in B–H. The molecular layer (ml), Purkinje cell layer (pcl), and granule cell layer (gcl) are indicated also. The vacuolar profiles in C, D, G, and H that are not associated with Purkinje cell somata are vascular lumina dilated by perfusion fixation.
At 1 year of age (Fig. 5G) the mutant SCA1transgenic animals had severe shrinkage of the cerebellar cortex, but it was difficult to ascertain the Purkinje cell population because of the following factors: (1) shrinkage of Purkinje cells, (2) frequent heterotopia of Purkinje cells, and (3) loss of calbindin immunoreactivity in surviving Purkinje cells. One-year-old A02/+ transgenic mice expressing a wild-type human SCA1 allele with 30 CAG repeats (Fig. 5H) were indistinguishable from aged-matched control mice by routine histology.
Dendritic morphology of SCA1 transgenic mice
Because the shrinkage of the molecular layer was disproportionate to the loss of the Purkinje cell population (see below), the dendritic morphology of the Purkinje cells was studied by using immunohistochemical staining for calbindin on 30–50 μm vibratome sections. On P10, P14, P16, and P25 there were no distinguishable differences in the calbindin immunostaining patterns between B05/+ and control animals (Fig.6A). At 6 weeks there were subtle changes in the dendritic staining of Purkinje cells in B05/+ mice (Fig. 6B). The first discernible alteration was a decrease in the number of proximal branches of the dendritic tree on a small number of Purkinje cells. Coupled with this finding was a loss of dendritic spines on some of the remaining distal branches. It should be noted that on most Purkinje cells these alterations were very subtle; however, occasionally Purkinje cells were observed in which the loss of proximal dendritic branches and spines was quite dramatic (Fig. 6B, inset).
Fig. 6.
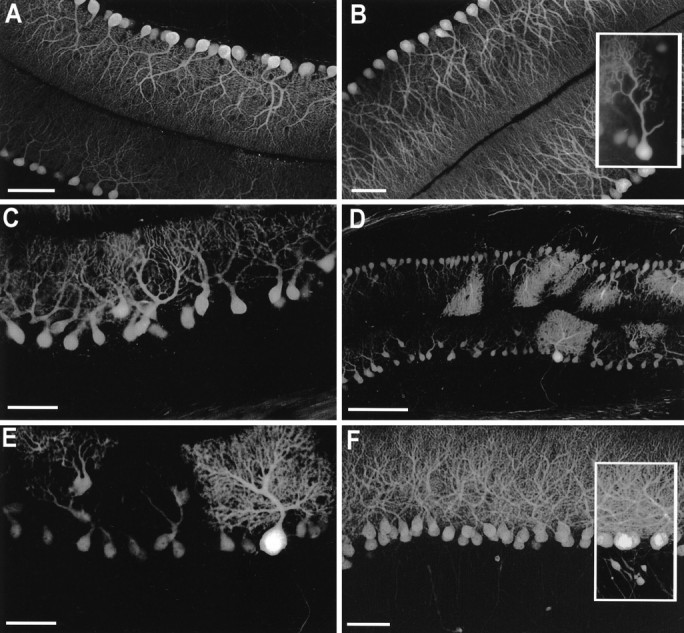
Immunohistochemical staining of cerebellar sections of SCA1 transgenic mice with calbindin.A, B05/+ animal at P25 showed normal Purkinje cell morphology. B, B05/+ animal at 6 weeks of age showed a subtle loss in complexity of the proximal aspects of some Purkinje cell dendrites and occasional Purkinje cells (inset) with extensive reduction in dendritic arborization. C, B05/+ animal at 15 weeks of age with shrinkage of the molecular layer and many Purkinje cells with atrophic dendritic morphology. Occasional Purkinje cells are located heterotopically in the molecular layer.D, E, B05/+ animal at 27 weeks of age with increased severity of the changes described in C. In addition, occasional larger hypertrophic Purkinje cells were apparent. F, A02/+ animal at 1 year of age showed normal Purkinje cell number and dendritic arborization. Some Purkinje cells had proximal axonal dilations (inset). Scale bars: 30 μm in A–C, E, F; 100 μm in D.
By 15 weeks, when there was obvious shrinkage of the molecular layer, it was apparent from the calbindin staining that the shrinkage was attributable to atrophy of Purkinje cells and their dendritic arbors rather than to loss of the Purkinje cell population (Fig.5C,D; see below). There was simplification of the dendritic array in nearly all Purkinje cells, with loss of spines on many of the surviving branches. The heterotopic Purkinje cells had attenuated dendrites, some of which retained spines that still extended to the pial surface. Purkinje cells with perikarya that remained at the interface between the molecular and granular layers frequently had dendritic arrays that ended halfway through the molecular layer. Calbindin immunoreactivity in the white matter and deep nuclei was similar in B05/+ transgenic and wild-type mice at this age.
At 27 weeks, the shrinkage of the molecular layer was more evident, and the majority of Purkinje cells had a stunted, atrophic dendritic morphology and smaller perikarya (Fig. 6C,D). Purkinje cells with more than one primary dendrite were frequent. In addition, many Purkinje neurons had perikarya within the molecular layer. Dendritic spines were rarely evident. Occasional large, hypertrophic Purkinje cells were present with luxuriant dendritic arborization and prominent dendritic spines (Fig. 6D,E). Preservation of normal morphology was more prevalent within lobule X, but scattered normal cells were seen in other lobules as well. The processes of many of these cells appeared to occupy a greater area of molecular layer than normal. The intensity of calbindin immunoreactivity was reduced in the white matter but was similar to that of age-matched controls in the deep nuclear structures. Axonal torpedoes were not present in B05/+ animals. Animals examined at 1 year of age had faint, if any, calbindin immunoreactivity in perikarya, axons, and terminal fields despite the preservation of many Purkinje cells.
One-year-old A02/+ transgenic mice had no evidence of alterations of perikaryal or dendritic morphology, but there were proximal axonal dilations (torpedoes) in some of the cells (Fig. 6F). Calbindin immunoreactivity in the white matter and deep nuclei was preserved.
Time course of Purkinje cell loss in SCA1transgenic mice
Previous analyses of the SCA1 transgenic lines, including B05/+ animals, revealed evidence of Purkinje cell loss (Burright et al., 1995). To correlate the extent of cell loss with the development of the neurological abnormalities, we performed quantitative analyses of the Purkinje cell number on cerebellar midline sagittal sections of wild-type and B05/+ mice at 12 and at 24 weeks of age. A summary of the results of these studies is presented in Table1. At 12 weeks of age, there is evidence of mild (8%) but statistically insignificant (p= 0.1736) Purkinje cell loss in the cerebellar cortex of a B05/+ animals. By 24 weeks of age there is an ∼32% decrease in the Purkinje cell population, indicating significant cell loss (p = 0.0004). In addition to the extensive cell loss at 24 weeks, ∼21% of the remaining Purkinje cells occupied heterotopic positions within the molecular layer. The distribution of Purkinje cell loss and heterotopic positioning was uniform throughout the cerebellum, with the exception of a relative sparing of cell loss and aberrant positioning within lobule X (data not shown).
Table 1.
Summary of Purkinje cell count experiments
| Age (week) | Genotype | Number of animals | Mean PC number ± SEM | p value |
|---|---|---|---|---|
| 12 | wild-type | 3 | 615 ± 16.1 | |
| 12 | B05/+ | 4 | 557 ± 28.7 | 0.1736 |
| 24 | wild-type | 3 | 650 ± 17.4 | |
| 24 | B05/+ | 4 | 444 ± 17.3 | 0.0004 |
DISCUSSION
The earliest morphological change in mutant SCA1transgenic animals (B05/+) is vacuolation of Purkinje cell perikarya at 25 d of age, before development of any signs of altered neurological function. These vacuolar changes are present in at least some Purkinje cells throughout the life of the animal. Because the degree of loss of Purkinje cells is minimal throughout much of the early course of the disease, it is doubtful that the vacuolation is closely associated with a cell death mechanism.
At the time of decreased motor learning on the rotating rod apparatus by B05/+ animals, a loss of proximal dendritic branches and a decrease in the number of dendritic spines were observed in Purkinje cells of these mice, suggesting that the expression of mutant ataxin-1 affects the maintenance of dendrites and spines. It has been suggested that dendritic spines facilitate learning and memory (Harris and Kater, 1994). Thus, the disruption of Purkinje cell dendrites and spines by the expression of an expanded SCA1 allele could be the morphological basis for the loss of motor performance improvement seen in B05/+ mice on the rotating rod. However, this seems less likely because the Sca1 null mice that also have a rotating rod performance deficit display no evidence of Purkinje cell dendritic pathology (A. Matilla, E. D. Roberson, S. Banfi, J. Morales, D. L. Armstrong, E. N. Burright, H. T. Orr, D. J. Sweatt, H. Y. Zoghbi, and M. Matzuk, unpublished data).
Although there was little evidence of Purkinje cell loss at the onset of ataxia in the B05/+ mice (12–15 weeks), there were significant alterations in Purkinje cell dendritic and perikaryal morphology as well as evidence of perikaryal heterotopia. These changes became more widespread and severe as the animals aged. The intensity of calbindin immunostaining in Purkinje cells and their processes diminished as the mice aged and by 1 year was extremely faint despite the persistence of many Purkinje cell perikarya. The diminution of staining intensity probably reflects metabolic alterations in the cells related to expression of the mutant transgene. It is likely that a number of other intrinsic genes of Purkinje cells have altered expression as a reflection of the disease process. The use of calbindin immunostaining to evaluate loss of dendritic spines may be difficult in the later stages of the disease after the intensity of calbindin staining diminishes in Purkinje cells. At those later times, however, it is already clear that there is severe dwindling of the dendritic arbors and that spine degeneration would be expected. This conclusion is supported by the observation at early times (Fig. 6B; 6 weeks) when there is selective loss of branches and spines only in portions of affected Purkinje cells with complete preservation in other areas of the same cell. This pattern cannot be simply the result of diminished expression of calbindin.
A striking feature of B05/+ transgenic mice that followed the onset of ataxia was the presence of numerous Purkinje cells with their perikarya heterotopically located in the intermediate levels of the molecular layer. Histological examination of young animals revealed no heterotopia during development or in the early stages of the disease. Therefore, the heterotopia cannot be explained by abnormal migration of Purkinje cells during development. A more likely explanation for the occurrence of these malpositioned cells is based on the appearance of the dendritic changes earlier in the course of the disease. Purkinje cells have evidence of simplification of the proximal dendrites with loss of branches and dendritic spines as early as 6 weeks of age. It is likely that loss of synaptic input in proximal parts of the dendritic tree, close to the perikaryon, would make it difficult for the cell to generate an action potential. A compensatory mechanism to maintain electrical activity in the Purkinje cell might be to retract the nonfunctional denuded dendritic trunk. Because the morphologically preserved distal dendrites likely would need to maintain contact with parallel fibers in the superficial molecular layer, the only way the shortening of the proximal dendritic trunk can occur is by movement of the perikaryon into the molecular layer with compensatory elongation of the axon.
Several postmortem studies of the cerebellum in patients with SCA1 have shown structural abnormalities of Purkinje cells as well as cell loss. Using Golgi techniques and immunohistochemical methods, Ferrer and colleagues (1994) and Koeppen (1991) have described dendritic simplification with loss of spines, similar to what we describe here in the B05/+ transgenic mice. It is clear from autopsy studies of SCA1 patients that morphological alterations antedate cell death in at least some of the Purkinje cells of these patients. Targeting of theSCA1 mutation to a single cell type known to be involved in the native disease, the Purkinje cell, has allowed us to evaluate the relative effects of structural alterations and cellular loss on the development of ataxia in our transgenic mice.
Although we did not attempt to quantitate the total number of Purkinje cells in B05/+ animals, the quantitative studies that we did perform indicate that there is little loss of Purkinje cells at the onset of ataxia. Comparison of the transgenic B05/+ mice with another transgenic line, SV4, is particularly informative concerning the role of Purkinje cell loss in the development of ataxia. Both transgenic lines were generated using the same Purkinje cell-specific promoter. In the SV4 line, for which the transgene product was SV40 T-antigen, the Purkinje cells underwent apoptosis within a short period after the onset of transgene expression (Feddersen et al., 1992). The SV4 mice were evaluated quantitatively by the same methods used in the present study. The SV4 mice were examined before and after the onset of ataxia. The animals did not become ataxic, however, until approximately two-thirds of Purkinje cells had been lost. Likewise, in pcd mice in which ataxia is thought to be related to loss of Purkinje cells, the onset of ataxia does not occur until ∼50% of those cells are lost (Mullen et al., 1976). Therefore, in models of ataxia that result from death of Purkinje cells, an easily detectable decrease in the Purkinje cell population is required to induce disease. In contrast, B05/+ animals that expressed mutant ataxin-1 developed ataxia at a time when Purkinje cell loss was negligible. This observation, coupled with the numerous Purkinje cell morphological abnormalities in B05/+ transgenic animals, clearly indicates that expression of mutant ataxin-1 can lead to cellular dysfunction sufficient to induce ataxia without causing biologically significant loss of the affected neuronal population. Therefore, we conclude that, in the SCA1 transgenic mice, disease is not caused primarily by cell loss. Rather, loss of Purkinje cells seen at later stages of disease progression is most likely the result of the dysfunction induced at an earlier stage.
Animals of the B05/+ SCA1 transgenic line develop a progressive loss of cerebellar function. Results of behavioral tests demonstrate that at an early stage cerebellar impairment appears to be limited to a subtle motor performance deficit, as assessed by the accelerating rotating rod apparatus. It should be noted that the use of this paradigm to assess deficits in motor learning is controversial because of the difficulty in distinguishing between deficits in motor learning and impairments in motor performance. However, several features of the performance of young B05/+ animals suggest that their deficits on the rotating rod are not attributable to a lower performance capability. At 5 weeks of age the B05/+ animals perform as well as the wild-type littermate controls on the first day of trials on the rotating rod but have an impairment only on successive days of trials (see Fig. 2A). This observation indicates that a training or learning phase might be required for the deficiency in B05/+ to manifest itself. The absence of abnormalities in gait and in the bar cross, open field, and full-speed rotating rod tests also supports the conclusion that the impairment on the rotating rod is not attributable simply to an impairment in motor activity, fine motor control, or coordination.
With increasing age, as the cerebellar impairments of B05/+ mice worsen to reach a stage of severe ataxia, deficiencies in motor activity and gait become apparent. By 1 year of age when there is substantial loss of cerebellar function, B05/+ mice are never able to match the performance of wild-type animals on the rotating rod, even on the first day of trials, and do not demonstrate any ability to improve their performance with training (see Fig. 2D,E). Furthermore, 1-year-old B05/+ mice are unable to perform the behaviors on the bar cross apparatus, typically falling off immediately on placement on the wide platform. These results suggest that the cerebellar dysfunction of the B05/+ mice can be divided into two phases. In the first phase, dysfunction is limited to an impairment of motor learning. At a later stage, impairment advances to a point at which motor activity and coordination become abnormal, and severe ataxia ensues.
Of note is the demonstration that at 5 weeks of age B05/+ mice exhibit increased levels of spontaneous motor activity on both the bar cross apparatus and in the open field test (during the first 5 min interval of day 1). A relationship between ataxin-1 expression and spontaneous motor activity is indicated also by a decrease in this activity inSca1 null mice (A. Matilla, E. D. Roberson, S. Banfi, J. Morales, D. L. Armstrong, E. N. Burright, H. T. Orr, D. J. Sweatt, H. Y. Zoghbi, and M. Matzuk, unpublished data). Because transgene expression in the B05/+ mice was limited to Purkinje cells of the cerebellar cortex, it can be concluded that the increase in spontaneous motor activity seen in B05/+ animals is attributable to a function of ataxin-1 within Purkinje cells.
Finally, the presence of a motor performance deficit (accelerating rotating rod) and divergent spontaneous exploratory behaviors (open field test) in young B05/+ SCA1 transgenic mice and inSca1 −/− mice (A. Matilla, E. D. Roberson, S. Banfi, J. Morales, D. L. Armstrong, E. N. Burright, H. T. Orr, D. J. Sweatt, H. Y. Zoghbi, and M. Matzuk, unpublished data) is intriguing. Alteration of these behaviors in young B05/+ mice indicates that proper ataxin-1 expression by cerebellar Purkinje cells is required for normal motor performance and exploratory behavior. That perturbations in these behaviors are found in young B05/+ and Sca1 −/− mice suggests that a component of the initial alteration in neurological behavior seen with the expression of an expanded allele ofSCA1 is caused by a compromise in ataxin-1 function, e.g., by a loss of function or dominant negative mutation. In this regard, it should be noted that a region that promotes the self-association of ataxin-1 and its interaction with other proteins has been identified (Burright et al., 1997). Clearly, the availability of mice with a null mutation of Sca1 and of transgenic mice with Purkinje cell-specific expression of SCA1 alleles offers valuable resources for the elucidation of ataxin-1 function in complex neurological behaviors at the cellular level.
Footnotes
This work was supported by Grants from the National Institute of Neurological Disorders and Stroke of National Institutes of Health to H.T.O. and H.B.C. (NS33718) and to H.Y.Z. (NS27699). H.Y.Z. is a Howard Hughes Medical Institute Investigator. A.M. was supported by the Spanish Ministerio de Education y Ciencia (PF94 968798). We are grateful to R. Gerlai for helpful comments and to Sandra Horn and Barbara Pinch for excellent technical assistance.
H.B.C. and E.N.B. have contributed equally to this work.
Correspondence should be addressed to Dr. Harry T. Orr, University of Minnesota, Institute of Human Genetics, 420 Delaware Street SE, Box 206 University of Minnesota Health Center, Minneapolis, MN 55455.
REFERENCES
- 1.Banfi S, Servadio A, Chung M-Y, Kwiatkowski TJ, McCall AE, Duvick LA, Shen Y, Roth EJ, Orr HT, Zoghbi HY. Identification and characterization of the gene causing type 1 spinocerebellar ataxia. Nat Genet. 1994;7:513–520. doi: 10.1038/ng0894-513. [DOI] [PubMed] [Google Scholar]
- 2.Banfi S, Servadio A, Chung M-Y, Capozzoli F, Duvick LA, Elde R, Zoghbi HY, Orr HT. Cloning and developmental expression analysis of the murine homolog of the spinocerebellar ataxia type 1 gene (Sca1). Hum Mol Genet. 1996;5:33–40. doi: 10.1093/hmg/5.1.33. [DOI] [PubMed] [Google Scholar]
- 3.Burright EN, Clark HB, Servadio A, Matilla T, Feddersen RM, Yunis WS, Duvick LA, Zoghbi HY, Orr HT. SCA1 transgenic mice: a model for neurodegeneration caused by an expanded CAG trinucleotide repeat. Cell. 1995;82:937–948. doi: 10.1016/0092-8674(95)90273-2. [DOI] [PubMed] [Google Scholar]
- 4.Burright EN, Davidson JD, Duvick LA, Koshy B, Zoghbi HY, Orr HT. Identification of a self-association region within the SCA1 gene product, ataxin-1. Hum Mol Genet. 1997;6:513–518. doi: 10.1093/hmg/6.4.513. [DOI] [PubMed] [Google Scholar]
- 5.Crusio WE, Van Abeelen JHF. The genetic architecture of behavioral response to novelty in mice. Heredity. 1986;56:55–63. doi: 10.1038/hdy.1986.8. [DOI] [PubMed] [Google Scholar]
- 6.Crusio WE, Schwegler H, Van Abeelen JHF. Behavioral response to novelty and structural variation of the hippocampus in mice. Quantitative-genetic analysis of behavior in the open field. Behav Brain Res. 1989;2:75–80. doi: 10.1016/s0166-4328(89)80074-9. [DOI] [PubMed] [Google Scholar]
- 7.Feddersen RM, Ehlenfeldt R, Yunis WS, Clark HB, Orr HT. Disrupted cerebellar development and progressive degeneration of Purkinje cells in SV40 T antigen transgenic mice. Neuron. 1992;9:955–966. doi: 10.1016/0896-6273(92)90247-b. [DOI] [PubMed] [Google Scholar]
- 8.Ferrer I, Genis D, Dávalus A, Bernadó L, Sant F, Serano T. The Purkinje cell in olivopontocerebellar atrophy. A Golgi and immunohistochemical study. Neuropathol Appl Neurobiol. 1994;20:38–46. doi: 10.1111/j.1365-2990.1994.tb00955.x. [DOI] [PubMed] [Google Scholar]
- 9.Gerlai R, Friend W, Becker L, O’Hanon D, Marks A, Roder J. Female transgenic mice carrying multiple copies of the human gene for S100β are hyperactive. Behav Brain Res. 1993;55:51–59. doi: 10.1016/0166-4328(93)90006-c. [DOI] [PubMed] [Google Scholar]
- 10.Gilman S, Sima AAF, Junck L, Kluin KJ, Koeppe RA, Lohman BA, Little R. Spinocerebellar ataxia type 1 with multiple system degeneration and glial cytoplasmic inclusions. Ann Neurol. 1996;39:241–255. doi: 10.1002/ana.410390214. [DOI] [PubMed] [Google Scholar]
- 11.Harris KM, Kater SB. Dendritic spines: cellular specializations imparting both stability and flexibility to synaptic function. Annu Rev Neurosci. 1994;17:341–371. doi: 10.1146/annurev.ne.17.030194.002013. [DOI] [PubMed] [Google Scholar]
- 12.Huntington’s Disease Collaborative Research Group. A novel gene containing a trinucleotide repeat that is expanded and unstable on Huntington’s disease chromosomes. Cell. 1993;72:971–983. doi: 10.1016/0092-8674(93)90585-e. [DOI] [PubMed] [Google Scholar]
- 13.Ikeda H, Yamaguchi M, Sugai S, Aze Y, Narumiya S, Kakizuka A. Expanded polyglutamine in the Machado–Joseph disease protein induces cell death in vitro and in vivo. Nat Genet. 1996;13:196–202. doi: 10.1038/ng0696-196. [DOI] [PubMed] [Google Scholar]
- 14.Imbert G, Saudou F, Yvert G, Devys D, Trottier Y, Garner J-M, Weber C, Mandel J-L, Cancel G, Abbas N, Dürr A, Didierjean O, Stevanin G, Agid Y, Brice A. Cloning the gene for spinocerebellar ataxia type 2 reveals a locus with high sensitivity to expanded CAG/polyglutamine repeats. Nat Genet. 1996;14:285–291. doi: 10.1038/ng1196-285. [DOI] [PubMed] [Google Scholar]
- 15.Kawaguchi Y, Okamoto T, Taniwaki M, Aizawa M, Inoue M, Katayama S, Kawakami H, Nakamura S, Nishimura M, Akiguchi I, Kimura J, Narumiya S, Kakizuka A. CAG expansions in a novel gene for Machado–Joseph disease at chromosome 14q32.1. Nat Genet. 1994;8:221–227. doi: 10.1038/ng1194-221. [DOI] [PubMed] [Google Scholar]
- 16.Koeppen AH. The Purkinje cell and its afferents in human hereditary ataxia. J Neuropathol Exp Neurol. 1991;50:505–514. doi: 10.1097/00005072-199107000-00010. [DOI] [PubMed] [Google Scholar]
- 17.Koide R, Ikeuchi T, Onodera O, Tanaka H, Igarashi S, Endo K, Takahashi H, Kondo R, Ishikawa A, Hayashi T, Saito M, Tomoda A, Mike T, Naito H, Ikuta F, Tsuji S. Unstable expansion of CAG repeat in hereditary dentatorubral–pallidoluysian atrophy (DRPLA). Nat Genet. 1994;6:9–13. doi: 10.1038/ng0194-9. [DOI] [PubMed] [Google Scholar]
- 18.LaSpada AR, Wilson EM, Lubahn DB, Harding AE, Fischbeck KH. Androgen receptor gene mutations in X-linked spinal and bulbar muscular atrophy. Nature. 1991;352:77–79. doi: 10.1038/352077a0. [DOI] [PubMed] [Google Scholar]
- 19.Mangiarini M, Sathasivam K, Seiler M, Cozens B, Harper A, Hetherington C, Lawton M, Trottier Y, Lehrach H, Davies SW, Bates GP. Exon 1 of the HD gene with an expanded CAG repeat is sufficient to cause a progressive neurological phenotype in transgenic mice. Cell. 1996;87:493–506. doi: 10.1016/s0092-8674(00)81369-0. [DOI] [PubMed] [Google Scholar]
- 20.Mullen RJ, Eicher EM, Sidman RL. Purkinje cell degeneration, a new neurological mutation in the mouse. Proc Natl Acad Sci USA. 1976;73:208–212. doi: 10.1073/pnas.73.1.208. [DOI] [PMC free article] [PubMed] [Google Scholar]
- 21.Orr HT, Chung M-Y, Banfi S, Kwiatkowski TJ, Jr, Servadio A, Beaudet AL, McCall AE, Duvick LA, Ranum LPW, Zoghbi HY. Expansion of an unstable trinucleotide CAG repeat in spinocerebellar ataxia type 1. Nat Genet. 1993;4:221–226. doi: 10.1038/ng0793-221. [DOI] [PubMed] [Google Scholar]
- 22.Pulst S-M, Nechiporuk A, Nechiporuk T, Gispert S, Chen X-N, Lopes-Cendes I, Pearlman S, Starkman S, Orozco-Diaz G, Lunkes A, Dejong P, Rouleau GA, Auburger G, Korenberg JR, Figueroa C, Sahba S. Moderate expansion of a normally biallelic trinucleotide repeat in spinocerebellar ataxia type 2. Nat Genet. 1996;14:269–276. doi: 10.1038/ng1196-269. [DOI] [PubMed] [Google Scholar]
- 23.Sanpei K, Takano H, Igarashi S, Sato T, Oyake M, Sasaki H, Wakisaka A, Tashiro K, Ishida Y, Ikeuchi T, Koide R, Saito M, Sato A, Tanaka T, Hanyu S, Takiyama Y, Nishizawa M, Shimizu N, Nomura Y, Segawa M, Iwabuchi K, Eguchi I, Tanaka H, Takahashi H, Tsuij S. Identification of the spinocerebellar ataxia type 2 gene using a direct identification of repeat expansion and cloning technique, DIRECT. Nat Genet. 1996;14:277–284. doi: 10.1038/ng1196-277. [DOI] [PubMed] [Google Scholar]
- 24.Servadio A, Koshy B, Armstrong D, Antalffy B, Orr HT, Zoghbi HY. Expression analysis of the ataxin-1 protein in tissues from normal and spinocerebellar ataxia type 1 individuals. Nat Genet. 1995;10:94–98. doi: 10.1038/ng0595-94. [DOI] [PubMed] [Google Scholar]
- 25.Zhuchenko O, Bailey J, Bonnen P, Ashizawa T, Stockton DW, Amos C, Dobyns W, Subramony SH, Zoghbi HY, Lee CC. Autosomal dominant cerebellar ataxia (SCA6) is associated with small polyglutamine expansions in the α1A-voltage-dependent calcium channel. Nat Genet. 1997;15:62–69. doi: 10.1038/ng0197-62. [DOI] [PubMed] [Google Scholar]