

Abstract
Serotonin [5-hydroxytryptamine (5-HT)] is believed to play an important inhibitory role in the regulation of rapid-eye-movement (REM) sleep. 5-HT may exert this effect on neurons of the laterodorsal tegmental (LDT) nuclei that are implicated as important in the generation of REM sleep and phasic REM events such as ponto-geniculo-occipital (PGO) waves and respiratory variability. In rat brainstem in vitro, 5-HT hyperpolarizes and inhibits the bursting properties of LDT neurons assumed to be involved in generating REM sleep and PGO waves. This study tests the hypothesis that in vivo 5-HT at the LDT nuclei suppresses REM sleep and phasic REM events. Ten rats were implanted with bilateral cannulae aimed at the LDT and with electrodes for recording the electroencephalogram, neck electromyogram, PGO waves, and diaphragm electromyogram. During REM sleep, 5-HT (100 nl; 1–1.5 mm), saline, or sham microinjections were performed; repeated microinjections were separated by ∼1 hr. After the first microinjection, REM sleep as a percent of the total sleep time was reduced with 5-HT (mean percent REM, 19.9 ± 2.5% for 5-HT vs 26.8 ± 2.4% for saline; p = 0.02). REM duration was reduced by 37% with 5-HT (p = 0.01), but REM episode frequency was changed less consistently (p = 0.21), suggesting that 5-HT mainly disrupted REM sleep maintenance. Per unit time of REM sleep, 5-HT had no effect on the amount or variability of REM PGO activity (p > 0.740) or on the mean or coefficient of variation of REM respiratory rate (p > 0.11). With subsequent microinjections, the effects of 5-HT on REM sleep were similar. A dose-dependent REM sleep suppression with 5-HT was observed in five rats tested. These data suggest that in vivo 5-HT at the LDT nuclei suppresses REM sleep expression. Although 5-HT did not disproportionately reduce the occurrence of phasic events within REM, total REM phasic activity was reduced because of less REM sleep after 5-HT.
Keywords: rapid-eye-movement sleep, brainstem, pons, serotonin, ponto-geniculo-occipital waves, laterodorsal tegmental nucleus, control of breathing, diaphragm
The cholinergic laterodorsal tegmental (LDT) and pedunculopontine tegmental (PPT) nuclei are believed to play a major role in generating rapid-eye-movement (REM) sleep and phasic REM events such as ponto-geniculo-occipital (PGO) waves (Steriade and McCarley, 1990; Jones, 1991; McCarley et al., 1995). Some LDT and PPT neurons show tonic increases in firing during REM, whereas others fire in bursts immediately preceding PGO waves (McCarley et al., 1978; Sakai and Jouvet, 1980; El Mansari et al., 1989; Steriade et al., 1990b; Kayama et al., 1992). This overall firing pattern contrasts with serotonergic dorsal raphe neurons (DRN) that project to the LDT and PPT (Honda and Semba, 1994) and fire minimally in REM (McGinty and Harper, 1976; Trulson and Jacobs, 1979; Cespuglio et al., 1981). It has been proposed that serotonin [5-hydroxytryptamine (5-HT)] released from DRN suppresses LDT and PPT activity and hence REM sleep and PGO waves (McCarley and Hobson, 1975;McCarley et al., 1995). However, although there is mounting evidence to suggest that DRN serotonergic activity is important in regulating REM sleep (Portas et al., 1996) and PGO activity (Brooks et al., 1972;Jacobs et al., 1972, 1973; Simon et al., 1973), the sites where 5-HT exerts these effects are not well known.
In vitro studies of rodent brainstem show that 5-HT hyperpolarizes cholinergic LDT and PPT neurons, providing cellular evidence that 5-HT inhibits the neurons implicated in generating REM sleep and PGO waves (Leubke et al., 1992; Leonard and Llinas, 1994). Microinjection of 5-HT1A receptor agonists into PPT suppresses REM sleep (Sanford et al., 1994), supporting an extrapolation of the in vitro observations, although the effects of 5-HT at the LDT have not been determined. However, 5-HT agonists microinjected into rat and cat PPT have failed to inhibit PGO waves (Sanford et al., 1994, 1996), suggesting that 5-HT may not inhibit PGO activity at this site. However, the majority of neonatal rat cholinergic LDT neurons in vitro have “bursting” responses that are inhibited by 5-HT (Leubke et al., 1992). Because rat LDT has a greater 5-HT innervation than has the PPT (Sanford et al., 1996), this in vitro observation suggests that 5-HT may act at the LDT in vivo to inhibit both PGO activity and REM sleep. However, this assumption has been questioned because, in contrast to neonatal rats, in vitro studies in mature rodents show that LDT and PPT bursting neurons are noncholinergic (Kang and Kitai, 1990; Leonard and Llinas, 1994), and it is the nonbursting cholinergic neurons that are inhibited by 5-HT (Leonard and Llinas, 1994). Also, in contrast to cats, LDT bursting neurons have not yet been recorded in adult rats (Kayama et al., 1992). This study tests the hypotheses that in vivo microinjection of 5-HT into the LDT of freely behaving adult rats suppresses REM sleep and PGO activity.
Because electrical stimulation of PPT causes respiratory slowing (Lydic and Baghdoyan, 1993), phasic activation of LDT and PPT neurons in REM sleep may also be involved in producing the transient respiratory slowing typical of REM (Phillipson, 1978). Therefore, we also tested the hypothesis that if LDT neurons are phasically activated in REM and cause transient respiratory slowing, then inhibition of phasic activity by 5-HT would produce overall increases in REM respiratory rate with less variability.
MATERIALS AND METHODS
Animals and surgical procedures. Studies were performed on 10 male Sprague Dawley rats (mean, 349 gm; range, 275–450 gm). Each rat was housed individually, maintained on a normal 12 hr light/dark schedule and had access to food and water ad libitum. Surgery was performed under aseptic conditions with anesthesia produced by intraperitoneal ketamine (85 mg/kg) and xylazine (15 mg/kg), with intramuscular supplements as necessary. To record the electroencephalogram (EEG), two stainless steel screws attached to insulated wire were implanted in the skull (from bregma: anteroposterior, +2 mm; mediolateral, −2 mm; and anteroposterior, −3 mm; mediolateral, +2 mm). To record the nuchal electromyogram (EMG), two insulated multistranded stainless steel wires bared at the tips were sutured onto the dorsal cervical neck muscles. Via an abdominal approach, similar electrodes were also sutured onto the costal diaphragm of six rats to record diaphragm EMG (EMGDIA). To record PGO activity, the tips of bipolar stainless steel electrodes (0.25 mm) were stereotaxically aimed at the locus coeruleus bilaterally (from bregma: anteroposterior, −9.3 mm; mediolateral, ±1.0 mm; and dorsoventral, 7.0 mm; six rats) or at the anterior lobe of the cerebellum (from bregma: anteroposterior, −11.6 mm; mediolateral, 0 mm; and dorsoventral, 7.0 mm; four rats) using a stereotaxic atlas (Paxinos and Watson, 1986). Spiky waves having the characteristics of PGO activity are recorded from these sites (Marks, 1978; Farber et al., 1980; Marks et al., 1980a,b; Kaufman and Morrison, 1981). Successful PGO recordings, as judged by REM-related PGO activation and PGO waves elicited in response to auditory stimuli (Marks, 1978; Farber et al., 1980; Marks et al., 1980a,b; Kaufman and Morrison, 1981), were obtained in six of these rats. Double guide cannulae (26 ga, 1.2 mm separation; Plastics One Inc., Roanoke, VA) for microinjections were implanted with their tips aimed 1.0 mm above the LDT nuclei (from bregma: anteroposterior, −9.16 to −9.3 mm; mediolateral, ±0.6 mm; and dorsoventral, 6.0 mm). Wires from the neck and diaphragm muscles were routed subcutaneously to the head. Leads from all recording electrodes were connected to gold-plated amphenol pins inserted into a miniature plug. The plug and cannulae were affixed to the skull with dental acrylic and anchor screws. Animals were allowed to recover for at least 7 d before the experiments.
Recording and microinjection procedures. For electrophysiological recording, a lightweight shielded cable was connected to the plug on the head of the rat. The cable was attached to a counterbalanced swivel that permitted free movement of the rat within its cage. The signals were routed to a Grass 78D polygraph with 7P511 amplifiers. The PGO signal was rectified and integrated using an integrator that reset every second. The EMGDIA signal was amplified and filtered (30–1000 Hz), and the electrocardiogram (EKG) was removed electronically using an oscilloscope and an EKG blanker (SB-1; CWE Inc., Ardmore, PA). The moving-time average (time constant = 200 msec) of the EMGDIA signal was then obtained (MA-821 Moving Averager; CWE Inc., Ardmore, PA). The raw electrophysiological signals and a superimposed video record of each rat were recorded on tape (Modac-1 recorder; Telefactor Corp., Conshohocken, PA).
For microinjections, injection cannulae (33 ga) were secured in place within the guide cannulae and projected 1.0 mm beyond the tip. The tightness of fit of the injection cannulae within the guide was reproducible; this was checked before implantation and was consistent throughout the studies. As such, it would be expected that repeated microinjections within an animal would be at the same site. The injection cannulae were connected to polyethylene tubing (outer diameter, 1.09 mm) that in turn were connected to 1.0 μl Hamilton syringes. The injection cannulae, tubing, and syringes were prefilled with the solution to be injected (see below). Microinjections were delivered at the desired time using a quiet remote-controlled custom-made syringe pump. The onset and termination of drug injections were marked on chart.
Protocol. Experiments were typically performed between 11:00 A.M. and 5:30 P.M., i.e., after attachment to all the equipment and at a time of day when the rats would normally sleep. The rats were studied in their home cages placed within a sound-attenuated recording chamber to which each animal had been previously habituated. The recording chamber was illuminated in accordance with the light/dark cycle and to permit video recording of the animal’s activity. On day 1, a baseline sleep recording was performed. On subsequent days, saline or drug microinjection studies were performed. The sequence of drug or saline days was randomized, and separate studies within an animal were separated by at least 3 d.
After the rats had been connected to the recording cable and injection tubing, they were allowed to settle down and sleep normally before any interventions were performed. For microinjections, the first injection was performed in REM sleep around 1:00 P.M., after the rat had typically experienced several sleep cycles and was sleeping normally. In 10 rats, microinjections of 5-HT (1.0–1.5 mm) or saline were performed. All microinjections (100 nl/min) were delivered in REM sleep and were started 20–30 sec after the onset of the REM episode. Microinjections were terminated after 1 min, i.e., after 100 nl of solution had been delivered. Repeated microinjections were separated by ∼1 hr, and a maximum of five injections were performed on any one day (mode = 4). In five rats, microinjections of methysergide (1.5 mm), a broad-spectrum 5-HT antagonist, were also performed using the same regimen described for 5-HT. In addition, in four rats, single 100 nl microinjections of 8-hydroxy-2-(di-n-propylamino)tetraline (8-OH DPAT; 1.5 μm and 1.5 nm), a 5-HT1A receptor agonist, were also performed at around 1:00 P.M. For these single 8-OH DPAT microinjections, single saline microinjections were also performed as controls.
Data analysis. Wakefulness and non-REM and REM sleep were determined in 10 sec epochs using standard EEG, EMG, and PGO criteria as well as the video record of the animal’s activity. Transitions to REM sleep were also determined by visual inspection using a modification of the criteria of Benington et al. (1994). Transitional sleep was determined from epochs containing low δ activity, high amplitude spindles, and >50% θ rhythm. Brief arousals from sleep were identified from the EEG, EMG, and video record (American Sleep Disorders Association, 1992) and were classified as brief periods of wakefulness lasting between 3 and 15 sec. Sleep efficiency (sleep time/recording time), the percentage of non-REM, REM, and transitional sleep in the sleep time, the number of non-REM, REM, transitional, and wake episodes per hour, and the number of brief arousals per hour were calculated. The median durations of non-REM, REM, transitional, and wake episodes were also calculated. Median, as opposed to mean, values were used to describe typical durations in each rat because the distributions of episode length were not normally distributed (for example of REM distributions, see Results). The distributions were skewed because of the relatively large number of shorter duration episodes with fewer episodes of long duration. Sleep–wake state was analyzed from the onset of the first microinjection to 30 min after the last injection. For the baseline sleep data when there were no microinjections, sleep–wake state was analyzed from the time of the REM episode that occurred close in time to the corresponding microinjections of saline and drug in that rat; these REM episodes constituted the time at which an injection would have been performed, i.e., sham interventions.
The mean amplitude and coefficient of variation (CV) of non-REM and REM sleep PGO activity were calculated from the heights of the integrated PGO signal. The periods of non-REM sleep used for comparison with the REM episodes were those of similar duration that occurred closest in time to the REM periods and did not include transitional sleep. Each individual peak height from the integrated PGO record (integrator reset each second) was measured throughout the REM and non-REM episodes. As such, the calculated magnitude of the integrated signal was not divided by the duration of the episode per se, rather the time base for computation of PGO activity was per second of REM (or non-REM) with the mean peak height and CV calculated from a large number of values in each episode. The decision was made to quantify PGO activity from the integrated signal because of the spiky nature of rat PGO recordings from which, unlike those from cats, it is more difficult to identify reliably and isolate individual PGO waveforms. Furthermore, because most automated PGO detection systems use threshold crossings techniques, these systems have an inherent tendency to miss smaller waveforms and underestimate PGO activity. For example, in a previous study, it was estimated that a third to one half of low-amplitude waves occurring in PGO bursts were missed using such methods (Sanford et al., 1992). However, any increase in PGO amplitude and/or frequency in this study would be detected as increased integrated activity. This was verified by the increased activity in REM sleep compared with non-REM sleep and by the responses to standard stimuli that elicit PGO activity (see Results). Throughout this paper, the changes in this integrated signal are referred to as changes in PGO activity and not PGO waves per se. Respiratory rates in non-REM and REM sleep were calculated in 5 sec epochs, and the mean and CV were also determined.
Statistical analysis. For the sleep measures, planned comparisons were made using paired t tests, and differences were considered statistically significant if the null hypothesis was rejected at a level of p < 0.05 using a two-tailed test. When post hoc planned comparisons were performed after ANOVA with repeated measures (ANOVA-RM), the Bonferroni-correctedp value was used to infer statistical significance. Analyses were performed using Sigmastat (Jandel Scientific, San Rafael, CA). Data are presented as mean ± SEM, i.e., the mean of medians (or means) for the variables measured in the different rats. Mean values were calculated for all variables except episode durations (see above).
Histology. After all studies, the rats were overdosed with intraperitoneal sodium pentobarbital (100 mg/100 gm) and perfused intracardially with 0.9% saline and 10% formalin. Evans blue dye was microinjected (100 nl in 1 min) to assist in locating the injection site. The brains were removed and embedded in celloidin, and 40 μm coronal sections were cut through the areas of interest. The slices were stained with cresyl violet, and injection sites were determined using standard atlases (Paxinos and Watson, 1986; Kruger et al., 1995). Injection sites were identified from the small lesions produced by the cannulae and in some cases also by the small cavities within the tissue created by the effects of repeated microinjections. Determination of injection sites were made by one of us (L.D.S.) without knowledge of the results of the sleep studies.
RESULTS
Figure 1 shows an example of the characteristic increases in PGO activity and respiratory variability in REM compared with non-REM sleep. It can be observed that the overall changes in these indicators of phasic REM sleep were similar between the saline and 5-HT conditions. Figure 2shows an example of the effects of saline and 5-HT microinjections on sleep architecture. It can be observed that the overall amount of REM sleep was reduced in the presence of 5-HT. For the analyses described below, sleep was analyzed both for the first hour after microinjection (i.e., sleep uncomplicated by repeated microinjections) and for the entire recording period (i.e., including all microinjections).
Fig. 1.

Example to show the typical increases in PGO activity and respiratory variability in REM compared with non-REM sleep in both the saline and 5-HT conditions in one rat. All epochs were taken within 17 min of a microinjection. The periods of transient respiratory slowing typical of REM can be observed from the moving time average of the diaphragm EMG signal (MTA EMGDIA). The efficacy in removing the EKG from the raw diaphragm EMG before producing the moving time average (see Materials and Methods) is shown on the upper right. Thetrace on the lower right shows an example of a PGO wave elicited by an auditory tone (onset of 75 dB; 20 msec duration tone indicated by ▴) in wakefulness that produces an increase in integrated output. Int. PGO, Integrated PGO activity. Calibration bars: EEG, 100 μV; EMGNECK, 25 μV; PGO, 100 μV; Int. PGO, 0.5 mV; MTA EMGDIA, 0.5 mV.
Fig. 2.

Example to show the effects of saline and 5-HT microinjections on sleep architecture and REM durations. As shown in the top two panels, repeated microinjections were performed in REM sleep and were separated by ∼1 hr (time of injections indicated by ▾). After the first microinjection, 5-HT compared with saline was associated with reduced REM sleep (18.7% of sleep time vs 28.7%), decreased REM durations (median 86 vs 180 sec), and slightly increased REM episodes per hour (7.1 vs 4.4). Sleep efficiency was unchanged (78.2 vs 79.6%). After all microinjections, similar overall changes were observed. The number of REM episodes of different durations under saline (light shading) and 5-HT (dark shading) conditions are shown (bottom left) for the same rat. This graph shows that there were a larger number of shorter REM episodes with fewer episodes of long duration and also shows that a shift to shorter REM episodes occurred after 5-HT. Similar changes are observed in the bottom right graph that shows the frequency distribution of REM episode durations plotted for all episodes in all rats (n = 196 for 5-HT and n = 223 for saline). For both saline and 5-HT, analyses showed that the REM durations were not normally distributed (p = 0.001 and p < 0.0001, respectively; Kolmogorov–Smirnov tests).
REM sleep in the hour after the first 5-HT microinjection
In the hour after the first 5-HT microinjection, there was a consistent reduction in the amount of REM sleep accumulated over time compared with both saline and sham microinjections (Fig.3A; p = 0.0002 and p = 0.047, respectively; two-way ANOVA-RM). However, there was no significant difference in REM sleep expression between saline and sham conditions (Fig. 3A;p = 0.560). Analysis of the amount of REM sleep in separate 10 min bins after microinjection (Fig. 3B) confirmed that with 5-HT there was a significant reduction in REM sleep expression over time compared with saline and sham microinjections (p = 0.008 and p = 0.016, respectively; two-way ANOVA-RM) and that there was no difference between saline and sham conditions (p = 0.927). Although most REM suppression seemed to occur in the first 20 min after 5-HT compared with saline microinjection, with the largest decrease in the first 10 min (Fig. 3B), the variability between animals made the interaction between drug condition and time after microinjection nonsignificant (p = 0.755). However, analysis of individual time bins after microinjection confirmed that the largest decrease in REM amount occurred in the first 10 min after 5-HT compared with saline microinjection (53.4% decrease;t = 2.68; p = 0.025; pairedt test). The similarly large decrease in REM amount with 5-HT compared with saline in the second time bin (50.5% decrease) was not statistically significant because of the aforementioned variability (t = 1.41; p = 0.192). There were also no significant differences between 5-HT and saline in the subsequent time bins, although on average REM was slightly reduced with 5-HT (allp > 0.478). The reduction in REM from the 0–10 to the 10–20 bins in Figure 3B for all conditions (i.e., saline, 5-HT, and sham) is because the first microinjection was timed to the beginning of a REM episode. Therefore, the first bin by definition starts with a full REM episode that increases the amount of REM in that bin with respect to the others. After this first injection, the amount of REM within each bin is determined by the spontaneous occurrence of REM episodes.
Fig. 3.

A, The amount of REM sleep observed in the first hour after microinjection is reduced with 5-HT (•) compared with saline (○) and sham (▵) interventions.B, The reduction in REM sleep after 5-HT is also illustrated; the amount of REM observed in each separate 10 min time bin after microinjection is shown. See text for further details. Eachpoint is the mean ± SEM from 10 rats.
Compared with both the saline and sham conditions, 5-HT also affected overall sleep architecture. Compared with saline, there was a significant reduction in percent REM after 5-HT (Fig.4A; mean, 19.9 ± 2.5% compared with 26.8 ± 2.4%; t = 2.74;p = 0.023; paired t test). This effect was mediated by a 37% reduction in the duration of REM episodes (Fig.5A; 77.4 ± 12.1 sec with 5-HT compared with 122.4 ± 15.5 sec with saline;t = 3.04; p = 0.014), with less consistent changes observed for the number of REM episodes per hour (Fig. 5B; 5.6 ± 0.8 per hr compared with 6.6 ± 0.8 per hr; t = 1.34; p = 0.212), although 5-HT was associated with decreased REM frequency in some animals. That 5-HT did not consistently affect the frequency of REM episodes is also suggested by the observation that the number of transitional episodes per hour, a marker of REM initiation (Benington et al., 1994), did not change after 5-HT (Fig. 5C; 8.1 ± 1.9 per hr with 5-HT compared with 7.3 ± 1.2 per hr with saline; t = 0.51; p = 0.626). Also shown in Figure 5 is the change in REM duration between the saline and 5-HT conditions plotted against the difference in REM episodes per hour. This plot shows that the decreases in REM duration after 5-HT were larger in some animals than in others, and in some there was also a change in REM frequency. Although 5-HT reduced the duration of the individual REM episodes in which the actual microinjections were performed (70.9 ± 13.2 sec for 5-HT compared with 130.0 ± 25.6 sec for saline), this effect was of marginal statistical significance because of variability between animals (t= 1.99; p = 0.078). However, this shortening of the REM episodes during the actual microinjections suggests that 5-HT was capable of exerting a relatively short latency influence on REM sleep (i.e., within the duration of a REM episode).
Fig. 4.

Changes in REM sleep after microinjection of 5-HT for the first hour after microinjection (A) (i.e., sleep uncomplicated by repeated injections) and after all microinjections (B) (i.e., for the entire recording period). Each rat is represented by a differentsymbol. Group mean levels for saline and 5-HT are indicated by the thick horizontal lines.
Fig. 5.

Changes in REM episode duration (A), the number of REM episodes per hour (B), and the number of transitional episodes per hour (C) in the first hour after microinjection of 5-HT compared with saline. Each rat is represented by the samesymbol used in Figure 4. Group mean levels for saline and 5-HT are indicated by the thick horizontal lines. This figure shows that 5-HT reduced REM durations but had less consistent effects on the number of REM episodes per hour and transitional episodes per hour. D, A plot of the change in REM duration and REM frequency between the saline and 5-HT conditions. This plot shows that the decreases in REM duration after 5-HT were larger in some animals than in others, and in some there was also a change in REM frequency.
Because the data suggested that 5-HT shortened REM episodes (Figs. 2, 5), analyses were performed to determine whether REM episodes lengthened over time after microinjection, i.e., as the effects induced by 5-HT decreased. Sleep in the first hour after microinjection was analyzed because this period is uncomplicated by repeated interventions that may affect 5-HT clearance over the course of the experiment. Analyses were performed on pooled data from all animals because there were insufficient REM episodes within an animal to perform individual correlations. The validity of pooling the data for this analysis was supported by the result that episode durations within a rat were similar between rats for both 5-HT and saline (p= 0.466 and p = 0.125, respectively; one-way ANOVA), suggesting a homogeneous population. After saline, there was no correlation between the time after injection and REM episode length (r = 0.007; p = 0.958;n = 58; Spearman correlation). However, after 5-HT microinjection, there was a positive correlation that was of borderline statistical significance (r = 0.247; p= 0.088; n = 49). This result supports the suggestion that 5-HT shortened REM episodes, with this effect decreasing over time, and is consistent with the data shown in Figure 3B. However, the low correlation coefficient suggests that there were other factors exerting influences on REM duration.
In the group of 10 rats, there was a tendency for non-REM sleep to be increased after 5-HT (72.6 ± 3.9% compared with 66.9 ± 3.2% for saline), but this effect was not significant (t = 1.68; p = 0.127). This lack of a statistically significant effect on non-REM may have been because one rat seemed to have abnormal sleep in the saline condition (Fig.4A; rat indicated by open circle). In support of this, analysis of the other nine rats showed that 5-HT compared with saline caused a significant increase in non-REM sleep (t = 2.89; p = 0.020). Furthermore, when sleep after 5-HT was compared with the sham condition in the 10 rats, non-REM was also significantly increased with 5-HT (72.6 ± 3.9% compared with 65.2 ± 2.4%; t = 2.33;p = 0.045), and REM was reduced (t = 2.31; p = 0.047). This reduction in REM with 5-HT, compared with the sham condition, was also attributable mainly to shorter REM durations (29%; t = 2.09;p = 0.067) rather than a change in the number of REM or transitional episodes per hour (p = 0.284 andp = 0.784, respectively). Although REM and non-REM sleep were significantly affected by 5-HT, there were no significant differences in sleep efficiency or transitional sleep after 5-HT compared with saline or sham microinjection (p> 0.099). When sleep after saline was compared with sleep in the sham condition, there were no significant differences in sleep efficiency, the percent or durations of sleep episodes, or the number of REM episodes per hour (p > 0.120).
REM sleep after all 5-HT microinjections
5-HT had significant effects on sleep architecture when data were analyzed for the entire recording period, i.e., after multiple microinjections of 5-HT. When sleep after 5-HT was compared with sleep after sham microinjection, there was a significant reduction in REM with 5-HT (20.8 ± 1.3% compared with 26.0 ± 1.2%;t = 2.91; p = 0.017) and a consistent increase in non-REM (71.1 ± 2.2% compared with 65.8 ± 2.0%; t = 2.31; p = 0.047) but no change in sleep efficiency (p = 0.356). Again the effect on REM sleep was mediated predominantly by a reduction (22%) in REM episode duration with 5-HT (87.3 ± 11.7 sec compared with 112.4 ± 10.0 sec; t = 1.47;p = 0.175), because the number of REM episodes per hour was unaffected (5.2 ± 0.7 per hr compared with 5.7 ± 0.4 per hr; t = 0.612; p = 0.556) as was the number of transitional episodes per hour (7.8 ± 1.2 per hr compared with 7.2 ± 0.8 per hr; t = 0.576;p = 0.579).
For the group of 10 rats, 5-HT compared with saline microinjections also reduced the percent REM (20.8 ± 1.3% compared with 24.7 ± 2.1%), although this effect was not statistically significant (t = 1.77; p = 0.111). This lack of a statistically significant effect arose because one rat had an abnormally low percent REM in the saline condition (Fig.4B; rat indicated by open circle). In support of the suggestion that this rat had abnormal REM sleep on this day, this rat had a normal amount of REM (i.e., similar to the group mean) when the saline intervention was repeated on a different day for a different protocol (see Fig. 9; open circle). Moreover, analysis of the other nine rats showed that 5-HT compared with saline caused a significant reduction in REM sleep (20.6 ± 1.5% compared with 26.2 ± 1.6%;t = 3.79; p = 0.005) and an increase in non-REM (71.5 ± 2.4% compared with 67.6 ± 2.2%;t = 2.76; p = 0.025). This overall suppression of REM sleep in these nine rats was mediated by a reduction in REM episode duration (16%) as well as by a slight change in the number of episodes per hour (5.0 ± 0.7 per hr compared with 6.2 ± 0.8 per hr; t = 2.01; p = 0.08), although there was no change in transitional episodes per hour (7.5 ± 1.3 per hr compared with 6.6 ± 1.4 per hr;t = 1.34; p = 0.22).
Fig. 9.

Changes in REM sleep after microinjection of 8-OH DPAT. Each rat is represented by the same symbol used in Figure 4. Group mean levels are indicated by the thick horizontal lines.
Although REM and non-REM sleep were significantly affected by 5-HT, there were no differences in sleep efficiency after 5-HT compared with saline or sham microinjections (each p > 0.356). For sleep after saline compared with sham microinjections, there were no significant differences in sleep efficiency, the percent or durations of sleep episodes, or the number of REM episodes per hour (allp > 0.05).
Dose-dependent effects of 5-HT on REM sleep
A dose-dependent effect of 5-HT on REM sleep suppression was observed in the five rats in which this was tested (Fig.6). In the hour after the first microinjection, with the higher dose of 5-HT, there was a consistent reduction in the amount of REM sleep expressed over time compared with the lower dose of 5-HT and saline (p = 0.016 andp = 0.003, respectively; two-way ANOVA-RM). Compared with saline, there was some REM sleep suppression with the lower dose of 5-HT (Fig. 6), but this was not statistically significant (p = 0.095). There was no difference between saline or sham microinjection on REM sleep expression (p = 0.980). A dose-dependent effect of 5-HT on sleep architecture was also observed in the first hour after microinjection; the higher dose of 5-HT caused a marked decrease in percent REM sleep and an increase in percent non-REM, with the lower dose of 5-HT having an intermediate effect (Table1). In these five rats, REM duration was again reduced with 5-HT (mean change, 44%), but the number of REM episodes per hour was unchanged (p = 0.211). When sleep architecture was analyzed for the entire recording period (i.e., after all microinjections), there were trend changes in REM and non-REM similar to those described in Table 1, although these changes did not reach statistical significance (p > 0.257; one-way ANOVA-RM).
Fig. 6.

Dose-dependent reduction in REM sleep expression in the first hour after microinjection of 5-HT. The cumulative amount of REM sleep expressed over time is shown for 1.5 mm 5-HT (•), 1.0 mm 5-HT (▴), saline (○), and sham (▵) interventions. Each point is the mean ± SEM from five rats (rats ♦, ▾, ▴, ▪, and • from Fig. 4).
Table 1.
Dose-dependent decreases in REM sleep and increases in non-REM sleep in the first hour after microinjection of 5-HT into the LDT nuclei in five rats
| Intervention | % REM | % non-REM |
|---|---|---|
| 1.5 mm 5-HT | 16.3 ± 3.9* | 81.1 ± 4.6* |
| 1.0 mm 5-HT | 21.8 ± 2.4 | 73.8 ± 3.2 |
| Saline | 27.7 ± 1.6 | 68.4 ± 2.2 |
| Sham (i.e., no microinjection) | 26.7 ± 4.0 | 68.4 ± 3.8 |
| One-way ANOVA-RM | p = 0.037 | p = 0.025 |
Values are mean ± SEM.
p < 0.025 compared with saline from post hoc paired t test.
PGO activity and respiratory rate in REM sleep after 5-HT
Although the REM episodes were somewhat shorter after 5-HT (Figs.2, 5A), the lengths of these episodes were sufficient to observe the normal significant increases in PGO activity and mean and CV of respiratory rate in REM compared with non-REM sleep (see below). For the group, analyses showed that REM compared with non-REM sleep was associated with significant increases in integrated PGO activity (Fig.7A; p = 0.005; two-way ANOVA-RM). However, there was no significant main effect of treatment (saline or 5-HT microinjection) on the level of PGO activity (p = 0.740), and there was no significant treatment by sleep state interaction (p = 0.096). This analysis indicated that REM compared with non-REM sleep was associated with increases in PGO activity and that this increase was similar whether saline or 5-HT microinjections were performed (Fig.7A). The CV of integrated PGO activity in REM sleep was also not different between saline and 5-HT conditions (Fig. 7B; mean difference, 0.50 ± 5.1%; t = 0.097;p = 0.926; paired t test).
Fig. 7.

Effects of 5-HT on mean integrated PGO activity in REM compared with non-REM sleep (A) and on the coefficient of variation of PGO activity in REM (B). In each instance, 5-HT had no effect on the measured variable. Each point is the mean ± SEM from six rats (rats ▴, •, ▿, ▵, □, and ○ from Fig.4).
Analyses also showed that REM sleep, despite periods of transient respiratory slowing (Fig. 1), was associated with significant increases in overall mean respiratory rate compared with non-REM (Fig.8A; p = 0.014; two-way ANOVA-RM). However, there was no significant main effect for treatment (saline or 5-HT microinjection) on respiratory rate (p = 0.712), and there was no treatment by sleep state interaction (p = 0.846). Similarly, REM compared with non-REM sleep was associated with increases in the CV of respiratory rate (Fig. 8B; p = 0.009; two-way ANOVA-RM), although again there was no significant main effect for treatment, and no treatment by sleep state interaction (p = 0.106 and p = 0.601, respectively). These analyses showed that REM sleep was associated with overall increases in the mean and CV of respiratory rate and that these increases were similar whether saline or 5-HT microinjections were performed (Fig. 8). Although the CV of REM respiratory rate seemed slightly increased after 5-HT compared with saline (Fig.8B), the direction of this trend change is opposite to that predicted by the hypothesis, therefore adding weight to the result that application of 5-HT to the LDT nuclei did not reduce REM-related respiratory variability.
Fig. 8.

Effects of 5-HT on mean respiratory rate (A) and on the coefficient of variation of respiratory rate (B) in REM compared with non-REM sleep. In each instance, 5-HT had no effect on the measured variable. Each point is the mean ± SEM from six rats (rats ▪, •, ⋄, ▿, ▵, and □ from Fig. 4).
REM sleep after methysergide and 8-OH DPAT microinjections
In the hour after the first microinjection of methysergide, there were no consistent differences in the amount of REM sleep expressed over time between the methysergide, saline, and sham conditions (p = 0.420; two-way ANOVA-RM). In this period, there were also no significant differences in any measure of sleep architecture between the methysergide, saline, and sham conditions (allp > 0.17; paired t tests). For the entire study period (i.e., after multiple microinjections), there were again no differences in any REM sleep parameter between the methysergide and saline conditions (all p > 0.458), but the percent transitional sleep was increased with methysergide (9.6 ± 1.6% compared with 5.7 ± 0.6%; t = 2.88;p = 0.045), and this was caused by an increase in the number of transitional episodes per hour (8.2 ± 1.1 per hr compared with 5.8 ± 0.7 per hr; t = 2.80;p = 0.049) as well as by a slight increase in transitional episode duration (24.2 ± 1.5 sec compared with 20.6 ± 1.8 sec; t = 2.34; p = 0.079). No other sleep parameter was different between the methysergide and saline (all p > 0.458) or sham (allp > 0.05) conditions. There were no observable differences in respiratory or PGO activity between saline and methysergide conditions.
As with the reductions in REM sleep after microinjection of 5-HT, there were reductions in REM after 1.5 μm 8-OH DPAT compared with saline, with some reductions also observed after 1.5 nm 8-OH DPAT (Fig. 9). In the four rats, 1.5 μm 8-OH DPAT compared with saline caused a reduction in percent REM (11.9 ± 5.0 vs 22.3 ± 2.3%). Although the number of rats studied is too few for any detailed statistical analysis, 8-OH DPAT was associated with an overall reduction in the median duration of REM episodes (88 ± 13 vs 107 ± 8 sec) and in the number of REM episodes per hour (2.7 ± 1.5 vs 4.8 ± 1.0 per hr), although changes in transitional episodes per hour were inconsistent (5.8 ± 2.6 vs 7.3 ± 1.5 per hr). In two animals in whom the microinjections were within and immediately adjacent to the LDT (Fig.10), the reductions in REM sleep after 8-OH DPAT were relatively large. Although there was a smaller REM reduction in one rat also with microinjections within the LDT, the rat with the smallest response had an injection site that was farthest away from the LDT.
Fig. 10.

Line drawing, based on the atlas of Paxinos and Watson (1986), illustrating injection sites. Injection sites were located within the LDT nuclei in six of nine rats, adjacent to the LDT in two rats, and within 0.7 mm of the edge of the LDT in one rat. Thesymbols used for each rat are the same as those used on Figures 4, 5, and 9. Cer, Cerebellum; DR, dorsal raphe nucleus; DT, dorsal tegmental nucleus; andLC, locus coeruleus.
Histology
The locations of injection sites are shown in Figure 10 for all animals, with an example in one animal shown in Figure11. Sites were located within the LDT nuclei in six rats, adjacent to the LDT in two rats, and within 0.7 mm of the LDT nuclei in one rat. One brain was damaged on processing and not available for analysis.
Fig. 11.
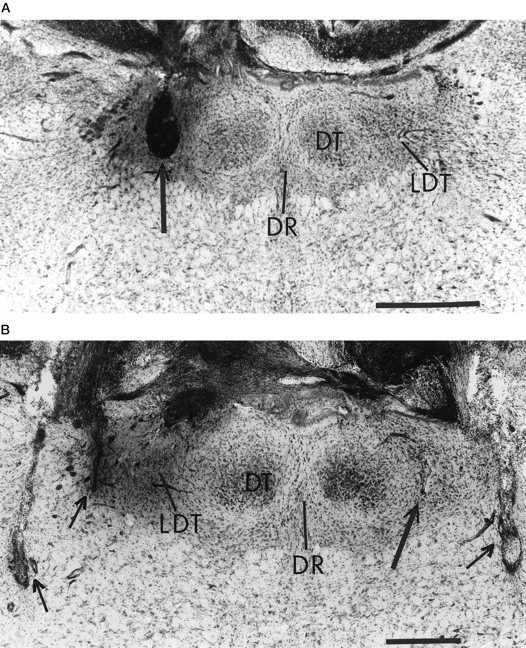
Photomicrographs of coronal sections showing cannula and recording-electrode placements in one rat. Ina, the location of the leftmicroinjection cannula in the LDT can be identified from the cavity created by the effects of repeated microinjections (seearrow). In b, the smaller lesion in the LDT produced by the tip of the right microinjection cannula can be seen on an adjacent section (see long arrow). The short arrows in bpoint to the poles of the bilateral recording electrodes. Abbreviations are given in Figure 10. Horizontal bar, 0.5 mm. Sections approximately from bregma −9.16. The dark staining on the left is the Evans blue dye used to assist in locating the injection site.
Correlations were performed between the change in percent REM (from the 5-HT to the saline condition) and the distance from the injection site to the center of the LDT. There were no statistically significant correlations between these variables either in the first hour after microinjection or after repeated injections (r = 0.616; p = 0.067; and r = 0.385;p = 0.285, respectively; Spearman correlations). Although the correlation from the first hour after microinjection was close to being statistically significant, this effect was influenced by the one rat that had an injection site most distant from the LDT and that also had the least effect of 5-HT (this rat was the only one with increased REM after 5-HT caused by abnormal sleep in the saline condition; see rat indicated by open circle in Fig.4A). Repeating the correlation without this rat yielded a weaker relationship between injection site and the effect on percent REM (r = 0.445; p = 0.233), although the correlation coefficient remained positive and in the direction predicted by the hypothesis that weaker effects on REM would be produced by microinjections farther away from the LDT.
DISCUSSION
This study shows that 5-HT microinjected into the LDT nuclei of freely behaving rats suppresses REM sleep. Therefore, these in vivo data support the hypothesis from in vitro studies that 5-HT inhibits LDT activity and that this effect suppresses REM sleep (Leubke et al., 1992; Leonard and Llinas, 1994). However, per unit time of REM sleep, 5-HT did not reduce the amount or variability of PGO activity or the mean and CV of respiratory rate. Together these data suggest that in vivo 5-HT at the LDT nuclei suppresses REM sleep expression and does not disproportionately reduce the occurrence of phasic REM events within this sleep state. However, total REM phasic activity was reduced because of less REM sleep after 5-HT.
Serotonergic mechanisms in the LDT and REM sleep
Although there is mounting evidence that serotonergic DRN activity plays a major role in suppressing REM sleep (McCarley et al., 1995; Portas et al., 1996), the sites where 5-HT exerts this effect are not established. However, the LDT seems to be such a site because 5-HT microinjection suppressed REM sleep in a dose-dependent manner. The REM suppression was attributable mainly to shorter REM episodes, although decreased REM frequency also occurred in some animals. The predominant effect on REM duration suggests that 5-HT exerted a major influence on the mechanisms involved in REM sleep maintenance rather than on initiation. This suggestion is supported by the inconsistent effects on transitional sleep, another marker of REM initiation (Benington et al., 1994). The increases in REM sleep during chronic electrical stimulation of cat LDT are caused by longer, rather than more frequent, REM episodes (Thakkar et al., 1996). This result supports the suggestion that mechanisms outside the LDT are likely responsible for initiating REM, but once REM has begun, then inhibition (e.g., by 5-HT) or continuing activation of LDT neurons can shorten or lengthen REM episodes.
Methysergide, a broad spectrum 5-HT antagonist, increased transitional sleep by 68% but produced no effect on REM. The lack of a REM effect may be because there is minimal DRN activity in REM (McGinty and Harper, 1976; Trulson and Jacobs, 1979; Cespuglio et al., 1981) and hence minimal 5-HT to antagonize. However, antagonism of 5-HT in states outside REM may increase the probability of attempting to enter REM and/or of being unable to terminate abruptly a REM episode. Therefore, as judged by changes in transitional sleep (Benington et al., 1994), the effect with methysergide adds support to the concept that serotonergic mechanisms at the LDT affect REM regulation.
Microinjections were confined to the LDT and/or close to these nuclei in almost all rats. However, as seen with other techniques, it is a problem that drugs can diffuse away from the cannula or probe site and affect REM in other regions. A possible site of action for diffused 5-HT in this study could have been the DRN. However, 5-HT at this site would likely have increased REM (Portas et al., 1996), i.e., an effect opposite to that observed. Similarly, the apparent lack of an excitatory effect of 5-HT on locus coeruleus neurons (Koyama and Kayama, 1993) argues against excitation at this site being responsible for the REM suppression.
There is evidence of 5-HT1A and 5-HT2receptors on cholinergic LDT and PPT neurons (Leubke et al., 1992;Morilak and Ciaranello, 1993; Leonard and Llinas, 1994). Because 5-HT1A agonists inhibit these neurons, mimicking the effects of 5-HT (Leubke et al., 1992; Leonard and Llinas, 1994), it is feasible that the REM suppression in this study was mediated through 5-HT1A receptors. Although not systematically tested (in that only four rats were studied), the decreased REM after 8-OH DPAT supports this hypothesis and agrees with the similar effects of this drug at the cat PPT (Sanford et al., 1994). That 5-HT has a higher affinity for 5-HT1A than for 5-HT2 receptors and that the predominant effect of 5-HT2 receptor activation is excitation rather than inhibition (Zifa and Fillion, 1992; Morilak and Ciaranello, 1993, their references) also suggest that the REM suppression is best explained by a 5-HT1A receptor mechanism. Preliminary evidence showing that 5-HT2 agonists microinjected into cat PPT (Ross et al., 1993) have no effect on REM supports this suggestion.
Serotonergic mechanisms in the LDT and phasic REM events
There is evidence that DRN serotonergic activity plays a major role in suppressing PGO activity (Brooks et al., 1972; Jacobs et al., 1972, 1973; Simon et al., 1973), and based on in vitroobservations in neonatal rats, it has been speculated that this effect occurs at LDT bursting neurons (Leubke et al., 1992). Although PGO activity per unit time of REM sleep was not disproportionately reduced by 5-HT at the LDT nuclei in this study, total PGO activity in REM sleep was, by definition, reduced because of the shorter REM episodes and less REM sleep after 5-HT.
This result adds to the growing weight of evidence suggesting that 5-HT may not exert a disproportionate inhibitory influence on PGO activity at the LDT and PPT. For example, microinjections of drugs with affinities for 5-HT1A, 5-HT1, and 5-HT2 receptors into cat PPT have failed to suppress PGO waves independently of a change in REM sleep (Ross et al., 1993;Sanford et al., 1994). Moreover, although PGO bursting neurons have been identified in the LDT of sleeping cats (Steriade et al., 1990a,b), preliminary data suggest that the firing pattern of these neurons is unaffected by microiontophoresis of 5-HT (Koyama and Sakai, 1995). In rats, auditory-evoked PGO waves are unaffected by 5-HT1Aagonists microinjected into PPT (Sanford et al., 1996). In rats however, the LDT is more likely to be the site where 5-HT inhibits PGO activity because this region has a greater 5-HT innervation than does the PPT (Sanford et al., 1996) and in neonates contains cholinergic bursting neurons inhibited by 5-HT (Leubke et al., 1992). However, in contrast to cats, PGO bursting neurons have not yet been identified in the LDT of sleeping adult rats (Kayama et al., 1992), although this species shows clear PGO activity. Furthermore, in contrast to neonatal rats, LDT and PPT bursting neurons in mature guinea pigs in vitro were found to be noncholinergic, and it was the nonbursting cholinergic neurons that were inhibited by 5-HT (Leonard and Llinas, 1994). Whether these differences between rats and guinea pigs relate to issues of maturation or species remains to be determined. However, species differences may be minimal because bursting PPT neurons in adult rats are also noncholinergic (Kang and Kitai, 1990). Taken together, these data suggest that the LDT bursting neurons observed in the neonatal rat in vitro may not be directly analogous to the PGO neurons in the sleeping adult in vivo. Moreover, these data suggest that hyperpolarization of LDT neurons by 5-HTin vitro (Leubke et al., 1992; Leonard and Llinas, 1994) is likely the cellular substrate for the inhibitory effect of 5-HT on REM sleep rather than for a major inhibitory effect on PGO activity per se. The increase in PGO activity in waking and non-REM sleep after methysergide microinjection into the amygdala in a manner identical to that in this study (Sanford et al., 1995) suggests at least one alternate site where serotonergic mechanisms may importantly influence PGO activity.
The lack of an effect of 5-HT on respiratory rate or variability per unit time of REM sleep also supports the concept that serotonergic mechanisms at the LDT do not disproportionately affect the occurrence of phasic events within REM, although total REM phasic events were, by definition, reduced because of less REM sleep. Although the neurochemical basis for transient REM-related respiratory slowing is unclear, cholinergic LDT and PPT neurons may be involved. Cholinergic stimulation of the pontine reticular formation slows respiration (Lydic and Baghdoyan, 1989, 1992; Taguchi et al., 1992), and PPT electrical stimulation increases acetylcholine in this pontine region and decreases respiratory rate (Lydic and Baghdoyan, 1993). In this study, the lack of an effect of 5-HT on respiratory rate or variability per unit time of REM is compatible with the relative absence of phasic activation and bursting of LDT neurons in adult rats in REM (Kayama et al., 1992) and with there being no disproportionate suppression of PGO activity within REM sleep by 5-HT.
However, these results cannot be taken as evidence that LDT neurons do not contribute to REM respiratory slowing because these data only show that these events are not disproportionately inhibited by 5-HT. It was not reported whether LDT electrical stimulation slows breathing (Thakkar et al., 1996) as occurs with the PPT (Lydic and Baghdoyan, 1993). However, the absence of a simultaneous disproportionate suppression of both REM-related PGO activity and respiratory slowing by 5-HT may not be surprising because phasic REM events such as eye movements and PGO bursts are typically associated with increased medullary respiratory neuronal activity and with increases in respiratory rate rather than in decreases (Orem, 1980, 1994; Neilly et al., 1991). As such, it would seem incompatible that 5-HT at the LDT could cause both respiratory slowing and inhibition of PGO activity if 5-HT were envisioned to be acting on the same bursting cell types. This distinction is in keeping with the present results, i.e., that the major site(s) of generation of REM-related PGO activity and transient respiratory slowing may be anatomically separate from the LDT and/or these events are influenced by neurotransmitters other than 5-HT.
Footnotes
This work was supported by SCOR HL42236 and MH42903. R.L.H. was supported by a Medical Research Council of Canada Postdoctoral Fellowship. We thank Graziella Mann, Mark Mallon, and Malique Mann for assistance and for processing some of the histological specimens.
Correspondence should be addressed to Dr. Richard L. Horner, Center for Sleep and Respiratory Neurobiology, Hospital of the University of Pennsylvania, 991 Maloney Building, 3600 Spruce Street, Philadelphia, PA 19104-4283.
Reprint requests should be addressed to Dr. Adrian R. Morrison, Laboratory for the Study of the Brain in Sleep, Department of Animal Biology, School of Veterinary Medicine, 3800 Spruce Street, Philadelphia, PA 19104-6045.
REFERENCES
- 1.American Sleep Disorders Association. EEG arousals: scoring rules and examples. Sleep. 1992;15:173–184. [PubMed] [Google Scholar]
- 2.Benington JH, Kodali SK, Heller HC. Scoring transitions to REM sleep in rats based on the EEG phenomena of pre-REM sleep: an improved analysis of sleep structure. Sleep. 1994;17:28–36. doi: 10.1093/sleep/17.1.28. [DOI] [PubMed] [Google Scholar]
- 3.Brooks DC, Gershon MD, Simon RP. Brainstem serotonin depletion and ponto-geniculo-occipital wave activity in the cat treated with reserpine. Neuropharmacology. 1972;11:511–520. doi: 10.1016/0028-3908(72)90006-8. [DOI] [PubMed] [Google Scholar]
- 4.Cespuglio R, Faradji H, Gomez ME, Jouvet M. Single unit recording in the nuclei raphe dorsalis and magnus during the sleep–waking cycle of semi-chronic prepared cats. Neurosci Lett. 1981;24:133–138. doi: 10.1016/0304-3940(81)90236-6. [DOI] [PubMed] [Google Scholar]
- 5.El Mansari M, Sakai K, Jouvet M. Unitary characteristics of presumptive cholinergic tegmental neurons during the sleep–waking cycle in freely moving cats. Exp Brain Res. 1989;76:519–529. doi: 10.1007/BF00248908. [DOI] [PubMed] [Google Scholar]
- 6.Farber J, Marks GA, Roffwarg HP. Rapid eye movement sleep PGO-type waves are present in the dorsal pons of the albino rat. Science. 1980;209:615–617. doi: 10.1126/science.6994229. [DOI] [PubMed] [Google Scholar]
- 7.Honda T, Semba K. Serotonergic synaptic input to cholinergic neurons in the rat mesopontine tegmentum. Brain Res. 1994;647:299–306. doi: 10.1016/0006-8993(94)91329-3. [DOI] [PubMed] [Google Scholar]
- 8.Jacobs BL, Henriksen SJ, Dement WC. Neurochemical basis of the PGO wave. Brain Res. 1972;48:406–411. doi: 10.1016/0006-8993(72)90200-4. [DOI] [PubMed] [Google Scholar]
- 9.Jacobs BL, Asher R, Dement WC. Electrophysiological and behavioral effects of electrical stimulation on the raphe nuclei in cats. Physiol Behav. 1973;11:489–495. doi: 10.1016/0031-9384(73)90035-8. [DOI] [PubMed] [Google Scholar]
- 10.Jones BE. Paradoxical sleep and its chemical/structural substrates in the brain. Neuroscience. 1991;40:637–656. doi: 10.1016/0306-4522(91)90002-6. [DOI] [PubMed] [Google Scholar]
- 11.Kang Y, Kitai ST. Electrophysiological properties of pedunculopontine neurons and their postsynaptic responses following stimulation of substantia nigra reticulata. Brain Res. 1990;535:79–95. doi: 10.1016/0006-8993(90)91826-3. [DOI] [PubMed] [Google Scholar]
- 12.Kaufman LS, Morrison AR. Spontaneous and elicited PGO spikes in rats. Brain Res. 1981;214:61–72. doi: 10.1016/0006-8993(81)90438-8. [DOI] [PubMed] [Google Scholar]
- 13.Kayama Y, Ohta M, Jodo E. Firing of “possibly” cholinergic neurons in the rat dorsolateral tegmental nucleus during sleep and wakefulness. Brain Res. 1992;569:210–220. doi: 10.1016/0006-8993(92)90632-j. [DOI] [PubMed] [Google Scholar]
- 14.Koyama K, Kayama Y. Mutual interactions among cholinergic noradrenergic and serotonergic neurons studied by iontophoresis of these transmitters in rat brainstem nuclei. Neuroscience. 1993;55:1117–1126. doi: 10.1016/0306-4522(93)90325-a. [DOI] [PubMed] [Google Scholar]
- 15.Koyama Y, Sakai K (1995) Cholinergic inhibition and monoaminergic excitation of presumed cholinergic mesopontine tegmental neurons: a microiontophoretic study in anesthetized cats. Sleep Res 24[A]:35.
- 16.Kruger L, Saporta S, Swanson LW. Photographic atlas of the rat brain: the cell and fiber architecture illustrated in three planes with stereotaxic coordinates. Cambridge UP; Cambridge, UK: 1995. [Google Scholar]
- 17.Leonard CS, Llinas R. Serotonergic and cholinergic inhibition of mesopontine cholinergic neurons controlling REM sleep: an in-vitro electrophysiological study. Neuroscience. 1994;59:309–330. doi: 10.1016/0306-4522(94)90599-1. [DOI] [PubMed] [Google Scholar]
- 18.Leubke JI, Greene RW, Semba K, Kamondi A, McCarley RW, Reiner PB. Serotonin hyperpolarizes cholinergic low threshold burst neurons in the rat laterodorsal tegmental nucleus in vitro. Proc Natl Acad Sci USA. 1992;89:743–747. doi: 10.1073/pnas.89.2.743. [DOI] [PMC free article] [PubMed] [Google Scholar]
- 19.Lydic R, Baghdoyan HA. Cholinoceptive pontine reticular mechanisms cause state-dependent changes in respiration. Neurosci Lett. 1989;102:211–216. doi: 10.1016/0304-3940(89)90080-3. [DOI] [PubMed] [Google Scholar]
- 20.Lydic R, Baghdoyan HA. Cholinergic pontine mechanisms causing state-dependent respiratory depression. News Physiol Sci. 1992;7:220–224. [Google Scholar]
- 21.Lydic R, Baghdoyan HA. Pedunculopontine stimulation alters respiration and increases ACh release in the pontine reticular formation. Am J Physiol. 1993;264:R544–R554. doi: 10.1152/ajpregu.1993.264.3.R544. [DOI] [PubMed] [Google Scholar]
- 22.Marks GA (1978) Central phasic activity associated with REM sleep in the albino rat: the homologue of the PGO spike. PhD thesis, City University of New York.
- 23.Marks GA, Farber J, Rubenstein M, Roffwarg HP. Demonstration of ponto-geniculo-occipital waves in the albino rat. Exp Neurol. 1980a;69:648–666. doi: 10.1016/0014-4886(80)90058-8. [DOI] [PubMed] [Google Scholar]
- 24.Marks GA, Farber J, Roffwarg HP. Metencephalic localization of ponto-geniculo-occipital waves in the albino rat. Exp Neurol. 1980b;69:667–677. doi: 10.1016/0014-4886(80)90059-x. [DOI] [PubMed] [Google Scholar]
- 25.McCarley RW, Hobson JA. Neuronal excitability modulation over the sleep cycle: a structural and mathematical model. Science. 1975;189:58–60. doi: 10.1126/science.1135627. [DOI] [PubMed] [Google Scholar]
- 26.McCarley RW, Nelson JP, Hobson JA. Ponto-geniculo-occipital (PGO) burst neurons: correlative evidence for neuronal generators of PGO waves. Science. 1978;201:269–272. doi: 10.1126/science.663656. [DOI] [PubMed] [Google Scholar]
- 27.McCarley RW, Greene RW, Rainnie D, Portas CM. Brainstem neuromodulation and REM sleep. Semin Neurosci. 1995;7:341–354. [Google Scholar]
- 28.McGinty D, Harper RM. Dorsal raphe neurons: depression of firing during sleep in cats. Brain Res. 1976;101:569–575. doi: 10.1016/0006-8993(76)90480-7. [DOI] [PubMed] [Google Scholar]
- 29.Morilak DA, Ciaranello RD. 5-HT2 receptor immunoreactivity on cholinergic neurons of the pontomesencephalic tegmentum shown by double immunofluorescence. Brain Res. 1993;627:49–54. doi: 10.1016/0006-8993(93)90747-b. [DOI] [PubMed] [Google Scholar]
- 30.Neilly JB, Gaipa EA, Maislin G, Pack AI. Ventilation during early and late rapid-eye-movement sleep in normal humans. J Appl Physiol. 1991;71:1201–1205. doi: 10.1152/jappl.1991.71.4.1201. [DOI] [PubMed] [Google Scholar]
- 31.Orem J. Medullary respiratory neuron activity: relationship to tonic and phasic REM sleep. J Appl Physiol. 1980;48:54–65. doi: 10.1152/jappl.1980.48.1.54. [DOI] [PubMed] [Google Scholar]
- 32.Orem J. Respiratory neurons and sleep. In: Kryger MH, Roth T, Dement WC, editors. Principles and practice of sleep medicine. Saunders; Philadelphia: 1994. pp. 177–193. [Google Scholar]
- 33.Paxinos G, Watson C. The rat brain in stereotaxic co-ordinates. Academic; San Diego: 1986. [Google Scholar]
- 34.Phillipson EA. Control of breathing during sleep. Am Rev Respir Dis. 1978;118:909–939. doi: 10.1164/arrd.1978.118.5.909. [DOI] [PubMed] [Google Scholar]
- 35.Portas CM, Thakkar M, Rainnie D, McCarley RW. Microdialysis perfusion of 8-hydroxy-2-(di-n-propylamino)tetralin (8-OH-DPAT) in the dorsal raphe nucleus decreases serotonin release and increases rapid eye movement sleep in the freely moving cat. J Neurosci. 1996;16:2820–2828. doi: 10.1523/JNEUROSCI.16-08-02820.1996. [DOI] [PMC free article] [PubMed] [Google Scholar]
- 36.Ross RJ, Sanford LD, Mann GL, Brandom DJ, Morrison AR. Role of serotonin in pontine control of rapid eye movement sleep (REM); lack of evidence for 5-HT2 receptor mechanism. Soc Neurosci Abstr. 1993;19:592. [Google Scholar]
- 37.Sakai K, Jouvet M. Brainstem PGO-on cells projecting directly to the cat dorsal lateral geniculate nucleus. Brain Res. 1980;194:500–505. doi: 10.1016/0006-8993(80)91231-7. [DOI] [PubMed] [Google Scholar]
- 38.Sanford LD, Morrison AR, Ball WA, Ross RJ, Mann GL. Spontaneous phasic activity in the brain: differences in lateral geniculate and central lateral nuclei across sleep states. J Sleep Res. 1992;1:258–264. doi: 10.1111/j.1365-2869.1992.tb00048.x. [DOI] [PubMed] [Google Scholar]
- 39.Sanford LD, Ross RJ, Seggos AE, Morrison AR, Ball WA, Mann GL. Central administration of two 5-HT receptor agonists: effect on REM sleep initiation and PGO waves. Pharmacol Biochem Behav. 1994;49:93–100. doi: 10.1016/0091-3057(94)90461-8. [DOI] [PubMed] [Google Scholar]
- 40.Sanford LD, Tejani-Butt SM, Ross RJ, Morrison AR. Amygdaloid control of alerting and behavioral arousal in rats: involvement of serotonergic mechanisms. Arch Ital Biol. 1995;134:81–99. [PubMed] [Google Scholar]
- 41.Sanford LD, Tejani-Butt SM, Ross RJ, Morrison AR. Elicited PGO waves in rats: lack of 5-HT1A inhibition in putative pontine generator region. Pharmacol Biochem Behav. 1996;53:323–327. doi: 10.1016/0091-3057(95)02029-2. [DOI] [PubMed] [Google Scholar]
- 42.Simon RP, Gershon MD, Brooks DC. The role of raphe nuclei in the regulation of ponto geniculo-occipital wave activity. Brain Res. 1973;58:310–330. doi: 10.1016/0006-8993(73)90004-8. [DOI] [PubMed] [Google Scholar]
- 43.Steriade M, McCarley RW. Brainstem control of wakefulness and sleep. Plenum; New York: 1990. [Google Scholar]
- 44.Steriade M, Datta S, Pare D, Oakson G, Curro-Dossi RC. Neuronal activities in brain-stem cholinergic nuclei related to tonic activation processes in thalamocortical systems. J Neurosci. 1990a;10:2541–2559. doi: 10.1523/JNEUROSCI.10-08-02541.1990. [DOI] [PMC free article] [PubMed] [Google Scholar]
- 45.Steriade M, Pare D, Datta S, Oakson G, Curro-Dossi R. Different cellular types in mesopontine cholinergic nuclei related to ponto-geniculo-occipital waves. J Neurosci. 1990b;10:2560–2579. doi: 10.1523/JNEUROSCI.10-08-02560.1990. [DOI] [PMC free article] [PubMed] [Google Scholar]
- 46.Taguchi O, Kubin L, Pack AI. Evocation of postural atonia and respiratory depression by pontine carbachol in the decerebrate rat. Brain Res. 1992;595:107–115. doi: 10.1016/0006-8993(92)91458-q. [DOI] [PubMed] [Google Scholar]
- 47.Thakkar M, Portas C, McCarley RW. Chronic low-amplitude electrical stimulation of the laterodorsal tegmental nucleus of freely moving cats increases REM sleep. Brain Res. 1996;723:223–227. doi: 10.1016/0006-8993(96)00256-9. [DOI] [PubMed] [Google Scholar]
- 48.Trulson ME, Jacobs BL. Raphe unit activity in freely moving cats: correlation with level of behavioral arousal. Brain Res. 1979;163:135–150. doi: 10.1016/0006-8993(79)90157-4. [DOI] [PubMed] [Google Scholar]
- 49.Zifa E, Fillion G. 5-Hydroxytryptamine receptors. Pharmacol Rev. 1992;44:401–458. [PubMed] [Google Scholar]