Abstract
The presence of receptors for ATP has not been established in any native preparation of retinal neurons or glia. In the present study, we used conventional electrophysiological and [Ca2+]in fluorescence imaging techniques to investigate the effects of ATP added to Ringer’s solution perfusing the retinal-facing (apical) membrane of freshly isolated monolayers of bovine retinal pigment epithelium (RPE). ATP (or UTP) produced large, biphasic voltage and resistance changes with aKd of ∼5 μm for ATP and ∼1 μm for UTP. Electrical and pharmacological evidence indicates that the first and second phases of the response are attributable to an increase in basolateral membrane Cl conductance and a decrease in apical membrane K conductance, respectively. The ATP-induced responses were not affected by adenosine, but were reduced by the P2-purinoceptor blocker suramin. ATP also produced a large, transient increase in [Ca2+]in that was blocked by cyclopiazonic acid, an inhibitor of endoplasmic reticulum Ca2+-ATPases. The calcium buffer BAPTA attenuated the voltage effects of ATP. We also found that apical DIDS significantly inhibited the ATP-evoked [Ca2+]in and electrical responses, suggesting that DIDS blocked the purinoceptor. Measurements of fluid movement across the RPE using the capacitance probe technique demonstrated a significant increase in fluid absorption by apical UTP. These data indicate the presence of metabotropic P2Y/P2U-purinoceptors at the RPE apical membrane and implicate extracellular ATP in vivo as a retinal signaling molecule that could help regulate the hydration and chemical composition of the subretinal space.
Keywords: P2U-purinoceptor, P2Y-purinoceptor, electrophysiology, paracrine, K conductance, Cl conductance
The retinal pigment epithelium (RPE) forms a major component of the blood-retinal barrier. It has two functionally distinct membranes that face different extracellular environments: the apical (retinal-facing) membrane directly opposes the photoreceptor outer segments, and the basolateral (serosal-facing) membrane faces the fenestrated choroicapillaris. Each membrane contains different transport proteins that allow the RPE to mediate the vectorial movement of metabolites, ions, and fluid between the subretinal space and the blood supply. Like the choroid plexus, the RPE plays an important glial-like role in maintaining the health and integrity of the nearby neurons, and the retinal-facing membrane contains an array of metabotropic receptors that enable the RPE to carry out its glial functions. The signaling molecules that activate these receptors, such as dopamine, adenosine, and epinephrine, have been shown to influence a wide variety of physiological responses in the RPE including photoreceptor and RPE retinomotor movements (Dearry et al., 1990); phagocytosis of photoreceptor outer segments (Gregory et al., 1994); and modulation of ion and fluid movement across amphibian, avian, and mammalian RPE (Gallemore and Steinberg, 1990; Edelman and Miller, 1991;Joseph and Miller, 1992; Quinn and Miller, 1992).
Paracrine regulation of ionic conductances may play an important role in maintaining tight apposition between the retina and RPE (Negi and Marmor, 1986). In vitro, Cl is actively transported across the RPE from the retinal to the choroidal side of the tissue and, along with the flux of a counterion (Na), is the major driving force for active ion-linked fluid absorption from retina to blood (Miller and Edelman, 1990; Edelman and Miller, 1991; Joseph and Miller, 1991). Active ion-coupled fluid absorption in vivo would reduce the volume of the subretinal space and helps maintain the adhesion between the retina and RPE. In bovine RPE, this Cl transport pathway can be upregulated by the nanomolar addition of epinephrine to Ringer’s solution bathing the apical membrane. Epinephrine-induced activation of α-1 adrenergic receptors causes a transient rise in cell calcium and a significant increase in KCl and fluid absorption (Edelman and Miller, 1991; Joseph and Miller, 1992). These observations implicate epinephrine as a possible paracrine signal that could help regulate the hydration of the subretinal space.
In the present experiments, electrophysiological and intracellular imaging techniques have been used to identify a class of metabotropic P2Y-purinoceptor at the RPE apical membrane (Barnard et al., 1994; Alexander and Ford, 1996). Activation of the purinoceptor causes large conductance changes at both the apical and the basolateral membranes and stimulates apical-to-basolateral fluid absorption. To our knowledge, nothing is currently known about the function or concentration of extracellular ATP in the retina, although ATP has been reported recently to increase cytosolic inositol (1,4,5) triphosphate and calcium levels in cultured RPE (Nash and Osborne, 1996). The present study strongly suggests that extracellular ATP (or UTP), like epinephrine, may serve as a paracrine signal that helps regulate the relative hydration and chemical composition of the subretinal space.
Some of these results have been presented previously in abstract form (Invest Ophthalmol Vis Sci (1996) 37(Suppl):S229).
MATERIALS AND METHODS
Preparation. Bovine eyes were obtained from a nearby slaughterhouse (Rancho Veal, Petaluma, CA), placed in cold HCO3 Ringer’s solution 15–30 min after death, and transported to the laboratory. The eyes were kept in cold Ringer’s solution, bubbled with 5% CO2/10% O2/ 85% N2, and remained viable for up to 4 hr before dissection. The anterior portion of the eye was removed before sectioning the posterior portion into quarters. The vitreous was carefully removed and the retina peeled away. A circular area of RPE-choroid was cut out, peeled away from the scelera, placed on a supporting mesh, and mounted apical side up between two halves of a modified Ussing chamber, which allowed for separate perfusion of apical and basolateral membranes. The exposed surface area of the apical membrane was 0.07 cm2. The techniques for handling this tissue have been reported previously (Joseph and Miller, 1991).
Solutions. Control Ringer’s solution contain the following (in mm): 120 NaCl, 5 KCl, 23 NaHCO3, 1 MgCl2, 1.8 CaCl2, and 10 glucose. This solution was bubbled continuously with 5% CO2/10% O2/85% N2, pH ∼7.4. The osmolarity of control Ringer’s solution was 295 ± 5 mOsm. Glutathione (1 mm) was added to solutions minutes before perfusion.
ATP, UTP, ATPγS, 2-chloro-ATP, DIDS, and BaCl2 were obtained from Sigma Chemical (St. Louis, MO). Suramin and adenosine was obtained from Research Biochemicals International (Natuck, MA). Fura-2 was obtained from Molecular Probes, (Eugene, OR).
Electrophysiology. The recording setup and perfusion system have been described previously (Miller and Steinberg, 1977; Joseph and Miller, 1991). Calomel electrodes in series with Ringer’s solution–agar bridges were used to measure the transepithelial potential (TEP), and the signals from intracellular microelectrodes were referenced to either the apical or the basolateral bath to measure the membrane potentials VA andVB, where TEP = VB− VA. Conventional microelectrodes were made from fiber-filled borosilicate glass tubing with 0.5 mm inner diameter and 1 mm outer diameter (Sutter Instrument, Novato, CA) and were back-filled with 150 mm KCl and had resistances of 120–250 MΩ.
The transepithelial (total) resistance Rt and the apparent ratio of the apical to basolateral membrane resistanceRA/RB were obtained by passing 4 μA current pulses across the tissue and measuring the resultant change in TEP and membrane potentials. Current pulses were bipolar, with a period of 3 sec applied at various time intervals. Rt is the resulting change in TEP divided by 4 μA, andRA/RB is the absolute value of the ratio of voltage change in VAdivided by the change in VB(RA/RB = ‖ ΔVA/ΔVB ‖). The current-induced voltage deflections were digitally subtracted from the records for clarity.
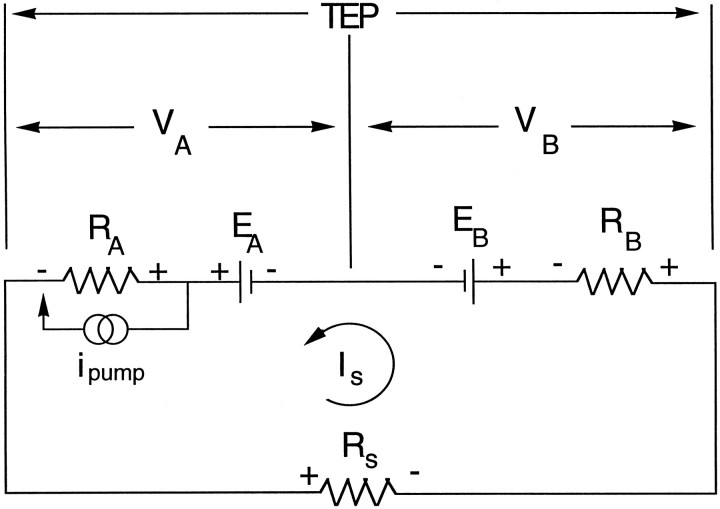
Equivalent circuit. The electrical properties of the RPE can be modeled as an equivalent circuit shown in Figure 1. The apical and basolateral membranes of the RPE are each represented as an equivalent electromotive force (EMF) EA orEB in series with a resistor,RA or RB, respectively. The paracellular pathway is represented as a shunt resistor,Rs, which is the parallel combination of the junctional complex resistances between neighboring cells and the resistance caused by the less-than-perfect mechanical seal around the circumference of the tissue. Because of this shunt resistance and the differences between the membrane EMFs, a current,Is, flows around the circuit. The observed membrane potentials VA andVB are given by:
| Equation 1 |
| Equation 2 |
The effect of this loop current is to depolarize the apical membrane and hyperpolarize the basolateral membrane (Miller and Steinberg, 1977). The apical and basolateral membrane voltages are electrically coupled via Rs, so that any voltage change at one membrane will be partially shunted to the opposite membrane (Miller and Steinberg, 1977). For example, if a solution composition change primarily alters EB orRB, most of the resultant change inVA is a passive consequence of the current shunted from the basolateral membrane (for example, see Fig.2B, phase I). This change in VA(ΔVA) can be expressed in terms of ΔVB by the following equation:
The transepithelial (or total) resistance Rt is expressed in terms of the membrane and shunt resistances as follows:
| Equation 3 |
If, for example, the basolateral membrane conductance increased (RB decrease), then Rtshould decrease, andRA/RB should increase, a result predicted by Equation 3 and observed in Figure 2, Aand B (phase I).
Fig. 1.
Equivalent electrical circuit for the RPE.RA and RBrepresent the resistances of the apical and basolateral membranes, respectively. Rs represents the shunt resistance, which is the parallel combination of the junctional complex resistance and the resistance of the mechanical seal along the circumference of the tissue. The apical and basolateral membrane EMFs are represented by EA andEB. Because of the differences betweenEA and EB, a current loop (Is) flows through the circuit. The measured apical and basolateral membrane potentials are represented as VA and VB. The potential across the tissue is called the TEP, which is the difference between between VA andVB.
Fig. 2.
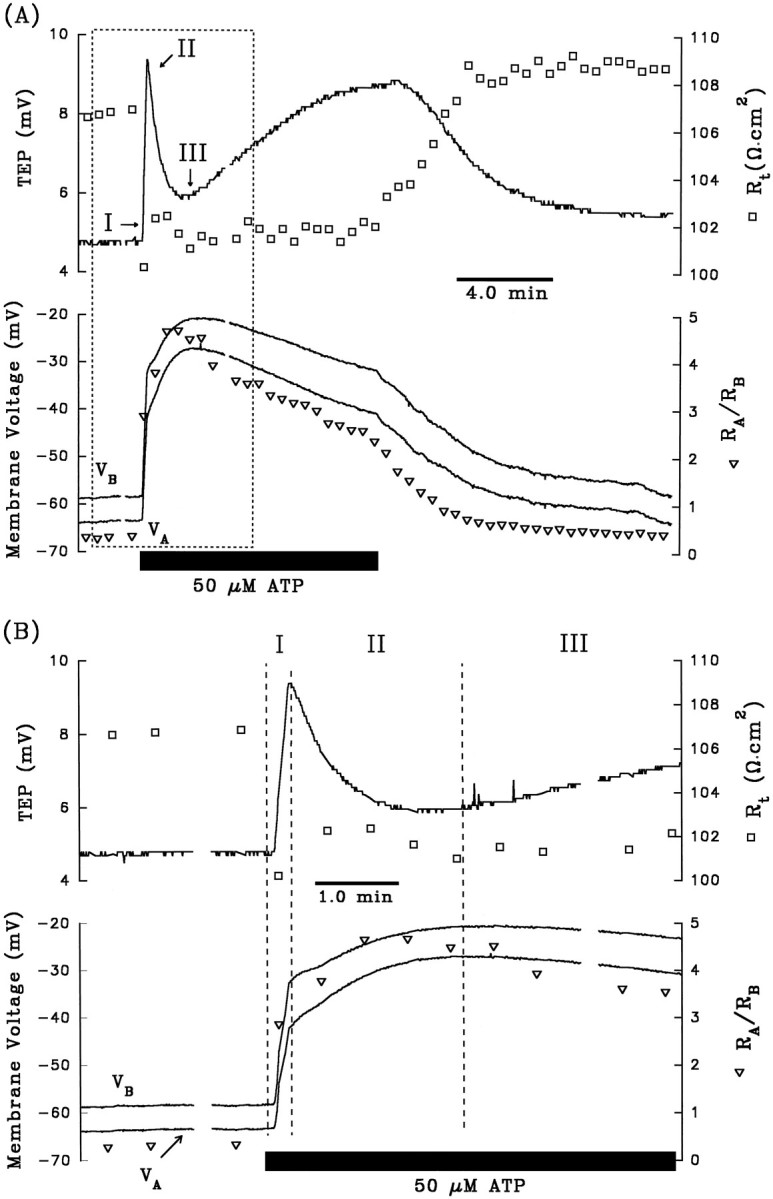
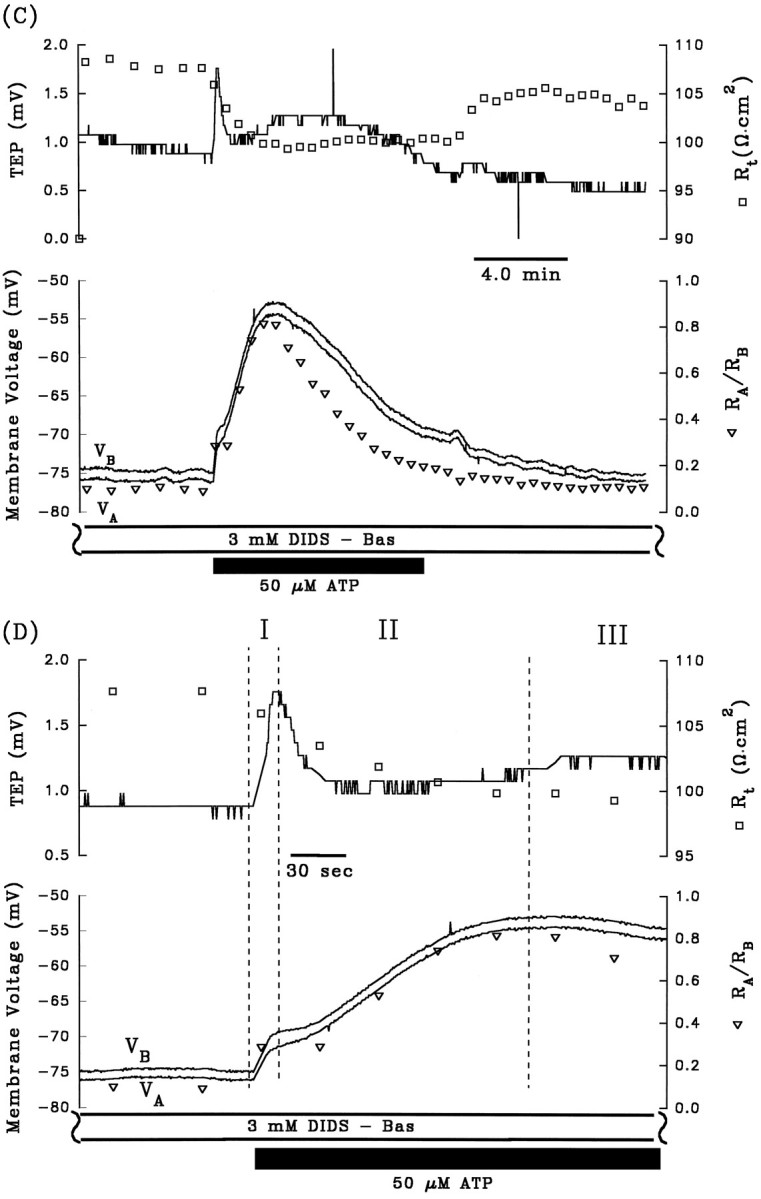
A, Electrical responses of the RPE after the addition of 50 μm ATP to Ringer’s solution perfusing the apical membrane. The horizontal black bar indicates the length of time ATP was added to the apical chamber. Top panel, Continuous tracerepresents TEP, and open squares represent transepithelial resistance, Rt.Bottom panel, Continuous traces representVA and VB, as labeled, and open triangles represent the ratio of apical to basolateral membrane resistance,RA/RB. The region enclosed by the dashed lines is replotted at higher gain in B. The triphasic electrical response after the addition of ATP is represented as I, II, and III. Phase I is characterized byVB depolarizing faster thanVA, which causes an increase in TEP; in addition, Rt decreased andRA/RB increased. Phase II begins when VA began to depolarize faster than VB, and the TEP began to decrease. During this phase, Rt increases slightly, whereasRA/RB continues to increase. Phase III begins when VAhyperpolarizes faster than VB, producing a slow increase in TEP. Rt remains relatively constant, whereasRA/RB decreases. Approximately 8–10 min after washout of ATP from the apical membrane, the membrane voltages and resistances recovered to baseline. AfterA, 3 mm DIDS was added to Ringer’s solution perfusing the basolateral membrane for ∼30 min (data not shown). The electrical responses to basolateral DIDS are largely consistent with a decrease in basolateral membrane Cl conductance. C, Effects of apical ATP after pretreatment with 3 mmbasolateral DIDS from same tissue as A andB. D, The membrane voltage responses immediate before and after the addition of ATP in C are replotted at higher gain. Phase I of the ATP-induced response is significantly reduced in the presence of basolateral DIDS. Figure continues.
Intracellular Ca2+ fluorescence.Intracellular Ca2+ levels [Ca2+]in were monitored with the fluorometric ratioing dye fura-2 AM (Molecular Probes) in a separate modified Ussing chamber. The chamber and setup have been described previously (Lin and Miller, 1991; Kenyon et al., 1994). In brief, Ringer’s solution containing 5–10 μm fura-2 AM dissolved in DMSO (containing 20% pluronic acid) was perfused for 30–40 min over the apical membrane to load the cells. In addition, 1 mmprobenicid was included in all loading and subsequent Ringer’s solutions to inhibit dye extrusion by the organic anion transporter located in the apical membrane (Kenyon et al., 1994). Photic excitation was achieved using a Xenon light source filtered at 350 and 385 nm (bandwidth; ±10 nm) every 0.5 sec; the emission fluorescence was measured at 510 nm with a photomultiplier tube (Thorn, EMI). The ratio of the fluorescence intensities at 350–385 nm, R, was determined every second. The technique and computer software for data acquisition have been described previously (Bialek et al., 1996).
Calibration of [Ca2+]in was performed at the end of each experiment by first perfusing both membranes with a zero-calcium Ringer’s solution containing 10 mm EDTA, which chelates any residual-free calcium, and 10 μmionomycin, which is a calcium ionophore that facilitates the equilibration [Ca2+]in and [Ca2+]o. After this zero calcium calibration, the tissue was then exposed to saturating (1.8 mm) concentration of calcium. Then [Ca2+]in was determined according to the equation [Ca2+]in=K(R−Rmin)/(Rmax−R).Rmax is the maximum ratio of the fluorescence intensities at 350 and 385 nm, which was determined at the saturating Ca2+ signal. Rmin is the ratio of fluorescence intensities in the absence of [Ca2+]o. K is equal toKd(Fmin/Fmax), whereKd is the dissociation constant for fura-2 AM (220 nm) and Fmin andFmax are the fluorescence intensities at 385 nm in the absence and the presence of saturating [Ca2+]o, respectively.
Fluid transport. A modified capacitive probe technique, which has been described in detail elsewhere (Edelman and Miller, 1991), was used to determine the rate of fluid movement across the RPE. In brief, the RPE was mounted in a water-jacketed Ussing chamber and oriented vertically with the apical and basolateral membranes separately exposed to Ringer’s solution held in bathing reservoirs. Stainless steel capacitive probes (Accumeasure System 1000; MT Instruments, Latham, NY) were lowered into the apical and basolateral bathing wells to sense the capacitance of the air gap between the probe and fluid meniscus. Fluid transport rate JV (μl · cm−2· hr−1) was determined by monitoring the fluid movement-induced changes in the air gap capacitance at the apical and basolateral baths. The probes on both sides of the tissue were removed during a bathing solution change. To ensure that the solution changes themselves did not appreciably alter JV, a control-to-control Ringer’s solution change was performed near the beginning of each experiment. The capacitance probes were moved away from the bathing reservoirs, and fresh control Ringer’s solution was reperfused into the chamber. The fluid transport apparatus also allowed us to continuously monitor TEP and Rt. Experiments were continued only if JV, TEP, andRt were not appreciably altered by this control-to-control Ringer’s solution change. The water-jacketed Ussing chamber was placed in an incubator to maintain steady-state control over temperature, pCO2, and humidity.
RESULTS
ATP-induced electrical responses
The experiment summarized in Figure 2Aillustrates the voltage and resistance changes that are typically produced when ATP (50 μm) is added to the Ringer’s solution perfusing the apical membrane of the RPE. The top panel shows the changes in TEP (solid line) andRt (open squares), and the bottom panel shows the changes in VA andVB (solid lines) andRA/RB (open triangle). The TEP and membrane voltages undergo three operationally distinct phases with onset times labeled I, II, and III. The region enclosed by the dashed lines is replotted at higher gain in Figure 2B.
During the first 12 sec of the ATP response (phase I),VB depolarized faster thanVA, as shown by the increase in TEP; in addition, Rt decreased andRA/RB increased. These changes in Rt andRA/RB are consistent with an increase in basolateral membrane conductance. In the bovine RPE, the total conductance of the basolateral membrane consists almost entirely of a DIDS-inhibitable Cl conductance (the transference number for Cl ions, or TCl, is ∼0.7) and a Ba2+-inhibitable K conductance (TK∼0.3) (Joseph and Miller, 1991). As previously demonstrated, the electrochemical driving force for Cl (and K) is outward across the basolateral membrane (Bialek and Miller, 1994) and, therefore, all of the electrical changes observed during phase I are consistent with an increase in basolateral membrane Cl conductance.
After ∼12 sec, the TEP peaked at a maximum value of 9.2 mV and then started to decrease; this peak in TEP, which operationally defines the onset of phase II, occurs because VA has begun to depolarize faster than does VB. During this second phase of the response,RA/RB continued to increase significantly, whereas Rt increased slightly. These changes suggest the emergence of an additional electrical response at the apical membrane. ThatVA depolarized faster thanVB, whereas bothRA/RB andRt increased, strongly suggests a decrease in an apical membrane conductance. The most likely candidate is the apical membrane K conductance, which accounts for ∼90% of the total conductance at that membrane (Joseph and Miller, 1991).
The onset of phase III is operationally defined by the minimum in TEP (∼6 mV; see Fig. 2A). During phase III,VA hyperpolarized faster thanVB,RA/RB decreased, andRt remained relatively unchanged. These electrical effects are consistent with an increase in apical membrane conductance. The electrical changes observed during phase III are the opposite of those observed during phase II, but they are relatively small and more difficult to study. The remainder of this report focuses entirely on the first two phases of the ATP response. Table1 (top row) summarizes these changes in the electrical parameters after the addition of 50 μm ATP to the apical bath. These electrical responses indicate that conductive mechanisms at both membranes are affected dramatically by the addition of ATP. No electrical effects were observed when ATP was added to the basolateral bath.
Table 1.
Summary of ATP-induced electrical responses in absence and presence of either DIDS or BA2+
| Phase I | Phase II | |||||||
|---|---|---|---|---|---|---|---|---|
| ΔVA(mV) | ΔVB(mV) | ΔRt(Ω · cm2) | ΔRA/RB | ΔVA(mV) | ΔVB(mV) | ΔRt(Ω · cm2) | ΔRA/RB | |
| ATP (50 μm) n = 17 | +12.1 ± 5.9 | +16.5 ± 6.6 | −10.9 ± 7.21-a | +0.30 ± 0.561-a | +18.0 ± 9.7 | +14.4 ± 8.3 | +1.6 ± 6.91-a | +1.14 ± 0.701-a |
| ATP (control) n = 3 | +18.8 ± 2.1 | +23.8 ± 2.5 | −12.2 ± 3.5 | +0.51 ± 0.23 | +17.5 ± 2.2 | +14.0 ± 1.6 | +0.4 ± 1.7 | +0.8 ± 0.30 |
| ATP (in basal DIDS) | +6.0 ± 1.01-b | +7.4 ± 1.31-b | −1.0 ± 1.61-b | +0.20 ± 0.11 | +21.5 ± 4.3 | +20.2 ± 4.0 | −2.0 ± 1.9 | +0.6 ± 0.25 |
| ATP (control) n = 3 | +13.5 ± 3.0 | +19.6 ± 4.3 | −11.3 ± 3.61-c | +0.40 ± 0.221-c | +19.6 ± 3.0 | +16.5 ± 2.4 | +0.8 ± 0.61-c | +1.1 ± 0.41-c |
| ATP (in apical Ba2+) | +6.6 ± 1.01-b | +7.6 ± 1.21-b | −3.2 ± 1.0b,c | +0.42 ± 0.201-c | −1.0 ± 0.81-d | −0.7 ± 0.31-d | +0.6 ± 0.61-c | +0.3 ± 0.21-c |
n = 10.
Statistically different from control ( p < 0.05; paired t test).
n = 2.
Statistically different from control ( p < 0.01; paired t test).
Summary of the effects of the addition of 50 μm ATP to Ringer’s solution perfusing the apical membrane (row 1) on the electrical parameters VA,VB, Rt, andRA/RB for both phases of the electrical response (results reported as mean ± SD). Positive values for ΔVA and ΔVB represent membrane depolarization, and positive values for ΔRt and ΔRA/RBindicate an increase in total resistance and increase in the ratio of apical to basolateral membrane resistance, respectively. Rows 2 and 3 summarize the electrical effects of ATP (50 μm) in control conditions and after pretreatment with basal DIDS (3 mm). Rows 4 and 5 summarize the ATP-induced electrical changes in the absence and presence of apical Ba2+. Results for rows 2–5 are reported in terms of mean ± SEM, and pairedt tests were performed.
Effects of basolateral DIDS and apical barium on ATP response
Previous work in bovine RPE demonstrated that addition of 3 mm DIDS to the basolateral bath specifically blocked basolateral membrane Cl conductance without significantly altering the K conductance (Miller and Edelman, 1990; Joseph and Miller, 1991;Bialek and Miller, 1994). If phase I of the ATP-evoked electrical response is attributable to an increase in basolateral membrane Cl conductance, then pretreatment with basolateral DIDS should block this part of the response. All of the data illustrated in Figure2A–D are from the same tissue. In Figure2C, the tissue was pretreated with 3 mmbasolateral DIDS for ∼30 min before 50 μm ATP was added to the apical bath, and in Figure 2D, the first few minutes of the response are replotted at higher gain. During phase I of the control response (Fig. 2, A or B), the addition of ATP depolarized VA by 21.5 mV andVB by 26.0 mV. In the presence of basolateral DIDS (Fig. 2, C or D), these changes were reduced by ∼75%; VA depolarized by 4.0 mV andVB depolarized by 4.9 mV. Table 1 (rows 2 and 3) shows that in three tissues, phase I of the ATP-induced ΔVB was inhibited by 70% in the presence of basolateral DIDS (p < 0.05; paired ttest). In contrast, during phase II of the ATP response, neither ΔVA nor ΔVB was significantly different in control and DIDS-pretreated conditions. The DIDS-induced reduction of the ATP response during phase I lends additional support to the notion that ATP increases basolateral membrane Cl conductance.
The depolarization of VA andVB, the decrease in TEP, and the increase inRA/RB during phase II of the ATP-induced electrical response are consistent with a decrease in apical membrane K conductance. The apical membrane contains a large K conductance (TK ∼0.9) that can be inhibited by 1 mm Ba2+ (Miller and Edelman, 1990; Joseph and Miller, 1991; Bialek and Miller, 1994). If ATP decreases apical membrane K conductance during phase II of the response, then pretreatment with apical Ba2+ should inhibit this phase of the response. Figure 3, Aand C, show control ATP responses in the absence and presence of apical Ba2+, and Figure 3, B andD, show the first few minutes of these responses plotted at higher gain. During phase I of the control response, addition of ATP depolarized VA and VB by 8.2 and 10.8 mV, respectively, and in the presence of apical Ba2+, VA andVB depolarized by 5.2 and 4.6 mV, respectively. Apical Ba2+ completely inhibited phase II of the ATP-induced voltage changes: ΔVA and ΔVB were 16.4 and 14.0 mV, respectively, in the absence of Ba2+; ΔVA and ΔVB were −1.2 and −1.4 mV, respectively, in the presence of apical Ba2+. These results indicate that phase II of the ATP voltage response is mediated by a Ba2+-inhibitable decrease in apical membrane K conductance. Complete inhibition of phase II of the ATP-induced response by apical Ba2+ was observed in two other tissues (data summarized in Table 1, rows 4 and 5). Apical Ba2+ also significantly reduced phase I of the ATP response, but this effect is probably attributable to the Ba2+-induced depolarization ofVB from approximately −60 to −30 mV, which brings VB toward the equilibrium potential for Cl, and reduces the driving force for Cl efflux during phase I of the ATP response (Bialek and Miller, 1994).
Fig. 3.
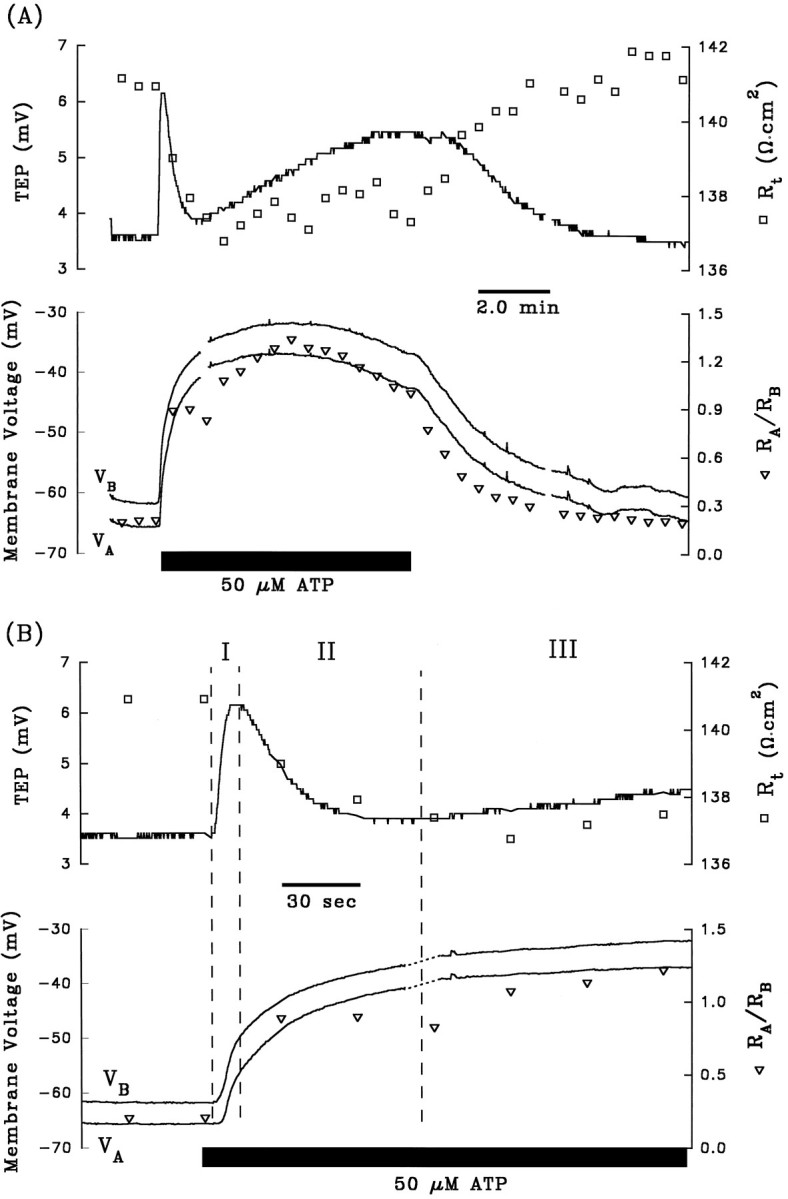
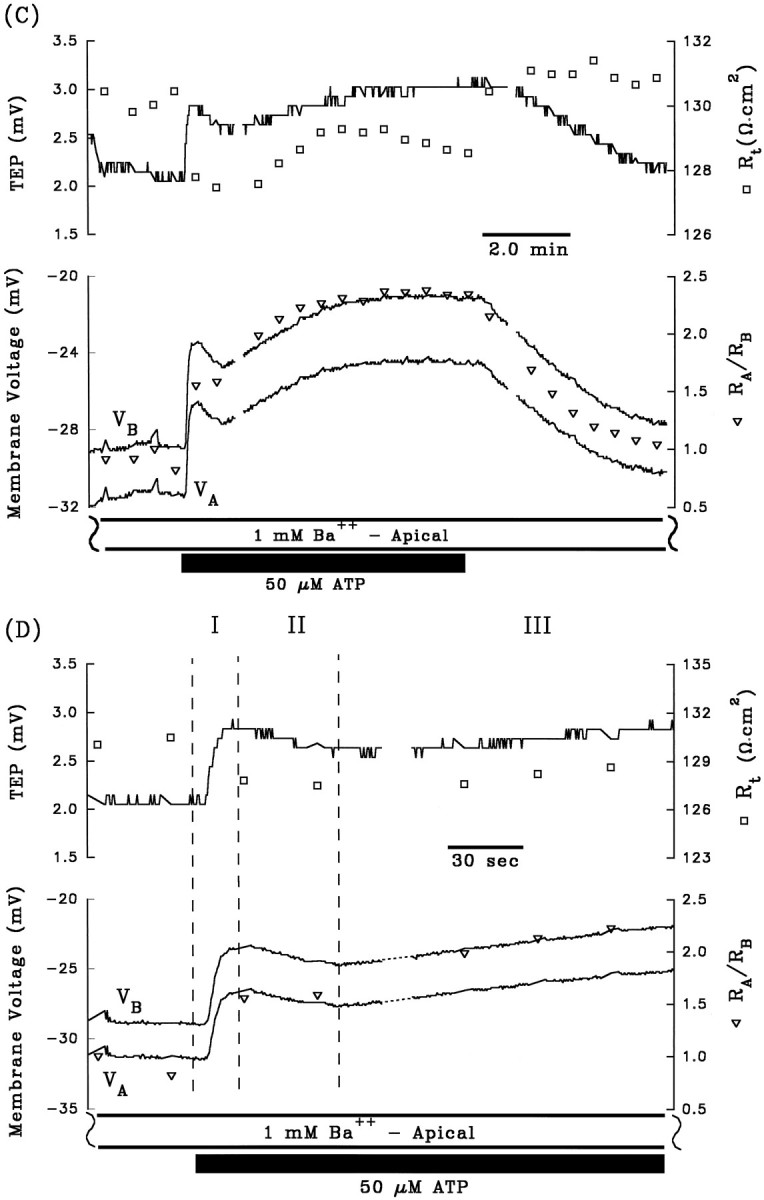
A and B are control electrical responses to ATP, and C andD are the electrical response to ATP after pretreatment with apical Ba2+. After A and beforeC, 1 mm Ba2+ was added to Ringer’s solution perfusing the apical membrane (data not shown). Phase II of the ATP-induced voltage response is completely inhibited by the presence of apical Ba2+. Phase I of the response is also significantly reduced by pretreatment with apical Ba2+, which can be explained by the reduction in driving force of Cl efflux across the basolateral membrane caused by the Ba2+-evoked depolarization ofVB from −63 mV to −29 mV (see Discussion).Figure continues.
Role of free [Ca2+]in
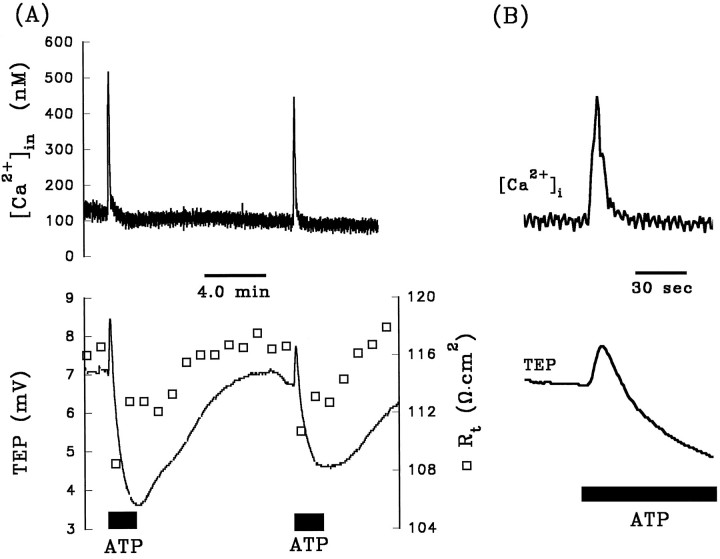
The electrical effects of ATP suggest the presence of G-protein coupled (metabotropic) purinoceptors at the apical membrane. Activation of metabotropic receptors has been associated with an IP3-mediated increase in cytolosic-free [Ca2+]in (Dubyak, 1991; Barnard et al., 1994;Zimmermann, 1994; Kirischuk et al., 1995). To determine whether ATP activates Ca2+ signaling pathways in the RPE, we performed a series of experiments that measured [Ca2+]in levels with the calcium-sensitive dye fura-2 AM. The top panel of Figure4A shows the [Ca2+]in response to two successive additions of 100 μm ATP to Ringer’s solution perfusing the apical membrane, and the bottom panel shows the concomitant TEP and transepithelial resistance (Rt) responses. The addition of ATP significantly increased free [Ca2+]in levels by ∼400 nm from a baseline of ∼120 nm. In 15 ATP pulses taken from 10 tissues, the addition of ATP increased free [Ca2+]in by 420 ± 70 nmfrom a baseline value of 130 ± 30 nm. Figure4B shows the second of the ATP-induced responses from Figure 4A replotted at higher gain. The rising phase of the ATP-evoked increase in free [Ca2+]inoccurs over a period of 4–6 sec, and the falling phase typically occurs over a period of 20–40 sec; this time course is slightly faster than the rising and falling phases of the electrical responses, suggesting a causal relationship between the calcium and electrical responses.
Fig. 4.
A, Effects of two consecutive pulses of 100 μm ATP added to Ringer’s solution perfusing the apical membrane on [Ca2+]in, TEP, and Rt. [Ca2+]in measurements were made with the ratioing dye, fura-2 AM. ATP elicited a large transient increase in [Ca2+]in from ∼120 to 500 nmthat follows a time course similar to the first two phases of the electrical effects of ATP (see text). In addition, [Ca2+]in immediately returned to its initial, resting value, whereas ATP remains in the apical Ringer’s solution (the ATP pulse lasted for 2 min, but the transient increase in [Ca2+]in lasted for only 30–40 sec). The first and second ATP responses were comparable in magnitude and time course, indicating repeatability in the calcium and electrical responses. B, The effects of the second ATP response are replotted at higher gain for purposes of clarity. The same vertical axes are used for [Ca2+]in and TEP in bothA and B.
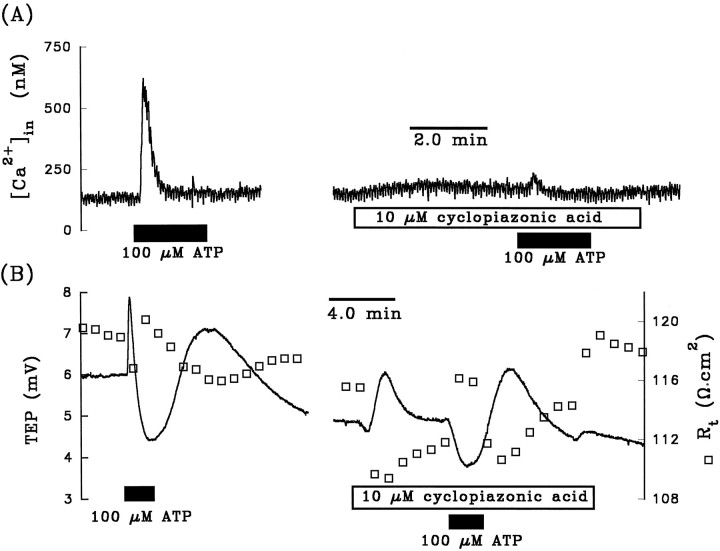
It has been demonstrated that purinergic-coupled increase in [Ca2+]in can be inhibited by unloading calcium from internal stores before the addition of ATP (Kirischuk et al., 1995). The depletion of calcium from internal stores can be achieved by adding specific inhibitors of the endoplasmic reticulum (ER) Ca2+-ATPase, thereby blocking calcium uptake without affecting calcium leakage out of the ER stores (Seidler et al., 1989;Darby et al., 1993). We tested this notion in the experiment summarized in Figure 5A; 100 μm ATP was added to the apical bath in the absence and presence of 10 μm cyclopiazonic acid, a potent and specific inhibitor of the ER Ca2+ ATPase (Seidler et al., 1989). The control response shows that ATP increased [Ca2+]infrom 130 to 600 nm. In the presence of cyclopiazonic acid, the ATP-induced increase in [Ca2+]in was inhibited by >90%. An almost identical effect was observed in each of three tissues. The cyclopiazonic acid-induced inhibition of the ATP-evoked [Ca2+]in response in the presence of ∼2 mm extracellular calcium indicates that the calcium spikes shown in Figures 4 and 5A initially originated from the internal stores, not from the extracellular environment.
Fig. 5.
A, Effects of pretreatment with cyclopiazonic acid on the ATP-evoked [Ca2+]inresponse. Left panel shows that ATP produced a transient increase in [Ca2+]in from 130 to 620 nm, which represents a difference of ∼590 nm. In the presence of the ER Ca2+-ATPase inhibitor, ATP increased [Ca2+]in by only 30 nm(see text for details). B, Effects of pretreatment with cyclopiazonic acid on the ATP-induced TEP andRt responses. Left panelshows that ATP increased the TEP by 1.9 mV (phase I) and decreased the TEP by 3.5 mV (phase II). In the presence of cyclopiazonic acid, ATP did not elicit a measurable increase in TEP during phase I and decreased the TEP by 1.2 mV during phase II. Measurements were made in a different tissue fromA.
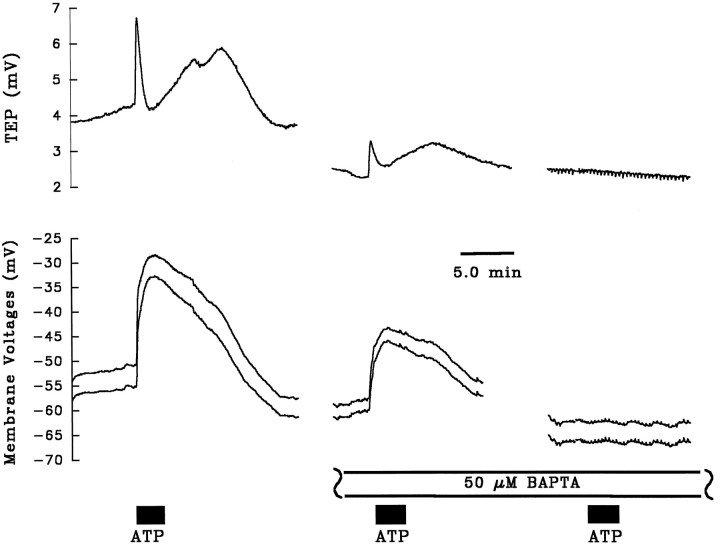
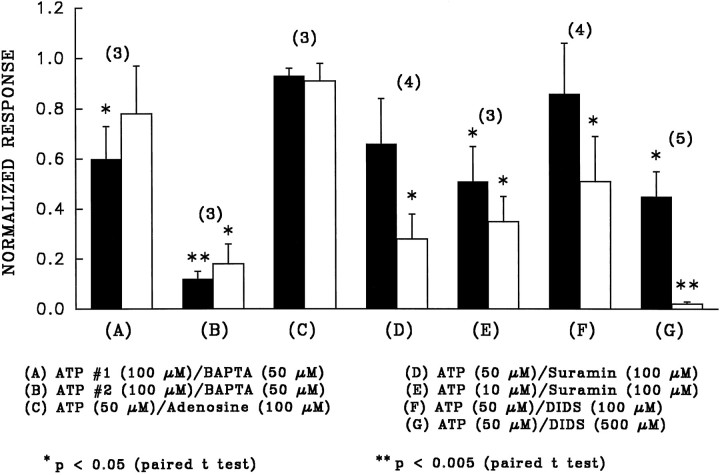
Figure 5B shows the effects of ATP in the absence and presence of cyclopiazonic acid on TEP and Rt. The right panel in Figure 5B shows that cyclopiazonic acid itself produced a transient increase in TEP and a decrease inRt. Figure 5B also shows that pretreatment with cyclopiazonic acid completely abolished phase I and significantly reduced phase II of the TEP response. In five tissues, cyclopiazonic acid completely inhibited phase I and reduced phase II of the TEP response by 74 ± 18%. These data strongly suggest that the ATP-induced elevation of [Ca2+]in is responsible for the observed electrical effects. This condition can be tested further by using the calcium buffer BAPTA to clamp free [Ca2+]in and block the ATP-evoked electrical responses. Figure 6 shows three ATP (100 μm) pulses administered consecutively on the same tissue. After the first (control) ATP pulse, 50 μm BAPTA was added to Ringer’s solution perfusing the apical membrane for ∼20 min (data not shown). In the presence of BAPTA, two subsequent additions of ATP to the apical Ringer’s solution were made. The first of these additions resulted in an ∼40% reduction in the voltage response, and the second addition of ATP in the presence of BAPTA did not produce any voltage responses in this tissue. The bar graphs in Figure7A,B summarize the relative effects of BAPTA on phase I (solid bar) and phase II (open bar) of the ATP-induced voltage response, compared with a normalized control ATP response. Taken together, Figures5A,B, 6, and7A,B show that ATP induces a release of Ca2+ from the ER stores and that this transient increase in [Ca2+]in produces the changes in basolateral membrane Cl and apical membrane K conductance.
Fig. 6.
Effect of BAPTA pretreatment on ATP-induced voltage response. The control addition of ATP (100 μm) shows a typical triphase TEP response, along with the concomitant changes in membrane potential. BAPTA (50 μm) was then added to Ringer’s solution perfusing the apical membrane (data not shown) for ∼20 min before a second addition of ATP was made. Both phases of the ATP-dependent voltage response were reduced by ∼40% in the presence of BAPTA. Another 30 min elapsed between the second and third addition of ATP (intervening voltage traces not shown). BAPTA completely blocked the effects of the final addition of ATP in this tissue.
Fig. 7.
Bar graphs summarizing the effects of various putative blockers on phase I (solid bars) and phase II (open bars) of the ATP response. Each phase of the control ATP response (in the absence of blocker) is normalized to 1, and the height of the bar graph represents the relative size of the ATP response in the presence of the blocker compared with the normalized control. All blockers were added to Ringer’s solution perfusing the apical membrane before and during the addition of ATP.Numbers in parentheses indicate sample size, and error bars indicate SEM. A andB represent bar graphs for the first and second additions of ATP in the presence of BAPTA, taken from data similar to those shown in Figure 6. The results of this figure show that BAPTA, suramin, and DIDS are effective inhibitors of the effects of ATP.
Purinergic receptor subtype
Previous work in the bovine RPE has shown the presence of adenosine receptors that are sensitive to micromolar amounts of adenosine (Blazynski, 1993). It is possible that the ATP-induced responses observed in the present study were not attributable to activation of ATP receptors, but rather to activation of adenosine receptors by adenosine, which may be produced either during the synthesis of ATP or as a result of extracellular ATP hydrolysis by ecto-ATPases. If ATP activated adenosine receptors, then adenosine alone should elicit a response similar to that of ATP and also block the effects of ATP. We found that adenosine itself (100 μm) had little effect on the TEP (<10% of the ATP response). To determine whether adenosine blocked the effects of ATP, we added 50 μm ATP in the absence and presence of 100 μm adenosine. Figure 7C shows a bar graph summarizing the effects of adenosine on the ATP-induced voltage changes during phase I (solid bar) and phase II (open bar). The height of the bars represents the ratio of the ATP response in the presence of adenosine to the control ATP response alone. Because the ratio for each phase is close to 1, the presence of adenosine did not inhibit the effects of ATP. We conclude that adenosine receptors do not play a significant role in the ATP responses.
The bars in Figure 7D,E summarize the effects of pretreatment of the apical membrane with the P2-purinergic receptor antagonist suramin (Dunn and Blakeley, 1988) on phases I and II of the ATP-induced voltage response. Figure 7D indicates that suramin (100 μm) partially inhibited phase I and significantly inhibited phase II of the 50 μm ATP responses, and Figure 7E shows that this concentration of suramin significantly inhibited both phases of the 10 μm ATP responses, suggesting that the ATP-evoked effects are attributable to activation of a subset of P2-purinoceptor.
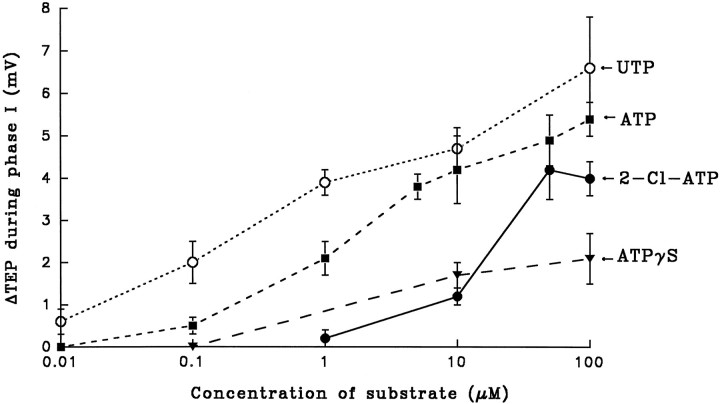
To identify which P2-purinoceptor is present in bovine RPE, we have tested the efficacy of other substrates in mimicking the ATP-induced changes in TEP. These experiments, summarized in Figure8, show that UTP has an apparent affinity,Kd, of ∼1 μm for the receptor, whereas ATP has an apparent Kd of ∼5 μm. The ATP analog 2-chloro-ATP elicited relatively large responses at concentrations >10 μm, and ATPγS, a nonhydrolyzable form of ATP, also elicited a response but was relatively small at the concentrations studied (<100 μm). The ATP pharmacology data, as summarized in Figures7, C–E, and 8, along with the ATP-induced increase in [Ca2+]in are consistent with the presence of metabotropic P2Y/P2U-purinoceptors at the apical membrane.
Fig. 8.
Dose response of UTP, ATP, 2-chloro-ATP, and ATPγS on ΔTEP. The rank order of affinity of the putative purinergic receptor for these purinergic analogs are as follows (from highest to lowest): UTP > ATP > 2-Cl-ATP > ATPγS. The higher affinity of the receptor for UTP than for ATP is consistent with the activation of P2Y/P2U-purinoceptors. Error bars indicate SEM, and sample sizes range from 3 to 12.
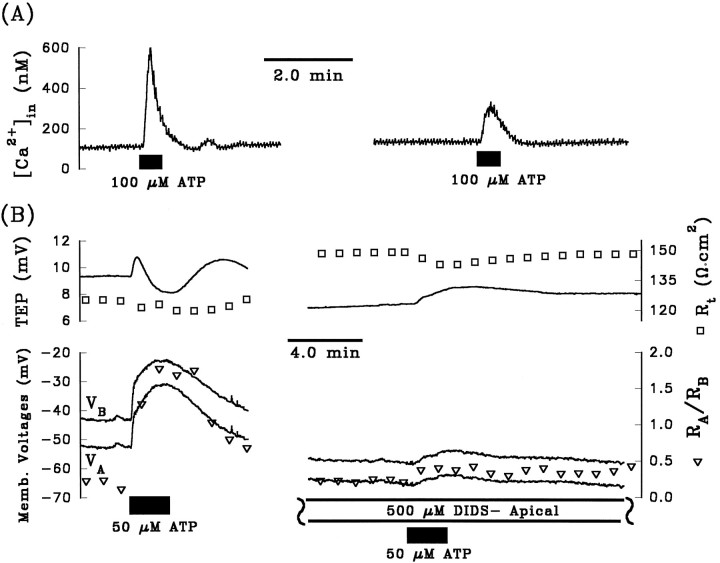
Micromolar amounts of DIDS were shown previously to directly block P2X-receptors in rat vas deferens and in superior cervical ganglia, as well as in P2X-receptors cloned from smooth muscles heterologously expressed in oocytes and human 293 cells (Bultmann and Starke, 1994; Connolly and Harrison, 1995; Evans et al., 1995). In the present study, we tested the ability of DIDS to block the ATP responses. Figure 9A (right panel) shows that pretreating the apical membrane with DIDS (500 μm) significantly reduced the [Ca2+]in response evoked by 100 μm ATP. In four tissues, apical DIDS (500 μm) reduced the 100 μm ATP-induced [Ca2+]in response by 68 ± 14% (mean percentage decrease ± SEM). Similarly, Figure 9B shows that the electrical responses produced by ATP were significantly reduced by apical DIDS (measurements were made in a different tissue from that of Fig. 9A). The bar graphs in Figure 7,F and G, summarize the effects of pretreatment of the apical membrane with either 100 μm or 500 μm DIDS on both phases of the ATP-induced voltage changes. These results show that the lower concentration of DIDS significantly attenuated the magnitude of phase II, whereas the higher DIDS concentration significantly reduced phase I and almost completely abolished phase II of the ATP response. A similar effect of DIDS on the ATP-evoked voltage responses has been observed in cultured human RPE (R. Gallemore, personal communication) and in native human fetal RPE (J. Quong and S. Miller, unpublished observations). Because apical DIDS is able to directly inhibit the effects of ATP-induced [Ca2+]in responses and the magnitude of both phases of the electrical responses, we conclude that DIDS can directly block at least a subset of P2Y-purinoceptors.
Fig. 9.
Effects of apical DIDS on the ATP-induced [Ca2+]in and electrical responses.A, Left trace shows that ATP (100 μm) produced an increase in [Ca2+]in from 110 to 600 nm. Pretreating the apical membrane with DIDS (500 μm) increased [Ca2+]in by only 170 nm(from a baseline value of 130 nm to a stimulated value of 300 nm), representing a decrease of ∼74% from the control response. B, Pretreatment with apical DIDS reduced phase I of ΔVB to ∼3 mV (bottom right panel) from a control response of 12 mV (bottom left panel) of the voltage responses to ATP (50 μm). DIDS completely eliminated phase II of the ATP-induced voltage response.
Purinergic modulation of fluid transport
Phase I of the ATP-evoked electrical response is expected to increase Cl efflux across the basolateral membrane; phase II should decrease K efflux across the apical membrane, which will increase apical-to-basolateral K absorption (Miller and Edelman, 1990). Both phases combined should in principle increase net retinal-to-choroidal KCl absorption. Previous work in the bovine RPE has shown that epinephrine-induced activation of apical membrane α-1 adrenergic receptors causes electrical responses very similar to those observed in the present study and significantly increased fluid absorption across the RPE (Edelman and Miller, 1991; Joseph and Miller, 1992). To determine whether ATP or UTP also increases fluid absorption, we performed a series of experiments to measure the UTP-induced changes in fluid transport rate JV.
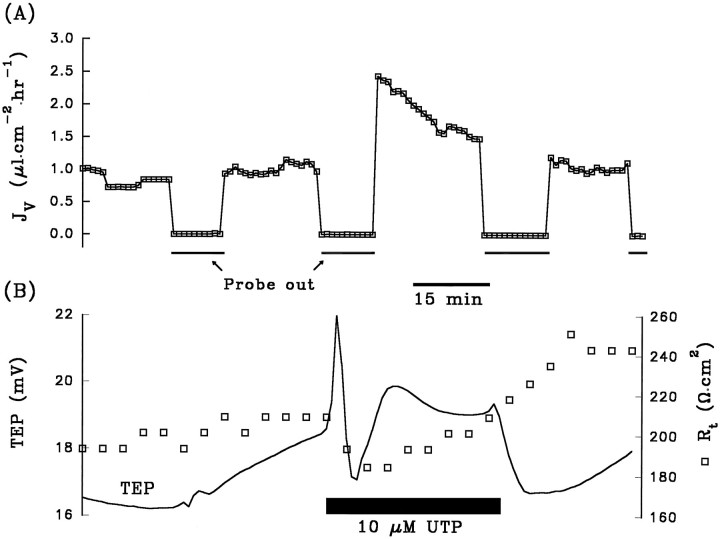
Figure 10A shows the results from an experiment in which JV across the RPE was measured in the absence or presence of UTP. Before the addition of 10 μm UTP (black bar), an initial control-to-control Ringer’s solution change was made (see Materials and Methods). During this period, the control baselineJV was ∼1.0 μl · cm−2 · hr−1. (Positive value of JVindicates net fluid absorption.) During the second removal of the probe, Ringer’s solution containing 10 μm UTP was added to the apical bath, and a transient increase inJV to ∼2.5 μl · cm−2 · hr−1, followed by a decrease to a steady-state level of ∼1.5 μl · cm−2 · hr−1, was observed. The subsequent return to control Ringer’s solution show a decrease ofJV back to ∼1.1 μl · cm−2 · hr−1. An identical protocol for JVmeasurement was performed in each of nine tissues. In six of the nine tissues, the addition of UTP significantly increased the control absorptive JV. In two tissues, there were no appreciable changes in JV caused by UTP. In one tissue, fluid secretion under control conditions was observed (controlJV was approximately −0.3 μl · cm−2 · hr−1), and the addition of UTP reversed the direction of fluid movement to absorption (JV was increased to ∼0.6 μl · cm−2 · hr−1 by UTP).
Fig. 10.
Addition of UTP to Ringer’s solution bathing the apical membrane elicited a significant increase in fluid absorption.A, The obligatory control-to-control solution change (see Materials and Methods) during the first 35 min produced very little change in Jv, TEP, andRt. The initial, steady-stateJV was ∼1.0 μl · cm−2 · hr−1, indicating net absorption of fluid from the apical to basolateral chamber. The addition of 10 μm UTP (black bar) produced a transient increase inJV to ∼2.5 μl · cm−2 · hr−1, followed by a steady decrease to ∼1.5 μl · cm−2 · hr−1. The removal of UTP from the apical bathing solution brought JV levels back down to ∼1.1 μl · cm−2 · hr−1.B, The addition of UTP produced electrical effects that were similar to those of ATP.
The baseline (control) rate of fluid absorption was 1.2 ± 0.2 μl · cm−2 · hr−1 (n = 27 from 9 tissues; mean ± SEM). The addition of 10 μm UTP to the apical Ringer’s solution increasedJV to 2.9 ± 1.0 μl · cm−2· hr−1 (n = 9; p < 0.05). These experiments show that apical membrane purinoceptors can be activated to increase fluid movement across the RPE, in the apical-to-basolateral direction.
DISCUSSION
Receptor subtype and ionic mechanisms
The present study demonstrates that micromolar amounts of ATP (or UTP) added to the solution bathing the RPE apical membrane causes a transient increase in [Ca2+]in and elicits large voltage and resistance responses at both the apical and basolateral membranes. A number of observations indicate that these ATP-evoked effects are attributable to activation of metabotropic P2Y/P2U-purinergic receptors. (1) The electrical effects of ATP are significantly reduced by pretreatment with the P2-purinergic receptor antagonist suramin. (2) These putative receptors have a fivefold higher sensitivity for UTP than ATP. (3) Cyclopiazonic acid, an ER Ca2+-ATPase inhibitor, significantly reduced the ATP-evoked calcium and electrical responses. (4) The intracellular calcium buffer BAPTA significantly inhibited the electrical effects of ATP. The present data do not conclusively ascertain which of the P2Y-purinoceptors subtype is present in the RPE. We also report that apical DIDS (Figs.7F,G and 9) attenuated the ATP-induced calcium response and both phases of the electrical responses. A similar inhibitory effect of DIDS on the P2U-purinergic-induced increase in [Ca2+]in was observed in human breast tumor cells (Flezar and Heisler, 1993). However, we found that apical DIDS, in contrast to basolateral DIDS, had no effect on the electrical responses evoked by epinephrine, which increases [Ca2+]in by activating apical membrane α-1 adrenergic receptors in the bovine RPE (Joseph and Milller, 1992) (Peterson and Miller, unpublished observations). Our results suggest that DIDS either directly blocks the receptor itself or inhibits the ATP-dependent (but not the epinephrine-dependent) Ca2+-signaling pathway.
The tonic addition of ATP (>10 μm) generally elicits a triphasic electrical response. The depolarization ofVB, increase in TEP, decrease inRt, and increase inRA/RB during the first 10–15 sec of the response are consistent with an increase in basolateral membrane Cl conductance. This conclusion is supported by the finding that basolateral DIDS, a specific blocker of Cl conductances at the basolateral membrane (Joseph and Miller, 1991;Bialek and Miller, 1994), significantly inhibited phase I of the ATP-induced response. The second phase of the response, which lasts 1–2 min, consists of a depolarization of VA, decrease in TEP, no significant change in Rt, and an additional increase inRA/RB. These voltage and resistance changes are probably caused by a decrease in apical membrane K conductance, because apical Ba2+ completely abolished this phase of the response. These effects of extracellular ATP in the RPE on [Ca2+]in and ion transport exhibit a few key differences with the effects of ATP in other epithelial models. For example, extracellular ATP activates K currents in cultured distal nephron epithelia (Nilius et al., 1995); in airway epithelia, extracellular ATP activates both Ca2+-sensitive and Ca2+-insensitive Cl conductances (Stutts et al., 1994;Hwang et al., 1996), and in T84 epithelial cells, the ATP-induced stimulation of Cl secretion is largely attributable to the hydrolysis of ATP to adenosine by luminal ecto-ATPases, followed by the activation of adenosine receptors, and a subsequent increase in intracellular cAMP levels (Stutts et al., 1995).
The present study provides indirect evidence for two calcium-dependent conductance mechanisms that are affected by metabotropic signaling in the RPE. The ability of cyclopiazonic acid to inhibit the ATP-induced calcium and electrical responses (Fig. 5), as well as the finding that BAPTA significantly reduces the electrical effects of ATP, strongly suggests a causal relationship between the intracellular second messenger, calcium, and the affected ionic mechanisms. These results show that basolateral membrane Cl channels and apical membrane K channels are sensitive to [Ca2+]in. In other epithelia, apical membrane-localized Ca2+-activated Cl channels have been proposed to play an important role in fluid secretion (Jiang et al., 1993; Smith and Welsh, 1993). In the toad RPE, a large component of the K conductance is made up of the inward rectifying K channels that are believed to reside at the apical membrane (Segawa and Hughes, 1994) and are inactivated by high levels of [Ca2+]in (B. Hughes, personal communication).
Physiological implications
Extracellular ATP has been well characterized as a signaling molecule in central and peripheral neurons, oligodendrocytes, astrocytes, and numerous cell types not directly associated with the nervous system (Edwards and Gibb, 1993; Flezar and Heisler, 1993;Zimmermann, 1994; Nilius et al., 1995; Van Scott et al., 1995). However, to our knowledge, none of the retinal cell types have been shown to release ATP as a neurotransmitter. A recent study in rabbit suggested that ATP may be co-released with acetylcholine from retinal neurons after stimulation with flickering light (Neal and Cunningham, 1994). ATP has also been shown to activate purinoceptors in late precursors and oligodendrocytes in cultured rabbit retinal cells, suggesting that certain classes of retinal cells may release ATP that could, in turn, bind to purinergic receptors on retinal oligodendrocytes (Kirischuk et al., 1995).
The present finding that UTP increases baseline levels of fluid absorption may have important clinical implications. In the human eye, accumulation of fluid in the subretinal space often leads to retinal detachment from the RPE and subsequent loss of vision (Anand and Tasman, 1994). The increase in JV to ∼3 μl · cm−2 · hr−1 by apical UTP would remove ∼0.75 ml of fluid per day in the human eye (10 cm2). Therefore, UTP (or perhaps ATP) could be used therapeutically to reduce the pathological accumulation of fluid in the subretinal space. Previous work in the bovine RPE has shown that nanomolar amounts of epinephrine increases fluid absorption by amounts that are comparable with those found by UTP in the present study. Both ATP and epinephrine could conceivably be presented to the RPE at the same time; it has been shown recently, for example, that cultured postganglionic sympathetic neurons co-release ATP and epinephrine (von Kugelgen et al., 1994). Simultaneous presentation of ATP and epinephrine to the RPE in vivo could lead to additive increases in the rate of fluid absorption out of the subretinal space.
One component of the DC electroretinogram and DC electro-oculagram is a prominent slow positive potential that peaks ∼5 min after light onset (Linsenmeier and Steinberg, 1982). This positive potential is most likely attributable to an increase in RPE basolateral membrane Cl conductance (Gallemore and Steinberg, 1989, 1993). It has been postulated that after light onset, a retinal paracrine or “light peak substance” diffuses into the subretinal space and binds to a receptor on the apical membrane of the RPE. This activates a second messenger pathway that leads to an increase in basolateral membrane Cl conductance (Gallemore and Steinberg, 1989, 1993). We have found that at lower concentrations of ATP (<5 μm), the electrical effects are monophasic and consistent with an increase in basolateral membrane Cl conductance. Therefore, it is possible that ATP is the “light peak substance.” Its actions would arise either from diffusion of ATP from cells in the inner retinal layer or from an autocrine loop involving ATP efflux across the apical membrane of the RPE.
The presence of ATP in the subretinal space could also arise from ATP release from damaged retinal cells or from RPE cells themselves. The activation of the apical membrane purinergic receptors could therefore serve to communicate nearby cell damage to the RPE, and the high affinity of the ATP-evoked responses suggests that these receptors would be ideally suited to quickly detect nearby cell damage. Because the RPE plays an active role in normal and pathological wound-healing and in mediating inflammatory responses associated with a number of ocular pathologies, it is possible that the purinergic receptors can modulate various aspects of wound-healing or inflammation in the eye. Previous work in other cells types have shown that stimulation of P2-purinergic receptors can play a modulatory (either inhibitory or stimulatory) role in various aspects of either interleukin-1β (IL-1β)-induction or tumor necrosis factor (TNF)-induction of immune responses. These studies suggested that extracellular ATP, acting through purinergic receptors, was able to modulate either the ameliorative or damaging effects of IL-1β or TNF in endotoxin-mediated cell death (Proctor et al., 1994), in production of prostaglandin E2 (PGE2) in chondrocytes (Leong et al., 1993), and in the lysis of L929 (transformed mouse skin fibroblast) cells (Kinzer and Lehmann, 1991). A similar set of findings has been obtained in the RPE including the following. (1) In vitrostimulation by IL-1β and TNFα has been shown to produce a wide variety of RPE-mediated secondary cytokine production, such as IL-6 and IL-8 (Elner et al., 1992), and alterations in RPE proliferation and permeability. (2) Endotoxins, through the secretion of TNF, have been shown to have damaging ocular effects (Planck et al., 1994), and it is possible that ATP could also modulate the effects of endotoxin in the retina. (3) The RPE has been shown to inducibly express PGE2 after co-culture with activated lymphocytes (Liversidge et al., 1993), whose presence in the outer retina (along with extracellular ATP) would be expected after retinal insult or damage. The role of extracellular ATP both as a paracrine signal and as an effector of RPE-mediated immune response is potentially important and remains to be investigated.
Footnotes
This work was supported by National Institutes of Health (NIH) Training Grant #T32 GM07379-15X (W.P.), NIH Grant EY02205 (S.S.M.), and Core Grant EY03176. It is our pleasure to thank Cunrong Li and James Schafer for their expert help on the fluid transport experiments.
Correspondence should be addressed to Dr. Sheldon S. Miller, 360 Minor Hall, University of California, Berkeley, CA 94720.
REFERENCES
- 1.Alexander SPH, Ford APDW. Purines ’96. Trends Pharmacol Sci. 1996;17:385–388. doi: 10.1016/s0165-6147(96)30019-9. [DOI] [PubMed] [Google Scholar]
- 2.Anand R, Tasman WS. Nonrhegmatogenous retinal detachment. In: Glaser BM, editor. Retina, Vol 3. Mosby; St. Louis: 1994. pp. 2463–2488. [Google Scholar]
- 3.Barnard EA, Burnstock G, Webb TE. G protein-coupled receptors for ATP and other nucleotides: a new receptor family. Trends Pharmacol Sci. 1994;15:67–70. doi: 10.1016/0165-6147(94)90280-1. [DOI] [PubMed] [Google Scholar]
- 4.Bialek S, Miller SS. K and Cl transport mechanisms in bovine pigment epithelium that could modulate subretinal space volume and composition. J Physiol (Lond) 1994;475:401–417. doi: 10.1113/jphysiol.1994.sp020081. [DOI] [PMC free article] [PubMed] [Google Scholar]
- 5.Bialek S, Quong J, Yu K, Miller SS. Nonsteroidal anti-inflammatory drugs alter chloride and fluid transport in bovine pigment epithelium. Am J Physiol. 1996;270:C1175–C1189. doi: 10.1152/ajpcell.1996.270.4.C1175. [DOI] [PubMed] [Google Scholar]
- 6.Blazynski C. Characterization of adenosine A2 receptors in bovine retinal pigment epithelial membranes. Exp Eye Res. 1993;56:595–599. doi: 10.1006/exer.1993.1073. [DOI] [PubMed] [Google Scholar]
- 7.Bultmann R, Starke K. Blockade by 4,4′-diisothiocyanatostilbene-2,2′-disulphonate (DIDS) of P2X-purinoceptors in rat vas deferens. Br J Physiol. 1994;112:690–694. doi: 10.1111/j.1476-5381.1994.tb13131.x. [DOI] [PMC free article] [PubMed] [Google Scholar]
- 8.Connolly GP, Harrison PJ. Discrimination between UTP- and P2-purinoceptor-mediated depolarization of rat superior cervical ganglia by 4,4′-diisothiocyanatostilbene-2,2′-disulphonate (DIDS) and uniblue A. Br J Physiol. 1995;115:427–432. doi: 10.1111/j.1476-5381.1995.tb16351.x. [DOI] [PMC free article] [PubMed] [Google Scholar]
- 9.Darby PJ, Kwan CY, Daniel EE. Use of calcium pump inhibitors in the study of calcium regulation in smooth muscle. Biol Sig. 1993;2:293–304. doi: 10.1159/000109510. [DOI] [PubMed] [Google Scholar]
- 10.Dearry A, Edelman JL, Miller S, Burnside B. Dopamine induces light-adaptive retinomotor movements in bullfrog cones via D2 receptors and in retinal pigment epithelium via D1 receptors. J Neurochem. 1990;54:1367–1378. doi: 10.1111/j.1471-4159.1990.tb01971.x. [DOI] [PubMed] [Google Scholar]
- 11.Dubyak GR. Signal transduction by P2-purinergic receptors for extracellular ATP. Am J Respir Cell Mol Biol. 1991;4:295–300. doi: 10.1165/ajrcmb/4.4.295. [DOI] [PubMed] [Google Scholar]
- 12.Dunn PM, Blakeley AG. Suramin: a reversible P2-purinoceptor antagonist in the mouse vas deferens. Br J Pharmacol. 1988;93:243–245. doi: 10.1111/j.1476-5381.1988.tb11427.x. [DOI] [PMC free article] [PubMed] [Google Scholar]
- 13.Edelman JL, Miller SS. Epinephrine stimulates fluid absorption across bovine retinal pigment epithelium. Invest Ophthalmol Vis Sci. 1991;32:3033–3040. [PubMed] [Google Scholar]
- 14.Edwards FA, Gibb AJ. ATP–a fast neurotransmitter. FEBS Lett. 1993;325:86–89. doi: 10.1016/0014-5793(93)81419-z. [DOI] [PubMed] [Google Scholar]
- 15.Elner VM, Scales W, Elner SG, Danforth J, Kunkel SL, Strieter RM. Interleukin-6 (IL-6) gene expression and secretion by cytokine-stimulated human retinal pigment epithelial cells. Exp Eye Res. 1992;54:361–368. doi: 10.1016/0014-4835(92)90048-w. [DOI] [PubMed] [Google Scholar]
- 16.Evans RJ, Lewis C, Buell G, Valera S, North RA, Surprenant A. Pharmacological characterization of heterologously expressed ATP-gated cation channels (P2X purinoceptors). Mol Pharmacol. 1995;48:178–183. [PubMed] [Google Scholar]
- 17.Flezar M, Heisler S. P2-purinergic receptors in human breast tumor cells: coupling of intracellular calcium signaling to anion secretion. J Pharm Exp Ther. 1993;265:1499–1510. [PubMed] [Google Scholar]
- 18.Gallemore RP, Steinberg RH. Effects of DIDS on the chick retinal pigment epithelium. II. Mechanism of the light peak and other responses originating at the basolateral membrane. J Neurosci. 1989;9:1977–1984. doi: 10.1523/JNEUROSCI.09-06-01977.1989. [DOI] [PMC free article] [PubMed] [Google Scholar]
- 19.Gallemore RP, Steinberg RH. Effects of dopamine on the chick retinal pigment epithelium. Membrane potentials and light-evoked responses. Invest Ophthalmol Vis Sci. 1990;31:67–80. [PubMed] [Google Scholar]
- 20.Gallemore RP, Steinberg RH. Light-evoked modulation of basolateral membrane Cl conductance in chick retinal pigment epithelium: the light peak and fast oscillation. J Neurophysiol. 1993;70:1669–1680. doi: 10.1152/jn.1993.70.4.1669. [DOI] [PubMed] [Google Scholar]
- 21.Gregory CY, Abrams TA, Hall MO. Stimulation of A2 adenosine receptors inhibits the ingestion of photoreceptor outer segments by retinal pigment epithelium. Invest Ophthalmol Vis Sci. 1994;35:819–825. [PubMed] [Google Scholar]
- 22.Hwang TH, Schwiebert EM, Guggino WB. Apical and basolateral ATP stimulates tracheal epithelial chloride secretion via multiple purinergic receptors. Am J Physiol. 1996;270:C1611–C1623. doi: 10.1152/ajpcell.1996.270.6.C1611. [DOI] [PubMed] [Google Scholar]
- 23.Jiang C, Finkbeiner W, Widdicombe J, McCray P, Jr, Miller SS. Altered fluid transport across airway epithelium in cystic fibrosis. Science. 1993;262:424–427. doi: 10.1126/science.8211164. [DOI] [PubMed] [Google Scholar]
- 24.Joseph DP, Miller SS. Apical and basolateral membrane ion transport mechanisms in bovine retinal pigment epithelium. J Physiol (Lond) 1991;435:439–463. doi: 10.1113/jphysiol.1991.sp018518. [DOI] [PMC free article] [PubMed] [Google Scholar]
- 25.Joseph DP, Miller SS. α1-Adrenergic modulation of K and Cl transport in bovine retinal pigment epithelium. J Gen Physiol. 1992;99:263–290. doi: 10.1085/jgp.99.2.263. [DOI] [PMC free article] [PubMed] [Google Scholar]
- 26.Kenyon E, Yu K, La Cour M, Miller SS. Lactate transport mechanisms at apical and basolateral membranes of bovine retinal pigment epithelium. Am J Physiol. 1994;267:C1561–C1573. doi: 10.1152/ajpcell.1994.267.6.C1561. [DOI] [PubMed] [Google Scholar]
- 27.Kinzer D, Lehmann V. Extracellular ATP and adenosine modulate tumor necrosis factor-induced lysis of L929 cells in the presence of actinomycin D. J Immunol. 1991;146:2708–2711. [PubMed] [Google Scholar]
- 28.Kirischuk S, Scherer J, Kettenmann H, Verkhratsky A. Activation of P2-purinoreceptors triggered Ca2+ release from InsP3-sensitive internal stores in mammalian oligodendrocytes. J Physiol (Lond) 1995;483:41–57. doi: 10.1113/jphysiol.1995.sp020566. [DOI] [PMC free article] [PubMed] [Google Scholar]
- 29.Leong WS, Russell RG, Caswell AM. Induction of enhanced responsiveness of human articular chondrocytes to extracellular ATP by tumour necrosis factor-α. Clin Sci. 1993;85:569–575. doi: 10.1042/cs0850569. [DOI] [PubMed] [Google Scholar]
- 30.Lin H, Miller SS. pHi regulation in frog retinal pigment epithelium: two apical membrane mechanisms. Am J Physiol. 1991;261:C132–C142. doi: 10.1152/ajpcell.1991.261.1.C132. [DOI] [PubMed] [Google Scholar]
- 31.Linsenmeier R, Steinberg RH. Origin and sensitivity of the light peak in the intact cat eye. J Physiol (Lond) 1982;331:653–673. doi: 10.1113/jphysiol.1982.sp014396. [DOI] [PMC free article] [PubMed] [Google Scholar]
- 32.Liversidge J, McKay D, Mullen G, Forrester JV. Retinal pigment epithelial cells modulate lymphocyte function at the blood-retina barrier by autocrine PGE2 and membrane-bound mechanisms. Cell Immunol. 1993;149:315–330. doi: 10.1006/cimm.1993.1158. [DOI] [PubMed] [Google Scholar]
- 33.Miller SS, Edelman JL. Active ion transport pathways in the bovine retinal pigment epithelium. J Physiol (Lond) 1990;424:283–300. doi: 10.1113/jphysiol.1990.sp018067. [DOI] [PMC free article] [PubMed] [Google Scholar]
- 34.Miller SS, Steinberg RH. Passive ionic properties of frog retinal pigment epithelium. J Membr Biol. 1977;36:337–372. doi: 10.1007/BF01868158. [DOI] [PubMed] [Google Scholar]
- 35.Neal M, Cunningham J. Modulation by endogenous ATP of the light-evoked release of ACh from retinal cholinergic neurones. Br J Pharmacol. 1994;113:1085–1087. doi: 10.1111/j.1476-5381.1994.tb17106.x. [DOI] [PMC free article] [PubMed] [Google Scholar]
- 36.Nash MS, Osborne NN. Cell surface receptors associated with the retinal pigment epithelium: the adenylate cyclase and phospholipase C signal transduction pathways. In: Osborne NN, Chader GJ, editors. Progress in retinal and eye research. Pergammon; Oxford: 1996. pp. 501–547. [Google Scholar]
- 37.Negi A, Marmor MF. Mechanisms of subretinal fluid resorption in the cat eye. Invest Ophthalmol Vis Sci. 1986;27:1560–1563. [PubMed] [Google Scholar]
- 38.Nilius B, Sehrer J, Heinke S, Droogmans G. Ca2+ release and activation of K+ and Cl− currents by extracellular ATP in distal nephron epithelial cells. Am J Physiol. 1995;269:C376–C384. doi: 10.1152/ajpcell.1995.269.2.C376. [DOI] [PubMed] [Google Scholar]
- 39.Planck SR, Huang XN, Robertson JE, Rosenbaum JT. Cytokine mRNA levels in rat ocular tissues after systemic endotoxin treatment. Invest Ophthalmol Vis Sci. 1994;35:924–930. [PubMed] [Google Scholar]
- 40.Proctor RA, Denlinger LC, Leventhal PS, Daugherty SK, van de Loo JW, Tanke T, Firestein GS, Bertics PJ. Protection of mice from endotoxic death by 2-methylthio-ATP. Proc Natl Acad Sci USA. 1994;91:6017–6020. doi: 10.1073/pnas.91.13.6017. [DOI] [PMC free article] [PubMed] [Google Scholar]
- 41.Quinn RH, Miller SS. Ion transport mechanisms in native human retinal pigment epithelium. Invest Ophthalmol Vis Sci. 1992;33:3513–3527. [PubMed] [Google Scholar]
- 42.Segawa Y, Hughes BA. Properties of the inwardly rectifying K+ conductance in the toad retinal pigment epithelium. J Physiol (Lond) 1994;476:41–53. [PMC free article] [PubMed] [Google Scholar]
- 43.Seidler NW, Jona I, Vegh M, Martonosi A. Cyclopiazonic acid is a specific inhibitor of the Ca2+-ATPase of sarcoplasmic reticulum. J Biol Chem. 1989;264:17816–17823. [PubMed] [Google Scholar]
- 44.Smith JJ, Welsh MJ. Fluid and electrolyte transport by cultured human airway epithelia. J Clin Invest. 1993;91:1590–1597. doi: 10.1172/JCI116365. [DOI] [PMC free article] [PubMed] [Google Scholar]
- 45.Stutts MJ, Fitz JG, Paradiso AM, Boucher RC. Multiple modes of regulation of airway epithelial chloride secretion by extracellular ATP. Am J Physiol. 1994;267:C1442–C1451. doi: 10.1152/ajpcell.1994.267.5.C1442. [DOI] [PubMed] [Google Scholar]
- 46.Stutts MJ, Lazarowski ER, Paradiso AM, Boucher RC. Activation of CFTR Cl conductance in polarized T84 cells by luminal extracellular ATP. Am J Physiol. 1995;268:C425–C433. doi: 10.1152/ajpcell.1995.268.2.C425. [DOI] [PubMed] [Google Scholar]
- 47.Van Scott MR, Chinet TC, Burnette AD, Paradiso AM. Purinergic regulation of ion transport across nonciliated bronchiolar epithelial (Clara) cells. Am J Physiol. 1995;269:L30–L37. doi: 10.1152/ajplung.1995.269.1.L30. [DOI] [PubMed] [Google Scholar]
- 48.Von Kugelgen I, Allgaier C, Schobert A, Starke K. Co-release of noradrenaline and ATP from cultured sympathetic neurons. Neuroscience. 1994;61:199–202. doi: 10.1016/0306-4522(94)90223-2. [DOI] [PubMed] [Google Scholar]
- 49.Zimmermann H. Signaling via ATP in the nervous system. Trends Neurosci. 1994;17:420–426. doi: 10.1016/0166-2236(94)90016-7. [DOI] [PubMed] [Google Scholar]


