Abstract
Protein kinase C (PKC) is a family of intracellular signal transduction enzymes, comprising isoforms that vary in sensitivity to calcium, arachidonic acid, and diacylglycerol. PKC isoforms α, γ, and δ are expressed by cerebellar Purkinje cells and neurons in the cerebellar nuclei and vestibular nuclei of the Long–Evans rat. In control rats, these PKCs are distributed symmetrically in the flocculonodular-lobe Purkinje cells. Behavioral recovery from vestibular dysfunction produced by unilateral labyrinthectomy (UL) is accompanied by asymmetric expression of PKC isoforms in these regions within 6 hr after UL. These expression changes were localized within parasagittal regions of the flocculus and nodulus. The distribution of PKCα, -γ, and -δ were identical, suggesting that they are coregulated in cerebellar Purkinje cells during this early compensatory period. The pattern of Purkinje cell PKC expression returned to the control, symmetric distribution within 24 hr after UL. It is hypothesized that these regional changes in Purkinje cell PKC expression are an early intracellular signal contributing to vestibular compensation. In particular, regulation of PKC expression may contribute to changes in the efficacy of cerebellar synaptic plasticity during the acute post-UL period.
Keywords: vestibular compensation, protein kinase C, cerebellum, labyrinthectomy, Purkinje cells, signal transduction proteins
Acute vestibular dysfunction produces vertigo, postural asymmetry and instability, nystagmus, tonic eye deviation, and autonomic manifestations. The resolution of these signs over a period of days to weeks is termed vestibular compensation. In the rat, compensation proceeds in three stages: (1) a critical phase (initial 12 hr), characterized by ipsilateral head deviation, spontaneous nystagmus, contralateral limb extension, severe ataxia, and transient bouts of spontaneous circling or rolling; (2) an acute phase (12 hr to several days postinjury), characterized by resolution spontaneous motor signs; and (3) a compensated phase, characterized by a slight residual head tilt and occasional ataxic episodes (Llinas and Walton, 1979; Smith and Curthoys, 1989).
Experimental studies implicate the vestibular nuclei, inferior olive and the cerebellar flocculonodular lobe, and posterior and anterior vermis in vestibular compensation (for review, see Llinas and Walton, 1979; Smith and Curthoys, 1989). Previous studies indicate that unilateral labyrinthectomy (UL) in rats produces an immediate asymmetry in neural activity and 2-deoxyglucose (2-DG) uptake in the vestibular nuclei, which resolves within 1 week (Precht et al., 1966; Llinas and Walton, 1979; Patrickson et al., 1985; Luyten et al., 1986). Further, c-fos expression is induced asymmetrically in the vestibular nuclei within 24 hr of UL in rats (Kaufman et al., 1992; Cirelli et al., 1993). These studies also reported increased 2-DG uptake ipsilaterally and decreased uptake contralaterally in the nodulus within 4 hr of UL in rats (Llinas and Walton, 1979; Patrickson et al., 1985; Luyten et al., 1986), which parallels induced c-fosmRNA expression (Cirelli et al., 1993). An important functional role of these structures is supported by reports that lesions of the flocculonodular, posterior, and anterior lobes retard vestibular compensation (Jeannerod et al., 1981; Courjon et al., 1982; Igarashi and Ishikawa, 1985), and that compensation is prevented by inferior olive ablation in rats (Llinas and Walton, 1979). Because the inferior olive defines cerebellar circuitry units via projections to both Purkinje cells zones and targets of those zones in the cerebellar/vestibular nuclei (Balaban, 1984, 1988; Ito 1984), it was hypothesized that altered expression of intracellular transduction proteins in specific zones may be a biochemical substrate for early stages of vestibular compensation.
There is little information regarding the role of intracellular signal transduction proteins in the cerebellum or vestibular nuclei during vestibular compensation. Previous studies have implicated a variety of neurotransmitter mechanisms in the process of vestibular compensation (Ishikawa and Igarashi 1985; Igarashi et al., 1988;Darlington and Smith, 1989, 1992; Darlington et al. 1991; Smith et al., 1991; Calza et al., 1992; Saika et al., 1993). Although changes in c-fos expression (Kaufman et al., 1992; Cirelli et al., 1993) have been reported in the cerebellum during vestibular compensation, the roles of other intracellular signaling pathways have not been eludicated. This study focuses on changes in regional expression of protein kinase C (PKC), a family of intracellular signaling proteins implicated in responses to neurotransmitters, hormones, and growth factors. Recent evidence suggests a role of PKC in cerebellar long-term depression (Crepel and Krupa, 1988; Linden and Connor, 1995). Because separate isoforms of PKC are affected differentially by calcium (Ca2+), diacylglycerol, and arachidonic acid, PKC may form an important conduit between second-messenger pathways and cellular responses (Ono et al., 1988; Azizi et al., 1992; Ogita et al., 1992). This study reports transient, region-specific changes in flocculonodular-lobe PKC expression during vestibular compensation.
MATERIALS AND METHODS
Surgical procedures for labyrinthectomies and sham operations. Either UL or sham operations were performed on 250–350 gm male Long–Evans rats (Charles River Laboratories, Wilmington, MA), with paired sets of sham and control operations performed on the same day. Rats were anesthetized with Innovar-Vet (fentanyl and droperidol, 1 ml/kg, i.m.). The bulla was exposed on one side by blunt dissection via a skin incision near the angle of the mandible, and a pediatric otic speculum was placed over the bone to maintain retraction of soft tissues. The ventral surface of the bulla was removed with a fine dental burr and microrongeurs to expose the middle ear cavity. In the UL group, the base of the cochlea was opened with a dental burr and small picks to expose the vestibule and the otolith organs, and semicircular canal cristae were ablated with a curette and aspiration. This procedure ablates the neuroepithelium, without involvement of the ossicular chain, tympanic membrane, internal acoustic canal, cochlear nerve, facial nerve, or Scarpa’s ganglion (Fig. 1). For the sham operations, the bony labyrinth was touched with either a fine burr or a small curette. The bulla was sealed with Gelfoam, and the wound was closed with sutures. Anesthesia was then reversed by administration of the opiate antagonist naloxone (0.4 mg/kg, i.m.). The UL rats displayed nystagmus (contralaterally directed quick phases), contralateral limb extension, and torsion of the head toward the lesioned side within 5 min of naloxone injection. Long-axis rotation (“barrel rotation”) was observed rarely within the early acute (1–2 hr) postoperative period.
Fig. 1.
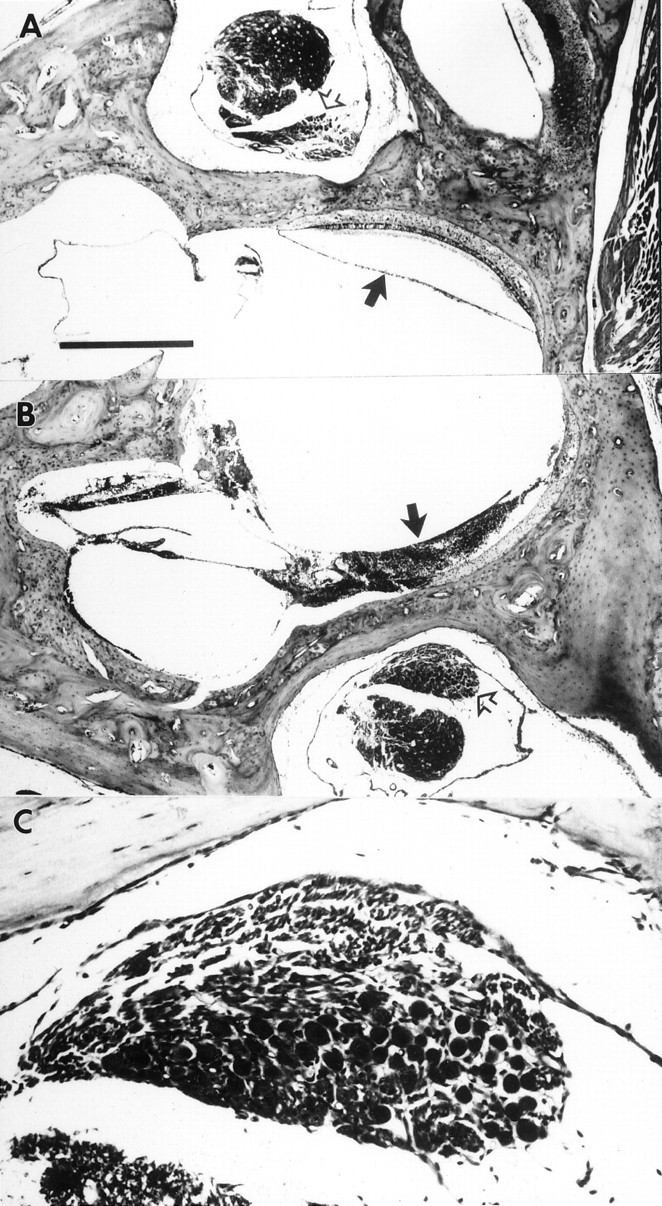
Histological verification of unilateral surgical labyrinthectomies. Photomicrographs of horizontal sections through the unoperated (A) and operated (B) ears of case 9311 are shown, with rostral toward the left. The medial aspect of the section is oriented upward inA and downward in B andC. Note the intact sacculus in A(black arrow) and the complete ablation of the sacculus on the operated side (B, black arrow).Open arrows show the unaffected Scarpa’s ganglia on both the unoperated (A) and operated (B) sides. The Scarpa’s ganglion from the operated side is shown at higher magnification in C. Scale bars: A,B, 500 μm; C, 100 μm.
An additional group of five rats was used to characterize the time course of the decline in spontaneous nystagmus after UL. Spontaneous nystagmus was recorded on videotape with a CCD camera (DAGE CCD-72) through an operating microscope under normal room illumination at 1 hr intervals from 1 to 6 hr, and at 24 and 48 hr after the operation. Fast phases of spontaneous nystagmus were counted in 20 sec periods (3–5 periods/animal/sampling time). The results of least-squares regression analysis [Marquardt–Levenberg algorithm, using MATLAB (MathWorks, Inc.) function, leastsq.m] indicated that the rate of spontaneous nystagmus can be regarded as a simple exponential decay of form:
| Equation 1 |
with a time constant (τ) of 9 hr and magnitude parameter (A) of 40 beats/20 sec (r = −0.89). This estimate is consistent with previous reports that describe the use of short-acting anesthetics in rats. For example, the mean data presented by Kitahara et al. (1995, their Fig. 1) from a study that used mechanical damage followed by a 100% ethanol injection in the labyrinth, show a time constant of 17 hr and a magnitude parameter of 28 beats/15 sec.
Western immunoblots. Six rats were used for each operative and survival time group for Western blot studies. After a survival time of 6 or 48 hr, rats were killed with pentobarbital (100 mg/kg, i.p.). The posterior lobe vermis was dissected rapidly and homogenized at 4°C in 50 mm Tris buffer, pH 7.5 containing 2 mm EDTA, 1 mm EGTA, 1 mm PMSF, 25 μg/ml leupeptin, 50 μl/ml aprotinin, and 0.33 msucrose. Membrane and soluble fractions were separated by centrifugation at 100,000 g for 30 min. Membrane and soluble fractions were normalized for protein content and added to a 200 mm TRIS buffer containing 4% SDS, 40% glycerol, 4% β-mercaptoethanol, and 0.004% bromphenol blue. The samples were boiled for 10 min at 90°C and cooled to room temperature. Membrane and cytosolic fractions were then loaded in proportionally equivalent amounts on a 9% SDS-PAGE and transferred to a nitrocellulose membrane. Immunodetection was performed using polyclonal antibodies recognizing PKC C isoforms α, γ, and δ (Life Technologies, Gaithersburg, MD), donkey anti-rabbit horseradish peroxidase-coupled secondary antibody (Jackson ImmunoResearch, West Grove, PA), and an enhanced chemiluminescence detection system (Amersham, Arlington Heights, IL or DuPont/NEN, Boston, MA) exposed to radiographic film (Fuji/Kodak). The intensity of the bands was determined by densitometry. All comparisons are based on these densitometric data.
Immunohistochemical methods. After survival times of 6 hr (sham, n = 8; UL, n = 7 rats), 24 hr (sham, n = 4; UL, n = 4 rats), 48 hr (sham, n = 3; UL, n = 4 rats), or 8 d (sham, n = 3; UL, n = 5 rats), Long–Evans rats were killed with a pentobarbital overdose (100 mg/kg, i.p.) and perfused transcardially with PBS, followed by a paraformaldehyde-lysine-sodium metaperiodate (PLP) fixative (McLean and Nakane, 1974). The brains were post-fixed for 2–4 d in 30% sucrose, 4% paraformaldehyde, and then sectioned at 40 μm on a frozen sliding microtome. Before immunohistochemical processing, the sections were stored at −20°C in a cryoprotection solution (300 gm sucrose and 300 ml ethylene glycol in PBS quantum satis to 1 l).
After rinsing in PBS, sections were incubated in a blocking solution [2% bovine serum albumin (BSA) and 0.1–0.4% 3-[(3-cholamidopropyl) dimethylammonio]-1-propanesulfonate (CHAPS) in PBS] for 4 hr, followed by a 48 hr incubation at 4°C in a solution containing a rabbit polyclonal antibody directed against PKCα, PKCγ, or PKCδ (Life Technologies) diluted 1:1000 in PBS containing 0.1–0.4% CHAPS and 2% BSA. For a nonspecific staining control, another set of sections was incubated with a primary rabbit polyclonal antibody directed against PKCλ (Life Technologies) diluted 1:1000 in PBS containing 0.1–0.4% CHAPS and 2% BSA, which produced no immunohistochemical staining of any cell types in the cerebellum. After rinsing in PBS, the sections were treated for 1 hr at room temperature with a solution containing biotinylated goat anti-rabbit IgG (Vector Laboratories, Burlingame, CA) diluted 1:250 in a solution of 2% BSA in PBS. The antibodies were then visualized by standard ABC methods (PBS rinse, incubation in Vectastain Elite ABC reagent for 1 hr) and a diaminobenzidine chromogen.
Histological verification of surgical labyrinthectomies.After removal of the brains, the perfusion-fixed temporal bones from the immunohistochemical studies were dissected from the skull, decalcified in 3 mm EDTA-1.35 N HCl and embedded in paraffin. The temporal bones from half of the UL animals were sectioned serially in the horizontal plane. Every tenth paraffin-embedded horizontal section (5–8 μm thickness) was stained with hematoxylin and eosin to verify damage to the neuroepithlium of the semicircular canal cristae and otolith organ macula and the sparing of Scarpa’s ganglion (Fig. 1) by the surgical procedure.
Analysis of pattern of expression in nodulus Purkinje cells.The nodulus distribution of immunopositive Purkinje cells was analyzed by constructing flat-mount views of the cortical surface from transverse sections. Images of every transverse section were acquired on a 486-based computer equipped with a Matrox IP-8/AT (Matrox Electronics Systems, Ltd., Dorval, Quebec, Canada) video processing board running the Optimas package (Version 4.02, Bioscan, Edmonds, WA) from an Olympus BH-2 microscope equipped with a Cohu CCD video camera. The Optimas image analysis software was used to record the distance along the Purkinje layer from midline of each immunopositive Purkinje cell in each folium from a set of every sixth section. Because climbing fiber inputs and outputs to the vestibular nuclei are ∼500 μm–1 mm wide, histograms of Purkinje cell densities were plotted in 250-μm-wide bins to detect banding perpendicular long axis of each folium. Microsoft Excel software was used to generate three-dimensional plots of the cell density data across regions of cerebellar cortex.
Repeated-measures ANOVA was used to test hypotheses regarding regionally specific changes in PKC expression by flocculonodular-lobe Purkinje cells. The dependent variable was the total number of PKCδ-immunopositive nodulus Purkinje cells ipsilateral and contralateral to the operated ear from a set of every sixth section through the cerebellum. For the nodulus, these counts were stratified further by distance from the midline, with separate tabulations for a medial region (0–0.5 mm from the midline), an intermediate region (0.5–1.5 mm lateral to the midline), and a lateral region (>1.5 mm lateral to the midline). Repeated-measures ANOVA [two within-group factors: laterality (ipsilateral vs contralateral) and distance from the midline; two between-group factors: treatment (UL vs sham operation) and survival time] and post hoc comparisons were performed with a standard statistical package (SYSTAT, Evanston, IL) on a PC. The analogous strategy for analysis of patterns of flocculus Purkinje cells is described in detail below.
RESULTS
Western immunoblot analyses
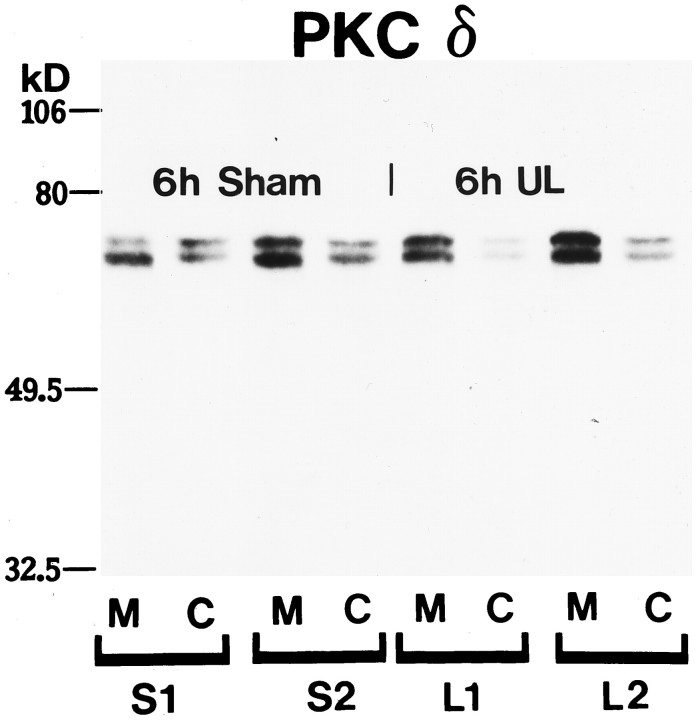
Western immunoblot analyses of PKC isoform expression revealed doublet bands at 74 and 76 kDa representing the two phosphorylation states of PKC; representative results for PKCδ in the cerebellar vermis are shown in Figure 2. Although individual variations in band density were apparent among sham-operated and unilaterally labyrinthectomized rats, there were no significant differences in either the migration distance or the cytosolic versus membrane-bound components of the PKC isoforms as a function of experimental treatment (UL vs sham operation) or survival time (6 or 48 hr). This finding indicates that there is no systematic change in phosphorylation state or significant post-translational modification of PKCs subsequent to UL. The data did suggest, however, a wide range in baseline PKC expression in the cerebella of both sham and operated rats. Thus, we suggest that (1) immunohistochemical reactions are recognizing the same proteins in UL and sham-operated rats, and (2) Western blots are consistent with a wide inter-animal variation in the total PKC expression in the cerebellum of the Long–Evans rat.
Fig. 2.
Western immunoblot of PKCδ from the cerebellar posterior lobe vermis of 6 hr post-sham-operated (S) and unilateral labyrinthectomy (UL) Long–Evans rats. PKCδ migrates as a 74 and 76 kDa doublet representing its two phosphorylation states. There are no changes in migration distances between sham and UL samples membrane (M) or cytoplasmic (C) fractions. This demonstrates antibody specificity and suggests that the electrophoretic motility of PKCδ does not change within 6 hr of labyrinthectomy. Reprobing of the blot showed no change in migration distances for PKCα or -γ. Molecular weight markers are shown to the left.
PKC immunoreactivity in cerebellar cortex
The cellular distribution of PKC immunoreactive cells in the cerebellum was generally consistent with previous reports on Sprague Dawley rats (Chen and Hillman, 1993). The reaction product for PKCδ was distributed homogeneously within the somata and dendrites of many Purkinje cells (Fig. 3A–C), and in the somata of band-like groups of presumptive interneurons in the molecular layer (Fig. 3A,B,open arrows); the absence of PKCδ-reactive Purkinje cells in the rostral-most folia of the anterior lobe (Chen and Hillman, 1993) was also confirmed. The distribution of immunoreactivity for PKCα was inhomogeneous within Purkinje cells and some molecular layer interneurons, consisting of a relatively dense perinuclear reaction and lighter somatodendritic immunoreactivity (Fig. 3D). The immunoreactivity for PKCα, -γ, and -δ rarely exceeded background levels in granule cells. The antibody directed against PKCλ produced no immunoreactivity in the cerebellum, which served as a control for nonspecific staining by the secondary antibody, avidin–peroxidase conjugate, and diaminobenzidine chromogen.
Fig. 3.
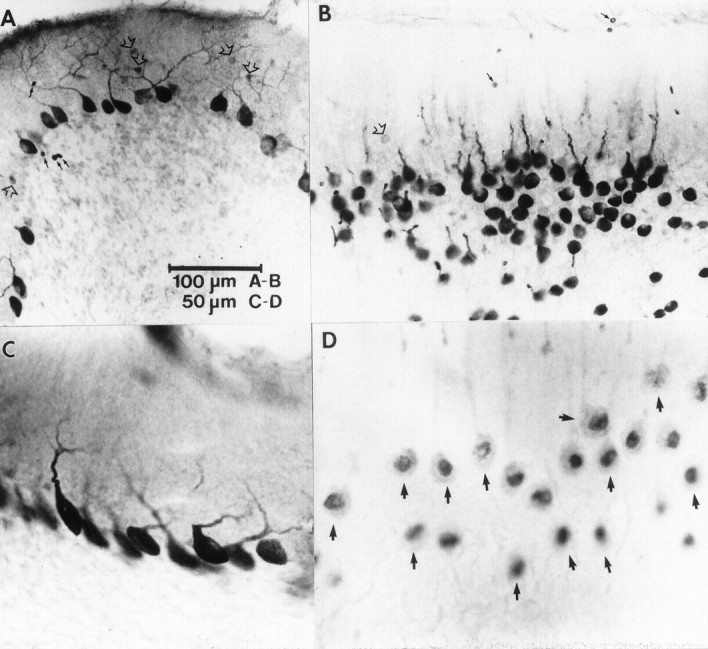
Cellular distribution of PKC immunoreactivity in the flocculus (A, C) and nodulus (B, D). A, PKCδ immunoreactivity in the flocculus was observed in somata and dendrites of many Purkinje cells and in somata of some molecular layer interneurons (open arrows). The immunopositive interneurons were observed in bands along the ventromedial and ventrolateral margins of the flocculus. Erythrocytes are indicated bysmall black arrows. B, PKCδ-immunopositive cells are shown in a tangential section through lobule Xa of the nodulus. Note the intense immunoreactivity of Purkinje cell somata and proximal dendrites. Weakly immunopositive molecular layer interneurons were observed rarely (open arrow).Small black arrows indicate erythrocytes.C, Higher magnification photomicrograph of somatodendritic staining of flocculus Purkinje cells from a band showing no immunopositive molecular layer interneurons.D, High magnification view of PKCα immunopositive Purkinje cells (arrows) from a tangential section through the Purkinje cell layer of lobule Xa. Note the intense immunoreactivity associated with the nuclear region and the weaker reaction in the somata and proximal dendrites.
Nodulus/uvula
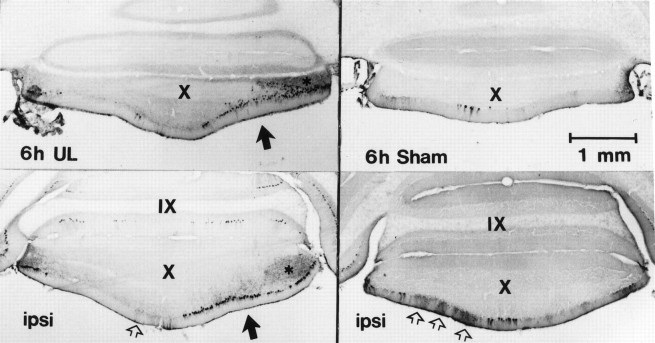
Purkinje cells with immunopositive reactions for PKCα, -δ, and -γ isoforms were distributed symmetrically in the flocculonodular lobe of sham-operated rats. Examples of the distribution of PKCδ immunopositive cells are illustrated for the nodulus (Fig.4) and flocculus (Fig. 8) from rats 6 hr after sham operations. For the sham-operated group, ANOVA of the total number of PKC-positive nodulus Purkinje cells ipsilateral and contralateral to the operated ear revealed no significant effect of either survival time (F(3,14) = 0.732; p > 0.05), laterality (ipsilateral or contralateral to the operation,F(1,14) = 3.248; p > 0.05), or the interaction between these factors (F(3,14) = 1.606; p > 0.05). These analyses indicate that PKC-positive Purkinje cells were distributed symmetrically in the nodulus across survival times (6 hr-8 d) in sham-operated rats.
Fig. 4.
Distribution of PKCδ expression in transverse sections through cerebellar lobules IX (uvula) and X (nodulus) 6 hr postoperatively. These photomicrographs at two comparable levels illustrate results from lobules IXc and Xa from a sham-operated (case 9330) and a UL (case 9329) rat. Expression in the cerebellar cortex was limited to Purkinje cell somata and dendrites, but not all Purkinje cells showed PKCδ immunoreactivity. Six hours after UL, PKCδ-positive Purkinje cells were distributed in a strikingly asymmetric pattern, with markedly increased expression in an intermediate band in the nodulus contralateral to the labyrinthectomy (solid arrows). By contrast, 6 hr after a sham operation, Purkinje cells expressing PKCδ were distributed in a more symmetric pattern across the nodulus and uvula, with relatively few immunopositive cells in the intermediate region. PKCδ-immunoreactivity in the granular layer (asterisks) and interneurons in the molecular layer (open arrows) showed no consistent patterns across animals. The pattern of PKCα and -γ immunopositive Purkinje cell somata was identical to the distribution of PKCδ immunoreactivity.
Fig. 8.
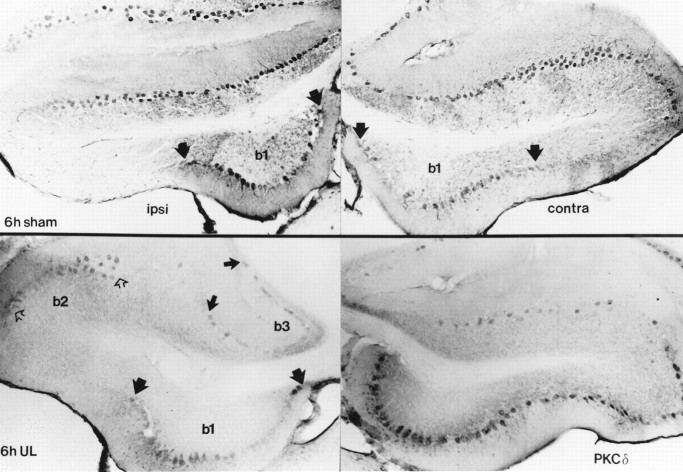
Distribution of PKCδ expression in sections through Long–Evans rat cerebellar flocculus. As in the nodulus and uvula, immunoreactivity is restricted to the Purkinje cells of the cerebellar cortex. The flocculus ipsilateral to the operation is shown on the left side and the contralateral flocculus is shown on the right side of the figure. Six hour, post-sham-operated rat flocculi (top panels) show a variable but consistently symmetric pattern of Purkinje cell immunoreactivity along the dorsal and ventromedial (b1, demarcated by wide black arrows) surfaces. Six hour, post-UL flocculi (lower panels) show the ventromedial distribution of expression as in the sham, with the appearance of bands of expression along the lateral crest of the ipsilateral flocculus (b2, open arrows) and the border with paraflocculus (b3, narrow black arrows). The contralateral flocculus shows a broader area of distribution than ipsilaterally, with expression between areas b1 andb2, and b2 and the lateral margin of b3. Contralaterally, areab3 shows only a sparse distribution of immunoreactive Purkinje cells. Immunoreactivity for PKCα and -γ shows an identical distribution.
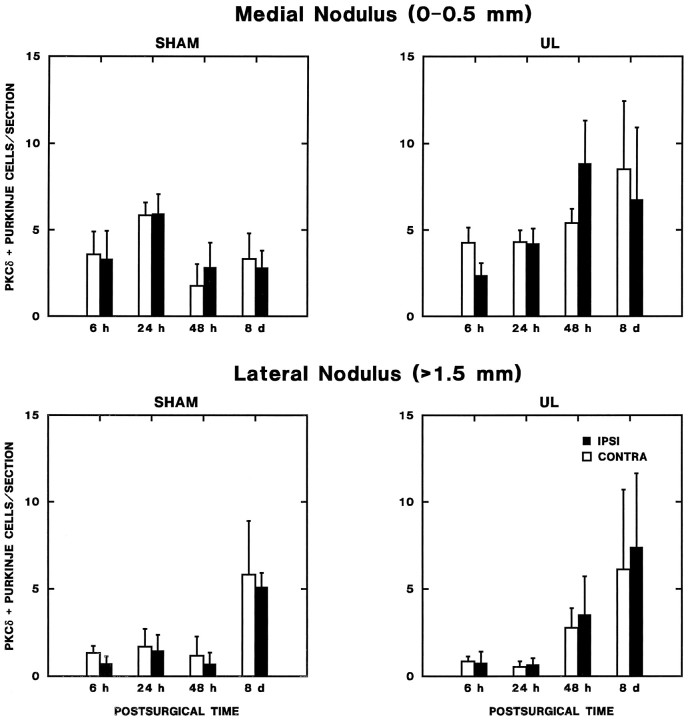
By contrast, there was a distinct, asymmetric distribution of Purkinje cells expressing the three PKC isoforms across cerebellar lobules Xa (nodulus) and IXc (uvula) within 6 hr after UL (Fig. 4 illustrates results for PKCδ). This result is represented quantitatively in Figure 5, which compares the patterns of PKCδ-immunoreactive Purkinje cells on flattened surface maps of the Purkinje layer from cerebellar lobules VIII–X. The distribution of PKCα, PKCγ-, and PKC-δ-positive Purkinje cells was identical in all UL animals. It was noteworthy that, as suggested by the Western blot analyses, there were inter-animal variations in the total number of PKC-immunopositive Purkinje cells in the nodulus (caudal lobule Xb-lobule Xa) of both sham and UL rats. Repeated-measures ANOVA [within-subjects factors: laterality (ipsilateral or contralateral to operation) and distance of PKCδ-immunopositive Purkinje cells from the midline (0–0.5 mm, >0.5–1.5 mm, >1.5 mm); between-subjects factors: treatment (UL or sham) and survival time (6, 24, and 48 hr, and 8 d)] and Newman–Keuls tests (Winer, 1971) revealed that there was a transient, asymmetric change in the distribution of PKC-immunopositive Purkinje cells in an intermediate zone of the cerebellar nodulus within 6 hr of UL. The results of these analyses are summarized as follows (Figs. 6,7).
Fig. 5.

Density histograms of PKCδ immunoreactive Purkinje cells across the rat nodulus and uvula. These data were obtained from every sixth section through these regions. Folia of the nodulus and uvula are indicated along the x-axis. The midline of the cerebellar cortex is indicated with a “0” along they-axis. Positive distances represent millimeters from the midline contralateral to the side of operation and negative values the ipsilateral side. The vertical axis represents immunoreactive Purkinje cell counts in 250 μm increments. Each histogram represents a different rat; the case number is given on each histogram. Density histograms of 6 hr post-sham-operation show a symmetric distribution of immunoreactive Purkinje cells near the midline that is consistent between rat cerebella and levels of PKC expression. In 6 hr post-UL rat cerebella, the distribution was asymmetric in all rats.
Fig. 6.
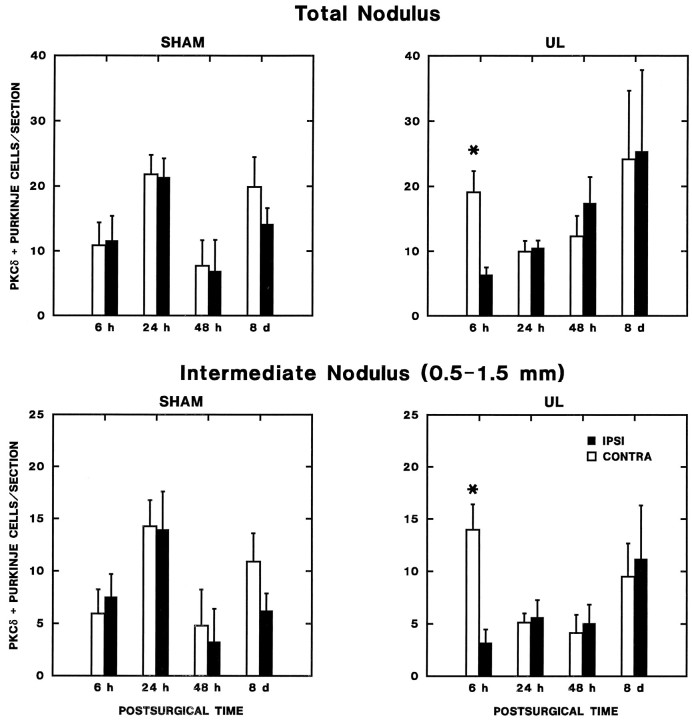
Zonal changes in lobule Xa (nodulus) PKCδ expression during vestibular compensation. The number of PKCδ-immunopositive Purkinje cells per section from every sixth section through the lobule Xa of the nodulus ipsilateral and contralateral to operations is plotted as a function of postoperative time. Separate graphs are shown for the entire nodulus (total nodulus, top panels) and for the intermediate zone (0.5–1 mm lateral to the midline, lower panels). Results of repeated-measures ANOVA and post hoc comparisons are presented in the text. The asterisks indicate a significant elevation in PKC expression on the side contralateral to the operation in the 6 hr UL rats (Newman–Keuls test;p < 0.05 vs ipsilateral side and sham-operated controls at 6 hr).
Fig. 7.
Zonal changes in lobule Xa (nodulus) PKCδ expression during vestibular compensation. The number of PKCδ-immunopositive Purkinje cells per section from every sixth section through the lobule Xa of the nodulus ipsilateral and contralateral to operations is plotted as a function of postoperative time. Separate graphs are shown for the medial nodulus (0–0.5 mm from the midline) and the lateral nodulus (>1.5 mm from the midline). No significant effects were observed in the medial nodulus. In the lateral nodulus, there was a bilaterally symmetric increase in the number of PKC-immunopositive Purkinje cells in both sham and UL groups on the eighth postoperative day (see text).
(1) There is a transient asymmetry in nodulus PKC expression within 6 hr of UL. Analysis of the total number of immunopositive Purkinje cells ipsilateral and contralateral to the operated ear revealed a significant two-way interaction effect for laterality × survival time (F(3,30) = 4.142; p < 0.05) and a significant three-way interaction for laterality × survival time × operation type (F(3,30) = 7.956; p < 0.01). These significant interaction effects can be attributed strictly to the 6 hr survival time, which displayed a highly significant main effect for laterality (F(1,13) = 13.352; p < 0.01) and laterality × operation-type interaction effect (F(1,13) = 16.203; p < 0.01); no significant effects were present for either 24 or 48 hr, or 8 d survival groups. Newman–Keuls tests of the data from the 6 hr survival groups demonstrated that these significant interaction effects reflected a significant increase in the number of immunopositive cells contralateral to the lesion (p < 0.01) versus the side ipsilateral to the lesion and both sides of the sham-operated controls.
(2) The transient asymmetry in nodulus PKC expression within 6 hr of UL is restricted to an intermedate zone 0.5–1.5 mm lateral to the midline. ANOVA of the Purkinje cell distribution by sagittal zone indicated that significant changes in the symmetry of Purkinje cell PKC expression were restricted to an intermediate zone (between 0.5 and 1.5 mm from the midline) of the nodulus. Significant two-way laterality × survival time (F(3,30) = 2.977; p < 0.05) and three-way laterality × survival time × operation type (F(3,30) = 9.267; p < 0.01) were present only for the Purkinje cells in this intermediate region (Fig. 6); these interaction effects were not significant for the distribution of immunopositive Purkinje cells in either medial (0–0.5 mm from the midline) or lateral (>1.5 mm from the midline) nodulus zones (Fig. 7). When the data from each survival time were analyzed separately, only the intermediate zone (0.5–1.5 mm lateral to the midline) from the 6 hr survival groups revealed either a significant main effect of laterality (F(1,13) = 10.896; p < 0.01) and a significant laterality × operation-type interaction effect (F(1,13) = 18.622; p < 0.01). These effects were absent for other survival times and other nodulus zones.
(3) The change in nodulus intermediate-zone PKC expression reflects a transient increase in the number of immunopositive Purkinje cells contralateral to the lesion within 6 hr of UL. Newman–Keuls comparisons of the cell counts in the intermediate zone in the 6 hr UL and sham groups indicated that three findings produced the significant interaction effects in ANOVA. First, there was no significant difference between the two sides of the sham-operated animals. Second, there was a highly significant increase in the number of PKC-positive neurons contralateral to the UL, compared with either the side ipsilateral to the UL or with either side of the sham-operated animals (p < 0.01). Finally, there was no significant difference between the number of PKC-positive Purkinje cells on the side ipsilateral to the UL and either side of the sham-operated group. As described above, the symmetric distribution was restored within 24 hr of UL.
A second zonal effect on PKC expression was observed symmetrically in the lateral zone (>1.5 mm from the midline) of the nodulus (Fig. 7). ANOVA revealed a significant effect of survival time on the number of immunopositive Purkinje cells in this region (F(3,30) = 4.602; p < 0.01), which reflected a parallel, symmetric increase in expression in both the UL and sham-operated 8 d survival groups. Because it was identical in both sham-operated control and UL rats, this regional increase in expression is likely to reflect features of recovery from surgical trauma (and anesthesia) that are unrelated to vestibular compensation.
Flocculus
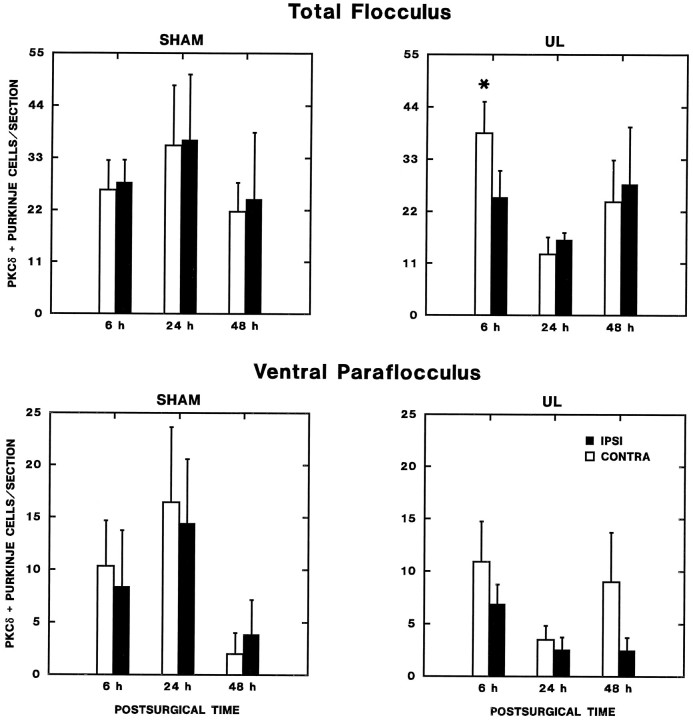
Within 6 hr after UL, a characteristic asymmetric distribution of PKCα, -δ, and -γ expression was observed in the ipsilateral and contralateral cerebellar flocculus. The distribution of immunoreactive flocculus Purkinje cells after UL was virtually identical for the three PKC isoforms examined. Figure 8 compares the distribution of PKCδ in transverse sections through the middle of the ipsilateral and contralateral flocculi of 6 hr sham-operated and UL rats. Figure 9 shows the distribution of PKCγ-immunoreactive Purkinje cell somata in a series of transverse sections through the ipsilateral and contralateral flocculi of a 6 hr UL rat. In the sham-operated rats (Fig. 8), immunoreactive Purkinje cells were distributed symmetrically in the ipsilateral and contralateral flocculi, where they spanned the dorsal surface of the flocculus and the medial third of the ventral surface. By contrast, immunoreactive Purkinje cells were distributed asymmetrically in the ipsilateral and contralateral flocculi within 6 hr of UL in patterns that differed from the sham-operated rats. Both the intensity of immunoreactivity and the number of immunopositive Purkinje cells were greater qualitatively on the side contralateral to the labyrinthectomy (Fig. 9). Repeated-measures ANOVA confirmed that there is a statistically significant, transient increase in the number of PKC-immunoreactive Purkinje cells (PKCδ) in the flocculus contralateral to the unilateral labyrinthectomy, and that there were no concurrent changes in the number of PKC-immunopositive Purkinje cells in either the flocculus of the sham-operated rats or the ventral paraflocculus (Fig. 10). The results of these analyses are summarized as follows.
Fig. 9.
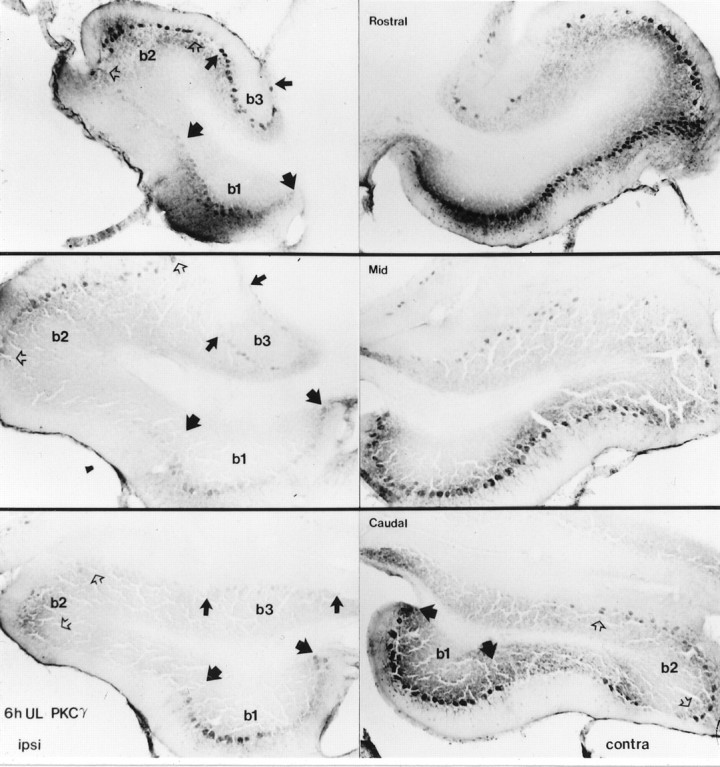
Rostrocaudal distribution of PKCγ expression in the Long–Evans rat flocculus. The symmetric banding along the dorsal and ventromedial (b1, demarcated by wide black arrows) floccular surfaces in the 6 hr sham-operated rat runs caudorostrally. In the 6 hr post-UL flocculi, the broader contralateral banding between b1 and b2 (demarcated byopen arrows), and b2 and the lateral margin of b3 (demarcated by narrow black arrows) runs to merge on the dorsal surface of the rostral pole. The sparser band of immunoreactivity in contralateralb3 also runs caudorostrally. PKCα and -δ show the same distribution of expression.
Fig. 10.
Changes in flocculus and ventral paraflocculus Purkinje cell PKCδ expression. The number of PKCδ-immunopositive Purkinje cells per section (from every sixth section through the flocculus and ventral paraflocculus) ipsilateral and contralateral to operations is plotted as a function of postoperative time. Separate graphs are shown for the total flocculus (top panels) and ventral paraflocculus. In the flocculus, there was a statistically significant increase in PKC expression contralateral to the lesion in the 6 hr UL group (Newman–Keuls test; p < 0.01 compared with the ipsilateral side and both sides of the 6 hr sham-operated group). No significant effects were observed in the ventral paraflocculus.
(1) There is a transient asymmetry in flocculus PKC expression 6 hr after UL. Analysis of the total number of immunopositive Purkinje cells ipsilateral and contralateral to the operated ear revealed a significant two-way interaction effect for laterality × survival time (F(2,18) = 3.92; p < 0.05) and a significant three-way interaction for laterality × survival time × operation type (F(2,18) = 3.597;p < 0.05). These significant interaction effects can be attributed strictly to the 6 hr survival groups, in which analyses of the UL and sham-operated groups displayed a highly significant main effect for laterality (F(1,9) = 13.07;p < 0.01) and laterality × operation-type interaction effect (F(1,9) = 21.21;p < 0.01); no significant effects were present for either 24 or 48 hr survival groups. Newman–Keuls tests (based on the mean squared error term for the interaction effects; Winer, 1971) demonstrated that these significant interaction effects in the 6 hr UL group reflected a significant increase in the number of immunopositive cells contralateral to the lesion (p < 0.01) versus the side ipsilateral to the lesion and both sides of the sham-operated controls; there was no significant difference among the latter three regions.
(2) There were no significant differences as a function of either laterality or operation type at other survival times.
(3) No significant effects of laterality, operation type, or survival time were present in the ventral paraflocculus.
Both qualitative observations (Figs. 8,9) and quantitative analyses (Fig. 11) indicated that the transient changes in flocculus PKC expression were not distributed uniformly within the flocculus. On the side ipsilateral to the lesion, the distribution of PKC-positive Purkinje cell somata on the ventral surface of the flocculus was virtually identical to that of the sham-operated rats, occupying a band along the ventromedial margin of the flocculus (b1). In contrast to the continuous distribution of PKC-positive Purkinje cells on the dorsal and lateral aspects of the flocculus in the sham-operated animals, however, the UL animals displayed two bands of labeled Purkinje cells in the ipsilateral flocculus, one along the lateral crest of the flocculus (b2), and the other along its border with the ventral paraflocculus (b3). These bands seemed to merge on the dorsal surface of the rostral pole of the flocculus. The contralateral flocculus in the UL rats, however, also displayed immunoreactive Purkinje cells over a broader area of the flocculus, including both the regions designated b1 and b2 on the ipsilateral side, and including most of the area between b1 and b2 and between b2 and the lateral margin of b3. By contrast, the region labeled b3 on the ipsilateral side contained only a sparse population of immunoreactive Purkinje cells contralaterally. The identical pattern appeared for PKCδ, -γ, and -α. Within 24 hr after surgical procedures, no differences were detected in the symmetric distributions of PKC-positive Purkinje cells in flocculi of sham-operated and UL rats.
Fig. 11.
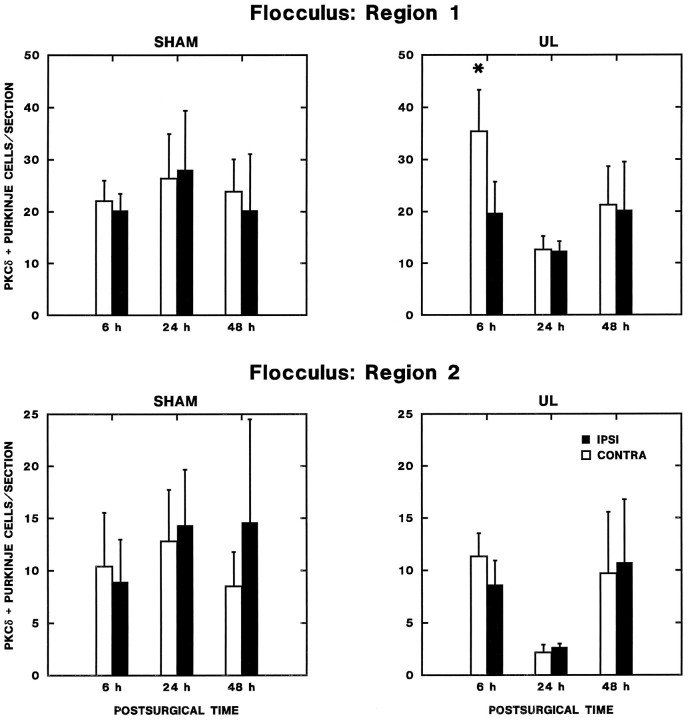
Transient regional changes in flocculus Purkinje cell expression of PKCδ. The number of PKCδ-immunopositive Purkinje cells per section from every sixth section through the intermediate aspect of flocculus is plotted as a function of postoperative time. Increased expression was observed contralaterally 6 hr after UL (Newman–Keuls test; p < 0.01) in region 1, which included the entire ventral surface and intermediate third of the dorsal surface of the nodulus. No significant effects were observed in region 2, the lateral and medial thirds of the dorsal surface of the flocculus.
These qualitative observations were confirmed by quantitative analyses. On the basis of the zonal organization of olivoflocculus projections described by Ruigrok et al. (1992), the flocculus and ventral paraflocculus were divided into three rostrocaudal regions: (1) caudal (25%), which receives climbing fiber input predominantly from the rostral pole of the medial accessory olive and the ventrolateral outgrowth of the principal olive; (2) rostral (25%), which receives climbing fiber input predominantly from the ventrolateral outgrowth and ventral leaf of the principal olive (with a small contribution at the rostral pole of the flocculus from the dorsal cap); and (3) the intermediate flocculus (central 50%), which receives climbing fiber inputs predominantly from the dorsal cap (with a projection from the ventral leaf of the principal olive to the lateral aspect of the ventral paraflocculus). Transverse sections at each level were then divided into eight regions for further analysis: (1) medial third of the ventral surface of the flocculus (corresponding to region b1 in Figs. 7,8), (2) intermediate aspect of the ventral surface (extending to a line perpendicular to the mediolateral axis of the flocculus white matter at the lateral margin of the white matter), (3) lateral aspect of the ventral folium (extending to the lateral crest of the flocculus), (4) lateral aspect of the dorsal folium, (5) intermediate aspect of the dorsal folium, (6) medial aspect of the dorsal flocculus folium (ending in the center of the posterolateral fissure), (7) medial half of the ventral paraflocculus, and (8) lateral half of the ventral paraflocculus. Repeated-measures ANOVA of the number of PKCδ-immunopositive cells per section revealed that there was transient, regionally specific change in expression in the flocculus (Fig. 11).
(1) The asymmetry in the number of PKC-immunopositive flocculus Purkinje cells 6 hr of UL is not distributed uniformly within the Purkinje cell layer. ANOVA of the number of immunoreactive Purkinje cells in each flocculus region (regions 1–6 above) from the 6 hr labyrinthectomy and sham-operated groups revealed a significant main effect of laterality (F(1,5) = 7.08;p < 0.05) and three significant interaction effects that suggest that effects vary as a function of the operation type, rostrocaudal level, and region within each level: (a) laterality × operation-type interaction (F(1,5) = 8.471;p < 0.05), which indicates that the laterality effect varies with operation type; (b) rostrocaudal level × region interaction effect (F(8,40) = 2.9,p < 0.05), which indicates that the the number of immunopositive Purkinje cells in each region varies with the rostrocaudal level of the sections; (c) laterality × operation type × rostrocaudal level × region interaction (F(8,40) = 2.49; p < 0.05), which is consistent with laterality effects restricted to particular operation type, rostrocaudal levels, and regions of the flocculus.
(2) The asymmetry in PKC expression appeared only at intermediate levels of the flocculus. Repeated-measures ANOVA for data from each rostrocaudal level revealed that only intermediate levels of the flocculus displayed either a significant main effect of laterality (F(1,9) = 15.98; p < 0.01) or a significant laterality × operation-type interaction effect (F(1,9) = 9.67; p < 0.05). These results reflected two findings at intermediate levels of the flocculus: a highly significant elevation in the number of immunoreactive Purkinje cells contralateral to the operated ear in the unilateral labyrinthectomy group (F(1,5) = 28.6;p < 0.01) and no significant asymmetry in the distribution of immunopositive Purkinje cells in the sham-operated group (F(1,4) = 0.35; NS).
(3) The asymmetric distribution PKC-immunopositive Purkinje cells at intermediate levels of the flocculus was transient in UL rats. Separate analyses were used for data at each survival time to test the hypothesis that the asymmetric distribution of PKC-positive Purkinje cells at intermediate flocculus levels in UL rats was restricted to the 6 hr group. Repeated-measures ANOVA of data from rats 24 and 48 hr after the operation showed no significant main effects of either the type of operation (UL or sham) or laterality (ipsilateral or contralateral to the operation). The interaction effect was also not significant at either time.
(4) Six hours after UL, the number of PKC-immunopositive Purkinje cells is increased in a region spanning the ventral surface and intermediate third of the dorsal surface of the flocculus. Repeated-measures ANOVA indicated that the significant laterality effect 6 hr after UL reflected an increase in the number of PKC-immunopositive Purkinje cells along the ventral surface and the intermediate third of the dorsal surface of the flocculus (F(1,5) = 24.10;p < 0.01), with no significant difference between the ipsilateral and contralateral sides in medial and lateral aspects of the dorsal surface of the flocculus (F(1,5) = 1.43; NS). For further analysis, the former region was termed region 1 and the latter area region 2. In the 6 hr sham-operated group, there were no significant laterality effects in either region 1 (F(1,4) = 0.31; NS) or region 2 (F(1,4) = 0.29; NS).
(5) The asymmetric expression of PKC in region 1 of intermediate levels of the flocculus is transient. The number of PKCδ-immunopositive Purkinje cells per section in region 1 (ventral surface and intermediate aspect of the dorsal surface) and region 2 (lateral and medial aspects of the dorsal surface) of the flocculus were used as dependent variables to test the hypothesis that the changes in region 1 PKC expression are transient. Repeated-measures ANOVA of the region 1 data from both operation types and three survival times revealed a significant main effect of laterality (F(1,18) = 5.799; p < 0.05), a significant laterality × survival time interaction (F(2,18) = 4.327;p < 0.05) and a marginal three-way laterality × survival time × operation type (F(3,18) = 3.526; p = 0.051) interaction effect. Two lines of evidence indicated that these effects in region 1 can be attributed to the transient increase in PKC expression contralateral to the lesion in the 6 hr UL group. First, separate analysis of the UL groups revealed a significant main effect of laterality (F(1,10) = 6.39; p < 0.05) and a significant laterality × survival time interaction effect (F(2,10) = 6.09; p < 0.05). No significant main effects (laterality, survival time) or interaction effects were observed in parallel analyses of the sham-operated rats. Second, in separate comparisons of the effects of operation type at each survival time, a significant main effect of laterality (F(1,9) = 18.72; p < 0.01) and laterality × operation-type interaction effect (F(1,9) = 11.80; p < 0.01) were present in analyses for the 6 hr postoperative groups. No significant main effects (operation type, laterality) or interactions were observed at the other survival times. There were no significant main effects or interaction effects in parallel analyses of region 2.
(6) No significant effects of laterality, operation type, or survival time were present in the ventral paraflocculus at intermediate levels.
Thus, the data indicate that there is a transient increase in the number of PKC-immunopositive Purkinje cells in an intermediate region of the flocculus within 6 hr after UL, which resolves within 24 hr after the operation. No corresponding changes are observed in other regions of the flocculus in UL rats or in sham-operated controls.
DISCUSSION
This study has demonstrated transient changes in the distribution of PKC-positive flocculonodular-lobe Purkinje cells after unilateral labyrinthectomy. Regionally selective increases in PKC-immunopositive flocculonodular-lobe Purkinje cells were observed contralateral to the lesioned ear within 6 hr after labyrinthectomy, and this change reverted to a symmetric distribution within 24 hr after labyrinthectomy. These changes in PKC expression are correlated temporally with early behavioral manifestations of vestibular compensation and changes in electrophysiological and metabolic activity of neurons in central vestibular pathways. Because the time constant for the disappearance of spontaneous nystagmus is 9 hr in UL rats under these experimental conditions (see Materials and Methods), these cerebellar PKC expression changes are concurrent with the period of resolution of spontaneous nystagmus. Electrophysiological and 2-DG utilization evidence indicates that UL results in an immediate asymmetry in activity and glucose consumption in the vestibular nuclei, which resolves to symmetric activity during the first postoperative week (Precht et al., 1966; Llinas and Walton, 1979; Patrickson et al., 1985; Luyten et al., 1986). Although data on zonal distribution of 2-DG utilization have not been reported, the changes in PKC expression are opposite the pattern of 2-DG utilization during the acute post-UL period (4–6 hr postoperative): nodulus PKC expression increases and 2-DG uptake decreases contralateral to UL (Patrickson et al., 1985), whereas PKC expression is reduced and 2-DG uptake increased ipsilateral to the lesion. It is unclear whether the PKC changes are responses to metabolic or activity changes, a cause of these changes, or an unrelated, temporally coincident phenomenon. It is important to note, however, that the demonstration of transient, lateralized changes in Purkinje cell PKC expression implies that both asymmetric and bilaterally symmetric patterns of PKC expression may be produced by a common set of underlying processes.
Changes in PKC expression patterns displayed three features. First, there was a transient increase in the number of PKC-immunopositive Purkinje cells in the intermediate zone of the nodulus and region 1 at intermediate levels of the flocculus on the side contralateral to peripheral vestibular damage within 6 hr of UL. This response reverted to bilateral symmetry (the sham-operated control pattern) within 24 hr after UL. Second, the number and distribution of PKC-immunopositive Purkinje cells were localized to specific regions within the flocculonodular lobe. In addition to the spatially restricted, early increase in PKC-immunopositive Purkinje cells in the contralateral flocculonodular lobe, a symmetric increase in PKC expression was observed in the lateral zone of the nodulus in both UL and sham-operated groups on postoperative day 8. Finally, the transient changes in PKC expression were absent in other cerebellar regions (e.g., ventral paraflocculus, posterior lobe vermis, anterior lobe, and cerebellar hemispheres). Because Purkinje cells do not receive direct, primary vestibular afferents, it is highly unlikely that the 6 hr post-UL effects are a direct response to an injured or degenerating primary afferents.
Several neural mechanisms may potentially contribute to regionally specific, transient changes in Purkinje cell PKC expression during the first 6 hr after UL (Fig. 12). The prominent parasagittal component of flocculonodular-lobe PKC expression changes suggests the hypothesis that dynamic regulation of Purkinje cell PKC expression is mediated by parasagittal neural circuitry components. Anatomic and physiological evidence has revealed two major parasagittal components of flocculonodular lobe Purkinje cell circuitry: climbing fiber projections and efferent projections from Purkinje cells to the vestibular nuclei (Brodal and Kawamura, 1980; Balaban, 1984, 1988; Ito, 1984). The relatively rapid, post-UL changes in flocculus PKC expression are centered in the portion of the olivary projection zone termed FE, which receives input from the caudal dorsal cap (Ruigrok et al., 1992). It is notable that PKC expression changes were absent in the adjacent ventral paraflocculus, which contains the part of zone FE that receives input from the rostral dorsal cap. Anatomical evidence from the rat (Bernard, 1987) and rabbit (Balaban and Henry, 1988; Katayama and Nisimaru, 1988; Tan et al., 1995) suggests that the intermediate part of the nodulus receives climbing fiber input predominantly from the dorsal cap and ventrolateral outgrowth. Dorsal cap neurons are activated by the retinal slip stimulation (Leonard et al., 1988), implying that early changes in flocculonodular-lobe PKC expression may represent local intracellular responses to changes in climbing fiber activity that reflect spontaneous nystagmus during the initial hours after UL. The asymmetry of the PKC response may reflect monocular, directionally selective visual inputs to caudal dorsal cap neurons, which respond with excitation during temporal-to-nasal horizontal retinal slip stimulation and with inhibition to nasal-to-temporal stimulation of the contralateral eye (Leonard et al., 1988). Because climbing fiber projections are crossed, retinal slip during slow phases of spontaneous nystagmus would produce an excitatory response in caudal dorsal cap climbing fibers within the ipsilateral flocculonodular lobe and an inhibitory response in climbing fibers innervating the contralateral flocculonodular lobe. This line of reasoning implies that PKC upregulation may reflect decreased climbing fiber activity. The potential role of climbing fibers in regulation of PKC expression parallels the apparent transsynaptic regulation of Purkinje cell expression of Ca2+/calmodulin-dependent cyclic nucleotide phosphodiesterase by climbing fibers (Balaban et al., 1989).
Fig. 12.
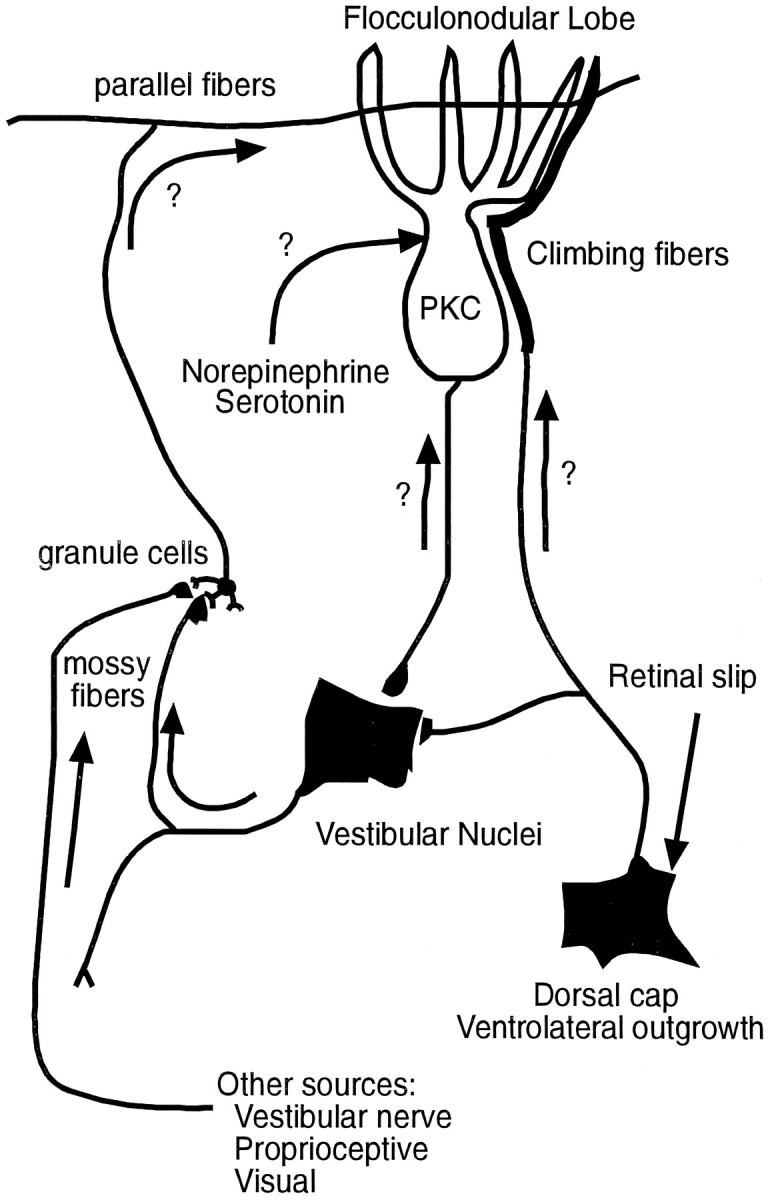
Schematic diagram of neural circuits that may influence PKC expression during vestibular compensation. Two potential substrates for the parasagittal distribution of increased PKC expression in the flocculonodular lobe are (1) an anterograde influence of climbing fiber projections from the dorsal cap and ventrolateral outgrowth and (2) a retrograde influence via zonal projections of Purkinje cells to the vestibular nuclei. A contribution of mossy fiber–granule cell-parallel fiber and monoaminergic projections, however, cannot be excluded.
The second parasagittal component of flocculonodular lobe circuits is defined by zonal efferent projections to the ipsilateral vestibular nuclei. The early PKC changes in the flocculus are centered in a zone that projects to the medial vestibular nucleus (Balaban, 1984; Ito, 1984), whereas the intermediate nodulus projects to the superior and medial vestibular nuclei (Balaban, 1984; Shojaku et al., 1987). Electrophysiological studies of medial vestibular nucleus neurons after acute labyrinthectomy have reported reduced resting activity ipsilateral and increased resting activity contralateral to the lesion (for review, Smith and Curthoys, 1989). A similar pattern of 2-DG uptake has been reported within a few hours of labyrinthine damage, with increased uptake in the contralateral medial vestibular nucleus (Patrickson et al., 1985) and decreased uptake ipsilaterally (Llinas et al., 1979; Patrickson et al., 1985; Luyten et al., 1986). Given the existence of presynaptic receptors and retrograde transport mechanisms, it is possible that the sagittal distribution of changes in Purkinje cell PKC expression reflects a retrograde influence of vestibular nucleus activity such that elevated activity in the contralateral vestibular nuclei induces an upregulation of PKC expression in presynaptic Purkinje cells. Because the asymmetric changes in PKC expression did not seem to be uniform within an entire parasagittal band in the flocculus or nodulus, however, a contribution of mossy fiber–granule cell-parallel fiber pathways, monoaminergic afferents, or intracerebellar interneurons to these responses cannot be excluded.
It is noteworthy that transient, asymmetric changes in Purkinje cell PKCα, -δ, and -γ expression were distributed within sagittal regions of the flocculonodular lobe, a region related to control of vestibulo-ocular reflexes, but were absent in the anterior vermis, a region related to postural control. Previous studies have reported that lesions of the flocculonodular lobe produce spontaneous nystagmus and impair compensation of the symmetry of vestibulo-ocular reflexes after UL (Llinas and Walton, 1979; Jeannerod et al., 1981; Courjon et al., 1982; Igarashi and Ishikawa, 1985; Smith and Curthoys, 1989). The location of changes in Purkinje cell PKC expression suggests further that these intracellular signal transduction substrates are regulated within distinct cerebellar circuits that influence vestibular reflexes. For example, the zonal asymmetries in flocculus PKC expression 6 hr after UL suggest an association with a region that receives horizontal retinal slip-climbing fiber input, projects to the medial vestibular nucleus, and modulates horizontal vestibulo-ocular reflexes (Ito, 1985;Leonard et al., 1988). In the cerebellum, PKC seems to be an important mediator of long-term depression of parallel fiber EPSPs by climbing-fiber activation (Linden and Connor, 1995). Of particular importance is the observation that PKC activation both depresses parallel fiber EPSPs (Crepel and Krupa, 1988; Boxall et al., 1995) and occludes the production of long-term depression of parallel-fiber EPSPs by climbing fiber activation (Boxall et al., 1995). Although long-term depression of Purkinje cell responses was reported in mutant mice deficient in PKCγ, the significant reduction in this response by intracellular injections of a PKC inhibitor (Chen et al., 1995) is consistent with a role of multiple PKC isoforms in the induction of long-term depression. The observation of parallel changes in Purkinje cell expression of calcium-sensitive (PKCα and -γ) and calcium-insensitive (PKCδ) forms of PKC within 6 hr of labyrinthectomy is consistent with this perspective. Thus, regional changes in Purkinje cell PKC expression may be an early intracellular signal contributing to vestibular compensation. It is suggested that regulation of PKC expression may facilitate synaptic plasticity by adjusting the efficacy of biochemical responses of Purkinje cells to intracellular fluxes in calcium, arachidonic acid, and diacylglycerol during the acute post-UL period.
Footnotes
This work was supported by National Institutes of Health (National Institute on Deafness and Other Communication Disorders) Grant R01 DC02556 (C.D.B.), a Howard Hughes Medical Institute Medical Student Research Training Fellowship (M.M.G.), and The William Randolph Hearst Otological Research Fellowship, Deafness Research Foundation (M.M.G.). We thank Gloria Limetti, Maria Freilino, and Steve Slezak for expert technical and histological assistance.
Correspondence should be addressed to Dr. Carey D. Balaban, Department of Otolaryngology, University of Pittsburgh, The Eye and Ear Institute of Pittsburgh, 203 Lothrop Street, Pittsburgh, PA 15213.
Dr. Goto’s present address: Department of Otolaryngology, Naval Medical Center–San Diego, 34800 Bob Wilson Drive, San Diego, CA 92134-5000.
REFERENCES
- 1.Azzi A, Boscoboinik D, Hensey C. The protein kinase C family. Eur J Biochem. 1992;208:547–557. doi: 10.1111/j.1432-1033.1992.tb17219.x. [DOI] [PubMed] [Google Scholar]
- 2.Balaban CD. Olivovestibular and cerebellovestibular connections in albino rabbits. Neuroscience. 1984;12:129–149. doi: 10.1016/0306-4522(84)90143-x. [DOI] [PubMed] [Google Scholar]
- 3.Balaban CD. Distribution of inferior olivary projections to the vestibular nuclei of albino rabbits. Neuroscience. 1988;24:119–134. doi: 10.1016/0306-4522(88)90317-x. [DOI] [PubMed] [Google Scholar]
- 4.Balaban CD, Henry RT. Zonal organization of olivo-nodulus projections in albino rabbits. Neurosci Res. 1988;5:409–423. doi: 10.1016/0168-0102(88)90026-0. [DOI] [PubMed] [Google Scholar]
- 5.Balaban CD, Billingsley ML, Kincaid RL. Evidence for transsynaptic regulation of calmodulin-dependent cyclic nucleotide phosphodiesterase in cerebellar Purkinje cells. J Neurosci. 1989;9:2374–2381. doi: 10.1523/JNEUROSCI.09-07-02374.1989. [DOI] [PMC free article] [PubMed] [Google Scholar]
- 6.Barmack NH, Fagerson M, Fredette BJ, Mugnaini E, Shojaku H. Activity of neurons in the beta nucleus of the inferior olive of the rabbit evoked by natural vestibular stimulation. Exp Brain Res. 1993a;94:203–215. doi: 10.1007/BF00230288. [DOI] [PubMed] [Google Scholar]
- 7.Barmack NH, Fagerson M, Errico P. Cholinergic projection of the dorsal cap of the inferior olive of the rat, rabbit and monkey. J Comp Neurol. 1993b;328:263–281. doi: 10.1002/cne.903280208. [DOI] [PubMed] [Google Scholar]
- 8.Bernard JF. Topographical organization of olivocerebellar and corticonuclear connections in the rat: a WGA-HRP study: I. Lobules IX, X, and the flocculus. J Comp Neurol. 1987;263:241–258. doi: 10.1002/cne.902630207. [DOI] [PubMed] [Google Scholar]
- 9.Boxall AR, Lancaster B, Garthwaite J. Tyrosine kinase is required for long-term depression in the cerebellum. Neuron. 1966;16:805–813. doi: 10.1016/s0896-6273(00)80100-2. [DOI] [PubMed] [Google Scholar]
- 10.Brodal A, Kawamura K. Olivocerebellar projection: a review. Springer; Berlin: 1980. [PubMed] [Google Scholar]
- 11.Calza L, Giardino L, Zanni M, Galetti G. Muscarinic and gamma-aminobutyric acid-ergic receptor changes during vestibular compensation: a quantitative autoradiographic study of the vestibular nuclei complex in the rat. Eur Arch Otorhinolaryngol. 1992;249:34–39. doi: 10.1007/BF00175668. [DOI] [PubMed] [Google Scholar]
- 12.Chen C, Kano M, Abeliovitch A, Chen L, Bao S, Kim JJ, Hashimoto K, Thompson RF, Tonegawa S. Impaired motor coordination correlates with presistent multiple climbing fiber innervation in PKCγ mutant mice. Cell. 1995;83:1233–1242. doi: 10.1016/0092-8674(95)90148-5. [DOI] [PubMed] [Google Scholar]
- 13.Chen S, Hillman DE. Compartmentalization of the cerebellar cortex by protein kinase C delta. Neuroscience. 1993;56:177–188. doi: 10.1016/0306-4522(93)90572-w. [DOI] [PubMed] [Google Scholar]
- 14.Cirelli C, Pompeiano M, D’Ascanio P, Pompeiano O. Early C-fos expression in the rat vestibular and olivocerebellar systems after unilateral labyrinthectomy. Arch Ital Biol. 1993;131:71–74. [PubMed] [Google Scholar]
- 15.Courjon JH, Flandrin JM, Jeannerod M, Schmid R. The role of the flocculus in vestibular compensation after hemilabyrinthectomy. Brain Res. 1982;239:251–257. doi: 10.1016/0006-8993(82)90847-2. [DOI] [PubMed] [Google Scholar]
- 16.Crepel F, Krupa M. Activation of protein kinase C induces a long-term depression of glutamate sensitivity of cerebellar Purkinje cells: an in vitro study. Brain Res. 1988;458:397–401. doi: 10.1016/0006-8993(88)90486-6. [DOI] [PubMed] [Google Scholar]
- 17.Darlington CL, Smith PF. The effects of N-methyl-d-aspartate antagonists on the development of vestibular compensation in the guinea pig. Eur J Pharmacol. 1989;174:273–278. doi: 10.1016/0014-2999(89)90320-8. [DOI] [PubMed] [Google Scholar]
- 18.Darlington CL, Smith PF. Pre-treatment with a Ca2+ channel antagonist facilitates vestibular compensation. NeuroReport. 1992;3:143–145. doi: 10.1097/00001756-199202000-00005. [DOI] [PubMed] [Google Scholar]
- 19.Darlington CL, Flohr H, Smith PF. Molecular mechanisms of brainstem plasticity: the vestibular compensation model. Mol Neurobiol. 1991;5:355–368. doi: 10.1007/BF02935558. [DOI] [PubMed] [Google Scholar]
- 20.Igarashi M, Ishikawa K. Post-labyrinthectomy balance compensation with preplacement of cerebellar vermis lesion. Acta Otolaryngol (Stockh) 1985;99:452–458. doi: 10.3109/00016488509108937. [DOI] [PubMed] [Google Scholar]
- 21.Igarashi M, Thompson GC, Thompson AM, Usami S. Neurochemical and neuropharmacological studies on vestibular compensation/adaptation. In: Hwang JC, Daunton NG, Wilson VJ, editors. Basic and applied aspects of vestibular function. Hong Kong UP; Hong Kong: 1988. pp. 89–97. [Google Scholar]
- 22.Ishikawa K, Igarashi M. Effect of atropine and carbachol on vestibular compensation in squirrel monkeys. Am J Otolaryngol. 1985;6:290–296. doi: 10.1016/s0196-0709(85)80057-0. [DOI] [PubMed] [Google Scholar]
- 23.Ito M. The cerebellum and neural control. Raven; New York: 1984. [Google Scholar]
- 24.Jeannerod M, Courjon JH, Flandrin JM, Schmid R. Supravestibular control of vestibular compensation after hemilabyrinthectomy in the cat. In: Flohr H, Precht W, editors. Lesion-induced neuronal plasticity in sensorimotor systems. Springer; New York: 1981. pp. 208–220. [Google Scholar]
- 25.Katayama S, Nisimaru N. Parasagittal zonal pattern of olivonodular projections in rabbit cerebellum. Neurosci Res. 1988;5:424–438. doi: 10.1016/0168-0102(88)90027-2. [DOI] [PubMed] [Google Scholar]
- 26.Kaufman GD, Anderson JH, Beitz AJ. Brainstem fos expression following acute unilateral labyrinthectomy in the rat. NeuroReport. 1992;3:829–832. doi: 10.1097/00001756-199210000-00002. [DOI] [PubMed] [Google Scholar]
- 27.Kitahara T, Takeda N, Saika T, Kubo T, Kiyama H. Effects of MK801 on Fos expression in the rat brain after unilateral labyrinthectomy. Brain Res. 1995;700:182–190. doi: 10.1016/0006-8993(95)00950-u. [DOI] [PubMed] [Google Scholar]
- 28.Leonard CS, Simpson JI, Graf W. Spatial organization of visual messages of the rabbit’s cerebellar flocculus. I. Typology of inferior olivary neurons of the dorsal cap of Kooy. J Neurophysiol. 1988;60:2073–2090. doi: 10.1152/jn.1988.60.6.2073. [DOI] [PubMed] [Google Scholar]
- 29.Linden DJ, Connor JA. Long-term synaptic depression. Annu Rev Neurosci. 1995;18:319–357. doi: 10.1146/annurev.ne.18.030195.001535. [DOI] [PubMed] [Google Scholar]
- 30.Llinas R, Walton K. Vestibular compensation: a distributed property of the central nervous system. In: Asanuma H, Wilson VF, editors. Integration in the nervous system. Igaku-Shoin; Tokyo: 1979. pp. 145–166. [Google Scholar]
- 31.Luyten WHML, Sharp FR, Ryan AF. Regional differences of brain glucose metabolic compensation after unilateral labyrinthectomy in rats: a [14C]2-deoxyglucose study. Brain Res. 1986;373:68–80. doi: 10.1016/0006-8993(86)90316-1. [DOI] [PubMed] [Google Scholar]
- 32.McLean IW, Nakane PK. Periodate-lysine-paraformaldehyde fixative for immunoelectron microscopy. J Histochem Cytochem. 1974;22:1077–1083. doi: 10.1177/22.12.1077. [DOI] [PubMed] [Google Scholar]
- 33.Ogita K, Miyamoto SI, Yamaguchi K, Koide H, Fujisawa N, Kikkawa U, Sahara S, Fukami Y, Nishizuka Y. Isolation and characterization of δ-subspecies of protein kinase C from rat brain. Proc Natl Acad Sci USA. 1992;89:1592–1596. doi: 10.1073/pnas.89.5.1592. [DOI] [PMC free article] [PubMed] [Google Scholar]
- 34.Ono Y, Fujii T, Ogita K, Kikkawa U, Igarashi K, Nishizuka Y. The structure, expression, and properties of additional members of the protein kinase C family. J Biol Chem. 1988;263:6927–6932. [PubMed] [Google Scholar]
- 35.Patrickson JW, Bryant JH, Kaderkaro M, Kutyna FA. A quantitative [14C]-2-deoxy-d-glucose study of brain stem nuclei during horizontal nystagmus induced by lesioning the lateral crista ampullaris of the rat. Exp Brain Res. 1985;60:227–234. doi: 10.1007/BF00235917. [DOI] [PubMed] [Google Scholar]
- 36.Precht W, Shimazu H, Markham CH. A mechanism of central compensation of vestibular function following hemilabyrinthectomy. J Neurophysiol. 1966;29:996–1010. doi: 10.1152/jn.1966.29.6.996. [DOI] [PubMed] [Google Scholar]
- 37.Ruigrok TJH, Osse R-J, Voogd J. Organization of inferior olivary projections to the flocculus and ventral paraflocculus of the rat cerebellum. J Comp Neurol. 1992;316:129–150. doi: 10.1002/cne.903160202. [DOI] [PubMed] [Google Scholar]
- 38.Saika T, Takeda N, Kiyama H, Kubo T, Tohyama M, Matsunaga T. Changes in preproenkephalin mRNA after unilateral and bilateral labyrinthectomy in the rat medial vestibular nucleus. Mol Brain Res. 1993;19:237–240. doi: 10.1016/0169-328x(93)90034-m. [DOI] [PubMed] [Google Scholar]
- 39.Shojaku H, Sato Y, Ikarashi K, Kawasaki T. Topographical distribution of Purkinje cells in the uvula and the nodulus projecting to the vestibular nuclei in cats. Brain Res. 1987;416:100–112. doi: 10.1016/0006-8993(87)91501-0. [DOI] [PubMed] [Google Scholar]
- 40.Smith PF, Curthoys IS. Mechanisms of recovery following unilateral labyrinthectomy: a review. Brain Res Rev. 1989;14:155–180. doi: 10.1016/0165-0173(89)90013-1. [DOI] [PubMed] [Google Scholar]
- 41.Smith PF, deWaele C, Vidal PP, Darlington CL. Excitatory amino acid receptors in normal and abnormal vestibular function. Mol Neurobiol. 1991;5:369–387. doi: 10.1007/BF02935559. [DOI] [PubMed] [Google Scholar]
- 42.Tan J, Gerrits NM, Nanhoe R, Simpson JI, Voogd J. Zonal organization of the climbing fiber projection to the flocculus and nodulus of the rabbit: a combined axonal tracing and acetylcholinesterase histochemical study. J Comp Neurol. 1995;356:23–50. doi: 10.1002/cne.903560103. [DOI] [PubMed] [Google Scholar]
- 43.Winer BJ. Statistical principles in experimental design. McGraw-Hill; New York: 1971. [Google Scholar]


